R ES E A RC H ◥
AGING
The DNA damage response induces inflammation and senescence by inhibiting autophagy of GATA4 Chanhee Kang, Qikai Xu, Timothy D. Martin, Mamie Z. Li, Marco Demaria, Liviu Aron, Tao Lu, Bruce A. Yankner, Judith Campisi, Stephen J. Elledge*
INTRODUCTION: Cellular senescence is a pro-
gram of arrested proliferation and altered gene expression triggered by many stresses. Although it is a potent tumor-suppressive mechanism, senescence has been implicated in several pathological processes including aging, age-associated diseases, and (counterintuitively) tumorigenesis. One potential mechanism through which senescent cells exert such pleiotropic effects is the secretion of proinflammatory cytokines, chemokines, growth factors, and proteases, termed the senescenceassociated secretory phenotype (SASP), which affects senescent cells and their microenvironment. The mechanism by which the SASP is initiated and maintained is not well characterized beyond the classical regulators of inflammation, including the transcription factors NF-kB and C/EBPb. RATIONALE: In senescence growth arrest, two core senescence-regulating pathways, p53
and p16INK4a/Rb, play a critical role. By contrast, the SASP does not depend on either p53 or p16INK4a, which suggests the existence of an independent senescence regulatory network that controls the SASP. Having observed high levels of induction of microRNA miR-146a during induced senescence in human fibroblasts, we developed a green fluorescent protein–tagged senescence reporter based on a miR-146a promoter fragment. This reporter responded to senescence-inducing stimuli, including replicative exhaustion, DNA damage, and oncogenic RAS activation—all of which activate the SASP. This system allowed us to identify additional regulators of senescence and the SASP. RESULTS: Through miR-146a promoter analysis, we mapped the critical region for senescenceinduced activity and identified the transcriptional regulator responsible for this regulation, GATA4, previously known as a regulator of embryonic
development. Ectopic expression of GATA4 induced senescence, whereas disruption of GATA4 suppressed it, thus establishing GATA4 as a senescence regulator. GATA4 protein abundance, but not mRNA, increased during senescence, primarily as a result of increased protein stability. Under normal conditions, GATA4 binds the p62 autophagy adaptor and is degraded by selective autophagy. Upon senescence induction, however, this ON OUR WEB SITE selective autophagy was suppressed through deRead the full article creased interaction beat http://dx.doi. org/10.1126/ tween GATA4 and p62, science.aaa5612 thereby stabilizing GATA4. .................................................. GATA4 in turn induced TRAF3IP2 (tumor necrosis factor receptor– associated factor interacting protein 2) and IL1A (interleukin 1A), which activate NF-kB to initiate and maintain the SASP, thus facilitating senescence. GATA4 pathway activation depends on the key DNA damage response (DDR) kinases ATM (ataxia telangiectasia mutated) and ATR (ataxia telangiectasia and Rad3–related), as does senescence-associated activation of p53 and p16INK4a. However, the GATA4 pathway is independent of p53 and p16INK4a. Finally, GATA4 protein accumulated in multiple tissues in mice treated with senescence-inducing stimuli and during normal mouse and human aging, including many cell types in the brain; these findings raise the possibility that the GATA4 pathway drives age-dependent inflammation. ◥
CONCLUSION: Our results indicate that
GATA4 connects autophagy and the DDR to senescence and inflammation through TRAF3IP2 and IL1A activation of NF-kB. These findings establish GATA4 as a key switch activated by the DDR to regulate senescence, independently of p53 and p16INK4a. Our in vivo data indicate a potential role of GATA4 during aging and its associated inflammation. Because accumulation of senescent cells is thought to promote aging and aging-associated diseases through the resulting inflammatory response, inhibiting the GATA4 pathway may provide an avenue for therapeutic intervention.
▪
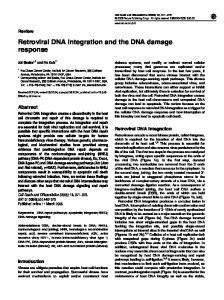
GATA4 functions as a key switch in the senescence regulatory network to activate the SASP. The nonsenescent state is maintained by inhibitory barriers that prevent cell cycle arrest and inflammation. Upon senescence-inducing signals, ATM and ATR relieve inhibition of the p53 and p16INK4a pathways to induce growth arrest and also block p62-dependent autophagic degradation of GATA4, resulting in NF-kB activation and SASP induction. SCIENCE sciencemag.org
The list of author affiliations is available in the full article online. *Corresponding author. E-mail: sellege@ genetics.med.harvard.edu Cite this article as C. Kang et al., Science 349, aaa5612 (2015). DOI: 10.1126/science.aaa5612
25 SEPTEMBER 2015 • VOL 349 ISSUE 6255
1503
Downloaded from www.sciencemag.org on October 13, 2015
RESEARCH ARTICLE SUMMARY
R ES E A RC H
RESEARCH ARTICLE
◥
pathway (27–30)—has been implicated in establishing the SASP through the target of rapamycin (TOR) autophagy spatial coupling compartment (TASCC). The TASCC may facilitate the synthesis of secretory proteins (31, 32) by coupling autolysosome-derived amino acids with mechanistic TOR (mTOR) activation to stimulate protein synthesis. However, other findings indicate that autophagy inhibition promotes senescence in some contexts (33). Thus, the relationship between autophagy and senescence is unclear.
AGING
The DNA damage response induces inflammation and senescence by inhibiting autophagy of GATA4
GATA4, a novel senescence regulator
Chanhee Kang,1 Qikai Xu,1 Timothy D. Martin,1 Mamie Z. Li,1 Marco Demaria,2 Liviu Aron,3 Tao Lu,3 Bruce A. Yankner,3 Judith Campisi,2 Stephen J. Elledge1* Cellular senescence is a terminal stress-activated program controlled by the p53 and p16INK4a tumor suppressor proteins. A striking feature of senescence is the senescenceassociated secretory phenotype (SASP), a pro-inflammatory response linked to tumor promotion and aging. We have identified the transcription factor GATA4 as a senescence and SASP regulator. GATA4 is stabilized in cells undergoing senescence and is required for the SASP. Normally, GATA4 is degraded by p62-mediated selective autophagy, but this regulation is suppressed during senescence, thereby stabilizing GATA4. GATA4 in turn activates the transcription factor NF-kB to initiate the SASP and facilitate senescence. GATA4 activation depends on the DNA damage response regulators ATM and ATR, but not on p53 or p16INK4a. GATA4 accumulates in multiple tissues, including the aging brain, and could contribute to aging and its associated inflammation.
C
ellular senescence is a program triggered by stresses that prevent abnormal cells from further proliferation. Multiple distinct stimuli associated with aging—including short telomeres caused by recurrent proliferation, DNA damage, and expression of activated oncogenes—cause mammalian cells to enter into an essentially irreversible growth arrest and acquire the morphological and behavioral features of senescent cells. Cellular senescence decreases the regenerative capacity of cells and tissues and is thought to contribute to the aging process (1–6). Elimination of senescent cells reduces certain aging-associated phenotypes in a mouse model of accelerated aging. However, knowledge about the regulatory network that receives senescence signals and initiates the senescence response is still lacking. In addition to their well-studied growth arrest, senescent cells display extensive changes in gene expression, including the expression and secretion of many proinflammatory cytokines, chemokines, growth factors, and proteases; collectively these features are termed the senescence-associated secretory phenotype (SASP) (2, 7–10). Depending on the physiological context, SASP factors can either reinforce senescence growth arrest in an autocrine manner or relay the senescence phenotype to surrounding cells in a paracrine man-
1
Department of Genetics, Harvard Medical School, Division of Genetics, Brigham and Women’s Hospital, Howard Hughes Medical Institute, Boston, MA 02115, USA. 2Buck Institute for Research on Aging, Novato, CA 94945, USA. 3Department of Genetics, Harvard Medical School, Boston, MA 02115, USA.
*Corresponding author. E-mail:
[email protected]. harvard.edu
SCIENCE sciencemag.org
ner (11–13). Senescent cells can also stimulate adjacent premalignant and malignant cells to proliferate and form tumors (14). On the other hand, these secreted factors can stimulate the immune system to both suppress tumorigenesis and promote optimal repair of damaged tissues when senescent cells are removed after their beneficial actions (15–17). Lastly, factors secreted by senescent cells may directly or indirectly promote chronic inflammation that is thought to be a major factor in many, if not all, age-related diseases (2, 9, 10). Despite the wide range of biological activities attributed to the SASP, little is known about how it is regulated beyond the activation of NF-kB and the classical regulators of inflammation associated with NF-kB activity, such as CCAAT/ enhancer-binding protein b (C/EBPb), interleukin1a (IL-1a), and p38 mitogen-activated protein kinase (p38 MAPK) (2, 18–20). How the NF-kB inflammatory response becomes activated under senescence-inducing conditions is not known. In contrast to senescence growth arrest, in which the p53 and p16INK4a/Rb tumor suppressor pathways have a crucial role (21–25), the SASP does not depend on either p53 or p16INK4a, which suggests that it is controlled by an independent branch of the senescence regulatory network (2, 10, 20, 26). In contrast to normal inflammatory responses that develop acutely, the SASP develops relatively slowly, normally taking several days after initiation of the senescence growth arrest to manifest; this would suggest a senescence-specific mechanism of activation. In addition to transcriptional regulation, macroautophagy (hereafter referred to as autophagy)—a tightly regulated major lysosomal degradation
In an effort to develop new markers for senescence, we analyzed microRNA expression in nonsenescent and senescent human fibroblasts (strain IMR-90 from fetal lung). We induced senescence by replicative exhaustion and found miR-146a to be highly expressed by senescent but not nonsenescent cells (fig. S1A), a result also reported for human foreskin fibroblasts (HCA2) (34). Given its abundant expression, we suspected that miR-146a regulation occurs primarily at the level of transcription. We therefore generated a 1.5-kb miR-146a promoter fragment fused to green fluorescent protein (PmiR-146a-GFP). Expression of this reporter construct was significantly increased in response to several senescenceinducing stimuli, including replicative exhaustion, ionizing radiation (IR; 12 Gy), and expression of oncogenic RAS (fig. S1B). Using the Evolutionarily Conserved Regions browser (35), we found that the miR-146a promoter contains two evolutionarily conserved regions, ECR1 and ECR2. ECR2 was critical for reporter activity (fig. S1C). Because ECR2 has a putative NF-kB binding site and NF-kB is known to regulate miR-146a (36), we inhibited NF-kB either pharmacologically (with an inhibitor of IkB kinase, Bay11-7082) or genetically [with short interfering RNAs (siRNAs) targeting the NF-kB family member RELA (p65)] in fully senescent SASP-expressing cells. NF-kB inhibition only partially decreased reporter activity in senescent cells (fig. S1D). These results indicate that other transcription factors also contribute to senescencedependent activation of the miR-146a reporter. To identify additional transcription factors responsible for the reporter activity, we searched for ones that were predicted to bind to ECR2 (see Materials and Methods). We individually overexpressed each candidate and examined reporter activity. Of 13 transcription factors selected, only GATA4, but not other GATA family members, activated the reporter (Fig. 1A and fig. S2, A and B). Depletion of GATA4 with siRNAs showed that it was required for reporter activation during senescence (Fig. 1B). Chromatin immunoprecipitation combined with quantitative polymerase chain reaction (ChIP-qPCR) revealed that exogenously expressed GATA4 bound directly the miR-146a ECR2 region (fig. S2C). These results indicate that GATA4 contributes to activation of the miR-146a promoter in senescent cells. GATA4 is a zinc finger transcription factor essential for the development of various organs, including heart, testis, foregut, liver, and ventral pancreas (37). To examine whether GATA4
25 SEPTEMBER 2015 • VOL 349 ISSUE 6255
aaa5612-1
R ES E A RC H | R E S EA R C H A R T I C LE
functions in senescence, we examined the effects of ectopic expression or depletion during the senescence response of human diploid fibroblasts. Ectopic expression of GATA4 induced senescence in human foreskin fibroblasts (strain BJ; Fig. 1C) and IMR-90 fibroblasts (fig. S3, A and B), as shown by increased senescence-associated b-galactosidase (SA-b-Gal) activity and decreased 5-bromo-2′-deoxyuridine (BrdU) incorporation. More important, depletion of GATA4 with stably expressed short hairpin RNAs (shRNAs) partially decreased IR-induced SA-b-Gal activity (Fig. 1D and fig. S3C) and delayed replicative senescence
(Fig. 1E). We confirmed these results by CRISPR mutation of GATA4 (fig. S3D). These data indicate that GATA4 is a positive regulator of senescence. Consistent with a regulatory role in senescence, GATA4 is frequently silenced in lung, colon, prostate, ovarian, and breast cancer (38, 39). Selective autophagy suppresses GATA4 and senescence While examining the efficiency of GATA4 siRNAs (Fig. 1B), we noticed that the amount of GATA4 increased in senescent cells. Indeed, abundance of the GATA4 protein, but not mRNA, increased
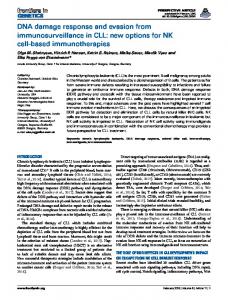
Fig. 1. GATA4 regulates cellular senescence. (A) Left: IMR90 cells expressing the miR-146a GFP reporter were infected with either vector control or GATA4-expressing viruses, and GFP fluorescence was measured by fluorescenceactivated cell sorter (FACS) (AFU, arbitrary fluorescence units). Data are shown as percentage of maximum expression (i.e., the number of cells in each bin divided by the number of cells in the bin that contains the largest number of cells) for normalization. Right: Median fluorescence intensity (MFI) was computed and normalized to vector control. Data are mean T SEM. (B) Left: IMR90 cells expressing the miR-146a GFP reporter and transfected with the indicated siRNAs were exposed to IR (12 Gy), and GFP fluorescence was measured by FACS; cont denotes the firefly luciferase siRNA control. Center: MFI was computed and normalized to control siRNA (–IR); data are mean T SEM. Right: Immunoblotting analysis shows the efficiency of GATA4 depletion.
aaa5612-2
25 SEPTEMBER 2015 • VOL 349 ISSUE 6255
during IR- and oncogene-induced senescence and replicative senescence (Fig. 2A). This increase was primarily due to increased protein stability, as indicated by the measurement of protein stability in the presence of cycloheximide (Fig. 2B) and by global protein stability profiling (40) (fig. S4A). Two major pathways in eukaryotic cells mediate protein degradation: the ubiquitin-proteasome and autophagy-lysosome pathways. Inhibition of the proteasome by MG-132, a proteasome inhibitor, had no effect on GATA4 abundance, whereas GATA4 protein was stabilized in cells treated with distinct lysosomal inhibitors known to block
(C) BJ cells carrying either a Dox-inducible (Tet-On) vector expressing GATA4 (Tet-GATA4) or an empty vector (Tet-Vector) were grown with or without Dox, and SA-b-Gal staining (left) and BrdU incorporation (right) were analyzed. Data are mean T SEM. (D) BJ cells carrying either a vector expressing a control shRNA targeting firefly luciferase or a GATA4 shRNA were exposed to IR (8 Gy), and 7 days later immunoblotting analysis (left) and SA-b-Gal staining (right) were performed. Data are mean T SEM; one-way analysis of variance (ANOVA) was used for the statistical analysis. (E) Replicative senescence was assessed by cell growth analysis of BJ cells expressing either control or GATA4 shRNAs. Left: Population doubling analysis Right: Quantification of SA-b-Gal staining. Data are mean T SEM; one-way ANOVA was used for the statistical analysis. Data are representative of four (A) or three [(B) to (E)] independent experiments.
sciencemag.org SCIENCE
RE S E ARCH | R E S E A R C H A R T I C L E
autophagy: bafilomycin A1 (a selective inhibitor of the vacuolar-type H+–adenosine triphosphatase) or E64d and pepstatin (lysosomal protease inhibitors) (Fig. 2, C and D). These findings suggest the autophagy-lysosome pathway, not the ubiquitinproteasome pathway, regulates GATA4. Consistent with this interpretation, depletion of the autophagy components ATG5 or ATG7 also increased the abundance of GATA4 protein (Fig. 2E). Autophagy can selectively degrade certain substrates, mediated by specific autophagic adaptors (41–43). Indeed, depletion of the autophagic adaptor p62 increased the abundance of GATA4 protein (Fig. 2F). Exogenously expressed and endogenous GATA4 physically interacted with p62, and the interaction was reduced during senescence (Fig. 2G and fig. S4B). Thus, GATA4 appears to be targeted for autophagic degradation through its association with p62 under normal conditions but becomes stabilized during senescence, possibly through reduced association with p62. The relationship between senescence and autophagy is unclear. Autophagy is reported to be required for the establishment of senescence (31, 32, 44) or to inhibit senescence (33). Our results can reconcile these conflicting reports. Selective autophagy might prevent senescence by suppressing positive senescence regulators such as GATA4. However, senescence-inducing stimuli cause GATA4 to escape selective autophagy. Subsequently, general autophagy may be activated, which then contributes to establishment of senescence. Hence, selective autophagy for GATA4 may be a negative senescence regulator, whereas general autophagy is a positive regulator of senescence. If so, transiently inhibiting autophagy should induce senescence. To test this, we used doxycycline (Dox)–inducible shRNAs to deplete ATG5 or ATG7 and transiently inhibit autophagy (45), allowing GATA4 to accumulate, and then restored autophagy by removing Dox, returning the cell to a senescencepermissive state. Transient inhibition of autophagy (GATA4 abundance high, autophagy on) induced senescence more effectively than did continuous inhibition (GATA4 abundance high, autophagy off); this effect, at least in part, depended on GATA4 (Fig. 2, H and I, and fig. S4C). Continuous and transient inhibition of autophagy increased GATA4 abundance to similar extents, but continuous inhibition failed to induce senescence (Fig. 2I). Consistent with this finding, p62 depletion induced senescence even more effectively than did depletion of the core autophagy regulators ATG7 or ATG5 under normal conditions (fig. S4D). Thus, selective autophagy for GATA4 appears to function as an antisenescence mechanism, whereas general autophagy functions as a pro-senescence mechanism. GATA4 regulates the SASP To investigate the mechanisms through which GATA4 regulates senescence, we explored how GATA4 influences gene expression in human fibroblasts. Because GATA4 induces senescence when ectopically expressed, we performed transcriptional profiling with RNA sequencing (RNA-seq) SCIENCE sciencemag.org
before and after GATA4 expression using a Doxinducible GATA4 vector. We used Gene Ontology (GO) analysis to systematically characterize the cellular processes affected by GATA4 (46). Genes showing increased expression in response to GATA4 showed significant enrichment for the terms “immune response,” “inflammatory response,” and “response to wounding,” whereas genes with decreased expression were mostly enriched for biological processes related to the cell cycle, which correlated well with terms previously linked to senescence (Fig. 3A and table S1). We compared the GATA4-regulated gene set (GATA4-regulated set) with a gene set differentially regulated during replicative senescence (Senescent set). Both up-regulated and down-regulated genes overlapped significantly, with greater statistical significance for the up-regulated genes (P = 2.46 × 10−40), consistent with the fact that GATA4 acts mostly as a transcriptional activator (Fig. 3B). These results suggest that GATA4 might activate a major portion of senescence-associated genes. Among the GATA4-regulated, senescenceassociated genes, we found several SASP genes, including those encoding IL6, IL8, C-X-C motif ligand 1 (CXCL1), granulocyte-macrophage colonystimulating factor (GM-CSF), and extracellular matrix (ECM) proteases and inhibitors (7). Because inflammatory and immune-modulatory cytokines and chemokines secreted by senescent cells can reinforce senescence arrest and alter the microenvironment (1, 2, 10), GATA4 might indirectly regulate other senescent phenotypes, notably growth arrest, through the SASP. We confirmed that ectopic expression of GATA4 induces the expression of genes associated with the SASP by reverse transcription qPCR (RT-qPCR) (Fig. 3C). More important, depletion of GATA4 suppressed the expression of several SASP genes during the establishment of senescence (Fig. 3D), indicating that GATA4 indeed controls many SASP genes. Ectopic expression of GATA3—another GATA family member predicted to be a strong tumor suppressor (47, 48)—did not increase expression of genes associated with the SASP. Likewise, ectopic expression of GATA3 did not increase expression of TRAF3IP2 [tumor necrosis factor receptor– associated factor (TRAF) interacting protein 2], a key GATA4 downstream target (see below), although it is functionally active, as shown by its ability to activate its well-known target IL13 (fig. S5A). These results support a specific role for GATA4 in SASP regulation. However, we cannot rule out the possibility that other GATA factors including GATA3 may have a similar role in other cell types. GATA4 regulates NF-kB NF-kB has a crucial role in controlling the SASP (18, 19, 49) (Fig. 3D), yet little is known about how NF-kB is activated during senescence. To examine the relationship between GATA4 and NF-kB in regulating the SASP, we tested how suppression of the essential NF-kB component RELA affected the GATA4-induced SASP. RELA depletion inhibited the expression of genes associated with the SASP in response to GATA4 (Fig. 4A). GATA4 expression triggered NF-kB
activation, and GATA4 depletion inhibited NF-kB activation during senescence (Fig. 4B); these findings suggest that GATA4 acts upstream of NF-kB in regulating the SASP. To understand how GATA4 activates NF-kB, we searched promoters bound by GATA4 in genomewide ChIP experiments (50) to find associated genes that function as NF-kB activators, and examined their regulation by GATA4. GATA4 induced the expression of TRAF3IP2, an E3 ubiquitin ligase for TRAF6 (51) (Fig. 4C), and TRAF3IP2 depletion partially blocked GATA4 activation of NF-kB, as assessed by the expression of SASP genes (Fig. 4D). Furthermore, ectopic expression of TRAF3IP2 partially rescued the reduced SASP caused by GATA4 depletion in IR-induced senescent cells (Fig. 4E). Note that certain SASP factors, such as IL6 and CXCL3, were resistant to TRAF3IP2 depletion; this result suggests that GATA4 regulates them in a TRAF3IP2-independent manner, either directly or indirectly through its other downstream targets. RELA depletion almost completely blocked the activation of SASP genes by GATA4, with the exception of IL1A (Fig. 4A). IL1A, a SASP component, is thought to form a feedforward activation loop with NF-kB in SASP regulation (13, 52). Thus, IL1A might cooperate with TRAF3IP2 during GATA4-dependent production of the SASP. Consistent with this idea, depletion of IL1A reduced GATA4 activation of NF-kB, as assessed by the expression of SASP genes (fig. S5B). Furthermore, activation of SASP-associated genes was transmitted to cells lacking GATA4 induction by conditioned medium from GATA4-induced cells (fig. S5C). Thus, GATA4 appears to act, at least in part, through TRAF3IP2 and IL1A to activate NF-kB in activating the SASP. TRAF3IP2 depletion also partially blocked GATA4-induced senescence, as determined from SA-b-Gal activity (Fig. 4F). Unlike GATA4 expression, however, TRAF3IP2 expression alone was not sufficient to induce SA-b-Gal activity (fig. S6A), despite activating expression of a number of SASPassociated genes (fig. S6C). Moreover, ectopic expression of TRAF3IP2 together with IL1A was still not sufficient to induce SA-b-Gal activity, in contrast to that of GATA4 (fig. S6B). Thus, the SASP may not be the only mechanism through which GATA4 regulates senescence. Indeed, previously identified regulators of senescence, such as promyelocytic leukemia protein (PML) and yippeelike 3 (YPEL3), are among GATA4-induced genes (fig. S6D) (53). GATA4, a new branch of the senescence regulatory pathway To more completely understand how GATA4 regulates senescence responses, we examined the effects of two core senescence-regulating pathways, the p53 and p16INK4a pathways. The effects of GATA4 on senescence (SA-b-Gal activity) were independent of p53 and the p16INK4a/Rb pathway, as shown in cells depleted of p53 or p53 and Rb by shRNAs or expression of HPV E6 and E7 proteins (Fig. 5, A and B). Conversely, GATA4 activation in response to a senescence-inducing dose of IR remained intact in cells deficient in p53 or p53 and Rb
25 SEPTEMBER 2015 • VOL 349 ISSUE 6255
aaa5612-3
R ES E A RC H | R E S EA R C H A R T I C LE
(Fig. 5C). Further, neither p53 activation by nutlin nor p16INK4a activation by Dox-induced expression was sufficient to activate GATA4 (Fig. 5D). Thus,
GATA4 appears to function independently of p53 and the p16INK4a/Rb pathway in regulating senescent phenotypes, consistent with the observation
Fig. 2. Selective autophagy degrades GATA4 in a p62-dependent manner to prevent senescence. (A) Western blot showing abundance of GATA4 protein during IR-induced senescence (top), oncogene (RASV12)–induced senescence (middle left), or replicative senescence (middle right); abundance of GATA4 mRNA during IR-induced senescence is shown at the bottom. PD denotes population doubling. Relative abundance of GATA4 mRNA is expressed as change with respect to expression in cells without IR treatment. (B) GATA4 protein stability was examined in the presence of cycloheximide (CHX) in proliferating (–IR) or IR-induced senescent cells [+IR, 7 days after exposure to IR (12 Gy)]. Shown are representative immunoblots (top) and quantification from three independent experiments (bottom). Data are mean ± SEM. (C) IMR90 cells were treated with the proteasomal inhibitor MG-132 for the indicated times, and proteins were analyzed by Western blotting. p21 served as a positive control for MG-132. (D) IMR90 cells were treated with the indicated autophagy inhibitory agents for the indicated times, and proteins were analyzed by immunoblotting with the indicated antibodies. Shown are representative immunoblots (left) and quantification from four independent experiments (right, 24 hours
aaa5612-4
25 SEPTEMBER 2015 • VOL 349 ISSUE 6255
that the SASP is p53- and p16INK4a-independent (2, 10, 20, 26). Even in nutlin-treated cells, in which GATA4 was not initially activated, IR activated
of treatment). Data are mean ± SEM; one-way ANOVA was used for the statistical analysis. (E and F) IMR90 cells were transfected with the indicated siRNAs, and proteins were analyzed by Western blotting 79 hours after transfection; cont denotes firefly luciferase siRNA. (G) Immunoblotting of Flag-GATA4 immunoprecipitates from proliferating (–IR) or IR-induced senescent IMR90 cells [+IR, 7 days after exposure to IR (12 Gy)]. Six days after IR, cells were treated with either dimethyl sulfoxide (DMSO) or Baf A1 for 24 hours before sampling to block GATA4 and p62 degradation. (H) IMR90 cells expressing the indicated Dox-inducible shRNAs were treated with Dox, and SA-b-Gal staining was performed (–Dox, 16 days off Dox; +Dox, 16 days on Dox; wash, 12 days on Dox then 4 days off Dox); cont denotes the control shRNA targeting firefly luciferase. (I) IMR90 cells carrying a Dox-inducible vector expressing an ATG7 shRNA and either control shRNA or GATA4 shRNA were treated with Dox, and immunoblotting analysis (top), SAb-Gal staining (middle), and BrdU incorporation (bottom) were performed. Labels are as in (H); data are mean T SEM. Two-way ANOVA was used for the statistical analysis. Data are representative of three [(A), (B), (E)], four (D), or two [(C), (F), (G), (H), (I)] independent experiments.
sciencemag.org SCIENCE
RE S E ARCH | R E S E A R C H A R T I C L E
GATA4 and NF-kB (Fig. 5E), which suggests that the DNA damage response (DDR) acts upstream of this pathway (1, 2, 20, 54, 55). Indeed, inhibition of the DDR regulators ATM (ataxia telangiectasia mutated) and ATR (ataxia telangiectasia and Rad3–related) suppressed activation of the GATA4 pathway during senescence (Fig. 5F). Thus, the GATA4 pathway that induced the SASP appears to be an independent branch of the DDR. How the DDR inhibits the basal autophagymediated degradation of GATA4 remains a key question for future experimentation. GATA4’s role in senescence in vivo To test whether GATA4 activity and regulation is conserved and occurs in vivo, we examined Gata4 in mouse embryonic fibroblasts induced to senesce by IR under conditions of physiological O2 (56, 57) (Fig. 6A). The abundance of Gata4 increased in response to senescence-inducing IR and was required for the induction of several Gata4 target genes, including those that encode
Traf3ip2 and the SASP factors Il6, Il1A, and Cxcl1. Thus, the GATA4 pathway that regulates senescent phenotypes is conserved in mice. To determine whether GATA4 responds to senescence induction in mice in vivo, we examined irradiated mice, which show senescent cells in multiple tissues (58). The abundance of Gata4 increased in response to senescence-inducing amounts of IR in the skin and liver (Fig. 6B). Thus, GATA4 accumulates during DNA damage– induced senescence in vivo. Senescent cells accumulate with age in mice and humans (2, 3, 5). We examined young and old mice (age 6 months and 22 months, respectively) and found increased accumulation of Gata4 in the livers and kidneys of aged mice relative to the same organs of young animals; this accumulation correlated with the amounts of p16INK4a (Fig. 6C and fig. S6, E and F). Moreover, aged but not young mouse livers showed NF-kB activation, as determined by RELA phosphorylation, consistent with our cell culture results (Fig. 6C).
Fig. 3. Gene expression profiling reveals that GATA4 controls the SASP. (A) Left: mRNA expression profiling from IMR90 cells carrying a Dox-inducible vector expressing GATA4 untreated or treated with Dox identified genes that were significantly up-regulated (green, more than 200% expression of control, Q < 0.05) or downregulated (red, less than 50% expression of control, Q < 0.05) upon GATA4 expression for 2.5 days. Right: GO term analysis of the up-regulated (green) or down-regulated (red) genes. Data are from three independent experiments. (B) Overlap between GATA4-regulated genes (GATA4-regulated set) and replicative senescence–regulated genes (Senescent set) for genes with more than 200% expression or less than 50% expression of control. The c2 test was used for statistical analysis. (C) IMR90 cells bearing a Dox-inducible vector expressing GATA4 or an empty vector control were untreated or treated with Dox for 2 days, and abundance of mRNAs for the indicated genes was quantified by RT-qPCR. Relative abundance of the indicated mRNAs is expressed as change with respect to
SCIENCE sciencemag.org
We also examined GATA4 abundance in the human brain (59). The abundance of GATA4 increased in prefrontal cortex samples from older humans, as did the abundance of p16INK4a (Fig. 6D). To corroborate these results, we examined the spatial correlation between GATA4 and p16INK4a in sections of prefrontal cortex from young and old humans by immunofluorescence microscopy (Fig. 6E). GATA4 and p16INK4a were more abundant in aged human brains than in young brains. Moreover, we found a significant spatial correlation between GATA4 and p16INK4a in oligodendrocytes, pyramidal neurons, and astrocytes from older humans, further supporting the role of GATA4 in senescence during human aging (Fig. 6E). Thus, GATA4 may contribute to cellular senescence and the resulting inflammation during mouse and human aging. Our results indicate that autophagy is both a negative and a positive regulator of senescence, resolving apparently contradictory reports in the literature (31–33, 44). Degradation of GATA4 by
expression in cells with the empty vector control without Dox treatment. (D) IMR90 cells transfected with the indicated siRNAs were exposed to IR (12 Gy) and incubated for 7 days. Abundance of mRNA was quantified as in (C). Relative abundance of the indicated mRNAs is expressed as change with respect to expression in cells transfected with control siRNA without IR treatment. Data are representative of four (C) or three (D) independent experiments. 25 SEPTEMBER 2015 • VOL 349 ISSUE 6255
aaa5612-5
R ES E A RC H | R E S EA R C H A R T I C LE
Fig. 4. GATA4 regulates NF-kB. (A) IMR90 cells were transfected with the indicated siRNAs; 2 days after transfection, cells were untreated or treated with Dox for 2 days to induce GATA4. mRNA abundance was quantified by qPCR. Relative abundance of the indicated mRNA is expressed as change with respect to expression in cells transfected with control siRNA without GATA4 induction. (B) Immunocytochemistry of nuclear NF-kB/RELA accumulation (left) or immunoblotting (center) in IMR90 cells expressing GATA4. Immunoblotting analysis (right) was performed in IMR90 cells transfected with the indicated siRNAs during IR-induced senescence. (C) IMR90 cells expressing GATA4 were treated with Dox for 2 days, and abundance of mRNA for the indicated genes was quantified by RT-qPCR. Relative abundance of the indicated mRNA is expressed as change with respect to expression in cells without Dox treatment. Inset: Immunoblotting analysis for TRAF3IP2. (D) IMR90 cells were transfected with the indicated siRNAs; 1 day later, GATA4 was induced for 2 days and the abundance of the indicated proteins (left) or mRNAs (right) was analyzed. Relative abundance of the indicated mRNA is expressed as change with respect to expression in cells transfected with control siRNA without GATA4 induction. (E) One day after exposure to IR (12 Gy), IMR90 cells were transfected with the indicated siRNAs. Three days after transfection, TRAF3IP2 driven by the TRE promoter was induced for 5 days with Dox. Cells were retransfected with the indicated siRNAs 1 day after TRAF3IP2 induction to reinforce depletion. Abundance of mRNA was analyzed using RT-qPCR, and relative abundance of the indicated mRNAs is expressed as change with respect to expression in cells transfected with control siRNA without IR and TRAF3IP2 induction; cont refers to the firefly luciferase siRNA control. (F) One day after transfection of the indicated siRNAs, GATA4 was induced for 3.5 days and cells were quantified for SA-b-Gal staining.Two-way ANOVA was used for the statistical analysis. Data are representative of three [(A), (B), (D), (F)] or two [(C), (E)] independent experiments.
aaa5612-6
25 SEPTEMBER 2015 • VOL 349 ISSUE 6255
sciencemag.org SCIENCE
RE S E ARCH | R E S E A R C H A R T I C L E
selective autophagy is relieved in cells responding to senescence-inducing signals, which contributes to growth arrest and accumulation of senescence markers. In response to IR, these senescent phenotypes depend on the DDR signaling kinases ATM and ATR, as does senescence-associated expression of p53 and p16INK4a. However, the GATA4 pathway is independent of p53 and p16INK4a, thus establishing a new branch of the DDR pathway. This role of GATA4 in regulating cellular senescence operates in part through its effect on the SASP. In doing so, GATA4 acts as an upstream regulator of NF-kB through TRAF3IP2 and IL1A to initiate and maintain NF-kB activity (Fig. 5G).
GATA4 also activates expression of miR-146a, which dampens the activation of NF-kB (17). This GATA4–miR-146a–NF-kB circuit forms an incoherent type 1 feedforward loop (60) that, after the initial burst of SASP gene expression, could limit the extent of the inflammatory response. However, it clearly does not extinguish the inflammatory response, as senescent cells maintain the SASP despite high levels of miR-146a. miR-146a could also act to prevent accidental activation of this pathway as a result of stochastic fluctuations in the abundance of GATA4 or other factors under normal conditions. Together, our results indicate that GATA4 is a key regulator of crucial senescent phenotypes,
and connects autophagy and the DDR to senescence and inflammation through IL1A and TRAF3IP2 activation of NF-kB. More important, the GATA4 pathway is completely independent of p53 and p16INK4a. Cellular senescence has been shown to have both beneficial and deleterious effects in organisms. This pathway can positively contribute to normal development and wound healing (15, 17, 61, 62). However, the accumulation of senescent cells as organisms age is thought to promote aging-related phenotypes and aging-associated diseases, including cancer and neurodegeneration, in a cell-nonautonomous manner (2, 3, 10). Thus, understanding the circuitry underlying control of senescence has important
Fig. 5. The GATA4 pathway functions independently of the p53 and p16 pathways and is regulated by the DDR kinases ATM and ATR. (A) BJ cells expressing either control or p53 shRNAs were treated with Dox for 4 days to induce GATA4 driven by the TRE promoter. Immunoblotting analysis (left) and SA-b-Gal staining (right) were performed. Data are mean T SEM; cont refers to the control shRNA targeting firefly luciferase. (B) BJ cells expressing either HPV E6 or E6 and E7 were treated with Dox for 3.5 days to induce GATA4 driven by the Tet promoter, and SA-b-Gal staining was performed. Data are mean T SEM. (C) Abundance of the GATA4 protein was examined in control (–IR) or IR-treated [+IR, 7 days after exposure to IR (12 Gy)] cells expressing either HPV E6 or E6 and E7. (D) Top: BJ and IMR90 cells were treated with 10 mM nutlin-3 for 7 days. Media were refreshed every 2 days. Bottom: p16 driven by the TRE promoter was induced for either 4 or 7 days. Media were refreshed every 2 days. Abundance of the indicated proteins was analyzed by Western blotting. (E) IMR90 cells were pretreated with 10 mM nutlin-3 for 7 days and nutlin-3 was washed out before exposure to IR (12 Gy). Abundance of the indicated protein was analyzed by Western blotting 7 days after IR. (F) IMR90 cells were pretreated with caffeine (ATM and ATR inhibitor, 1 mM) (left) or ATM inhibitor (ku55933, 10 mM), ATR inhibitor (VE-821, 10 mM), or both (right) for 1 hour before exposure to IR (12 Gy). Media were refreshed every 2 days for 7 days, and abundance of the indicated proteins was analyzed by Western blotting. Data are representative of three [(A), (E), (F)] or two [(B), (C), (D)] independent experiments. (G) Model of how GATA4 links autophagy and the DDR to SASP and cellular senescence. See text for details.
SCIENCE sciencemag.org
25 SEPTEMBER 2015 • VOL 349 ISSUE 6255
aaa5612-7
R ES E A RC H | R E S EA R C H A R T I C LE
Fig. 6. GATA4 accumulates during mouse aging, human aging, and mouse IR-induced senescence. (A) Mouse embryonic fibroblasts (MEFs) were exposed to IR (12 Gy), and Western blotting (left) and immunofluorescence (center) were performed for GATA4 protein. MEF cells expressing either control or GATA4 shRNA were exposed to IR (12 Gy); after 7 days, abundance of mRNA for the indicated genes was quantified by RT-qPCR (right). Relative abundance of the indicated mRNA is expressed as change with respect to expression in cells without IR treatment. Data are representative of two independent experiments. (B) Left: Liver and skin tissues were collected from control (–IR) and IR-treated [+IR, 3 months after total body irradiation (TBI) of 7 Gy] C57BL/6 mice and analyzed by Western blotting. Right: Densitometric analysis was performed to determine the GATA4/GAPDH ratio. Data are mean T SEM. (C) Left: Liver tissues were taken from young (6-month-old) and old (22-month-old) C57BL/6 mice and analyzed by Western blotting. Right: Densitometric analysis as in (B). Data are mean T SEM. (D) Left: Abundance of GATA4 protein in extracts of prefrontal cortex (PFC) from young and aged individuals were analyzed by Western blotting. Age in years and sex (F = female, M = male) for each sample are given. Right: Densitometric analysis as in (B). Data are mean T SEM. In (B) to (D), each lane represents an individual case. (E) Left: Confocal immunofluorescence labeling for GATA4 (red), p16 (green), GFAP (white), and DNA (DAPI, blue) in the prefrontal cortex of representative young and aged cases. Upper right: Quantitative analysis of immunofluorescence for oligodendrocytes (young, n = 8; aged, n = 8), pyramidal neurons (young, n = 8; aged, n = 8), and astrocytes (young, n = 5; aged, n = 6). AFU values are shown as mean T SEM. Lower right: Correlation analysis of abundance of GATA4 and p16 protein. Each point represents an individual cell (oligodendrocytes, n = 633; pyramidal neurons, n = 505; astrocytes, n = 411). Spearman correlation coefficient (R) and P value are shown for cells from aged individuals.
aaa5612-8
25 SEPTEMBER 2015 • VOL 349 ISSUE 6255
sciencemag.org SCIENCE
RE S E ARCH | R E S E A R C H A R T I C L E
implications for human health. Modulating the GATA4 pathway might provide an avenue for therapeutic intervention into multiple age-related pathologies. Materials and methods Cell culture, viral transduction, and senescence induction Human diploid fibroblasts (IMR90 and BJ) were obtained from the American Tissue Type Collection. Human and mouse cells were maintained in 3% O2 and cultured in Dulbecco’s modified Eagle’s medium supplemented with 15% fetal bovine serum, penicillin-streptomycin, 2 mM glutamine, and 0.1 mM nonessential amino acids (Invitrogen). Retroviral and lentiviral gene delivery was performed as described (63). Infected cells were selected using puromycin (2 mg/ml; Clontech) for 3 days, neomycin (100 mg/ml; Invitrogen) for 7 days, or blasticidin (10 mg/ml; Invitrogen) for 4 days. For co-infection, cells were sequentially selected. Senescence was induced by replicative exhaustion, ionizing radiation (12 Gy), or retrovirally delivered oncogenic RAS. Growth curves and SA-b-gal assays Population doublings were monitored using a Coulter Counter. SA-b-gal activity was determined using the Senescent Cell Staining Kit (Sigma) according to manufacturer instructions, with 4′,6-diamidino2-phenylindole (DAPI) staining to identify nuclei. BrdU incorporation assays Cells were plated on Lab-Tek II chamber slides and labeled with BrdU (100 mg/ml, BD Science) for 4 hours. Nuclei incorporating BrdU were visualized by immunofluorescence using an antibody to BrdU (BD Science) according to manufacturer instructions. Gene expression profiling For the senescent set, total RNA from proliferating (PD = 30) and senescent (PD = 70) IMR90 cells was isolated using the acidic phenol extraction method. Ribosomal RNA was depleted using the Ribo-Minus kit (Invitrogen). Ribo-depleted RNA was then fragmented, adaptor-ligated, reverse-transcribed, PCRamplified, and sequenced on an Illumina GA2 sequencer. For the GATA4-regulated set, cells expressing Tet (Dox)–inducible GATA4 were cultured with or without doxycycline (Dox; 1 mg/ml) for 2.5 days. Three independent experiments were performed, giving a total of six samples for mRNA-seq analysis. Total RNA was isolated using the RNAeasy Mini Kit (Qiagen). mRNA-seq was performed at the Harvard Medical School Biopolymer Facility. Briefly, poly(A) mRNA was isolated from total RNA and fragmented, followed by adapter ligation, cDNA synthesis, and library preparation using the Apollo 324 system (IntegenX) for Illumina sequencing. mRNAseq reads were mapped to the human genome (NCBI v36, hg18) and gene expression profiling was analyzed using SeqMonk (Babraham Bioinformatics). In silico transcription factor binding sites analysis The miR-146a promoter region (1.5 kb upstream from its transcriptional start site) was analyzed SCIENCE sciencemag.org
by the ECR browser (ecrbrowser.dcode.org) to identify potential transcription factor binding sites according to the program’s instructions. Briefly, evolutionary conserved regions between human and opossum were selected and transcription factor binding sites were analyzed by rVista 2.0 using TRANSFAC professional V10.2 library with matrix similarity predefined as 0.8. Gene Ontology (GO) analysis The Database for Annotation, Visualization and Integrated Discovery (DAVID) v6.7 was used for GO term analysis (http://david.abcc.ncifcrf.gov). Comparison of gene expression profiles To compare gene expression profiles between the GATA4-regulated set (GATA4-induced/noninduced, mRNA-seq) and Senescent set (senescent/proliferating, total RNA-seq), genes with a total count less than 10 under both conditions were discarded and gene counts were normalized by the total number of mapped reads. After normalization, only genes sequenced between the two sets were selected, followed by calculation of the relative change in log2 units between the two samples (GATA4induced versus GATA4-noninduced and senescent versus proliferating) within each set. Finally, the relative change in log2 units was compared between the GATA4-regulated and Senescent sets. Quantitative RT-qPCR Total RNA was isolated using the RNAeasy Mini Kit (Qiagen), and cDNA was synthesized using SuperScript III (Invitrogen) according to manufacturer instructions. Quantitative RT-qPCR was performed in triplicate using the Gene Expression Assay (Applied Biosystems) on an Applied Biosystems Fast 7500 machine with GAPDH as an endogenous normalization control. Primer sequences are available upon request. Antibodies Antibodies used were anti-GATA4 (Santa Cruz and Abcam), anti-p53 (Calbiochem), anti-p21 (Calbiochem), anti-p62 (BD Biosciences), anti-ATG7 (Cell Signaling), anti-ATG5 (Cell Signaling), antiLC3B (Cell Signaling), anti-GAPDH (Santa Cruz), anti-phospho p65 (Cell Signaling), anti-p65 (Santa Cruz), anti-phospho IkB (Cell Signaling), anti-IkB (Cell Signaling), anti-TRAF3IP2 (Santa Cruz), antip16 (Santa Cruz), anti-RB (BD Biosciences), and anti-FLAG-peroxidase (Sigma). Retroviral vectors and siRNAs Retroviral vectors used in this study were shRNAs targeting GATA4, ATG5, and ATG7 subcloned from the GIPZ shRNA library (Open Biosystems) into either pMSCV-PM or pInducer 10 vectors (45, 63). The shRNA targeting sequences are as follows: GATA4 shRNA1, CCAACATCTCTCAAAATAA; GATA4 shRNA2, GGAAAGAAGACGACTGCTA; mouse Gata4 shRNA, GGCCTCTATCACAAGATGA; ATG5 shRNA1, TGAAAGAAGCTGATGCTTT; ATG5 shRNA2, TGGAATATCCTGCAGAAGA; ATG5 shRNA3, CCCATCTTTCCTTAACGAA; ATG7 shRNA1, AGCATCATCTTCGAAGTGA; ATG7 shRNA2, AAGAGAAAGCTGGT-
CATCA; p53 shRNA, AATGTCAGTCTGAGTCAGGCCC; firefly luciferase (used as a control) shRNA, CCCGCCTGAAGTCTCTGATTAA. The GATA4 and p53 cDNAs were obtained from Open Biosystems and subcloned into either pInducer 20 or pMSCV vectors. cDNAs for other open reading frames (ORFs) used in this study were from the human ORFeome library V8.1 (64). siRNAs were transfected into cells at 20 nM for the individual siRNA and 50 nM for pools using Lipofectamine RNAiMAX transfection reagents (Invitrogen) according to manufacturer instructions. The following siRNAs were used: firefly luciferase siRNA, CGUACGCGGAAUACUUCGAUU; GATA4 siRNA #1, CGACUUCUCAGAAGGCAGAtt; GATA4 siRNA #2, CGAUAUGUUUGACGACUUC; ATG5 siRNA #1, CAUCUGAGCUACCCGGAUA; ATG5 siRNA #2, GACAAGAAGACAUUAGUGA; ATG5 siRNA #3, CAAUUGGUUUGCUAUUUGA; ATG7 siRNA #1, GAUCAAAGGUUUUCACUAA; ATG7 siRNA #2, GAAGAUAACAAUUGGUGUA; ATG7 siRNA #3, CAACAUCCCUGGUUACAAG; NBR1 siGENOME siRNA pool, Dharmacon, MU-010522-01-0002; NDP52 siGENOME siRNA pool, Dharmacon, MU-01063701-0002; BNIP3L siGENOME siRNA pool, Dharmacon, MU-011815-01-0002; WDFY3 siGENOME siRNA pool, Dharmacon, MU-012924-01-0002; p62 siRNA #1, GAUCUGCGAUGGCUGCAAU; p62 siRNA #2, GCAUUGAAGUUGAUAUCGA; p62 siRNA #3, GAAGUGGACCCGUCUACAG; TRAF3IP2 siRNA #1, GAGCAUGGCUUACAUACUA; RELA siRNA #1, GAUUGAGGAGAAACGUAAA; IL1A siRNA #1, GAUCAUCUGUCUCUGAAUC; IL1A siRNA #2, GAAAUCCUUCUAUCAUGUA. CRISPR targeting A guide RNA (gRNA) targeting the sequence GCTGTGGCGCCGCAATGCGGAGG in exon 4 of human GATA4 was cloned into lentiCRISPR puro (Addgene plasmid #49535) by annealing the following oligos and ligating into the BsmBI sites: Fwd, CACCGCTGTGGCGCCGCAATGCGG; Rev, AAACCCGCATTGCGGCGCCACAGC. A control gRNA targeting the AAVS1 locus GTCCCCTCCACCCCACAGTGGGG (65) was cloned into lentiCRISPR puro via the BsmBI sites by annealing and ligating the following annealed oligos: Fwd, CACCGTCCCCTCCACCCCACAGTG; Rev, AAACCACTGTGGGGTGGAGGGGAC. GATA4 CRISPR targeting was confirmed by PCR and Sanger sequencing of targeting genomic region with following primers: Fwd, AGCCCCGGTCAGTTCTCCTCTCAGGAGAA; Rev, TAAGGTAGGAGGTAGAGGTCATGCTTTCC. Chromatin immunoprecipitation (ChIP) Chromatin immunoprecipitation experiments were performed with the ChiP-IT Express kit (Active Motif) according to manufacturer instructions. Briefly, cells expressing HA/FLAG-tagged GATA4 were fixed in 1% formaldehyde for 10 min at room temperature. The cross-linking reaction was quenched with Glycine Stop-Fix Solution. The pellet was resuspended in ice-cold lysis buffer and dounced on ice with ~10 to 15 strokes to aid in nuclei release. The nuclei were resuspended in shearing buffer and the chromatin sheared by
25 SEPTEMBER 2015 • VOL 349 ISSUE 6255
aaa5612-9
R ES E A RC H | R E S EA R C H A R T I C LE
sonication. The sheared chromatin was centrifuged for 10 min at 15,000 rpm at 4°C and supernatants incubated with Flag-M2-magnetic beads for 3 hours at 4°C. The beads were washed three times with ChIP buffer and the DNA was eluted and reverse cross-linked. The DNA was subjected to the QIAquick PCR purification kit (Qiagen) before real-time PCR. Brain sample procurement and Western blotting Postmortem human brain tissue was procured from the Rush University Medical Center, University of Maryland, Duke University, Brigham and Women’s Hospital, and Massachusetts General Hospital in accordance with institutional guidelines governed by approved protocols. Frozen specimens used in this study were from the prefrontal cortical gray matter (Brodmann areas 9 and 10) and were snap-frozen and stored at –140°C. Samples included tissue from young adults without neurological abnormalities and aged subjects without a diagnosis of Alzheimer’s disease or other neurodegenerative disease and neuropathological results within the normal range for age. Tissues were homogenized using dounce homogenizer, and cells were lysed at 4°C using RIPA-DOC buffer supplemented with protease and phosphatase inhibitors (Complete and Phosphostop, Roche). Sonication was performed prior to centrifugation at 10,000 rpm for 10 min at 4°C. The supernatant was removed and the protein concentration determined (BioRad protein assay). SDS sample buffer containing b-mercaptoethanol was added and 20 mg of protein was loaded per lane. Immunohistochemistry analysis of human brain Immunofluorescence analysis using paraffinembedded brain sections was performed in the prefrontal cortex. Paraffin-embedded tissue sections were first deparaffinized in xylene, then rehydrated with decreasing concentrations of ethanol and placed in water. Sections then underwent antigen retrieval using the Diva decloaker (BioCare, USA). They were then washed and blocked with 3% bovine serum albumin (BSA), 0.1% Triton X-100 in phosphate-buffered saline (PBS) for 1 hour at room temperature. Primary antibodies were diluted in 2% BSA, 0.1% Triton in PBS. The following primary antibodies were used: GATA4 (mouse, Abcam); GATA4 (rabbit, Novus); GATA4 (goat, R&D systems); p16 (rabbit, Abcam); p16 (mouse, Thermo Scientific); p16 (rabbit, Bethyl); GFAP (goat, Abcam). Analysis of GATA4 and p16 expression by immunofluorescence with antibodies obtained from these sources led to similar conclusions. After overnight incubations, sections were washed three times with PBS. Secondary antibodies, diluted in 2% BSA, 0.1% Triton in PBS, were coupled to Alexa fluorophores (1:300, Invitrogen). After washes in PBS, sections were incubated with 1% Sudan Black in 70% ethanol for 10 min to suppress lipofuscin autofluorescence. Sections were mounted using ProLong anti-fade mounting medium containing DAPI (Life Technologies) and imaged using confocal microscopy. Images were randomly acquired aaa5612-10
in the prefrontal cortex for quantification of immunofluorescence. Oligodendrocytes were distinguished from the white matter where they are the predominant cell type by their location (densely distributed in a linear pattern along axonal tracts) and small nuclei size. Pyramidal neurons were identified from the gray matter by their characteristic morphology (pyramid shape), size (the largest cells in the gray matter), and distinctive pattern of DAPI staining (diffuse). Astrocytes were identified by costaining with the astrocytic marker GFAP. Nuclei were selected using the Metamorph image analysis system and the average signal intensity measured. Values were corrected by subtracting the average slide background intensity (measured outside of cells). The investigator was blinded to sample origin or diagnosis. Aged mice C57BL/6J mice of 6 and 22 months of age were obtained from the National Institute on Aging mouse aging colony. Mice were acclimated for at least 1 week before killing. All animal studies followed the guidelines of and were approved by institutional animal care and use committees. Protein extracts were obtained by lysis in ice-cold lysis buffer (Cell Signaling) supplemented with a cocktail of protease and phosphatase inhibitors (Roche). Protein content was determined by the BCA protein assay kit (Pierce), and 20 to 30 mg of proteins were subjected to SDS–polyacrylamide gel electrophoresis. Mouse senescence model experiments For IR-induced senescence, C57BL/6J mice (8 weeks of age) were mock-irradiated or exposed to IR (7 Gy) and tissues were collected 90 days later. Mice were maintained in the AALAC-accredited Buck Institute for Research on Aging (Novato, CA) animal facility. All procedures were approved by the institutional animal care and use committee. Statistical analysis Statistical significance was calculated by twotailed Student’s t test unless otherwise indicated. The c2 test was used to compare gene expression profiling between the GATA4-regulated set and Senescent set. Prism 6 software was used to generate graphs and statistical analyses. RE FERENCES AND NOTES
1. T. Kuilman, C. Michaloglou, W. J. Mooi, D. S. Peeper, The essence of senescence. Genes Dev. 24, 2463–2479 (2010). doi: 10.1101/gad.1971610; pmid: 21078816 2. J. Campisi, Aging, cellular senescence, and cancer. Annu. Rev. Physiol. 75, 685–705 (2013). doi: 10.1146/annurevphysiol-030212-183653; pmid: 23140366 3. C. López-Otín, M. A. Blasco, L. Partridge, M. Serrano, G. Kroemer, The hallmarks of aging. Cell 153, 1194–1217 (2013). doi: 10.1016/j.cell.2013.05.039; pmid: 23746838 4. U. Herbig, M. Ferreira, L. Condel, D. Carey, J. M. Sedivy, Cellular senescence in aging primates. Science 311, 1257 (2006). doi: 10.1126/science.1122446; pmid: 16456035 5. J. C. Jeyapalan, J. M. Sedivy, Cellular senescence and organismal aging. Mech. Ageing Dev. 129, 467–474 (2008). doi: 10.1016/j.mad.2008.04.001; pmid: 18502472 6. D. J. Baker et al., Clearance of p16Ink4a-positive senescent cells delays ageing-associated disorders. Nature 479, 232–236 (2011). doi: 10.1038/nature10600; pmid: 22048312
25 SEPTEMBER 2015 • VOL 349 ISSUE 6255
7. J. P. Coppé et al., Senescence-associated secretory phenotypes reveal cell-nonautonomous functions of oncogenic RAS and the p53 tumor suppressor. PLOS Biol. 6, e301 (2008). doi: 10.1371/journal.pbio.0060301; pmid: 19053174 8. T. Kuilman, D. S. Peeper, Senescence-messaging secretome: SMS-ing cellular stress. Nat. Rev. Cancer 9, 81–94 (2009). doi: 10.1038/nrc2560; pmid: 19132009 9. J. P. Coppé, P. Y. Desprez, A. Krtolica, J. Campisi, The senescence-associated secretory phenotype: The dark side of tumor suppression. Annu. Rev. Pathol. 5, 99–118 (2010). doi: 10.1146/annurev-pathol-121808-102144; pmid: 20078217 10. T. Tchkonia, Y. Zhu, J. van Deursen, J. Campisi, J. L. Kirkland, Cellular senescence and the senescent secretory phenotype: Therapeutic opportunities. J. Clin. Invest. 123, 966–972 (2013). doi: 10.1172/JCI64098; pmid: 23454759 11. T. Kuilman et al., Oncogene-induced senescence relayed by an interleukin-dependent inflammatory network. Cell 133, 1019–1031 (2008). doi: 10.1016/j.cell.2008.03.039; pmid: 18555778 12. N. Wajapeyee, R. W. Serra, X. Zhu, M. Mahalingam, M. R. Green, Oncogenic BRAF induces senescence and apoptosis through pathways mediated by the secreted protein IGFBP7. Cell 132, 363–374 (2008). doi: 10.1016/j.cell.2007.12.032; pmid: 18267069 13. J. C. Acosta et al., A complex secretory program orchestrated by the inflammasome controls paracrine senescence. Nat. Cell Biol. 15, 978–990 (2013). doi: 10.1038/ncb2784; pmid: 23770676 14. A. Krtolica, S. Parrinello, S. Lockett, P. Y. Desprez, J. Campisi, Senescent fibroblasts promote epithelial cell growth and tumorigenesis: A link between cancer and aging. Proc. Natl. Acad. Sci. U.S.A. 98, 12072–12077 (2001). doi: 10.1073/ pnas.211053698; pmid: 11593017 15. V. Krizhanovsky et al., Senescence of activated stellate cells limits liver fibrosis. Cell 134, 657–667 (2008). doi: 10.1016/ j.cell.2008.06.049; pmid: 18724938 16. A. Lujambio et al., Non-cell-autonomous tumor suppression by p53. Cell 153, 449–460 (2013). doi: 10.1016/ j.cell.2013.03.020; pmid: 23562644 17. M. Demaria et al., An essential role for senescent cells in optimal wound healing through secretion of PDGF-AA. Dev. Cell 31, 722–733 (2014). doi: 10.1016/j.devcel.2014.11.012; pmid: 25499914 18. A. Salminen, A. Kauppinen, K. Kaarniranta, Emerging role of NF-kB signaling in the induction of senescence-associated secretory phenotype (SASP). Cell. Signal. 24, 835–845 (2012). doi: 10.1016/j.cellsig.2011.12.006; pmid: 22182507 19. A. Freund, C. K. Patil, J. Campisi, p38MAPK is a novel DNA damage response-independent regulator of the senescenceassociated secretory phenotype. EMBO J. 30, 1536–1548 (2011). doi: 10.1038/emboj.2011.69; pmid: 21399611 20. F. Rodier et al., Persistent DNA damage signalling triggers senescence-associated inflammatory cytokine secretion. Nat. Cell Biol. 11, 973–979 (2009). doi: 10.1038/ncb1909; pmid: 19597488 21. C. M. Beauséjour et al., Reversal of human cellular senescence: Roles of the p53 and p16 pathways. EMBO J. 22, 4212–4222 (2003). doi: 10.1093/emboj/cdg417; pmid: 12912919 22. M. Narita et al., Rb-mediated heterochromatin formation and silencing of E2F target genes during cellular senescence. Cell 113, 703–716 (2003). doi: 10.1016/S0092-8674(03)00401-X; pmid: 12809602 23. U. Herbig, W. A. Jobling, B. P. Chen, D. J. Chen, J. M. Sedivy, Telomere shortening triggers senescence of human cells through a pathway involving ATM, p53, and p21(CIP1), but not p16(INK4a). Mol. Cell 14, 501–513 (2004). doi: 10.1016/S10972765(04)00256-4; pmid: 15149599 24. W. Xue et al., Senescence and tumour clearance is triggered by p53 restoration in murine liver carcinomas. Nature 445, 656–660 (2007). doi: 10.1038/nature05529; pmid: 17251933 25. A. Chicas et al., Dissecting the unique role of the retinoblastoma tumor suppressor during cellular senescence. Cancer Cell 17, 376–387 (2010). doi: 10.1016/ j.ccr.2010.01.023; pmid: 20385362 26. J. P. Coppé et al., Tumor suppressor and aging biomarker p16 (INK4a) induces cellular senescence without the associated inflammatory secretory phenotype. J. Biol. Chem. 286, 36396–36403 (2011). doi: 10.1074/jbc.M111.257071; pmid: 21880712 27. N. Mizushima, B. Levine, A. M. Cuervo, D. J. Klionsky, Autophagy fights disease through cellular self-digestion. Nature 451, 1069–1075 (2008). doi: 10.1038/nature06639; pmid: 18305538 28. G. Kroemer, G. Mariño, B. Levine, Autophagy and the integrated stress response. Mol. Cell 40, 280–293 (2010). doi: 10.1016/j.molcel.2010.09.023; pmid: 20965422 29. A. M. Choi, S. W. Ryter, B. Levine, Autophagy in human health and disease. N. Engl. J. Med. 368, 651–662 (2013). doi: 10.1056/NEJMra1205406; pmid: 23406030
sciencemag.org SCIENCE
RE S E ARCH | R E S E A R C H A R T I C L E
30. D. J. Klionsky, P. Codogno, The mechanism and physiological function of macroautophagy. J. Innate Immun. 5, 427–433 (2013). doi: 10.1159/000351979; pmid: 23774579 31. A. R. Young et al., Autophagy mediates the mitotic senescence transition. Genes Dev. 23, 798–803 (2009). doi: 10.1101/ gad.519709; pmid: 19279323 32. M. Narita et al., Spatial coupling of mTOR and autophagy augments secretory phenotypes. Science 332, 966–970 (2011). doi: 10.1126/science.1205407; pmid: 21512002 33. D. A. Gewirtz, Autophagy and senescence: A partnership in search of definition. Autophagy 9, 808–812 (2013). doi: 10.4161/auto.23922; pmid: 23422284 34. D. Bhaumik et al., MicroRNAs miR-146a/b negatively modulate the senescence-associated inflammatory mediators IL-6 and IL-8. Aging 1, 402–411 (2009).pmid: 20148189 35. I. Ovcharenko, M. A. Nobrega, G. G. Loots, L. Stubbs, ECR Browser: A tool for visualizing and accessing data from comparisons of multiple vertebrate genomes. Nucleic Acids Res. 32, W280–W286 (2004). doi: 10.1093/nar/gkh355; pmid: 15215395 36. K. D. Taganov, M. P. Boldin, K. J. Chang, D. Baltimore, NF-kBdependent induction of microRNA miR-146, an inhibitor targeted to signaling proteins of innate immune responses. Proc. Natl. Acad. Sci. U.S.A. 103, 12481–12486 (2006). doi: 10.1073/pnas.0605298103; pmid: 16885212 37. R. S. Viger, S. M. Guittot, M. Anttonen, D. B. Wilson, M. Heikinheimo, Role of the GATA family of transcription factors in endocrine development, function, and disease. Mol. Endocrinol. 22, 781–798 (2008). doi: 10.1210/me.2007-0513; pmid: 18174356 38. R. Zheng, G. A. Blobel, GATA transcription factors and cancer. Genes Cancer 1, 1178–1188 (2010). doi: 10.1177/ 1947601911404223; pmid: 21779441 39. S. Agnihotri et al., A GATA4-regulated tumor suppressor network represses formation of malignant human astrocytomas. J. Exp. Med. 208, 689–702 (2011). doi: 10.1084/jem.20102099; pmid: 21464220 40. H. C. Yen, Q. Xu, D. M. Chou, Z. Zhao, S. J. Elledge, Global protein stability profiling in mammalian cells. Science 322, 918–923 (2008).pmid: 18988847 41. T. Johansen, T. Lamark, Selective autophagy mediated by autophagic adapter proteins. Autophagy 7, 279–296 (2011). doi: 10.4161/auto.7.3.14487; pmid: 21189453 42. S. Shaid, C. H. Brandts, H. Serve, I. Dikic, Ubiquitination and selective autophagy. Cell Death Differ. 20, 21–30 (2013). doi: 10.1038/cdd.2012.72; pmid: 22722335 43. M. Jin, X. Liu, D. J. Klionsky, SnapShot: Selective autophagy. Cell 152, 368–368.e2 (2013). doi: 10.1016/j.cell.2013.01.004; pmid: 23332767
SCIENCE sciencemag.org
44. A. Ivanov et al., Lysosome-mediated processing of chromatin in senescence. J. Cell Biol. 202, 129–143 (2013). doi: 10.1083/ jcb.201212110; pmid: 23816621 45. K. L. Meerbrey et al., The pINDUCER lentiviral toolkit for inducible RNA interference in vitro and in vivo. Proc. Natl. Acad. Sci. U.S.A. 108, 3665–3670 (2011). doi: 10.1073/ pnas.1019736108; pmid: 21307310 46. G. Dennis Jr. et al., DAVID: Database for Annotation, Visualization, and Integrated Discovery. Genome Biol. 4, P3 (2003). doi: 10.1186/gb-2003-4-5-p3; pmid: 12734009 47. T. Davoli et al., Cumulative haploinsufficiency and triplosensitivity drive aneuploidy patterns and shape the cancer genome. Cell 155, 948–962 (2013). doi: 10.1016/ j.cell.2013.10.011; pmid: 24183448 48. B. Vogelstein et al., Cancer genome landscapes. Science 339, 1546–1558 (2013). doi: 10.1126/science.1235122; pmid: 23539594 49. Y. Chien et al., Control of the senescence-associated secretory phenotype by NF-kB promotes senescence and enhances chemosensitivity. Genes Dev. 25, 2125–2136 (2011). doi: 10.1101/gad.17276711; pmid: 21979375 50. A. He, S. W. Kong, Q. Ma, W. T. Pu, Co-occupancy by multiple cardiac transcription factors identifies transcriptional enhancers active in heart. Proc. Natl. Acad. Sci. U.S.A. 108, 5632–5637 (2011). doi: 10.1073/pnas.1016959108; pmid: 21415370 51. C. Liu et al., Act1, a U-box E3 ubiquitin ligase for IL-17 signaling. Sci. Signal. 2, ra63 (2009). doi: 10.1126/scisignal.2000382; pmid: 19825828 52. A. V. Orjalo, D. Bhaumik, B. K. Gengler, G. K. Scott, J. Campisi, Cell surface-bound IL-1a is an upstream regulator of the senescence-associated IL-6/IL-8 cytokine network. Proc. Natl. Acad. Sci. U.S.A. 106, 17031–17036 (2009). doi: 10.1073/ pnas.0905299106; pmid: 19805069 53. J. E. Purvis et al., p53 dynamics control cell fate. Science 336, 1440–1444 (2012). doi: 10.1126/science.1218351; pmid: 22700930 54. I. Ben-Porath, R. A. Weinberg, The signals and pathways activating cellular senescence. Int. J. Biochem. Cell Biol. 37, 961–976 (2005). doi: 10.1016/j.biocel.2004.10.013; pmid: 15743671 55. A. Ciccia, S. J. Elledge, The DNA damage response: Making it safe to play with knives. Mol. Cell 40, 179–204 (2010). doi: 10.1016/j.molcel.2010.09.019; pmid: 20965415 56. S. Parrinello et al., Oxygen sensitivity severely limits the replicative lifespan of murine fibroblasts. Nat. Cell Biol. 5, 741–747 (2003). doi: 10.1038/ncb1024; pmid: 12855956 57. J. P. Coppé et al., A human-like senescence-associated secretory phenotype is conserved in mouse cells
58.
59.
60.
61.
62.
dependent on physiological oxygen. PLOS ONE 5, e9188 (2010). doi: 10.1371/journal.pone.0009188; pmid: 20169192 O. N. Le et al., Ionizing radiation-induced long-term expression of senescence markers in mice is independent of p53 and immune status. Aging Cell 9, 398–409 (2010). doi: 10.1111/j.1474-9726.2010.00567.x; pmid: 20331441 T. Lu et al., REST and stress resistance in ageing and Alzheimer’s disease. Nature 507, 448–454 (2014). doi: 10.1038/nature13163; pmid: 24670762 Y. Hart, U. Alon, The utility of paradoxical components in biological circuits. Mol. Cell 49, 213–221 (2013). doi: 10.1016/ j.molcel.2013.01.004; pmid: 23352242 D. Muñoz-Espín et al., Programmed cell senescence during mammalian embryonic development. Cell 155, 1104–1118 (2013). doi: 10.1016/j.cell.2013.10.019; pmid: 24238962 M. Storer et al., Senescence is a developmental mechanism that contributes to embryonic growth and patterning. Cell 155, 1119–1130 (2013). doi: 10.1016/j.cell.2013.10.041; pmid: 24238961
AC KNOWLED GME NTS
Materials are available under a material transfer agreement from Howard Hughes Medical Institute. We thank A. Ciccia, T. Davoli, I. Koren, E. Wooten, R. Patel, and members of the Elledge lab for helpful discussions and critical comments on this manuscript; E. Wooten and B. H. Kim for help with the gene expression profiling analyses; X. Li for help with the ChIP-qPCR experiment; and M. Hayano and D. Sinclair for providing aging mouse tissues. Supported by NIH grants GM44664 (S.J.E.), AG009909 and AG017242 (J.C.), and DP1OD006849 and AG046174 (B.A.Y.); a grant from the Glenn Foundation for Medical Research (B.A.Y.); an American Cancer Society postdoctoral fellowship (Q.X.); and the American-Italian Cancer Foundation (M.D.). C.K. is the HHMI fellow of the Jane Coffin Childs Memorial Fund for Medical Research. T.D.M. is a fellow of the Damon Runyon Cancer Research Foundation. S.J.E. is an investigator of the Howard Hughes Medical Institute.
SUPPLEMENTARY MATERIALS
www.sciencemag.org/content/349/6255/aaa5612/suppl/DC1 Figs. S1 to S6 Table S1 References (63–65) 23 December 2014; accepted 5 August 2015 10.1126/science.aaa5612
25 SEPTEMBER 2015 • VOL 349 ISSUE 6255
aaa5612-11
The DNA damage response induces inflammation and senescence by inhibiting autophagy of GATA4 Chanhee Kang et al. Science 349, (2015); DOI: 10.1126/science.aaa5612
This copy is for your personal, non-commercial use only.
If you wish to distribute this article to others, you can order high-quality copies for your colleagues, clients, or customers by clicking here.
The following resources related to this article are available online at www.sciencemag.org (this information is current as of October 13, 2015 ): Updated information and services, including high-resolution figures, can be found in the online version of this article at: http://www.sciencemag.org/content/349/6255/aaa5612.full.html Supporting Online Material can be found at: http://www.sciencemag.org/content/suppl/2015/09/25/349.6255.aaa5612.DC1.html A list of selected additional articles on the Science Web sites related to this article can be found at: http://www.sciencemag.org/content/349/6255/aaa5612.full.html#related This article cites 65 articles, 22 of which can be accessed free: http://www.sciencemag.org/content/349/6255/aaa5612.full.html#ref-list-1 This article has been cited by 1 articles hosted by HighWire Press; see: http://www.sciencemag.org/content/349/6255/aaa5612.full.html#related-urls This article appears in the following subject collections: Cell Biology http://www.sciencemag.org/cgi/collection/cell_biol
Science (print ISSN 0036-8075; online ISSN 1095-9203) is published weekly, except the last week in December, by the American Association for the Advancement of Science, 1200 New York Avenue NW, Washington, DC 20005. Copyright 2015 by the American Association for the Advancement of Science; all rights reserved. The title Science is a registered trademark of AAAS.
Downloaded from www.sciencemag.org on October 13, 2015
Permission to republish or repurpose articles or portions of articles can be obtained by following the guidelines here.