Psychonomic Bulletin & Review 2002, 9 (2), 306-313
The Doppler effect is not what you think it is: Dramatic pitch change due to dynamic intensity change MICHAEL K. M CBEATH Arizona State University, Tempe, Arizona and JOHN G. NEUHOFF College of Wooster, Wooster, Ohio Historically, auditory pitch has been considered to be a function of acoustic frequency, with only a small effect being due to absolute intensity. Yet we found that when tones are Doppler shifted so that frequency drops, the pitch dramatically rises and falls, closely following the pattern of dynamic intensity change. We show that continuous intensity change can produce pitch variation comparable to a frequency change approaching an octave. This effect opposes and is an order of magnitude larger than the well-known effect of discrete intensity change in the frequency range employed. We propose that the perceptual interaction of continuous changes in pitch and loudness reflects a natural correlation between changes in frequency and intensity that is neurally encoded to facilitate the parsing and processing of meaningful acoustic patterns.
Auditory pitch is a principal source of information used in tasks that range from localizing acoustic sources to deciphering music and speech. Historically, pitch has been identified as the perceptual dimension that corresponds principally with acoustic frequency. In the present work, we demonstrate that, under dynamic conditions, this view of pitch is too narrow. The music and physics literature typically specifies pitch only by the fundamental frequency of a tone, the lowest frequency of a harmonic series (Goldstein, 1973; Hartmann, 1988, 1996). Perceptually, the experience of pitch is described as the perceived “highness” of a tone, and all other attributes that distinguish a sound from a pure frequency tone of equal intensity are considered to be characteristics of timbre (ANSI, 1994; Grey, 1977; von Bismarck, 1974). DYNAMIC PITCH PERCEPTION In the present work, we examine the influence of intensity on pitch. We draw a distinction between discrete intensity change and continuous intensity change. Discrete changes in intensity are instantaneous and can be associated with the onset of a new sound source. They are often
This work was supported in part by a grant from Interval Research Corporation to M.K.M., a grant from the National Science Foundation to J.G.N., and a faculty development grant from the College of Wooster. We thank Bruno Repp, John Wixted, Karen McBeath, and John Hawks for helpful suggestions concerning this manuscript. Correspondenc e concerning this article should be addressed to J. G. Neuhoff, Department of Psychology, College of Wooster, Wooster, OH 44691 (e-mail:
[email protected]).
Copyright 2002 Psychonomic Society, Inc.
produced by impact sounds (e.g., a baseball bat striking a ball). Continuous changes in intensity occur more progressively over time and can be produced either by gradually changing the acoustic energy of a source, such as a motor revving up or down, or by the motion of a sound source approaching or receding from a listener. Although frequency is a primary determinant of pitch, it is well known that pitch depends in part on intensity. The general findings are that for frequencies lower than about 3 kHz, discrete increases in intensity lower pitch (Snow, 1936; Stevens, 1935; Terhardt, 1974; Verschuure & van Meeteren, 1975). This may be due to subtle nonlinearities in the physiological frequency-encoding mechanisms (Helmholtz, 1954; Scharf & Houtsma, 1986). Historically, the influence of discrete intensity change on pitch has been examined in experiments in which listeners toggle between two discrete tones and adjust one so that they match in pitch. The listener either adjusts the intensity of one of two tones that differ in frequency (Stevens, 1935) or adjusts the frequency of one of two tones that differ in intensity (Gulick, 1971). Stevens’s equal-pitch contours are widely cited and show a maximum effect of intensity on pitch of about 3%, roughly one-half of a semitone. In other words, tones that differ in intensity can differ in frequency by, at most, 3% and still be perceived as equal in pitch. Subsequent work has confirmed the phenomenon but has generally failed to replicate this magnitude, typically showing that the effect of discrete intensity on pitch is less than the 3% found by Stevens (e.g., Gulick, 1971). In the present work, we explore cases in which changes in intensity occur more gradually and continuously. Specifically, we examine Doppler-shifted tones (Doppler, 1842)
306
DRAMATIC PITCH CHANGE DUE TO DYNAMIC INTENSITY CHANGE and tones that change linearly in frequency and intensity. A common example of the Doppler shift is the pitch change heard as a train passes at a railroad crossing. The Doppler shift provides a real-world instance of concurrent continuous changes in frequency and intensity. Surprisingly, it has received relatively little attention from psychologists (but see Hassett, 1999; Jorasz & Dooley, 1996; Lufti & Wang, 1999; Neuhoff & McBeath, 1996; Pollack, 1968; Rosenblum, Carello, & Pastore, 1987). The frequency alteration follows the Doppler formula æ vsnd ö f obs = f src ç ÷, è v snd - vsrc cos q ø where fobs is the frequency observed, fsrc is the frequency of the source, vsrc is the velocity of the source, vsnd is the velocity of the sound, and q is the approach angle of the source. Many people believe that the frequency of an approaching source rises as the source approaches and falls as it recedes (Neuhoff & McBeath, 1996, 1997). However, for a constant-frequency approaching source, the frequency that arrives at the observation point is initially higher than the frequency that is emitted by the source. The observed frequency remains essentially constant at first, falls at an increasing rate as the source approaches, drops rapidly as the source passes, and finally drops at a decreasing rate as the source recedes (see Figure 1). The rate of the drop in frequency depends on the distance from the listener to the path of the source. The magnitude of the drop in frequency depends on the speed of the source. Despite the fall in frequency, listeners often experience a rise in pitch as the source approaches. Neuhoff and McBeath (1996) asked listeners to move a response wheel in real time to indicate pitch change while listening to Doppler-shifted tones. A rise in pitch on source approach occurred across a variety of source frequencies and timbres. Many naturally occurring sounds have a positive correlation between continuous changes in intensity and frequency. When sound sources increase in intensity, they
307
also tend to get higher in frequency (Scharine & McBeath, 2001). The Doppler shift that occurs when a source approaches is a rare exception to this rule. It may be that the auditory system incorporates the natural covariation of frequency and intensity when processing continuous change. Thus, listeners hear an “illusory” rise in pitch on source approach. The time course of the pitch change appears to match the intensity change that occurs as a source approaches and recedes. Furthermore, the effect of continuous intensity change on pitch can be in the opposite direction to past findings using discrete intensity change. However, previous work on the effect of continuous intensity change has measured pitch change only in arbitrary response units. Thus, the magnitude of the effect of continuous intensity on pitch has not been specified objectively. In the present study, we examine the magnitude of pitch change that occurs in Doppler-shifted tones and investigate how continuous changes in intensity influence judgments of pitch change. We report two experiments in which intensity and frequency change continuously. In the first experiment, we quantify the magnitude of pitch change in Doppler-shifted tones by comparing them with constant intensity tones that drop discretely in frequency. In the second experiment, we independently manipulate continuous changes in frequency and intensity and verify their concurrent influence on pitch. EXPERIMENT 1 Magnitude of the Effect of Dynamic Intensity Change on Pitch Method
Participants. Eighteen introductory psychology students between the ages of 18 and 25 years participated. None was a professional musician or had any formal training in music past high school. All reported normal hearing. They received no training in the present experimental paradigm and were not aware of the hypothese s being tested. Apparatus. The stimuli were generated by a 16-bit sound card controlled by a PC-compatible computer at a sampling rate of
Figure 1. Schematic diagram of the pattern of Doppler frequency change at a listening location perpendicular to the path of the acoustic source. When the sound is first heard, the maximally compressed waveform produces the highest observed frequency. Frequency at the listening point then drops both as the source approaches and as it recedes.
308
McBEATH AND NEUHOFF
44.1 kHz and were presented binaurally via Realistic LV-20 stereo headphones. Responses were made via two adjacent keys on the computer keyboard that were labeled “G” (greater) and “L” (less). All the participants were tested individually in an Industrial Acoustics single-wall sound-attenuated booth. Stimuli and Procedure. The listeners were presented with simulated Doppler-shifted square wave tones with fundamental frequencies of either 1046 or 175 Hz. The changes in frequency and intensity were designed to simulate a 108-dB sound source (all decibel levels reported are A-weighted) approaching at a constant velocity of 21.5 msec and then passing 5 m below a listener (as though the listener were on a bridge directly overlooking the path of the source). The total travel distance simulated by the sound source was 128 m, with the source passing the listener at the halfway point in the simulated path. The frequency contour presented to the listener followed the Doppler formula listed earlier. The total fall in frequency was 12.2%, or two semitones (see Figure 2). Stimulus tones had a duration of 6 sec and a change in intensity (64 to 86 to 64 dB) consisten t with the inverse-square law:
I=
P , 2pr 2
where I is acoustic intensity, P is the power of the sound source, and r is the distance from the source to the listener. One second after the Doppler tone, listeners heard the test comparison stimuli, a pair of 75dB 0.25-sec discrete tones with an interstimulus interval of 0.25 sec (see Figure 2). The first tone had the same frequency as the onset of the preceding Doppler-shifted tone. The second tone was lower in frequency by one of seven intervals ranging from 0 to 24 semitones in 4-semitone steps (zero change up to two octaves).1 All the stimuli had 10-msec onset and offset ramps to eliminate audible clicks. Each listener heard 10 trials at each of the seven intervals for both source frequencies. This yielded a total of 140 trials, all presented in random order. The task was to respond by pressing one of two keys, indicating whether the pitch drop between the discrete tones was greater or less than the total drop in the Doppler tone. This provided a measure of the total amount of pitch change perceived in the dynamic tone. We gave detailed explanations and examples of the dif-
ference between pitch and loudness and instructed the listeners to respond only to changes in pitch and to ignore changes in loudness .
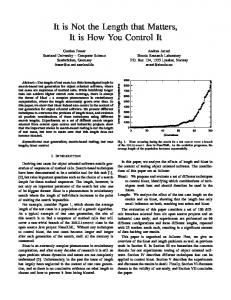
Results The results are summarized in a plot of the proportion of times that the discrete frequency drop was experienced to change less in pitch than did the Doppler-shifted tone (Figure 3). This proportion increased exponentially as the size of the discrete drop decreased. The 50% greater point indicates the average match between experienced sizes of Doppler shift and discrete pitch change. This occurred at a discrete drop of eight semitones (two-thirds octave drop), which is four times larger than the actual Doppler frequency change. The average frequency manipulation, 1046 versus 175 Hz, respectively increased or decreased the matched discrete drop by about half a semitone. Thus, perception of the lower frequency tone was influenced slightly less by continuous intensity change than was perception of the higher frequency tone. This much smaller effect is consistent in size and direction with the previously known findings in which discrete increases in intensity of lower frequencies produce lower pitch (Snow, 1936; Stevens, 1935; Terhardt, 1974; Verschuure & van Meeteren, 1975). In other words, the nonlinearities in the frequency-encoding mechanisms responsible for the discrete influence of intensity on pitch (i.e., increasing the intensity of lower frequency tones makes them sound lower in pitch) may have moderated the continuous influence of intensity on pitch for the low-frequency tone used here. This simultaneous confirmation of the traditional pitch– loudness relationship serves to further emphasize that the effect of continuous intensity change on pitch is different, much larger, and in the opposite direction in this frequency range.
Figure 2. Plot of intensity and frequency change over time in Experiment 1. The dynamic portion to the left shows the Doppler stimuli with continuous changes in frequency and intensity. The static portion to the right shows the comparison stimuli with constant intensity and a discrete frequency drop.
DRAMATIC PITCH CHANGE DUE TO DYNAMIC INTENSITY CHANGE
309
Figure 3. Results of Experiment 1. The graph shows the proportion of times that the pitch change of the discrete comparison stimuli was heard as less than that of the Doppler tone. The average match for the Doppler tone was a discrete drop of eight semitones, four times larger than the actual drop. The best-fitting exponential curve is shown (R2 5 .99). Error bars represent ±1 standard error.
EXPERIMENT 2 Dynamic Intensity and Frequency Changes In Experiment 2, we tested the influence of continuous changes in frequency and continuous changes in intensity on the perception of pitch. All of the previous work that we were able to find on the influence of continuous intensity on pitch had used intensity change that was consistent with the inverse-square law (accelerated or decelerated rates of intensity change related to motion, velocity, and distance). In Experiment 2, we used non-Doppler stimuli with linear rates of change. We wanted to examine the hypothesis that the influence of continuous intensity on pitch is not limited to intensity change produced by source motion but is a more general characteristic when sound sources that produce continuous changes in frequency and intensity are perceived. Method
Participants . Fifteen introductory psychology students between the ages of 18 and 22 years participated. None was a professiona l musician or had any formal training in music past high school. All reported normal hearing. They received no training in the present experimental paradigm, were not aware of the hypotheses being tested, and did not participate in Experiment 1. Apparatus. The stimuli were presented with the same equipment as that used in Experiment 1. Responses were made on the controller wheel of a Casio CZ-1 synthesizer and were recorded by the computer. The response wheel had a notched center point and was spring loaded, so it returned to the center point after each trial. The wheel had a total travel of approximately 110º.
Stimuli and Procedure. Nine stimuli were created using all combinations of three frequency change conditions and three intensity change conditions (see Figure 4). Frequency was held constant for 1 sec at 1046 Hz, then either remained constant or rose or fell by 6% (one semitone) over 4 sec, and finally was constant again for 1 sec. Similarly, intensity was held constant for 1 sec, then either remained constant or rose or fell by 15 dB over 4 sec, and finally was constant again for 1 sec. Rising intensity stimuli started at 70 dB and rose to 85 dB. Falling intensity stimuli were initiated at 85 dB and fell to 70 dB. Constant intensity stimuli were 77.5 dB. All the stimuli were square waves sampled at 44.1 kHz and had 10msec onset and offset ramps to eliminate audible clicks. Each listener was presented with 4 trials of each type of stimulus, for a total of 36 trials. The tones were presented in random order, with an interstimulus interval of 3 sec. The listeners were told that they would hear a series of tones that might change in pitch (higher vs. lower) and might change in loudness (louder vs. quieter). We described the definitions of pitch and loudness and instructed the listeners to attend to changes in pitch and to ignore any changes in loudness. They were instructed to mimic any changes in pitch during a tone by moving the response wheel forward to the extent that they heard the pitch rise and backward to the extent that they heard the pitch fall. The listeners made their responses while the stimulus was playing. Thus, the response wheel provided a real-time measure of pitch change under conditions of (1) intensity change with constant frequency, (2) frequency change with constant intensity, and (3) concurrent frequency and intensity change. The listeners received six practice trials with changing frequency and constant intensity.2 Prior to the experimental trials, the listeners were reminded to concentrate on changes in pitch and to ignore changes in loudness. We recorded the peak pitch rise or fall (as indicated by response wheel displacement). The responses were averaged to obtain a single score for each listener in each of the nine stimulus conditions .
310
McBEATH AND NEUHOFF
Figure 4. Frequency and intensity changes used in Experiment 2.
Results A 3 3 3 (intensity rising, remaining constant, or falling 3 frequency rising, remaining constant, or falling) analysis of variance indicated a significant effect of frequency change [accounting for 31.9% of the variance in responses; F(2,28) = 50.2, p < .001], a significant effect of intensity change [25.2% of the variance; F(2,28) = 15.8, p < .001], and a smaller but significant interaction [4.2% of the variance; F(4,56) = 7.78, p < .001; see Figure 5]. When frequency rose, remained constant, and fell, listeners heard pitch rise, remain constant, and fall, respectively. When intensity rose, remained constant, and fell, listeners also heard pitch rise, remain constant, and fall, respectively (and by a magnitude similar to that caused by the frequency change). Finally, when both intensity and fre90
Pitch Change (response wheel units)
60
quency changed, both significantly contributed to perceived changes in pitch. The findings confirm that intensity change can substantially contribute to the perception of pitch change, in a manner consistent with the findings of Experiment 1. The results further suggest that for the Doppler stimuli used in Experiment 1, the illusory pitch rise during the approach phase, and the dramatic pitch fall during the recession phase are driven by the continuous intensity change. GENERAL DISCUSSION Our findings confirm that there is a robust tendency for listeners to experience tones with continuous intensity sweeps as dramatically changing in pitch. The effect is an
Intensity Fall Intensity Constant Intensity Rise
30 0 230 260 290
Fall
Constant
Rise
Frequency Figure 5. Results of Experiment 2. The graph shows change in pitch for nine conditions in which frequency and intensity were each independently increased, held constant, or decreased over a period of 4 sec. The results indicate that changes in both frequency and intensity influence changes in pitch. At this rate of change, a continuous intensity sweep of 15 dB produced a pitch change roughly comparable to that of a frequency sweep of a semitone.
DRAMATIC PITCH CHANGE DUE TO DYNAMIC INTENSITY CHANGE order of magnitude larger than and in the opposite direction from the previously documented effect of discrete intensity change. Midrange to low-frequency tones that continuously increase in intensity are experienced as dramatically rising in pitch. With Doppler tones, we found that the pitch change was an average of four times that specified by frequency change alone. Tones that discretely increase in intensity in this frequency range are experienced as to falling in pitch. The magnitude of the pitch change for discrete increases is typically less than 3% (Gulick, 1971; Scharf & Houtsma, 1986; Snow, 1936; Stevens, 1935; Terhardt, 1974; Verschuure & van Meeteren, 1975). There appears to be a smaller effect of intensity change on pitch in Experiment 2 than in Experiment 1. There are several potential reasons for this. First, the amount of intensity change employed in Experiment 2 was 7 dB less than that used in Experiment 1. Thus, we might expect that the influence of intensity change on pitch change would be smaller. Furthermore, the rate of intensity change in Experiment 1 increased at an increasing rate (as specified by the inverse-square law). In Experiment 2, the rate of change was linear. In terms of source approach, a linear rate of intensity change specifies a decelerating approaching source. A rate of change specified by the inverse-square law specifies a source approaching at a constant velocity. To the extent that the effect of intensity change on pitch is related to source approach, we might expect a greater influence of intensity with increasing rates of change. The Doppler Effect and Source Approach The Doppler effect (during source approach) is an exception to the positive correlation between naturally occurring frequency and intensity change. As a source approaches, intensity rises, and frequency falls. Nonetheless, listeners tend to report rising pitch as the source approaches. Veridical perception of frequency change on source approach would require listeners to selectively attend to frequency change while ignoring changes in intensity, a task that, at best, is subject to cross-dimensional influence between pitch and loudness (Melara, Marks, & Potts, 1993; Neuhoff & McBeath, 1996; Neuhoff, McBeath, & Wanzie, 1999) and one that some researchers have argued is impossible (Grau & Kemler-Nelson, 1988). Furthermore, accurately perceiving frequency change on approach would provide little information about the arrival time of the source, because at the point of closest passage, frequency change is in the middle of a rapid downward sweep (see Figure 1). Intensity change, on the other hand, does provide cues as to arrival time. One is the increasing rate of intensity change on approach, termed acoustic tau (Shaw, McGowan, & Turvey, 1991), which can specify arrival time. The other is the salient peak in intensity at the point of closest passage. Thus, pitch change that follows the pattern of intensity change may be more useful in estimating the arrival time of approaching sources. The assumption that pitch corresponds primarily with frequency implies that the pitch shift associated with continuous intensity change can be interpreted as an auditory illusion. Numerous scientific, educational, and mu-
311
sical references incorrectly imply that the Doppler shift specifies rising frequency on approach (e.g., Bernstein, 1993; Lipkin, 1995; Speaks, 1992; see Neuhoff & McBeath, 1997). Examples of the illusion include the rise in pitch heard when listening to a passing car, siren, or even a much slower moving mosquito near one’s ear. In the case of a mosquito, the speed of motion is typically about 1/1000 that of the speed of sound. Therefore, actual frequency change owing to a Doppler shift is negligible, making any perception of pitch change almost entirely driven by intensity change. Interacting Pitch and Loudness There is considerable evidence that suggests that pitch and loudness are interacting perceptual dimensions (attributes that interfere with judgments concerning each other). Researchers typically argue that pitch and loudness interact because they occur together in a way that makes it efficient to process them holistically (Garner, 1974; Grau & Kemler-Nelson, 1988) or because the context created by one dimension influences perception in the other (Melara et al., 1993; Neuhoff et al., 1999). We suggest that, in nature, there is a reliable correlation and near-invariant relationship between changes in intensity and frequency. When natural sound sources increase in intensity, their rate of vibration or frequency also tends to increase, and vice versa. A mechanical example of the natural correlation is the simultaneous increases in frequency and intensity produced by an accelerating engine. A biological example is the tendency during speech for fundamental frequency to rise when vocal intensity rises (Alain, 1993; Brenner, Doherty, & Shipp, 1994; Cutler & Butterfield, 1991; Fisher & Tokura, 1995; Scharine & McBeath, 2001). Birds also produce and attend more closely to distress calls in which frequency and intensity rise and fall together (Evans, Gaioni, & McBeath, 1985; Gaioni & Evans, 1989). Finally, music perception research has shown that there is an expectation that melody lines that rise in frequency will also rise in intensity (Repp, 1995; Scharine & McBeath, 2001). Perceptual interactions between musical pitch, intensity, and tempo have also been demonstrated (Boltz, 1998; Tekman, 1997, 1998). The correlation between frequency and intensity is consistent with evidence that continuous changes in frequency can influence the perception of loudness as well (Neuhoff et al., 1999). Auditory-processing mechanisms that utilize this correlation could facilitate parsing of simultaneous acoustic sources and aid in deciphering complex acoustic patterns, such as music and speech. We suggest that a neural structure may incorporate a processing bias to take advantage of the natural correlation between changes in intensity and frequency. There is both psychophysical and neural evidence in support of independent mechanisms to process continuous and discrete auditory stimuli (Saberi & Hafter, 1995; Tian & Rauschecker, 1994; Zelick, Rose, & Rand, 1991). Detection of continuous changes in frequency and intensity appears to be used in the assessment of pitch streaming, source parsing, and auditory scene analysis (Bregman,
312
McBEATH AND NEUHOFF
1994; Wightman & Jenison, 1995). Discrete changes in intensity and frequency often indicate entry of different sources, but continuous changes almost always indicate single-source continuity (Rogers & Bregman, 1998). Considerable research suggests that humans and animals also use rate and pattern of changing intensity to aid in navigation and judgments of auditory source localization (Ashmead, Davis, & Northington, 1995; Lee, 1990; Lee & Simmons, 1995; Lee, van der Weel, Hitchcock, Matejowsky, & Pettigrew, 1992; Neuhoff, 1998, 1999, 2001; Rosenblum, Gordon, & Jarquin, 2000; Russell & Turvey, 1999; Schenkman & Jansson, 1986; Shaw et al., 1991; Stoffregen & Pittenger, 1995). The interaction of pitch and loudness and the large magnitude of pitch change for continuous intensity stimuli suggest that dynamic pitch may enhance such localization judgments. We speculate that the interaction of continuous pitch and loudness processing takes place in the central, rather than the peripheral, auditory pathway. Neuhoff et al. (1999) found that continuous frequency change in one ear could influence continuous loudness change in the contralateral ear. A similar process may be responsible for the influence of continuous intensity change on pitch. Moreover, if this were a peripheral process, we might be more likely to see some type of compensatory response. For example, because pitch and loudness usually rise together, if their interaction was primarily sensory we might predict that, upon exposure to rising intensity and constant frequency, listeners would perceive falling pitch in order to compensate for the unfulfilled expectation of rising frequency. This scenario would be analogous to visual aftereffects where viewers perceive stationary scenes to move in the opposite direction to continuously viewed motion in one direction (e.g., a waterfall). However, when our listeners were presented with rising intensity and constant frequency, they reported rising pitch. Thus, we suggest that the effect is central and cognitive, rather than peripheral and sensory. Conclusions The perception of auditory pitch is a complex phenomenon. The vast majority of previous psychophysical studies of pitch perception have presented tones with discrete changes. Our work suggests that continuous intensity change can influence pitch up to an order of magnitude more than and in the opposite direction from the effect of discrete intensity change on tones of low to midrange frequency. We suggest that the interaction between dynamic pitch and loudness in perceiving Doppler-shifted tones reflects a generic natural regularity for individual sound sources to change in intensity and frequency simultaneously. The bias of listeners to expect the two acoustic dimensions to co-occur is consistent with what typically happens in nature and may be encoded neurally in a manner that is adaptive for parsing individual sound sources when analyzing complex auditory scenes. In short, listener expectation of the natural correlation between changes in frequency and intensity may facilitate parsing and processing of meaningful acoustic patterns.
REFERENCES Alain, C. (1993). The relation among fundamental frequency, intensity, and duration varies with accentuation. Journal of the Acoustical Society of America, 944, 2434-2436 . ANSI (1994). Acoustical Terminology S1 No. American National Standards Institute. Ashmead, D. H., Davis, D. L., & Northington, A. (1995). Contribution of listeners’ approaching motion to auditory distance perception. Journal of Experimental Psychology: Human Perception & Performance, 21, 239-256. Bernstein, J. (1993). Cranks, quarks, and the cosmos. New York: Basic Books. Bismarck, G.von (1974). Timbre of steady state sounds: A factorial investigation of its verbal attributes. Acustica, 30, 146-159. Boltz, M. G. (1998). Tempo discrimination of musical patterns: Effects due to pitch and rhythmic structure. Perception & Psychophysics, 60, 1357-1373 . Bregman, A. (1994). Auditory scene analysis: Perceptual organization of sound. Cambridge, MA: MIT Press, Bradford Books. Brenner, M., Doherty, E. T., & Shipp, T. (1994). Speech measures indicating workload demand. Aviation, Space, & Environmental Medicine, 651, 21-26. Cutler, A., & Butterfield, S. (1991). Word boundary cues in clear speech: A supplementary report. Speech Communication, 104, 335353. Doppler, J. C. (1842). Über das farbige Licht der Doppelsterne und einiger anderer Gestirne des Himmels. In Versuch einer das Bradley’sche aberrations-theorem als integrirrenden Theil in sich schliessenden allgemeineren Theorie (p. 465). Prague: K. Böhm Gesellschaft der Wissenschaften. Evans, C. S., Gaioni, S. J., & McBeath, M. K. (1985). A microcomputer system for the measurement of avian heart rate. Bird Behavior, 6, 41-45. Fisher, C., & Tokura, H. (1995). The given-new contract in speech to infants. Journal of Memory & Language, 34, 287-310. Gaioni, S. J., & Evans, C. S. (1989). Perception of the frequency characteristics of the distress calls by mallard ducklings. Behaviour, 111, 13-33. Garner, W. R. (1974). The processing of information and structure. Potomac, MD: Erlbaum. Goldstein, J. L. (1973). An optimum processor theory for the central formation of the pitch of complex tones. Journal of the Acoustical Society of America, 54, 1496-1516 . Grau, J. W., & Kemler-Nelson, D. G. (1988). The distinction between integral and separable dimensions: Evidence for the integrality of pitch and loudness. Journal of Experimental Psychology: General, 117, 347-370. Grey, J. M. (1977). Multidimensional perceptual scaling of musical timbres. Journal of the Acoustical Society of America, 61, 1270-1277. Gulick, W. L. (1971). Hearing: Physiology and psychophysic s. New York: Oxford University Press. Hartmann, W. M. (1988). Pitch perception and the segregation and integration of auditory entities. In G. M. Edelman, W. E. Gall, & W. M. Cowan (Eds.), Auditory function (pp. 623-645). New York: Wiley. Hartmann, W. M. (1996). Pitch, periodicity and auditory organization. Journal of the Acoustical Society of America, 100, 3491-3502 . Hassett, S. (1999). Just discriminable change of velocity of a simulated moving sound source. Unpublished undergraduate thesis, Ohio State University. Helmholtz, H. L. F. von (1954). The sensations of tone as a physiological basis for the theory of music (2nd English ed.; A. J. Ellis, Trans.). New York: Dover. (Original work published 1855) Jorasz, U., & Dooley, G. J. (1996). The perceptibility of the frequency drop caused by the Doppler effect for simulated sound source motion in the median plane. Archives of Acoustics, 21, 149-157. Lee, D. N. (1990). Getting around with light or sound. In R. Warren & A. H. Wertheim (Eds.), Perception and control of self motion: Resources for ecological psycholog y (pp. 487-505). Hillsdale, NJ: Erlbaum. Lee, D. N., & Simmons, J. A. (1995). Steering by echolocation: A paradigm of ecological acoustics. Journal of Comparative Physiology A, 176, 347-354.
DRAMATIC PITCH CHANGE DUE TO DYNAMIC INTENSITY CHANGE Lee, D. N., van der Weel, F.R., Hitchcock, T., Matejowsky, E., & Pettigrew, J. D. (1992). Common principle of guidance by echolocation and vision. Journal of Comparative Physiology, 171, 563-571. Lipkin, R. (1995). Device measures speed of white light. Science News, 148, 215. Lufti, R. A., & Wang, W. (1999). Correlational analysis of acoustic cues for the discrimination of auditory motion. Journal of the Acoustical Society of America, 106, 919-928. Melara, R. D., Marks, L. E., & Potts, B. C. (1993). Early-holistic processing or dimensional similarity? Journal of Experimental Psychology: Human Perception & Performance, 19, 1114-1120. Neuhoff, J. G. (1998). A perceptual bias for rising tones. Nature. 395, 123-124. Neuhoff, J. G. (1999). Perception of changes in loudness: Reply to Canèvet et al. Nature, 398, 673-674. Neuhoff, J. G. (2001) An adaptive bias in the perception of looming auditory motion. Ecological Psycholog y, 13, 87-110. Neuhoff, J. G., & McBeath, M. K. (1996). The Doppler illusion: The influence of dynamic intensity on perceived pitch. Journal of Experimental Psychology: Human Perception & Performance, 22, 970-985. Neuhoff, J. G. & McBeath, M. K. (1997). Overcoming naive mental models in explaining the Doppler shift: An illusion creates confusion. American Journal of Physics, 65, 618-621. Neuhoff, J. G., McBeath, M. K., & Wanzie, W. C. (1999). Dynamic frequency change influences loudness perception: A central, analytic process. Journal of Experimental Psychology: Human Perception & Performance, 25, 1050-1059 . Pollack, I. (1968). Auditory pulsed Doppler discrimination. Journal of the Acoustical Society of America, 44, 592-598. Repp, B. H. (1995). Detectability of duration and intensity increments in melody tones: A partial connection between music perception and performance. Perception & Psychophysic s, 57, 1217-1232. Rogers, W. L., & Bregman, A. S. (1998). Cumulation of the tendency to segregate auditory streams: Resetting by changes in location and loudness. Perception & Psychophysics, 60, 1216-1277 . Rosenblum, L. D., Carello, C., & Pastore, R. E. (1987). Relative effectiveness of three stimulus variables for locating a moving sound source. Perception, 16, 175-186. Rosenblum, L. D., Gordon, M. S., & Jarquin, L. (2000). Echolocating distance by moving and stationary listeners. Ecological Psychology, 12, 181-206. Russell, M. K., & Turvey, M. T. (1999). Auditory perception of unimpeded passage. Ecological Psychology, 11, 175-188. Saberi, K., & Haft er, E. R. (1995). A common neural code for frequency- and amplitude-modulated sounds. Nature, 374, 537-539. Scharf, B., & Houtsma, A. J. M. (1986). Audition: II. Loudness, pitch, localization, aural distortion, pathology. In K. R. Boff, L. Kaufman, & J. P. Thomas (Eds.), Handbook of perception and human performance (pp. 15-1 to 15-60). New York: Wiley. Scharine, A. A., & McBeath, M. K. (2001, April). Evidence for a correlation between frequency and intensity. Paper presented at the 81st
313
Annual Convention of the Western Psychological Association, Lahaina, Hawaii. Schenkman, B. N., & Jansson, G. (1986). The detection and localization of objects by the blind with the aid of long-cane tapping sounds . Human Factors, 28, 607-618. Shaw, B. K., McGowan, R. S., & Turvey, M. T. (1991). An acoustic variable specifying time to contact. Ecological Psychology, 3, 253-261. Snow, W. B. (1936). Changes of pitch with loudness at low frequencies. Journal of the Acoustical Society of America, 8, 14-19. Speaks, C. E. (1992). Introduction to sound: Acoustics for the hearing and speech sciences. San Diego: Singular Publishing Group. Stevens, S. S. (1935). The relation of pitch to intensity. Journal of the Acoustical Society of America, 6, 150-154. Stoffregen, T. A., & Pittenger, J. B. (1995). Human echolocation as a basic form of perception and action. Ecological Psychology, 7, 181-216. Tekman, H. G. (1997). Interactions of perceived intensity, duration, and pitch in pure tone sequences. Music Perception, 14, 281-294. Tekman, H. G. (1998). Effects of melodic accents on perception of intensity. Music Perception, 15, 391-401. Terhardt, E. (1974). Pitch of pure tones: Its relation to intensity. In E. Zwicker & E. Terhardt (Eds.), Facts and models in hearing (pp. 353360). Heidelberg: Springer-Verlag. Tian, B., & Rauschecker, J. P. (1994). Processing frequency-modulate d sounds in the cat’s anterior auditory field. Journal of Neurophysiolog y, 71, 1959-1975. Verschuure, J., & van Meeteren, A. A. (1975). The effect of intensity on pitch. Acustica, 32, 33-44. Wightman, F. L., & Jenison, R. (1995). Auditory spatial layout. In W. Epstein & S. Rogers (Eds.), Perception of space and motion: Handbook of perception and cognition (pp. 365-400). San Diego: Academic Press. Zelick, R., Rose, G., & Rand, A. S. (1991). Differential response to frequency modulation rate and direction by the neotropical frog, Physalaemus pustulosus. Animal Behaviour, 42, 413-421. NOTES 1. We arrived at the 24-semitone range via pilot testing. Smaller ranges all failed to produce reasonable psychophysical functions because of ceiling effects (i.e., listeners’ indication of perceived pitch drop was limited by the maximum scale value). The initial pilot test had a range of 8 semitones, with the second discrete tone ranging from 4 semitones above to 4 semitones below the first. We then tried ranges of 8 semitones below and 16 semitones below the initial discrete tone. 2. Our goal here was not to provide practice at ignoring intensity and attending to frequency, but to demonstrate exactly what we meant by pitch change to any listeners who still might be unclear on the concept . (Manuscript received December 4, 2000; revision accepted for publication June 11, 2001.)