Pro-Poor Livestock Policy Initiative
International Farm Comparison Network (IFCN)
The Economics of Milk Production in Hanoi, Vietnam, with Particular Emphasis on Small-scale Producers Otto Garcia, Torsten Hemme, Luong Tat Nho and Hoang Thi Huong Tra
A Living from
Livestock
PPLPI Working Paper No. 33
TABLE OF CONTENTS Preface................................................................................................................ ii 1. Executive Summary........................................................................................... 1 Introduction ....................................................................................................... 1 Methodology ...................................................................................................... 1 Results ............................................................................................................. 1 Conclusions........................................................................................................ 3 2. Overview – Milk Production in Vietnam.................................................................... 5 Vietnam - Dairy in the Global Context........................................................................ 5 Recent Dairy Developments in Vietnam ...................................................................... 7 Recent Dairy Developments in Hanoi ......................................................................... 9 Natural Conditions and Herd Structure in Hanoi ...........................................................11 3. IFCN Analysis of Dairy Farms in Hanoi ....................................................................13 Description of the ‘Typical’ Farms in Hanoi ................................................................13 Farm Comparison: Household Approach .....................................................................15 Farm Comparison: Whole Farm Approach ...................................................................17 Farm Comparison: Dairy Enterprise Approach ..............................................................19 Sensitivity to Variation in Livestock and Heifer Prices ....................................................24 Sensitivity to Variation in Livestock and Heifer Prices ....................................................25 4. Analysis of the Dairy Chain in Hanoi ......................................................................27 Main Distribution Channels for Dairy Products in Hanoi...................................................27 Simplified Diagram of the Distribution Channels for the Domestic Milk in Hanoi.....................28 Margins in the Dairy Chains: Farmer to Consumer .........................................................29 5. Policy Analysis for Typical Dairy Farms in Hanoi........................................................31 Competitiveness Analysis ......................................................................................31 Analysis of Comparative Advantage ..........................................................................32 6. Conclusions ...................................................................................................34 Dairy Development in Vietnam................................................................................34 Dairy Farming in Hanoi .........................................................................................34 Dairy Chain in Hanoi ............................................................................................34 PAM Analysis for Typical Dairy Farms ........................................................................35 7. References ....................................................................................................36 A1 Methodological Background ................................................................................37 A2 IFCN Method: Costs of Production Calculations .........................................................39 Cost Calculation .................................................................................................39 Farm Economic Indicators (IFCN Method) ...................................................................41 A3 Description of IFCN Result Variables......................................................................42 Cost of Milk Production Only ..................................................................................42 A4 Distribution of Dairy animals in Vietnam.................................................................44 A5 Policy Analysis Matrix .......................................................................................45 Tradable Inputs..................................................................................................45 Domestic (Production) Factors ................................................................................46 A6 Dairy chain calculations ....................................................................................51
i
PREFACE This is the 33rd of a series of Working Papers prepared for the Pro-Poor Livestock Policy Initiative (PPLPI). The purpose of these papers is to explore issues related to livestock development in the context of poverty alleviation. Livestock is vital to the economies of many developing countries. For low income producers, livestock can serve as a vital source of food, store of wealth, provide draught power and organic fertiliser for crop production and a means of transport. Consumption of livestock and livestock products in developing countries, though starting from a low base, is growing rapidly. This study applies a method of economic analysis developed by the International Farm Comparison Network (IFCN) which is based on the concept of ‘typical farms’. Three farm types were selected to represent typical farms in the region of Hanoi, Vietnam. The farms were located in two villages near Hanoi (10 to 15 km away), benefiting from good market access. The farms kept two, four and five crossbred dairy cows and practiced stall-feeding. Each farm was analyzed in detail and assets, production costs, profits and other economic information are presented graphically and are described in the text. A policy analysis using the PAM methodology is carried out for each of the typical farms. Furthermore, a preliminary analysis of the dairy chain in Hanoi was conducted. We hope this paper will provide useful information to its readers and any feedback is welcome by the authors, PPLPI and the Livestock Information, Sector Analysis and Policy Branch (AGAL) of the Food and Agriculture Organization (FAO).
Disclaimer The designations employed and the presentation of material in this publication do not imply the expression of any opinion whatsoever on the part of the Food and Agriculture Organization of the United Nations concerning the legal status of any country, territory, city or area or its authorities or concerning the delimitations of its frontiers or boundaries. The opinions expressed are solely those of the author(s) and do not constitute in any way the official position of the FAO.
Authors Otto Garcia, PhD: Dairy economist, FAL-Federal Agricultural Research Centre, Germany. Torsten Hemme, PhD: Head IFCN Dairy, Dairy economist at FAL-Federal Agricultural Research Centre, Network management at Global Farm GbR, Germany. Luong Tat Nho, PhD: National Institute of Animal Husbandry, Department of Economics and Farming Systems, Hanoi, Vietnam. Hoang Thi Huong Tra, MSc.: National Institute of Animal Husbandry, Department of Economics and Farming Systems, Hanoi, Vietnam. The authors co-operate in the IFCN to analyse dairy farming systems world wide. For details contact
[email protected] or have a look on http://www.ifcnnetwork.org.
Keywords Milk production, Vietnam, Hanoi, Poverty Reduction, Dairy, Farm Economics, Policy. Date of publication: 13 February 2006
For more information visit the PPLPI website at: http://www.fao.org/ag/pplpi.html or contact: Joachim Otte - Programme Coordinator of the Pro-Poor Livestock Policy Facility Email:
[email protected] Tel: +39 06 57053634 Fax: +39 06 57055749 Food and Agriculture Organization - Animal Production and Health Division Viale delle Terme di Caracalla 00100 Rome, Italy
ii
1. EXECUTIVE SUMMARY Introduction The main purpose of this study was to gain insight into the household and farm economics of small-scale dairy farms in Hanoi, and to obtain estimates of the costs of milk production so as to gauge their potential for improvement, particularly through policy action, and vulnerability to international competition in a more closely interconnected world market. In order to ascertain possible developments in the dairy sector and to broadly identify areas of intervention that favour small-scale dairy producers, the study examines the potential to improve milk production of different farm types. A case study approach is used, the aim being to obtain qualitative insights rather than quantitative extrapolation.
Methodology The methodology applied for the economic analysis was developed by the International Farm Comparison Network (IFCN) and utilises the concept of typical farms. Farm types are determined by regional dairy experts which take into consideration (a) location of the farm, (b) farm size in terms of dairy herd size and (c) the production systems that make important contributions to milk production in the study region. Three farm types were selected for this study. The first type represents the common small-size farms (2 cows); the second category (4 cows) was chosen to represent the farm size that is closest to the statistical average, and finally, a third farm type was defined to represent larger and more progressive dairy farms (5 cows), allowing further exploration of potentials for economies of size in the region. Management levels on the typical farms are average to slightly above average compared to other farms of the same type. Data was collected using a standard questionnaire and a computer simulation model, TIPI-CAL (Technology Impact and Policy Impact Calculations), was used for biological and economic assessments. Furthermore, method testing exercises regarding the dairy chain and policies affecting the typical dairy farms were conducted. The methods tested are further explained in their corresponding sections and/or the annexes.
Results Milk production in Vietnam Vietnam has a relatively short tradition both in milk production and consumption of dairy products. However, from 1996 to 2002, milk production increased three-fold to reach 78,450 tons. This growth over just six years is mainly attributed to a strong increase in the domestic demand of dairy products coupled with very supportive policies directed at the development of the domestic dairy sector. The average milk yield per dairy animal increased by 35 percent over the last six years, but the largest relative increase was recorded for the number of dairy animals, which grew by 360 percent. Over 60 percent of the dairy animals are found in the North-East-South region (see the map in Annex A4), which includes Ho Chi Minh City, while the area around Hanoi accounts for about 3.5 percent of the dairy herd. Vietnam contributes barely 0.01 percent to total world milk production although the national herd (cattle and buffaloes) amounts to nearly 75 percent of the total number of cattle in New Zealand. The average dairy cow in Vietnam yields as much milk as four cows in India, mainly due to better dairy genetics and management. Milk prices are 20 percent higher than in New Zealand and just over half of those in Germany.
1
1. Executive Summary
Analysis of ‘typical farms’ in the area of Hanoi, Vietnam Based on the IFCN methodology, three farm types were identified as ‘typical’ and were subjected to detailed analyses. A small dairy farm, VN-2 (2 crossbred cows and 0.47 ha of land, planting Maize as cash crop), a medium-size farm, VN-4 (4 crossbred cows and 0.43 ha land with no cash crops), and a ‘progressive’ farm, VN-5 (5 crossbred cows and 0.36 ha land with no cash crops), which represents the more commerciallymanaged dairy systems in the area. The selected farm types closely match the 2001 national statistics on farm structures, which show that about 98 percent of the dairy farms held 5 or less cows.
Dairy production systems Despite the importations of purebred dairy animals, crossbred dairy animals represent the vast majority of the dairy cows. The popular breeds for crossing are Holstein Frisian, Red Sindhi and the Yellow Cattle. The farms are managed by the farm family. Feeding practices are very diverse. However, the farms usually use public land (1) to cut-and-carry grass to the stall-tied animals, (2) to graze cattle in the (peak natural grasses) growing season, and (3) to tie animals under trees along the Red River during the hottest hours of the summer days. Farms VN-2 and VN-4 grow Elephant grass on rented land while VN-5 relies on natural grasses. Feed rations are primarily based on agricultural by-products such as rice bran, broken rice, grasses, rice straw, and maize leaves. Protein and commercial mix feeds are also used differently among the farm types. While the two smaller farms use a commercial feed mix, the larger farm relies on soybean and by-products from the beer industry. All farms feed mineral mixes and pulse meals when available.
Household comparison Farm families have between 4 and 6 members, which is typical in the region. Family labour utilisation in off-farm activities increases with farm size. Total annual household incomes range from 1,570 to 5,350 US$. Non-cash benefits are more relevant for the smaller farms (over 13 percent of VN-2 total income). Net cash farm incomes account for 83 to 58 percent of the household incomes for farms VN-2 and VN-5 respectively. All farms are able to cover the family living expenses and make a profit.
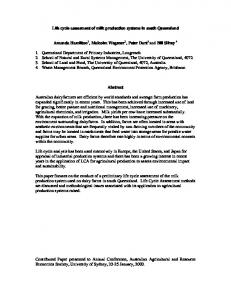
Whole farm comparison Farm returns range from 2,700 to 7,200 US$ per year. Interestingly, the small farm is the only one having cash crops. The net cash farm income closely follows the farm returns and varies from 1,135 to 2,785 US$/year. All farms have high profit margins of 38 to 42 percent.
Comparison of the dairy enterprise - Costs of milk production Cost of milk production varies from 11.5 to 17.0 US$ per 100 kg ECM. The average-size farm, VN-4, has the lowest costs (11.5 US$), which is mainly due to lower labour costs for family labour and lower costs for means of production. The returns per 100 kg milk range from 27 to 39 US$. Differences in milk returns can be explained by price differences with the large farm selling directly to a milk processing company. The results indicate that expanding VN-2 to VN-4 may decrease milk production costs by 2 US$/100 kg ECM, if conditions do not change. The potential effects of economies of scale seem to be determined by land and labour cost components.
2
1. Executive Summary
Dairy chain in Hanoi Between 90 and 95 percent of the milk marketed in the region of Hanoi is captured by the formal sector, which basically consists of two large processors, Vinamilk and Hanoi Milk. Despite the dominance of the formal sector, an informal sector, which consists of small milk shops, does exist. These shops market 5 to 10 percent of the region’s fresh milk volume and sell either directly to consumers or to retailers, both within the city of Hanoi. Producer milk prices are similar in both sectors (0.197 US$/kg). However, the consumer price is almost 1.5 times higher in the formal sector, which pasteurises, adds sugar, packs and distributes its fluid milk products. The margins in processing and retailing are 0.43 and 0.24 US$/kg milk for the formal and informal channels respectively.
PAM results for the three dairy farm types The PAM results show that at market prices the studied farm types are highly profitable for their owners (3.0 to 9.5 US$/100 kg milk), while applying social prices they barely break even, with the small farm even operating at a social loss. The larger farms make the biggest private profit, do not incur a social loss, and capture the highest level of public support. On the other hand, the larger farms’ profits are reduced by taxes on inputs (feeds). A set of PAM ratios shows that farm outputs are supported and inputs are taxed by 21.5 and 20.0 percent respectively. The net result is that all farms benefit significantly from current policies and market conditions and about 24 percent of the private returns of the farms come from external support. Public support (private profits minus social profits) for the farms ranges from 6.0 US$/100 kg milk for the smallest to 9.5 US$/100 kg milk to the largest farm. The high level of support is a clear indicator of a high degree of imperfection in the Vietnamese dairy market. Consequently, there should be potential for increasing production and competitiveness through policy measures.
Conclusions Several key conclusions can be drawn from this study: 1- In the last decade, the Vietnamese economy has achieved remarkable growth. The dairy sector tripled its output in the period between 1996 and 2002. Driving the growth of the dairy sector are an increasingly strong demand for dairy products (from a growing population and increasing per capita purchasing power) and a very supportive set of development policies affecting stakeholders throughout the dairy chain (producer-consumer). 2- This study identifies substantial potential on both the demand and production side for the sector to continue its fast development. On the demand side, Vietnamese consumers pay as high prices (0.63 US$/lt.) for fluid milk as European consumers pay for similar products. More affordable dairy products in Viet Nam are very likely to further boost per capita consumption, contributing to a healthier workforce. On the production side, the government, through its diversification strategy, has supported dairy farming to great extent. This study finds that Vietnamese dairy farms belong to both (a) the world’s low cost milk producers (97%). Other farm activities refer to returns from selling/using cow manure and heifer raising in the case of VN-2.
Net cash farm income (NCFI) The net cash farm income mainly follows farm returns and ranges from 1,135 to 2,785 US$/year. With 42 percent the profit margin of the smaller farm is slightly higher than that of other two farms where it lies around 38 percent.
Farm assets Asset values range from 5,000 to 15,000 US$. On the whole farm basis, the dairy animals are the most important assets representing between 75 to 85 percent of the farms’ asset pool. Others assets refer to machinery, buildings and cash-in-hand.
Explanations of variables; year and sources of data: •
Total returns: All cash receipts minus the balance of inventory (for example livestock).
•
Returns to dairy: Milk, cull cows, heifers, calves, sale and use of manure, draught power, etc.
•
Cash crops: Sale of surplus crops like rice, wheat, etc.
•
Net cash farm income (NCFI): Cash receipts minus cash expenses of the farm.
•
Profit margin: Net cash farm income divided by total farm returns.
•
Farm assets: All assets related to the farm (land, cattle, machinery, buildings, etc.)
•
Sources of Data: IFCN database, expert estimations, and statistics, year 2003.
17
3. IFCN Analysis of Dairy Farms in Hanoi
Return Structure
Total Returns of the Farm 8
100%
7
90% 80%
1000 US$
6
70%
5
60%
4
50%
3
40%
Other Farm Activities Crops Dairy
30%
2
20%
1
10%
0
0% VN-2
VN-4
VN-5
VN-2
Net Cash Farm Income (NCFI) 3,00 2,75 2,50 2,25 2,00 1,75 1,50 1,25 1,00 0,75 0,50 0,25 0,00
VN-5
Profit Margin 45% 40% 35%
1000 US$
30% 25% 20% 15% 10% 5% 0% VN-2
VN-4
VN-2
VN-5
Farm Assets
VN-4
VN-5
Asset Structure 100% 90% 80% 70% 60%
20 18 15 1000 US$
VN-4
13 10
50% 40% 30% 20% 10% 0%
8 5 3 0 VN-2
VN-4
Farm Types
VN-5
Cattle
VN-2
Others
VN-4
VN-5
Farm Types
18
3. IFCN Analysis of Dairy Farms in Hanoi
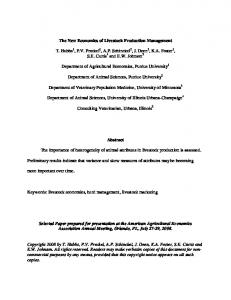
Farm Comparison: Dairy Enterprise Approach Cost of milk production The cost of milk production ranges from 11.5 to 17.0 US$ per 100 Kg ECM. VN-4’s low cost (11.5 US$) is due to both low labour cost of family labour and low costs of means of production.
Return structure The returns are 27, 29.5 and 39 US$ per 100 kg milk for VN-2, VN-4 and VN-5 respectively. Differences in milk returns can be explained by differences in the price of milk due to VN-5 selling directly to a milk processing company, the farmer being a milk intermediary himself. Non-milk returns result from selling livestock and/or using manure for bio-gas and as fertiliser (shown here as Other Returns).
Cost structure of the dairy enterprise In the small farm type the land costs are 2 to 4 times those of the larger farms while its labour costs are almost at the level of the largest farm. These cost items largely explain VN-2 having higher costs than VN-4 (23.5 and 21.5 US$/100 kg ECM) while they both have similar cash costs. The larger farm costs reach 29 US$/100 kg ECM as its feed costs are significantly higher than those of the other two farms. The observed land and labour economies indicate that expanding VN-2 into VN-4 may decrease milk production costs by 2 US$/100 kg ECM, provided other conditions remain unchanged.
Explanations of variables; year and sources of data: •
Costs of milk production : see Annex A2
•
Return structure and cost structure: see Annex A3
•
Sources of data: IFCN database, expert estimates, and statistics, year 2003.
19
3. IFCN Analysis of Dairy Farms in Hanoi
Return Structure
Costs of Milk Production Only
Cattle Sales Other Returns Milk Returns
45
45
40
40
35
35
30
30
US $/ 100 Kg ECM
US $/ 100 Kg ECM
Opportunity Cost Other Costs- Non Milk Returns Milk Price
25 20 15
25 20 15
10
10
5
5
0
0 VN-2
VN-4
VN-2
VN-5
Depreciation Cash Costs 35
30
30
25
25 US $/ 100 Kg ECM
US $/ 100 Kg ECM
Opportunity Costs
Other Means of Production Land Costs Capital Costs Labour Costs Purchased Feed
20 15
20 15
10
10
5
5
0
0 VN-2
VN-4
Farm Types
VN-5
Cash/ Non-Cash Cost Structure
Costs Items Structure
35
VN-4
VN-5
VN-2
VN-4
VN-5
Farm Types
20
3. IFCN Analysis of Dairy Farms in Hanoi
Dairy farm income All four farm types cover their costs from the profit and loss account and generate a positive farm income. The income ranges from about 8.5 (for VN-2) to 16 US$/100 kg milk (VN-5).
Dairy profit margin All farms have positive and relative high dairy profit margins, which lie between 46 and 59 percent. Interestingly, VN-2 and VN-5 have similar profit margins. These are due to lower costs for VN-2 and high milk prices for VN-5. The high profit margin for VN-4 is mainly due to the low input of family labour and its relatively lower costs of means of production.
Entrepreneurial profit All the farms cover their full economic costs and generate an entrepreneurial profit of 2.25 to 9.0 US$/100 kg ECM. While an entrepreneurial profit of 2.25 US$ per 100 kg ECM is consider excellent by international comparison, the profits of 7.5 and 9.0 US$ per 100 kg ECM the two larger farms are exceptionally high.
Return to labour All farms have higher returns to labour (wage level earned by working on the dairy farm) than the local wage level and these follow the same trend as the entrepreneur’s profits. Thus household members would obtain higher returns by increasing dairy farm output than by taking up off-farm employment in the area. The wage level around VN-5 (Thanh Tri District) is significantly higher than in the villages of VN-2 and VN-4 due to higher demand for labour, which increases the opportunity costs of family labour used for dairy farming.
Explanations of variables; year and sources of data: •
Explanations variables and IFCN method: see Annex A2 and A3
•
Other returns: Value of manure (sold, home use); draught power use
•
Sources of data: IFCN database, expert estimations, and statistics, year 2003.
21
3. IFCN Analysis of Dairy Farms in Hanoi
Farm Income
Profit Margin
18
60% 55%
16
50% 14 45% 40%
US $/ 100 Kg ECM
12
35%
10
30% 8
25% 20%
6
15% 4 10% 2
5%
0
0% VN-2
VN-4
VN-2
VN-5
Entrepreneurs Profit
VN-4
VN-5
Return to labour 0,7
10
0,6
Wage Level Return To Labour
8
6 US$/ hr
US $/ 100 Kg ECM
0,5
0,4
0,3
4 0,2 2 0,1
0
0 VN-2
VN-4
Farm Types
VN-5
VN-2
VN-4
VN-5
Farm Types
22
3. IFCN Analysis of Dairy Farms in Hanoi
Labour costs VN-2 requires 1.6 times the (family) labour input per dairy animal as VN-4 and labour costs per 100 kg ECM maintain the same relation of 1.6 to 1 between VN-2 and VN-4. With respect to VN-5, VN-2 uses about 1.5 times the labour input per animal, but due differences in the local wages, VN-2 labour costs are only 0.95 those of VN-5. During the grazing season, a person can easily care for more than 2 dairy animals without requiring extra time input. Therefore, VN-2’s high labour input could be dramatically lowered by increasing herd size or joining into a cooperative grazing arrangement with similar small farmers, sharing the time used for grazing supervision.
Capital costs The capital costs per dairy animal are highest in the largest farm, whereas in terms of capital costs per 100 kg ECM produced, capital input is highest in the medium-sized farm. This is the case because VN-4 has a loan double to that of VN-2; while VN-5 has no loan to repay.
Land costs and ‘stocking rates’ Land costs for VN-2 to produce 100 kg ECM are 2 and almost 3 times the costs incurred by VN-4 and VN-5 to produce the same amount of milk output. Furthermore, VN-4 land costs are 1.35 times those of VN-5, which further indicates that economies of scale might operate in the reduction of land costs for these farms. Notice that land costs per 100 kg ECM are inversely related to stocking rates and that even VN-4 only has two-thirds the stocking rate of VN-5. VN-2 has the lowest stocking rate with only half and one-third of the number of dairy animals per ha compared to VN-4 and VN-5.
Explanations of variables; year and sources of data: •
Explanations variables and IFCN method: see Annex A2 and A3
•
Stocking rates: the number of dairy (adult) cows/land (ha) allocated to the dairy enterprise only.
23
3. IFCN Analysis of Dairy Farms in Hanoi
Labour Input per Dairy Animal
Labour Costs 6,0
1400
US $/ 100 Kg ECM
Hours/ head/ year
1200 1000 800 600 400
4,5
3,0
Costs of Family Labour 1,5
Wages Paid
200 0,0
0
VN-2
VN-4
VN-2
VN-5
VN-5
Capital Costs
Capital Input per Dairy Animal 3000
4,0 3,5 US$/ 100 Kg ECM
2500 US$/ Head
2000 1500 1000 500
3,0 2,5 2,0 1,5 1,0 0,5
0
0,0 VN-2
VN-4
VN-5
VN-2
Land Costs
VN-4
VN-5
Stocking Rate 15,0
5 4,5
12,5
4 3,5
Calc. Rents f. own land Land Rents Paid
3 2,5 2 1,5 1
Dairy Cow/ ha
US$/ 100 Kg ECM
VN-4
10,0 7,5 5,0 2,5
0,5 0
0,0 VN-2
VN-4
Farm Types
VN-5
VN-2
VN-4
VN-5
Farm Types
24
3. IFCN Analysis of Dairy Farms in Hanoi
Sensitivity to Variation in Livestock and Heifer Prices Heifer prices were a record high during 2003 and showed a decreasing trend by the time this report was being finalized. Therefore, this section aims at assessing the impact of declining beef and heifer prices on the farm returns, costs of milk production, and return to labour of the dairy enterprise. In order to simplify the exercise, we chose one farm, VN-4, and three scenarios. (See abbreviations and scenario descriptions in the box below)
Dairy farm returns A decline of beef and heifer prices by 20 percent lowers the dairy farm returns for VN4 by 7 percent. This relatively low impact can be explained by the fact that VN-4 only made 34 percent of its dairy returns from cattle (beef and heifer) sales. Furthermore, of this 7 percent decrease, 5 percent (or 70% of the total variation) are due to changes in the heifer price only. In 2004, heifer prices decreased by 8 percent. Applying this more moderate price decrease, dairy farm returns decrease by only 2 percent (from 29.5 to 28.9 US$ / 100 kg ECM).
Cost of milk production only Lowering beef and heifer prices by 20 percent increases the costs of milk production by 15 percent. This can be explained by the IFCN methodology, which benchmarks costs of milk production ONLY. For this, all non-milk returns are deducted from the total (cash) costs of producing milk. Note that VN-4 has returns from manure used / sold as fertilizer. Applying the 2004-heifer prices, the ‘cost milk production only’ increases by merely 5 percent.
Return to labour (in the dairy enterprise only) A decline in beef and heifer prices by 20 percent has a reduces the return to labour imputed for the dairy farm by 17 percent. With 2004-heifer prices, the return to labour in VN-4 decreases by 5 percent. Conclusion: The 8 percent decrease in heifer prices from 2003 to 2004 only has a minor impact on farm returns (-2%), costs of milk production (+5%) and return to labour (-5%). Furthermore, heifer prices can be expected to remain high given a strong demand from (a) herd size expansion of current dairy farms, and (b) poultry producers switching to dairy production as a reaction to the current avian influenza epidemic.
Explanations of variables; year and sources of data: •
VN-4 SQ: VN-4 Status Quo.
•
BH -20: Beef & heifer prices decreased by 20 percent.
•
H -20: Only heifer prices (only) decreased by 20 percent. Beef prices and livestock asset valuation kept as in status quo.
•
H –8: Only heifer prices decreased by 8%, which corresponds to the estimated 2004-heifer-price level. Beef prices and livestock asset valuation kept as in status quo.
25
3. IFCN Analysis of Dairy Farms in Hanoi
Costs & Returns of the Dairy Farm
Variation from the Status Quo level
Dairy Farm Costs Dairy Farm Returns
US$/ 100 Kg ECM
Dairy Farm Returns 35
0%
30
-1%
25
-2% -0.02 -3%
20
-4% 15 -5% 10
-0.05
-6%
5
-7%
0
-8% VN-4 SQ
BH -20
H -20
H -8
-0.07 VN-4 SQ
Costs of Milk Production (Only)
H -20
H -8
Variation from the Status Quo level
Oppo rtunity co sts
Costs of Milk Prod (Only)
To tal co sts fro m P &L acco unt - no n milk returns
18%
M ilk price
25
0.15
16% 14%
20 US$/ 100 Kg ECM
BH -20
0.13
12% 15
10% 8%
10
6%
0.05
4%
5
2% 0
0% VN-4 SQ
BH -20
H -20
H -8
VN-4 SQ
Return to Labour
BH -20
H -20
H -8
Variation from the Status Quo level
Return on labour input (per h)
Return to Labour
Local farm w age
0%
0.6 -2% 0.5
-4% -6%
US$/ hr
0.4
-0.05
-8% 0.3
-10% -12%
0.2
-14% 0.1
-0.14
-16% -0.17
-18%
0 VN-4 SQ
BH -20
H -20
H -8
VN-4 SQ
BH -20
H -20
H -8
26
4. ANALYSIS OF THE DAIRY CHAIN IN HANOI Main Distribution Channels for Dairy Products in Hanoi While in India and Pakistan’s urban centres, the formal sector only handles a small share of the domestic milk production, the formal processors around Hanoi handle the bulk of the local production. This dominance of the formal sector in Hanoi can be explained to a large extent by the following characteristics of dairy development in the area: 1- From very early on, the formal dairy processing sector has been a driving force in the promotion of dairy farming in the region. 2- The major dairy processors have established numerous milk collection centres, reaching most, if not all, small producers in the region. 3- Small dairy farmers consume very little of (unlike dairy farmers consumption and only in
normally produce milk for the (cash) market since they their own milk. This makes them very market-oriented in India and Pakistan who produce mainly for selfthe second instance for the market)
The diagram on the next page depicts a simplified version of the main milk marketing channels in the formal and informal sectors in Hanoi. It is estimated that 90 to 95 percent of the milk produced in and around Hanoi is captured by the formal sector, which consists of two major dairy processors, Vinamilk and Hanoi Milk. These processors partner with local co-operatives and/or individuals, both of which act as milk collection centres. Despite the large share of the formal sector, an informal sector, which consists of small milk shops, does exist. These shops handle 5 to 10 percent of the region’s fresh milk volume and sell either directly to consumers or to retailers, both within the city of Hanoi. The formal sector uses the bulk of the milk to produce various types of liquid milks, which are pasteurised and packed in plastic or tetra pack containers. The formal sector also produces condensed milks, yoghurts, UHT and powder milk. It is estimated that about 84 percent of the formal sector’s dairy products are made from imported milk. Regarding packaging of the formal sector’s products, retail shops normally offer most liquid milks in 200 to 300 ml plastic or tetra-pack containers. Larger food stores, which are significantly fewer, hold milk in larger containers of up to 1 litre. The informal sector normally sells fresh milk and yoghurt. These products compete well in price since they are produced from local milk using household labour and simple packaging. It is estimated that with increases in income, consumers will prefer higher quality dairy products, which will pose a major challenge to the informal sector.
27
4. Analysis of the Dairy Chain in Hanoi
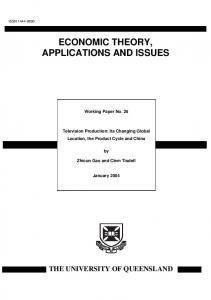
Simplified Diagram of the Distribution Channels for the Domestic Milk in Hanoi Formal sector 90 - 95% share
Informal sector 5-10% share Milk from dairy farmers
Collecting centres 80% share
1% share
Retailers 4% share Middlemen 15% share
Milk companies
Retailers/distributors
Consumers
Source: Personal communication Mr. Bui Tuan Khai - Director of the Dairy Milk Production Project in Hanoi, February, 2004.
28
4. Analysis of The Dairy Chain in Hanoi
Margins in the Dairy Chains: Farmer to Consumer In this section, the margins in the dairy chains around the city of Hanoi are analysed. For the sake of practicality and comparability between dairy chains, calculations are based on the assumption of the various dairy chains purchasing one kg of noncorrected milk, processing it into their most popular (fluid) milk product, and selling it to the end-consumer. Although prices were available, details about processing were impossible to obtain. Therefore the calculations are based on assumptions derived from the authors’ knowledge of dairy processing for similar products (details in Annex A6). Consequently, the calculations should be regarded merely as an exploratory exercise intended to support other sections of this study rather than as a definitive assessment.
The dairy chains Fresh Milk (8.3 % Sugar): Processors buy milk at 3.7 percent fat and sell it pasteurized, sweetened and packed at 3.45 percent fat. Fresh Milk (whole): Dairy farmers boil their fresh milk and deliver it directly to consumers’ homes at 3.7 percent fat.
Input costs of the dairy chains Each chain buys 1 kg fresh milk at 3.7 percent fat. The farmer milk prices are centrally fixed at 0.197 US$/kg of milk with 3.7 percent fat for both sectors. Only the formal sector adds sugar (8.3% on volume basis), at the current cost of 0.036 US$/kg.
Returns of the dairy chains The returns per kg of milk are 0.63 and 0.44 US$ for the formal and informal chains respectively. While the formal chain makes a 43 percent higher return than the informal chain, the average consumer price is 30 percent higher for the milk product in the formal sector (0.60 and 0.46 US$/kg milk for the formal and informal sectors). This difference in returns is largely attributable to the formal sector’s higher consumer prices due to better milk quality through pasteurisation, sweetening and packaging, leading to longer product shelf life.
Margins in processing and retailing (returns minus cost of inputs) The margins attained from processing and retailing are 0.43 and 0.24 US$/kg milk for the formal and informal chains respectively. Thus, the formal chain has a margin 1.8 times that of the informal chain. Although the informal chain in Vietnam has the relatively lower margin of 0.24 US$/kg milk, this still is 2 and 1.5 times the margin obtained by milkmen in Punjab, Pakistan and the sweet shops in Sirajganj, Bangladesh. Vietnamese dairy companies’ margins of 0.43 are within the levels obtained by European dairy chains (0.30 – 0.50 US$/kg).
Farmers’ shares Farmers’ shares in end consumer prices are 31 and 45 percent in the formal and informal chains. These values are similar to those found in other countries and highlight the capacity of the formal sector to add value to milk, which, in turn, tends to decrease farmers’ shares in consumer prices when compared to the informal sector. Explanations of variables; year and sources of data: •
For more details on the diary chain calculations, see Annex A6.
29
4. Analysis of the Dairy Chain in Hanoi
Input costs of the Dairy Chain Basis 1 kg milk from the farmer
Returns of the Dairy Chain Basis 1 kg milk from the farmer
0,6
0,7
0,6
0,5
0,5
Farmers' Milk
Other Inputs
0,3
US/ kg Milk
US/ kg Milk
0,4 0,4
0,3
0,2 0,2 0,1
0,1
0,0
0,0 Fresh Milk (8.3% sugar)
Fresh Milk (whole)
Fresh Milk (8.3% sugar)
Margins and Farmers Shares
US$/ Kg
Margins for Processing and Retailing 0,50
100%
0,45
90%
0,40
80%
0,35
70%
0,30
60%
0,25
50%
0,20
40%
0,15
30%
0,10
20%
0,05
10%
0,00
0% Fresh Milk (8.3% sugar)
Fresh Milk (whole)
Fresh Milk (whole)
Margins for processing/ retailing Farmers Milk Price
Fresh Milk (8.3% sugar)
Fresh Milk (whole)
30
5. POLICY ANALYSIS FOR TYPICAL DAIRY FARMS IN HANOI The policy analysis matrix (PAM), developed by Monke & Pearson (1989), was used as an instrument for empirical analysis of the impact of Vietnam’s agricultural policy on typical farms and the dairy sector. Through the use of the PAM, it is possible to quantify the impacts of applied policy measures and market structures on commodity systems. This quantification is based on the comparison of ‘private prices’, which are the actual farm gate prices, with ‘social prices’, which can be understood as those prices that would prevail if markets were not influenced by policy measures and other distorting market structures. The PAM approach is employed because of its simple and understandable nature, particularly for policy makers. The following results were produced with a policy tool, within the IFCN model, whose development is part of an ongoing PhD project∗. For more details on the methodology and data, please refer to Annex A5.
Competitiveness Analysis Considering the costs of all family resources at market prices, all of the dairy farms are highly profitable since they make entrepreneurial profits ranging from 3 to 9 US$/ 100 kg milk for the smallest and largest farms respectively. Applying social prices, the smallest farm makes a loss of 2.8 US$/ 100 kg milk, which is attributable to the high input of labour and borrowed capital, both heavily subsidized, as compared to the other farms. VN-4’s low labour and capital use result in the highest profit at social prices. The combination of high private profits (largely effected by current policies) with either social losses or low profits after accounting for the effects of current policies) indicate that these farming systems are greatly benefiting from existing protective policies and market distortions. The divergence between private and social profits results from the ‘transfers’ to these farms to keep them operating at the current levels of private profit. The support received ranges from 5.7 to 9.4 US$/100 kg milk for the smallest to the largest farm respectively. Support is provided through output prices that are higher than world market levels as well as through artificially lowered prices for labour and capital. For VN-2, for example, gross support amounts to 7.3 US$/ 100 kg milk. However, as the government taxes tradable inputs, net support is reduced to 5.7 US$/ 100 kg milk. The ‘high’ prices for tradable inputs are mostly a result of import duties on feed. Note that the support through output prices is highest for the larger farm due to the higher milk price. The larger the farm, the more benefits it captures from output price protection and subsidization of the use of labour and capital. It is also true that the larger farms pay more taxes on inputs (3.2 US$ for VN-5), but overall the net result is that larger farms benefit more the existing policies than smaller farms.
∗ Stoll, J. (2005). Development and Application of Methods to Measure the Influence of Agricultural Policy on Farms – An Extension of the IFCN-Model. Discussion Paper N° 19, Institute of Agribusiness, Giessen.
31
5. Policy Analysis for Typical Dairy Farms in Hanoi
Table 5.1 Competitiveness analysis of typical dairy farms (US$1/100 kg ECM) Costs Farm type VN-2
Prices
Returns
Tradables
Factors
Profit
Private
26.9
9.8
13.9
3.2
Social
23.0
8.2
17.4
-2.8
3.9
1.6
-3.4
5.7
Private
29.8
12.1
9.7
8.1
Social
24.2
10.1
13.7
0.4
5.6
1.9
-4.0
7.7
Private
39.0
18.1
11.4
9.5
Social
31.4
15.0
16.4
0.0
7.6
3.2
-5.0
9.4
Divergence VN-4
Divergence
VN-5
Divergence 1
Exchange rate: 1 US$ = 16,607 VN Dong
Analysis of Comparative Advantage An important application of the PAM is the possibility to compare different production systems nationally and internationally. The necessary information is derived by taking the ratios of several result-identities of the PAM. These ratios provide information about the comparative advantage and the level of protection of the different production systems. The following ratios were selected to assess the comparative advantage of the Vietnamese dairy farms: The Private Cost Ratio (PCR) is an indicator for comparative competitiveness. The ratio indicates how much the production system of interest can afford to pay for the domestic factors of production and still remain competitive. The results for this ratio show that dairy farming is profitable for the farmers as they produce more valueadded than their domestic resources cost. In other words, from the milk returns the farmers can pay for all tradable inputs and are still left with 54 to 82 percent of the returns to pay for the domestic resources used (which leaves high profits). The Domestic Resource Cost Ratio (DRC) is like the PCR but calculated at social prices. Because the DRC considers the true cost of domestic factors (after eliminating the effects of policies), it is an excellent indicator of the efficiency with which domestic resources are utilized by a system to produce value-added. DRCs below 1 indicate a comparative advantage of a system. Of the farms studied, only the two larger ones have high enough returns to pay the tradable inputs and the full value of domestic factors. VN-2’s high DRC is mainly due to the relatively high use of subsidized capital (loan), which ultimately means that without external support this farm would have great difficulties to survive. The Nominal Protection Coefficients for Outputs and Inputs (NPCO and NPCI). These coefficients show that the producers are protected with respect to their outputs (NPCO>1) while they are paying taxes for the inputs (NPCI>1). Policy distortions and market conditions result in the market prices of outputs and inputs to be respectively around 21.5 and 20.0 percent higher than they would be under free market conditions.
32
5. Policy Analysis for Typical Dairy Farms in Hanoi
The Effective Protection Coefficient (EPC). The EPCs for all three farm types are well above 1, which indicates that the effect of protecting output prices is greater than that of taxing tradable inputs. (Note that the EPC does not consider the cost of domestic factors.) The Producer Support Estimate (PSE) indicates the proportion of the private farm returns that are due to policy interventions. For instance, a PSE of 0.24 for VN-5 indicates that for each US$ of farm returns, 24 cents are provided by farm support policies.
Table 5.2 Summary of PAM ratios for typical farms in Vietnam Farm type PAM Ratio/Indicator
1
1
VN-2
VN-4
VN-5
PCR
0.82
0.54
0.55
DRC
1.17
0.97
1.00
NPCO
1.17
1.23
1.24
NPCI
1.19
1.20
1.21
EPC
1.16
1.26
1.27
PSE
0.21
0.26
0.24
See Annex A5 for the explanations of indicators
33
6. CONCLUSIONS Dairy Development in Vietnam Between 1996 and 2002, milk production in Vietnam tripled, reaching a volume of 78,450 tons in 2002. This development, over just six years, is mainly attributable to a strong increase in the domestic demand for dairy products coupled with very supportive policies directed at the development of the domestic dairy sector. The average milk yield per dairy animal also increased by 35 percent over the last six years, but it is the number of dairy animals, which has made the biggest increase, rising by 360 percent. Over 60 percent of these dairy animals are found in the North East South region, which includes Ho Chi Minh City, while Hanoi accounts for about 3.5 percent only.
Dairy Farming in Hanoi Total annual household incomes range from 1,570 to 5,350 US$. Non-cash benefits are more relevant for the smaller farms (over 13 percent of VN-2’s total income) When non-cash benefits are included, the net cash farm incomes account for 83 to 58 percent of the household incomes for farms VN-2 and VN-5 respectively. Total annual farm returns range from 2,700 to 7,200 US$ and the net cash farm income follows a similar trend, ranging from 1,135 to 2,785 US$. All farms have excellent profit margins of around 40 percent. The cost of milk production varies between 11.5 and 17.0 US$ per 100 kg ECM. The average-sized farm, VN-4, has the lowest costs (11.5 US$), which is mainly due to its low labour costs for family labour and low costs for means of production. The returns per 100 kg milk vary between 27 and 39 US$. The differences in milk returns are due to price differences with the large farm selling directly to milk retail shops in Hanoi and the milk processing company. The results seem to indicate that expanding VN-2 into VN-4 may reduce production costs of milk production by 2 US$/ 100 kg ECM, provided other factors remain equal. These potential effects of economies of scale appear to be driven by the land and labour cost components.
Dairy Chain in Hanoi Between 90 and 95 percent of the milk marketed in the region of Hanoi is captured by the formal sector, which mean basically by the two largest processors, Vinamilk and Hanoi Milk. Despite the large share of the formal sector, an informal sector, which consists of small milk shops, does exist. These shops deal with 5 to 10 percent of the region’s fresh milk (in volume terms) and sell either directly to the end-consumer or to other retailers, both within the city of Hanoi. Producer milk prices are similar in both sectors (0.197 US$/ kg). However, the consumer price is 1.44 times greater in the formal sector, which pasteurises, adds sugar, packs and distributes its most popular fluid milk product. The margins attained from processing and retailing are 0.43 and 0.24 US$/kg milk in the formal and informal sectors. As a result of the ‘value-adding’, farmers’ shares in the final consumer prices are 31 and 45 percent in the formal and informal sectors. These findings are consistent with previous results from similar exercises, which highlight the formal sector’s high 34
Conclusions
capability to add value to milk, which, in turn, tends to decrease farmers’ shares in the consumer prices when compared to the informal sector.
PAM Analysis for Typical Dairy Farms The PAM results show that at prevailing market prices Vietnamese dairy farms are to be highly profitable for their owners (3.0 to 9.5 US$/100 kg milk), while, using ‘social’ prices they would barely break even. The smaller farm type would even make a loss. All three farm types analyzed receive public support, ranging from 6.0 to 9.5 US$/100 kg milk for the smallest to the largest farm respectively. Hence larger farms make bigger private profits and capture higher levels of support. On the other hand, the larger farms’ private profits are reduced by paying more taxes on tradable inputs (feeds). A set of PAM ratios shows that farm outputs are supported and tradable inputs are taxed by 21.5 and 20.0 percent respectively. The net result is that farms benefit significantly from current policies and market conditions and about 24 percent of the private returns result from external support. These high support levels (private profits minus social profits) clearly demonstrate a high degree of imperfection in the Vietnamese dairy market, and consequently there should be significant potential for increasing production and competitiveness through policy measures.
35
7. REFERENCES Hemme, T., Garcia, O. and Saha, A. (2003) A review of milk production in India with particular emphasis on small-scale producers. FAO- PPLPI, Rome, Italy. Khai, T. B. (2004) Director of Hanoi Dairy Project. Personal Communication. Marsh, S. P., & MacAulay, G. T., Land reform and the development of commercial agriculture in Vietnam: policy and issues, Agribusiness Review - Vol.10 2002, Section 2.1 (2002), citing Decree No.17/1999/ND-CP (1999), p 15. Ministry of Agriculture and Rural Development (MARD). (2003) Development of dairy and beef cattle in Vietnam. Agricultural Department. Unpublished report. In Vietnamese language. Ministry of Agriculture and Rural Development (MARD). (2004) Livestock production development from 1990 – 2003 and orientation and solution for 2010. Agricultural Department. Unpublished report. In Vietnamese language. Nguyet, N. T. M. (2001) Development of Hanoi Dairy Cattle Project. Journal of Sciences Activities No. 9. In Vietnamese language. Results of the 2001 Rural, Agricultural and Fishery census. (2003) General Statistic Office (GSO). Statistical data of dairy milk production in Hanoi. 2004. General Statistical Office (GSO). Sullivan, M., Tien, N. M., Que, N. N., Tuan, H. H. (2002) The development potential of the Vietnamese Dairy sector in the context of the World Trade Organization and Trade Liberalization. Report of Multilateral Trade Policy Assistace Programme (MUTRAP). Tuyen, D. K., Giao, H. K. (2002) Dairy Cattle Production in Vietnam and Development Plan for 2002-2010. In: 2010 trends of animal production in Vietnam. Proceedings of the workshop organized by NIAH and CIRAD. Hanoi, October 24-25, 2002. Other sources used appear at the page bottom where the data is presented
II
36
A1
METHODOLOGICAL BACKGROUND This chapter presents the methods and sources of information used to collect data about the dairy sector in Hanoi and how the costs of production for the selected typical production systems are calculated. This project has followed the framework used by the International Farm Comparison Network (IFCN). IFCN is a world-wide association of agricultural researchers, advisors and farmers. These participants select typical agricultural systems in key production regions in their individual countries. In 2004, the number of participating countries extended to 31 countries with 86 farm types that represent more than 70 percent of the world milk production. Within this scientific Network, FAL-Federal Agricultural Research Centre (Germany) through its Institute of Farm Economics is acting as the co-ordination centre for scientific issues.
The central objectives of IFCN are: 1. To create and maintain a standardised infrastructure through which production data of the major agricultural products (milk, beef, wheat, sugar, etc.) and from major producing regions of the world can be effectively compared and discussed. 2. To analyse the impact of the structure of production, technology applied and country-specific policies on the economic performance of agribusinesses, their costs of production and global competitiveness. In order to achieve these objectives, IFCN employs the following methods and principles: Direct contact with the production protagonists. A team of advisors and farmers is put together to set up the typical production models and to revise the final results. This approach brings the results closest to reality. The principle of ‘Total Costs’. IFCN considers both direct costs and margins, and the indirect (fixed) costs (i.e. depreciation and interests of the infrastructure used) and the opportunity costs for owned assets and production factors (i.e. family labour, land, capital). A single and homogeneous method is utilised to calculate the costs of production for all participating countries. The IFCN standard is not the only truth, but a) it is scientifically correct, b) it includes all the existing production costs, and c) it creates transparency and international comparability in the arena of costs of agricultural production. Each IFCN member and client can reorganise the costs at his convenience and present them in the particular format of his country while he maintains an internationally comparable set of results. The concept of setting (regional) typical agricultural models. A team of country experts, advisors and producers is formed to identify and set up the typical regional production models for each agricultural product. Typical production models must represent the common production structures in the region or country. In the case of dairy production, for example, a working team composed of advisors, consultants and producers is formed as a panel. The first working step is to define the typical milk production systems of the major dairy regions in country. This model may be a 4-cow farm, feeding mostly cut grasses to fully confined animals, combine milk production with some other agricultural activities such as wheat and rice production in 3 ha of irrigated owned land, and milking is done by hand twice a day. The second working step is to collect all the needed information from these typical models. For this, IFCN has developed a standard questionnaire. It is crucial that these
37
A1 Methodological Background
data collected should neither reflect an individual farm (too many particularities may hurt the ability to generalise the results) nor be an arithmetic average (an average does not show much about the technology and the economics involved). The typical model should rather represent real and common situations of the region and show clearly the predominant technology and infrastructure. Such models will be preferred by analysts. The model TIPI-CAL (Technology Impact and Policy Impact Calculations) is utilised for the simulations of these typical models and the calculations of their costs of production. TIPI-CAL can be easily shared with all IFCN members since it is a spreadsheet in MS-Excel. This model is a combination of production (physical data) and accounting (economic data). TIPI-CAL also consists of both a structure of costs of production and a simulation component (without optimisation). The simulations can be done for a period of up to 10 years in order to evaluate the growth, investments, policies or market conditions. For each year, TIPI-CAL produces a ‘Profit and Loss Account’, a balance and cash flow statement. Allocation of costs of production. When the typical milk production systems have several agricultural activities besides dairy, fixed costs and expenses (i.e. depreciation) are distributed to each activity according to their use. For example, the depreciation of the machinery, which is used, for the dairy and the crop enterprises is allocated according to the hours worked in each. Data about farm and off-farm household economics. IFCN takes into account all activities of the typical production systems, plus all the off-farm incomes and expenses realised by the owner and his family. This more complete picture of the typical model is necessary to obtain reliable information about the current economic situation of the model (and the household) and about the future of the farm (simulations). All the methods and principles above have been applied in this project. The IFCN fieldwork experience supports that the analysis of costs of production shows no significant difference between the participation of one advisor and a ‘full panel’. Therefore, it was decided that an IFCN scientist first visit each and every model, talk with the owners to collect project-specific information, analyse the data and then have the results cross-checked by local experts and farmers. The analysis of costs of production and the competitiveness of the typical models follow the same structure as those in the ‘IFCN Annual Dairy Report’. The main objectives of this report are a) to analyse the main typical milk production systems in the region of Hanoi, b) the describe and briefly evaluate the economics of the most typical channels for milk and dairy product distribution around these farms, and c) to get insights, through a PAM analysis, about the effect of policies and market factors on the economics of these farms.
38
A2
IFCN METHOD: COSTS OF PRODUCTION CALCULATIONS
Cost Calculation The cost calculations are based on dairy enterprises that consist of the following elements: Milk production, raising of replacement heifers and forage production and / or feed purchased for dairy cows and replacements. The analysis results in a comparison of returns and total costs per kilogram of milk. Total costs consist of expenses from the profit and loss account (cash costs, depreciation, etc.), and opportunity costs for farm-owned factors of production (family labour, own land, own capital). The estimation of these opportunity costs must be considered carefully because the potential income of farm owned factors of production in alternative uses is difficult to determine. In the short run, the use of own production factors on a family farm can provide flexibility in the case of low returns when the family can chose to forgo income. However, in the long run opportunity costs must be considered because the potential successors of the farmer will, in most cases, make a decision on the alternative use of own production factors, in particular their own labour input, before taking over the farm. To indicate the effects of opportunity costs we have them separated from the other costs in most of the figures. For the estimations and calculations the following assumptions were made:
Labour costs For hired labour, cash labour costs currently incurred were used. For unpaid family labour, the average wage rate per hour for a qualified full-time worker in the respective region was used.
Land costs For rented land, rents currently paid by the farmers were used. Regional rent prices provided by the farmers were used for owned land. In those countries with limited rental markets (like NZ), the land market value was capitalised at 4 per cent annual interest to obtain a theoretical rent price.
Capital costs Own capital is defined as assets, without land and quota, plus circulating capital. For borrowed funds, a real interest rate of 6 per cent was used in all countries; for owner’s capital, the real interest rate was assumed to be 3 per cent.
Quota costs Rent values were used for rented or leased quota. Purchased quota values were taken as being the annual depreciation of values from the profit and loss accounts.
Depreciation Machinery and buildings were depreciated using a straight-line schedule on purchase prices with a residual value of zero.
Adjustments of fat content All cost components and forage requirements are established to produce ECM (Energy Corrected Milk with 4.0 percent fat and 3.3 percent protein)
39
A2 IFCN Method: Costs of Production Calculations
Adjustment of VAT All cost components and returns are stated without value added tax (VAT).
Adjustment of milk ECM (4 and 3.3 percent fat and protein) The milk output per farm is adjusted to 4 percent fat. Formula: ECM milk = ((milk production * 0.383*fat in percent) + (milk production*0.242*protein in percent)+(total marketable milk output*0.7832))/3.1138
40
A2 IFCN Method: Costs of Production Calculations
Farm Economic Indicators (IFCN Method) + Total receipts = +
Crop (wheat, barley, etc.)
+
Dairy (milk, cull cows, calves, etc.)
+
Government payments
- Total expenses = +
Variable costs crop
+
Variable costs dairy
+
Fixed cash cost
+
Paid wages
+
Paid land rent
+
Paid interest on liabilities
= Net cash farm income + Non cash adjustments = -
Depreciation
+/- Change in inventory +/- Capital gains / losses = Farm income (Family farm income in Dairy Report 2001) - Opportunity costs = +
calc. interest on own capital
+
calc. rent on land
+
calc. cost for own labour
= Entrepreneurs profit
41
A3
DESCRIPTION OF IFCN RESULT VARIABLES
Cost of Milk Production Only Returns & Costs US $ / 100 kg milk
Non-milk returns Opportunity costs
Entrepreneursprofit Opportunity costs
Family farm income
Other costs Returns = Milkprice
Returns ofthe Costs of the dairy enterprise dairy enterprise
Other costs - Non-milk returns
Costs of milk production only
Method The total costs of the dairy enterprise are related to the total returns of the dairy enterprise including milk and non-milk returns (cattle returns and direct payments). Therefore the non-milk returns have been subtracted from the total costs to show a cost bar that can be compared with the milk price. The figure beside explains the method. Other costs: Costs from the P&L account minus non-milk returns (cattle returns and direct payments, excl. VAT). Opportunity costs: Costs for using own production factors inside the enterprise (land * regional land rents, family working hours * wage for qualified workers, capital: Own capital * 3 percent).
Returns of the dairy enterprise Milk price: Average milk prices adjusted to fat corrected milk (4 percent excl. VAT). Cattle returns: Returns selling cull cows, male calves and surplus heifers + /- livestock inventory (excl. VAT). Other Returns: Selling/home use of manure
Costs by costs items Costs for means of production: All cash costs like fuel, fertiliser, concentrate, insurance, maintenance plus non-cash costs like depreciation for machinery and buildings (excl. VAT). Labour costs: Costs for hired labour + opportunity costs for family labour. Land costs: Land rents paid + calculated land rents for owned land. Capital costs: Non-land assets * interest rate (equity * 3 percent).
percent, liabilities * 6
Quota costs: Payments for rented quota and depreciation for quota bought.
42
A3 Description of IFCN Result Variables
Cash and non-cash costs Cash Costs: Cash costs for purchase feed, fertiliser, seeds, fuel, maintenance, land rents, interest on liabilities, wages paid, vet + medicine, water, insurance, accounting, etc (excl. VAT). Depreciation: Depreciation of purchase prices for buildings, machinery and quotas (excl. VAT). Opportunity costs: Costs for using own production factors (land owned, family labour input, equity).
Economic results of the dairy enterprise Farm income per farm: Returns minus costs from P&L account of the dairy enterprise. Farm income per kg milk: Farm income per farm (dairy enterprise) / milk production Profit margin: Share of farm income on the total returns: Farm income divided by the total returns. Entrepreneurs profit: Returns minus costs from P&L account of the dairy enterprise – opportunity cost allocated to the dairy enterprise. Net cash farm income: Cash receipts minus cash costs of the dairy enterprise or: Farm income + depreciation Return to labour: Entrepreneurs profit plus labour costs (wages paid plus opportunity costs) divided by total labour input. Average wages on the farm: This figure represents the gross salary + social fees (insurance, taxes, etc.) the employer has to cover. Calculation: Total labour costs (wages paid plus opportunity costs) divided by the total hours worked. To calculate this the number of hours worked by the employees and the family has been estimated by experts. Labour input: The estimation of hours worked and the valuation of these hours is extremely difficult especially in family farms. In the IFCN network this method will be intensively discussed and improved during the next workshops. Labour costs: Paid wages and opportunity costs for own labour of the dairy enterprise. Land costs: Paid land rents and opportunity costs for own land (calculated rent) of the dairy enterprise. Stocking rate: Number of cows / ha land. Capital costs: Paid interests and opportunity costs for own capital (excluding land capital and quota capital). For equity 3 percent and for liabilities 6 percent interest rate is used in all countries. This reflects the method of “capital using costs” developed by Isermeyer 1989. Capital input: Total Assets (land, buildings, machinery, cattle)/ number cows
43
A4
DISTRIBUTION OF DAIRY ANIMALS IN VIETNAM 2,650 head 3,3% Study Area 2,910 head 3.7%
4,044 head 5.1%
9,033 head 11.4%
1,898 head 2.4%
3,532 head 4.4%
1,732 head 2.2% 51,080 head 64.5% 4,996 head 6.3%
44,670 head 56.4%
Source: Department of Agriculture-MARD, 2003.
44
A5
POLICY ANALYSIS MATRIX
Tradable Inputs Trade Status (Imported or Exported)
Tariffs (for Imports & Exports)
VAT * (Value Added Tax)
Milk Powder
Imp
10-30% (1.5% fat content, no additives)
10%
Livestock
Imp
5% for crossbred bovines and buffaloes, but 0% for purebred bovines
Exempt
Culled Animals
Imp
10%
10%
Maize (for feeds)
Imp
5%
10%
Soybean (for feeds)
Imp
10%
10%
Most other cakes and residues for feed
Imp
10%
10%
Imp. Ingredients & mixed locally
8% Estimated
10%
Imp
1%
10%
0%
10%
Farm Outputs
Farm Inputs Feed Ingredients
Commercial FeedMixed Domestically Agricultural Pesticides Semen Veterinary Medicine
Imp
0%
10%
Maize (seed)
Imp
0%
10%
Fertilizer (NPK; Urea)
Imp
0%
5%
Machinery
Imp
10% (pump 10%, and fans 20%)
10%
Electricity
Imp
1%
10%
Gasoline and Diesel
Imp
0%
10%
Main source: The US-ASEAN Business Council; from http://www.us-asean.org/aftatariffs.asp, accessed on December 05, 2004.
* We chose 10% VAT for all items (except fertilisers) because of the following: In Vietnam, VAT has four different rates - 0%, 5%, 10% and 20% - and many businesses have found that clear distinctions are very difficult to make. Therefore, dealing with four tax rates or exemptions, it's not just four times harder, but at least ten times more difficult. The response has been that firms, some of them totally outside the purview of the tax, have increased prices using VAT as a pretext; others say it has enabled them to lower their rates. Stuck in the middle, the General Department of Taxation (GDT) seems to have decided to leave it up to businesses to interpret the tax and then make its judgement on what they decide. These tariffs and VATs are mainly used to estimate the direction of the effect of policies for tradable goods for these farms. However, since tariffs and VATs are not the only factors distorting the national dairy sector, the PAM results exclude effects of other policy tools and market factors that may also be intervening. A more complete assessment will require a closer
45
A3 Description of IFCN Result Variables
look at services (such as transportation, insurance, etc.) and programs in order to identify further distortions and their effects on these farms. Other sources consulted: http://mkaccdb.eu.int/cgi-bin/wtdtar/wtdsearch.pl , http://www.sice.oas.org/Trade/usviet/USViet1.asp#TAP , and http://r0.unctad.org/trains/2001%20Vietnam.htm
Domestic (Production) Factors Domestic Factors
Labour
Policies & their Effects on Prices Under the 1994 Labor Code and subsequent decrees, the government maintains a minimum wage which is currently set at 310,000 dong (or 19.30 US$) per month for domestic enterprises and between 626,000 to 487,000 dong (or 39 to 30 US$) for foreign enterprises, depending on geographic location.
Adjustment Factor for Social Prices If hiring labour, these typical dairy farms would have to pay 500,000 Dong/month as they are nearest to the city of Hanoi.
Notice that although foreign enterprises already pay over 1.57 times higher wages than the domestic private sector, they are paying from –3 up to roughly 20 These figures show that the domestic percent higher wages than those sector pays about one-third of what the foreign invested sector pays for the use of reported by these typical dairy farms as local wages they would the country’s labour resources. have to pay. The unattractive wages help to explain why wage employment in Vietnam accounts for only about 15 to 20 percent of total employment; and why even in some rural areas, it is hard for many foreign enterprises to find enough labourers. But more relevant here is that the Viet Nam Confederation of Labour recently asked the Prime Minister to increase the minimum wage for foreign invested enterprises to US$45 per month (or 723,000 dong/ month). The Confederation argued that it is necessary to increase the minimum wage immediately to help workers cover living costs and enterprises to stabilise production. Another distorting policy is that foreign invested enterprises previously paid wages in US dollars. However, they switched to Vietnamese Dong in 1999, as mandated by the Ministry of Labour, Invalids and Social Affairs. Under the ministry’s decision, the exchange rate is fixed at 13.910 Dong/ US$1 (the current exchange rate is actually 16,067 Dong; or 1.15 times higher). Therefore, even though labourers working at some enterprises in HCM City technically earn US$ 45, they only receive 626,000 Dong.
If, as proposed by the Viet Nam Confederation of Labour, we take 45 US$ (or 723,000 Dong/ month) as a more adequate indicator of minimum cost of labour in the region, this would mean that the Vietnamese minimum wage for foreign invested enterprises would increase by 48 percent (723,000/ 487,000). For the domestic private sector increasing minimum wages to 45 US$/ month means a 2.33 times greater labour cost. However, for this exercise, an increase of 48 percent (just like for the foreign enterprises) over the current level of 310,000 Dong/ month will make minimum wages of the private sector 459,000 Dong. Although this increase is relatively close to the current wages around these typical dairy farms, it may not attract much of the 85 to 90 percent or more of the active labor force, which is-self-employed, not subject to any government wage control, and of whom over 60 percent work on the farms.
46
A3 Description of IFCN Result Variables
Source: 1http://www.asianlabour.org/archives/00 2641.php (Seen on December 2004).
Land
The Doi Moi (Renovation) policy, in 1986, abandoned the previous framework of collective farming by recognising the household as an economic agent and by instituting several measures of liberalisation that had allowed the Vietnamese economy to make significant growth. Resolution 5, approved in 1993, instituted long-term land use rights to farming households, including the right to exchange, transfer, lease, inherit and mortgage in specific circumstances. Like other social policies, the central purpose of the right of use of the land is to ensure equal access of the land to the farmers so they can provide for their livelihood and to serve the national goal of the supply of targeted agricultural products.
Conclusion: there is an ‘unorganised’ labour market where wages are 80 and 160 percent of the legally imposed minimum wages for the foreign enterprises and the private domestic sector respectively. Without these minimum wages policies and the exchange rate distortion to salaries, we expect that the national wage would reach 45 US$/month, which means an increase by 48% in both the foreign and domestic sectors. For our calculations, we shall consider the State land price of 1,250,000 Dong / sq. Meter of agricultural land on one side and the true agricultural land price where these dairy farms are, which is 1,000,000 Dong / sq. Meter. This means that the market price is only 0.80 percent of the State price for such land, which is the maximum variation allowed from the government price, based on the Decree 188. We would expect, however, that if Decree 188 rather than limiting price adjustment by a variation of plus/minus 20 percent, it would allow for a free land market, a square meter of this type of land could be “acquired” for half of the price, and in many instances for even one-third the government price.
The ownership of land remains however the property of the state and the ability to transfer land use rights is subject to significant government review and varies between different categories of land, landholder and interests in lands, effectively negating a true free-market in Lastly, let us take into account the land use rights. current 2 percent land use right transfer tax applied to agricultural Land prices set by the State now don't land. Again, in a free market, we match at all the price of transferring land then assume no land transfer tax. as set by the market. Some state that the State’s prices can be up to 300 percent higher. Therefore, the Land Law draft committee members have agreed that the prices set by the State have to be closer to the price of transferring land-use certificates on the market. This gave place to the Decree 188 which regulates land price frames for urban and rural areas in the country.
Conclusion: by looking at land prices in other countries in the region and assuming a truly free Vietnamese land market, we expect that (agricultural) land prices would decrease by 50% of its current Government prices.
It generally states that one square metre of land in urban Vietnam can reach a maximum value of VND67.5mil, while
47
A3 Description of IFCN Result Variables
rural areas stay at VND1,250,000. Most importantly to this study is that, according to the decree, local authorities are allowed to define pricing. However, the prices cannot vary more than 20 percent compared from the Government land price frame system. One expects that official prices will come down by 20 percent, but still they remain too high when compared to the ‘true’ market levels. Sources: 1- Marsh, Sally P., & MacAulay, Gordon T., Land reform and the development of commercial agriculture in Vietnam: policy and issues, Agribusiness Review - Vol.10 2002, Section 2.1 (2002), citing Decree No.17/1999/ND-CP (1999), p 15. 2-http://www.dbav.org 3-http://english.vietnamnet.vn
Capital (Interest Rates)
Recent studies have revealed that the informal sector provides the bulk of financial intermediation (between 60 and 75 % of those households surveyed).
It is clear here that the formal credit sector in Vietnam can not effectively serve the needs of the majority. On one side, the VBA often charges similar interest rates as moneylenders and still barely The literature claims that due to lack of covers its administration costs. collateral, lack of knowledge and Now, add any default understanding of policies of the Vietnam (unfortunately, this often happens Bank of Agriculture (VBA), poor households have to seek their credit from in rural areas in the case of natural informal sources. Since the formal market disasters), the banks, of course, need subsidies. is characterised by low nominal interest Despite this VBA need for subsidies, rates and high transactions costs, while these typical dairy farms benefit the inverse is true for the informal from even cheaper loans for an market, those who require small loans interest rate of 1 percent per even for production efficiently borrow month. from the informal markets. Furthermore, one has to differentiate between small and medium and large loans. If a farmer needs to borrow less than 2,500,00 Dong s/he should approach an informal source since the final interest rate of 4.5 percent on average per month will be lower than in the formal sector once opportunity costs and briberies are included (which may easily mean about 6 Percent interest rate). For loans above that level, the VBA’s average rate of 1.75 percent per month becomes the best alternative for the small-scale farmer, provided opportunity costs and bribes are
Clearly banks, like VBA, have no incentives to expand their loan portfolio in favour of small-scale farmers and the poor. Therefore in a free capital market, VBA would have more freedom to open up interest ceilings. Higher interest rates would help VBA increase the number of units at commune level and so its outreach to the rural population. The question is: In this free market, how much higher the interest rates
48
A3 Description of IFCN Result Variables
kept low.
would go?
Studies of mainstream rural credit institutions in Vietnam have proved that they cannot easily serve the credit service requirements of small-scale farmers and the poor. In response, a number of credit schemes of domestic credit institutions and some donor-funded programmes targeting credit to the small-scale borrowers are being implemented. Such institutions organise groups and provide cheap loans (only to project members) at an interest rate of 2 percent per month and one year maturity. Interest and loan principal are paid monthly. The projects usually require compulsory savings of about 3,000 to 5,000 Dong/ month from the member borrowers, which often is difficult for the poor. Interest income from loans is used to pay project management costs.
If the formal sector simplifies its borrowing procedures and increases its interest rate up to 2 percent per month (as that of several development organisations), one would expect that most small-scale farmers and the poor would borrow from it rather than from the informal sector. This would significantly increase the VBA business volume, which in turn would bring opportunities to increase efficiency and decrease or eliminate its need for government subsidies.
Sources: http://vsed.onestop.net/
All in all, the formal sector would need to increase its interest rates for small loans, but significant gains can be made through efficiency gains regarding VBA services. This means that in a free market: (1) the formal sector would double its interest rate and significantly increase its volume of business, or (2) banks like the VBA would stop serving small-scale borrowers. In the latter case, borrowers would have to borrow from development organisations (at 2 % rates and only if they meet membership requirements) or from moneylenders charging 4 times higher rates. In both options, smallscale farmers are left with loans at 2% interest rates as bottom line. This means an increase of 100% for borrowed money. However, in a free market where land prices (and land use rights in this case) go down by 50%, there will be an effect on capital markets. Under these circumstances, in fact, the collateral value of the land is reduced by half and, in a free capital market, the formal sector will not "dramatically increase its volume of business", as transaction costs will be go up exactly by 50% (if we consider that transaction costs are independent of the amount lent/borrowed). In other words, interest rates per unit of loan could go up by 300 to 400
49
A3 Description of IFCN Result Variables
percent, or even more. Conclusion: in this study, an increase for the interest rate from 1 to 2 is found to be not only realistic, but conservative. Therefore, in a free capital market, we assume that interest rates for loans given to small-scale dairy farmers around Hanoi would increase by 100% of what they pay now.
These policies and their effects come from literature reviews, experts’ contributions, and researchers’ estimations. These ‘Adjustment Factor’ were inserted in the IFCN PAM model to produce the (Social) economic results for these dairy typical farms under liberalised market conditions.
50
A6
DAIRY CHAIN CALCULATIONS Formal Milk Channel
Informal Milk Channel
Fresh Milk (8.3% sugar)
Variables
Fresh Milk (whole)
Units
Dairy Processing activities based on 1 kg milk bought from the farmer INPUTS 1- Milk from the farmer Quantity Fat Content Protein Content FARMERS MILK PRICES 2- Other Inputs Input type Quantity added Input price Costs of added Input
Kg
1.0
1.0
% estimation
3.7
3.7
% estimation
3.3
3.3
US$
0.197
0.197
Name
Sugar
None
Kg
0.083
0
US$/ Kg
0.436
0
US$
0.036
0
Description
Fresh Milk (8.3% sugar)
Fresh Milk (whole)
Kg
1.05
0.95
%
3.45
3.7
% estimation
3.28
3.3
US$/ Kg
0.6
0.46
TOTAL CONSUMER PRICES
US$
0.63
0.437
MARGINS Sum of all Returns -Farmers Milk Price
US$
0.63
0.437
US$
0.197
0.197
FINAL MARGINS
US$
0.43
0.24
OUTPUTS Main Product Quantity Fat Content Protein Content Retail Price
Exchange Rate used: 1 US$ = 16067 VND Notes and Assumptions: * For these calculations, we bought 1 kg milk at farmer's price; pasteurized it and added sugar in the formal sector; boiled it for the informal sector. ** The two final milk products chosen here are the most popular fluid milks retailed by both sectors.
51