314 The Journal of Experimental Biology 209, 314-319 Published by The Company of Biologists 2006 doi:10.1242/jeb.01984
The effect of elevated hydrostatic pressure on the spectral absorption of deep-sea fish visual pigments J. C. Partridge1,*, E. M. White1 and R. H. Douglas2 1
School of Biological Sciences, University of Bristol, Woodland Road, Bristol BS8 1UG, UK and 2Applied Vision Research Centre, The Henry Wellcome Laboratories for Vision Sciences, Department of Optometry and Visual Science, City University, Northampton Square, London EC1V OHB, UK *Author for correspondence (e-mail:
[email protected])
Accepted 14 November 2005 Summary The effect of hydrostatic pressure (0.1–54·MPa, measurements of deep-sea fish visual pigments, made at a equivalent to pressures experienced by fish from the pressure close to 0.1·MPa, provide a good indication of max values at higher pressures when considering ocean’s surface to depths of ca. 5400·m) on visual pigment absorption spectra was investigated for rod visual the ecology of vision in the deep-sea. Although not pigments extracted from the retinae of 12 species of deepaffecting the spectral sensitivity of the animal to any sea fish of diverse phylogeny and habitat. The wavelength important degree, the observed shift in max may be of max) was shifted to longer of peak absorption ( interest in the context of understanding opsinwavelengths by an average of 1.35·nm at 40·MPa (a chromophore interaction and spectral tuning of visual pressure approximately equivalent to average ocean pigments. depth) relative to measurements made at one atmosphere (ca. 0.1·MPa), but with little evidence of a change in absorbance at the max. We conclude that previous max Key words: visual pigment, retina, deep-sea fish, pressure.
Introduction The spectral tuning of animal visual pigments is generally considered to be highly adaptive and correlated with the visual environment (Lythgoe, 1979; Partridge and Cummings, 1999). Although this relationship is not always simple, it is especially apparent in many fish (Lythgoe, 1988; Douglas, 2001) particularly those inhabiting the deep-sea (Douglas et al., 1998, 2003). Most illumination in the deep ocean, whether from sunlight or bioluminescence, is concentrated in a narrow portion of the spectrum around 460–480·nm, and the vast majority of deep-sea fish have rod visual pigments absorbing maximally in this spectral region (for a review, see Douglas et al., 1998). Seemingly, this provides one of the clearest examples of visual pigment adaptation to a specific environment. This classic observation, first predicted by Clarke (1936), was later confirmed by Denton and Warren (1956) and Wald et al. (1957) and has been overwhelmingly supported by numerous later studies (for a review, see Douglas et al., 1998). Nevertheless, it is possible that all such investigations have been subject to a fundamental artefact because the elevated hydrostatic pressure encountered at depth in the sea has been hitherto ignored. All visual pigments comprise a G-protein coupled protein (opsin) bound to a vitamin A-derived chromophore. The
spectral absorption of the visual pigment is determined by the proximity to the chromophore of a small number of key amino acids (Yokoyama, 2002). The positioning of these amino acids is, in turn, determined by the complex tertiary protein structure. Many proteins in very deep-living organisms show adaptations that allow them to operate optimally at elevated pressure (Somero et al., 1983; Somero, 1992). Pressure in the ocean increases with depth (ca. 0.1·MPa, or ca. 1·bar, for every 10·m below the surface) and, as the average depth of the oceans is close to 4000·m, the pressure experienced by deep-sea animals at this depth is ca. 40·MPa. Such pressures are known to affect protein tertiary conformation by the compression of internal cavities and by local and global distortion of structural components including alpha helices (Mozhaev et al., 1996). It is likely, therefore, that the pressures experienced at depth will affect opsin structure and may, thereby, affect visual pigment absorption characteristics, particularly the wavelength of maximum absorbance (max). Indeed, an absorbance increase and bathochromatic shift in max is to be predicted for rhodopsin under pressure by inference from the bathochromatic shift observed on cooling (Tsuda and Ebrey, 1980; Yoshizawa, 1972) and from spectral measurements of bacteriorhodopsin made at elevated pressures (Klink et al., 2002). All spectral measurements of deep-sea fish visual
THE JOURNAL OF EXPERIMENTAL BIOLOGY
Pressure and deep-sea fish visual pigments pigment made to date, and on which the observed correlations with environmental variables are based, however, have been recorded at atmospheric pressure. We have therefore measured the visual pigment absorption spectra of extracts of rod pigments from 12 species of mesopelagic and demersal deepsea fish when subjected to pressures of up to 54·MPa. Materials and methods Two specially constructed high pressure hydrostatic chambers were placed into the sample and reference beams of a Shimadzu UV2101PC double beam spectrophotometer (Kyoto, Japan). Each chamber consisted of a 90·mm long, 100·mm diameter stainless steel tube to which 10·mm thick, 100·mm diameter end caps holding 23·mm diameter fused silica windows were bolted. Once completely filled with distilled water, the pressure within these chambers could be increased using a Gilson HPLC pump (model 302, Middleton, WI, USA) connected to them via SwagelokTM tubing (Bristol Fluid System Technologies Ltd, Bristol, UK). A central cavity within each chamber held a standard quartz cuvette, which could be inserted via a 12·mm diameter threaded opening fitted with a high-pressure Swagelok plug. The low volume (10·mm path length) cuvettes in the sample and reference beams were filled to their brims with visual pigment extract (see below) and saline, respectively, and sealed with ParafilmTM before being introduced into the pressure chambers. After filling the pressure chambers with distilled water they were purged to
315
displace any air by briefly running the HPLC pump. Subsequently, pressure was applied in increments under the control of a Gilson (model 802) manometric module to an estimated accuracy of ±0.3·MPa, pressures being crosscalibrated and monitored with a Swagelok analogue pressure gauge (FSD 600 bar). The absorption spectra of visual pigments from 12 species of deep-sea fish, from a variety of families and a range of habitats and depths (Table·1) were measured at various pressures. Demersal species were caught using a benthic trawl in the North Eastern Atlantic (RRS Discovery cruise 255 and RRS Challenger cruise 134), while pelagic animals were sampled with a midwater net in the Pacific north of Hawaii, or off the coast of Guatemala (cruises 142 and 173 of the RV Sonne, respectively) and the Southern Ocean (RRS James Clark Ross cruise 100). All animals were collected, handled, and tissue prepared as previously described (Partridge et al., 1989; Douglas et al., 1995). Briefly, immediately after capture animals were transferred to iced seawater within light-tight containers. In a darkroom, and working under dim red light, retinae were removed from hemisected eyes and either their visual pigments were extracted immediately and then frozen, or the retinae were frozen in 20·mmol·l–1 Pipes-buffered saline (450·mOsm·kg–1, pH·7.3) for later extraction. Visual pigments were extracted from both fresh and frozen material in an identical manner using the detergent n-dodecyl -D-maltoside, as detailed elsewhere (Partridge et al., 1992; Douglas et al., 1995). Initial extractions used Pipes-buffered
Table·1. Effect of hydrostatic pressure on the wavelength of maximum absorbance (max) of difference spectra of visual pigment extracts from 12 species of deep-sea fish, from a range of depths and habitats
Species
N
Capture depth (m)
Previously measured max (nm)
Alepocephalus agassizii Goode and Bean 1883 Antimora rostrata (Günther 1878) Bathysaurus ferox Günther 1878 Borostomias antarcticus (Lönnberg 1905) Coryphaenoides (N.) armatus (Hector 1987) Coryphaenoides guentheri (Vaillant 1888) Electrona carlsbergi (Tåning 1932) Gymnoscopelus fraseri (Fraser-Brunner 1931) Lepidion eques (Günther 1887) Nannobrachium achirus (Andriashev 1962) Nezumia aequalis (Günther 1878) Protomyctophum choriodon Hulley 1981
1 2 1 1 5 2 1 2 1 1 3 3
1375 1102 1342 800 2750 1401 295 45 700 940 782 150
4771 475, 4832 4811 4853 4811 4791 4853 4883 476, 4842 4863 4841 4833
Average intercept max (nm)
Average gradient (nm·MPa–1)
Average max shift (0.1–40·MPa) (nm)
483.09 489.54 484.64 490.72 488.66 494.69 481.62 489.80 500.32 487.11 488.80 481.66
0.02772 0.03261 0.02194 0.02105 0.04120 0.03907 0.05908 0.02946 0.03548 0.02906 0.03744 0.03205
1.1 1.3 0.9 0.8 1.6 1.6 2.4 1.2 1.4 1.2 1.5 1.3
N is the number of individuals of each species measured. Capture depths were calculated as the medians of all data for minimum capture depth available for each species at http://www.fishbase.org. A linear regression was fitted to the max values at five different pressures (0.1, 9.0, 20.0, 31.0 and 45.8 or 54.0·MPa) for each animal examined. To avoid pseudo-replication, average data are presented here for each species. The intercept on the max axis of the regression can be taken as an estimate of the max at atmospheric pressure. Average gradient is the gradient of the regression line. Average max shift, the calculated shift in max from atmospheric pressure to 40·MPa (approximately equivalent to 4000·m depth). References for previous and more accurate measurements of max made using hydroxylamine are: 1Douglas et al. (1995); 2Douglas and Partridge, 1997; 3R.H.D., E.M.W. and J.C.P., unpublished data. THE JOURNAL OF EXPERIMENTAL BIOLOGY
316
J. C. Partridge, E. M. White and R. H. Douglas
saline, but later experiments used 50·mmol·l–1 Tris-buffered saline (300·mOsm·kg–1, pH·7.0) as this buffer is known to have a negligibly small pressure coefficient (Tsuda, 1982; Neuman et al., 1973). In visual pigment spectroscopy it is usual to add hydroxylamine (NH2OH) to visual pigment extracts to shift photoproduct absorbance to short wavelengths, well away from the visual pigment’s absorbance peak, thus enabling more accurate determination of visual pigment max (Knowles and Dartnall, 1977). However, this was not done in this instance as the exact max values for all species examined here have been previously established and the primary aim of this study was to ascertain whether pressure shifted the max rather than to place the visual pigment max accurately. It was also felt to be advantageous to minimise the complexity of the reaction conditions of the visual pigment during bleaching in case these exhibited pressure-dependence. The spectral absorption (300–700·nm) of the extracted visual pigment was determined at atmospheric pressure (ca. 0.1·MPa) and following increases in pressure to 9.0, 20.0, 31.0 and 45.8 or 54.0·MPa, a procedure taking approximately 5·min, before the extract was measured once more at atmospheric pressure. The pressure chamber was then opened and the visual pigment solution irradiated from above with an incandescent light source for 30–60·min. After resealing the chamber, the absorption spectrum of the bleached visual pigment solution was remeasured in the same sequence of ascending pressures. Difference spectra were subsequently constructed by
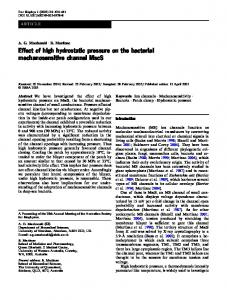
Results Fig.·1A shows the absorbance spectra of a visual pigment extract from the retina of Bathysaurus ferox at different pressures, both before and after bleaching. Difference spectra at each of these pressures are shown in Fig.·1B. The max values of the bleaching difference spectra corresponding to each pressure were plotted as a function of pressure for every animal and linear regression lines were fitted to these data (e.g. Fig.·2A). Coefficients derived for higher order polynomials were not significant, indicating that linear regression models were most appropriate over the range of pressures used. In all cases there was a small but significant increase in max with increasing pressure. In addition to previously measured max values for the visual pigments of the examined species, Table·1 presents the average slope and intercept of the regression line for each species, as well as the calculated shift in max that would be induced by pressure elevation from atmospheric pressure to 40·MPa (the
0.20
A
486.0 λ max (nm)
A
subtracting the bleached from the unbleached absorbance spectrum at each pressure. The max values and absorbance at that max of these difference spectra were determined by fitting the visual pigments templates of Govardovskii et al. (2000) using methods described by Hart et al. (2000).
0.10
485.5 485.0 484.5 484.0
0 300
0.2
400
500 600 Wavelength (nm)
B
0.1 0 300 –0.1
10
20
30
40
50
10
20
30
40
50
B
0.153
700 Max. absorbance
Absorbance
0
0.152 0.151 0.150 0.149
400
500 600 Wavelength (nm)
700
–0.2 Fig.·1. (A) Absorbance spectra of visual pigment extracted from the retina of Bathysaurus ferox measured in unbleached and bleached states at pressures of 0.1, 9.0, 20.0, 31.0 and 45.8·MPa. For clarity of presentation all scans have been zeroed at 700·nm. (B) Difference spectra for each pressure constructed using the curves shown in Fig.·1A. Scans have been zeroed at the minimum long-wave absorbance (see Hart et al., 2000).
0
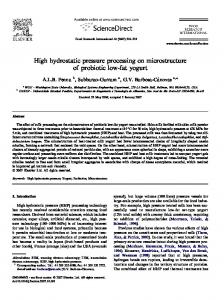
Pressure (MPa) Fig.·2. (A) Relationship between max and pressure for the visual pigment of the animal (Bathysaurus ferox) whose visual pigment difference spectra are shown in Fig.·1B. The data are fitted by the following linear regression: max=0.021943P+484.6437; where P is the pressure in MPa. (B) Relationship between absorbance at the max and pressure for the visual pigment of the animal (Bathysaurus ferox) whose visual pigment difference spectra are shown in Fig.·1B. The data are fitted by the following linear regression: A=5.806⫻10–5P+0.149787, where A is the absorbance at the max and P is the pressure in MPa.
THE JOURNAL OF EXPERIMENTAL BIOLOGY
Pressure and deep-sea fish visual pigments approximate pressure at the average depth of the ocean). For different species this calculated max shift ranged from 0.84 to 2.36·nm. No significant correlations (Spearman’s rank correlation, rs; N=12) were found between the gradients of these regression lines and capture depth (rs=0.021, P=0.948), nor between this gradient and visual pigment max at 0.1·MPa (rs=0.042, P=0.897), nor absorbances at the max measured at 0.1·MPa (rs=0.042, P=0.897). In contrast, however, the average gradient for the effect of pressure on max (0.0338·nm·MPa–1) was found to be significantly different from zero (Student’s one sample t-test: t=11.60, P=0.000, N=12). This corresponds to a calculated max shift at 40·MPa pressure of 1.35·nm. Interestingly, pressure also affected the max of the absorbance spectra of samples of the food dye carmoisine (E122), a pigment chemically distant from visual pigments but having a similar bell-shaped absorption spectrum. When E122 absorption spectra were analysed as if they were visual pigment difference spectra, a statistically significant linear rise in max was observed in response to applied pressure, the average gradient for the effect of pressure on the max being 0.010328±0.002765·nm·MPa–1 (mean ± s.d., N=5), which was significantly different from zero (Student’s one sample t-test: t=8.35, P=0.001, N=5). The calculated increase in carmoisine max at 40·MPa was 0.41·nm, which is significantly different from the shift (1.35·nm) observed for the average of the visual pigments (Student’s one sample t test: t=–19.11, P=0.000, N=5). In most experiments absorbance at the max rose with increasing pressure (e.g. Fig.·2B), but this effect was variable and, for a third of the samples and species measured, the relationship between peak absorbance and pressure was not significantly different from zero (i.e. P>0.05 for the regression coefficient for the gradient). Over all species, the average gradient was 5.44⫻10–5·MPa–1 and, using the regression intercept as a measure of absorbance at atmospheric pressure for all species, the average increase in absorbance at 40·MPa is calculated to be 0.9%. This average gradient is not significantly different from zero (Student’s one sample t-test: t=0.99, P=0.342, N=12), from which we conclude that we have no significant evidence for an effect of pressure on peak absorbance in the species examined here. Discussion This investigation of visual pigment absorption spectra at elevated pressure was conducted in order to answer two main questions. (1) Do previous data on the max of deep-sea fish visual pigments measured at atmospheric pressure provide adequate estimates of in vivo values? (2) What insights can measurements at high pressures provide into the evolutionary adaptation of visual pigments operating in the deep-sea? The spectrophotometric measurements provided two fundamental pieces of data for each species investigated: the effect of pressure on max, and the effect of pressure on absorbance at the max. We conclude that visual pigments of these deep-sea fish showed an average increase in max of approximately
317
1.35·nm in response to an elevation in hydrostatic pressure of 40·MPa when measured in detergent extract. We have no significant evidence that this shift was accompanied by a change in absorbance at the max, nor evidence that deeper living species show more or less pressure dependence than shallow living species. If these observations are representative of the behaviour of visual pigments in vivo then elevated hydrostatic pressure would not affect the absorption spectra of the visual pigments to any degree that is physiologically important. Nevertheless, the observed shift in max may be indicative of changes in opsin conformation that could have other consequences, with the potential to affect visual performance. The species investigated here are representatives of a wide range of habitats and depth ranges, comprising animals that live on or near the ocean floor at depths to 4500·m to those inhabiting much shallower pelagic habitats (Table·1). The lack of obvious correlations between visual pigment behaviour under pressure and depth of capture is therefore potentially instructive. We have taken the medians of the shallowest capture depths recorded for a particular species at Fishbase (http://www.fishbase.org), these being tabulated in Table·1. We realise these depth measures are imperfect as, for example, some of mesopelagic species almost certainly occur at the water surface at night and using the median will result in a greater estimate of minimum capture depth. However, the values tabulated in Table·1 provide a better estimate of a species’ depth distribution than reliance on any single study. Using these depth data we calculated correlations between capture depth and the rate of increase in max with applied pressure, and between capture depth and the rate of change in absorbance at the max. In neither case did Spearman’s rank correlation coefficients indicate a significant relationship (rs=0.021, N=12, P=0.948; rs=–0.119, N=12, P=0.713. respectively). Although small, an effect of pressure on max was observed in all animals investigated and the average gradient (0.0338·nm·MPa–1) is not only highly significantly different from zero (Student’s one sample t-test, t=11.60, N=12, P=0.000) but also the power (the probability of being able to detect this sized difference) of this statistical test is very high (1.000). Bathochromatic shifts in max have been observed when rhodopsin is cooled (Yoshizawa, 1972) and this has been interpreted as due to solvent compression analogous to that occurring at elevated pressure (Tsuda and Ebrey, 1980). In addition, bathochromatic shifts in max have been observed in the bacteriorhodopsin at high pressures (Klink et al., 2002). Although a light-activated proton pump rather than a visual pigment, and phylogenetically distant from vertebrate rhodopsins, this molecule shares aspects of rhodopsin’s structure and also utilises retinal as a chromophore. Klink et al. (2002) measured max shifts of ca. 2·nm in bacteriorhodopsin at 40·MPa, slightly more than the average max shift (1.35·nm) that we observed at this pressure. We are, however, more cautious in our tentative conclusion that absorbance at the max is pressure-independent. The
THE JOURNAL OF EXPERIMENTAL BIOLOGY
318
J. C. Partridge, E. M. White and R. H. Douglas
average increase in absorbance with pressure was 5.44⫻10–5·MPa–1. Using the regression intercepts as estimates of absorbance at atmospheric pressure for each species, this corresponds to an average increase in absorbance at 40·MPa of 0.9%. An increase in absorbance is to be expected purely on grounds of solvent compressibility: for instance, assuming a linear bulk modulus for water of 2.2⫻109·Pa (a value that is probably an overestimate at the pressures we investigated; see Hayward, 1967) a rate of increase in absorbance of 4.545⫻10–4·MPa–1 is to be anticipated, corresponding to an absorbance increase of 1.8% at 40·MPa. As previously stated, we are unable to detect a significant average effect of pressure on absorbance: i.e. the observed average gradient was not significantly different from zero (Student’s one-sample t-test: t=0.99, N=12, P=0.342) but the power of this test is low (0.148). In fact neither could we detect a significant difference between our observations and the gradient estimated by calculation based on the bulk modulus of water (Student’s one-sample t-test: t=–7.29, N=12, P=0), despite the fact that, in this case, our power to differentiate the observed from the calculated values is high (1.000). Pressure also increased the absorbance of the food dye carmoisine, to a greater degree, with an average gradient of 1.49⫻10–4·MPa–1 –4 –1 (s.d.=1.49⫻10 ·MPa , N=5), but this value has high variance and is not significantly different from zero (Student’s one sample t-test: t=2.24, P=0.089, N=5) although like the visual pigment gradient, the rate of increase was also significantly different from that predicted by calculation (t=–4.58, P=0.010, N=5). Further data will be required to determine whether visual pigments indeed behave differently from physical predictions (as our measurements suggest), and that their absorbance is less affected by pressure than predicted by the above calculation. Further data are also required to test whether our conclusions based on the species’ average masks diversity in visual pigment pressure dependence at species level. Visual pigments can be measured spectrophotometrically in a number of ways, including as extract, by microspectrophotometry, as retinal whole mounts, and as outer segment suspensions. While with the first of these the pigment is in solution, the other techniques examine pigments within the outer segment membrane. The design of our pressure vessel constrained our measurements to the examination of detergent extracts, since retinal whole mounts and outer segment suspensions induce an unacceptable level of scatter, for which we could not compensate in the current set up. However, the precise max of rod pigment measurements shows little variation with method (Douglas et al., 1995) and extract measurements are therefore a reliable indication of a visual pigment’s absorption within the photoreceptor, at least at atmospheric pressure. Nevertheless, as shown in Table·1, max measurements obtained in this study differ from previous measurements by several nm. These differences can be attributed to the presence of visual pigment mixtures in some species and/or to the absence of hydroxylamine in the photobleaching conditions used in this study (hydroxylamine being
eliminated to simplify the chemical environment of the visual pigment). As shown in Fig.·1, there is considerable overlap between the photoproduct and alpha absorption band of the relatively short-wave-sensitive rod visual pigments measured here, and this will inevitably affect the precision of max measurements. Further experiments are required to determine the effect of the addition of hydroxylamine on visual pigments under pressure. In vivo, visual pigments in photoreceptors are located in outer segment membranes. As long as visual pigments in outer segment membranes behave under pressure as they do in extract, it is likely that max values determined at atmospheric pressure in previous studies of deep-sea fish visual pigments, on which all correlations between visual pigment spectral absorption and habitat are based (Partridge et al., 1989; Douglas et al., 1998), represent the true values for visual pigments present within the animals’ photoreceptors at depth. Nevertheless, this conclusion has the caveat that pressure may be found to affect max when the visual pigment is in situ in rod outer segment membranes rather than in extract: this possibility requires further study. Of particular vulnerability to perturbation by pressure are biomolecular reactions that are associated with relatively large volume changes, or depend on the fluidity of cell membrane lipid bilayers, or in which conformation changes occur during activity (Somero, 1992; Gross and Jaenicke, 1994). Visual pigments exhibit several of these characteristics during activation by light, in resultant interactions with intracellular messengers, in termination of activity, and in their regeneration. It is probable that such phenomena will be affected by pressure, particularly as both enzyme reactions (Mozhaev et al., 1994) and protein–protein interactions (Heremans, 1982) are known to be pressure sensitive at pressures encountered in the deep-sea. Indeed, effects of pressure on the transmembrane signalling of other G-protein coupled receptors have been shown (Siebenaller and Garrett, 2002). Further study of these facets of visual pigment behaviour under pressure will be aided by the wealth of opsin sequence data (some 30 rod opsin sequences) that are already available from diverse deep-sea fish taxa (Hope et al., 1997; Hunt et al., 2001), and the solved structure of a vertebrate rod rhodopsin (Palczewski et al., 2000). We would like to acknowledge the help of the Masters, crews and scientists aboard the RV Sonne, RRS Discovery, RRS Challenger and RRS James Clark Ross and particularly the principal scientists who enabled us to join their cruises: Prof. Dr rer. nat. Ernst Fluh, Dr rer. nat. Willi Weinrebe, Dr Phil Bagley and Dr Martin Collins. We also thank Prof. H.-J. Wagner for considerable logistical support on the Sonne cruises, Prof. I. A. Johnston for the gift of the HPLC pump, Stephanie Wong for assistance with spectrophotometry, Flora D. Cana for diplopic induction, and Mr G. St John Heath for initial development work in building the pressure chamber.
THE JOURNAL OF EXPERIMENTAL BIOLOGY
Pressure and deep-sea fish visual pigments References Clarke, G. L. (1936). On the depth at which fish can see. Ecology 17, 452456. Denton, E. J. and Warren, F. J. (1956). Visual pigments of deep-sea fish. Nature 178, 1059. Douglas, R. H. (2001). The ecology of teleost fish visual pigments: a good example of sensory adaptation to the environment? In Ecology of Sensing (ed. F. G. Barth and A. Schmid), pp. 215-235. Berlin: Springer-Verlag. Douglas, R. H. and Partridge, J. C. (1997). On the visual pigments of deepsea fish. J. Fish Biol. 50, 68-85. Douglas, R. H., Partridge, J. C. and Hope, A. J. (1995). Visual and lenticular pigments in the eyes of demersal deep-sea fishes. J. Comp. Physiol. A 177, 111-122. Douglas, R. H., Partridge, J. C. and Marshall, N. J. (1998). The Eyes of deep-sea fish I: Lens pigmentation, tapeta and visual pigments. Prog. Ret. Eye Res. 17, 597-636. Douglas, R. H., Bowmaker, J. K. and Hunt, D. M. (2003). Spectral sensitivity tuning in the deep-sea. In Sensory Processing in Aquatic Environments (ed. S. P. Collin and N. J. Marshall), pp. 323-342. Berlin: Springer-Verlag. Govardovskii, V. I., Fyhrquist, N., Reuter, T., Kuzmin, D. G. and Donner, K. (2000). In search of the visual pigment template. Vis. Neurosci. 17, 509528. Gross, M. and Jaenicke, R. (1994). Proteins under pressure: the influence of high hydrostatic pressure on structure, function and assembly of proteins and protein complexes. Eur. J. Biochem. 221, 617-630. Hart, N. S., Partridge, J. C., Bennett, A. T. D. and Cuthill, I. C. (2000). Visual pigments, cone oil droplets and ocular media in four species of estridid finch. J. Comp. Physiol. A 186, 681-694. Hayward, A. T. J. (1967). Compressibility equations for liquids: a comparative study. Br. J. Appl. Phys. 18, 965-977. Heremans, K. (1982). High pressure effects on proteins and other biomolecules. Annu. Rev. Biophys. Bioeng. 11, 1-21. Hope, A. J., Partridge, J. C., Dulai, K. S. and Hunt, D. M. (1997). Mechanisms of wavelength tuning in the rod opsins of deep-sea fishes. Proc. R. Soc. Lond. B 264, 155-163. Hunt, D. M., Dulai, K. S., Partridge, J. C., Cottrill, P. and Bowmaker, J. K. (2001). The molecular basis for spectral tuning of rod visual pigments in deep-sea fish. J. Exp. Biol. 204, 3333-3344. Klink, B. U., Winter, R., Engelhard, M. and Chizhov, I. (2002). Pressure dependence of the photocycle kinetics of bacteriorhodopsin. Biophys. J. 83, 3490-3498. Knowles, A. and Dartnall, H. J. A. (1977). The Photobiology of Vision. New York: Academic Press.
319
Lythgoe, J. N. (1979). The Ecology of Vision. Oxford: Clarendon Press. Lythgoe, J. N. (1988). Light and vision in the aquatic environment. In Sensory Biology of Aquatic Animals (ed. J. Atema, R. R. Fay, A. N. Popper and W. N. Tavolga), pp. 57-82. Berlin: Springer-Verlag. Mozhaev, V. V., Heremans, K., Frank, J., Masson, P. and Balny, C. (1996). High pressure effects on protein structure and function. Proteins Struct. Funct. Genet. 24, 81-91. Neuman, R. C., Kauzmann, W. and Zipp, A. (1973). Pressure dependence of weak acid ionisation in aqueous buffers. J. Phys. Chem. 77, 2687-2691. Palczewski, K., Kumasaka, T., Hori, T., Behnke, C. A., Motoshima, H., Fox, B. A., Le Trong, I., Teller, D. C., Okada, T., Stenkamp, R. E., et al. (2000). Crystal structure of rhodopsin: A G protein-coupled receptor. Science 289, 739-745. Partridge, J. C. and Cummings, M. E. (1999). Adaptations of visual pigments to the aquatic environment. In Adaptive Mechanisms in the Ecology of Vision (ed. S. N. Archer, M. B. A. Djamgoz, E. R. Loew, J. C. Partridge and S. Vallerga), pp. 251-284. Dortrecht: Kluwer Academic Publishers. Partridge, J. C., Archer, S. N. and van Oostrum, J. (1992). Single and multiple visual pigments in deep-sea fishes. J. Mar. Biol. Assn. UK 72, 113130. Partridge, J. C., Shand, J., Archer, S. N., Lythgoe, J. N. and van Groningen-Luyben, W. A. (1989). Interspecific variations in the visual pigments of deep-sea fishes. J. Comp. Physiol. A 164, 513-529. Siebenaller, J. F. and Garrett, D. J. (2002). The effects of the deep-sea environment on transmembrane signalling. Comp. Biochem. Physiol. 131B, 675-694. Somero, G. N. (1992). Adaptations to high hydrostatic pressure. Annu. Rev. Physiol. 54, 557-577. Somero, G. N., Siebenaller, J. F. and Hochachka, P. W. (1983). Biochemical and physiological adaptations of deep-sea animals. In The Sea. Vol. 8, Deep-sea Biology (ed. G. T. Rowe), pp. 261-330. New York: Wiley. Tsuda, M. (1982). Effect of pressure on visual pigment and purple membrane. Methods Enzymol. 88, 714-722. Tsuda, M. and Ebrey, T. G. (1980). Effect of high pressure on the absorption spectrum and isomeric composition of bacteriorhodopsin. Biophys. J. 30, 149-158. Wald, G., Brown, P. K. and Smith, P.S. (1957). Visual pigments and depths of habit of marine fishes. Nature 180, 969-971. Yokoyama, S. (2002). Molecular evolution of color vision in vertebrates. Gene 300, 69-78. Yoshizawa, T. (1972). The behaviour of visual pigments at low temperatures. In Handbook of Sensory Physiology Vol. II. 1 Photochemistry of Vision (ed. H. J. A. Dartnall), pp. 146-179. Berlin: Springer-Verlag.
THE JOURNAL OF EXPERIMENTAL BIOLOGY