Journal of Advanced Ceramics 2016, 5(1): 93–101 DOI: 10.1007/s40145-015-0177-6
ISSN 2226-4108 CN 10-1154/TQ
Research Article
The effect of nanosized CoFe2O4 addition on the magnetic properties of GdBa2Cu3O7δ using AC magnetic susceptibility measurements R. AWADa,b,*, N. H. MOHAMMEDa, A. I. ABOU ALYa, S. ISBERc, H. A. MOTAWEHd, D. EL-SAID BAKEERd, M. ROUMIÉe a
Physics Department, Faculty of Science, Alexandria University, Alexandria, Egypt b Physics Department, Faculty of Science, Beirut Arab University, Lebanon c Physics Department, American University of Beirut, Beirut, Lebanon d Physics Department, Faculty of Science, Damanhur University, Damanhur, Egypt e Accelerator Laboratory, Lebanese Atomic Energy Commission, Beirut, Lebanon Received: September 28, 2015; Accepted: December 03, 2015 © The Author(s) 2016. This article is published with open access at Springerlink.com
Abstract: Superconductor samples of type (CoFe2O4)xGdBa2Cu3O7δ (0≤x≤0.1) were synthesized by the conventional solid-state reaction technique, whereas nanosized CoFe2O4 was prepared by co-precipitation method with grain size of about 8.5 nm. The elemental content of the prepared samples was determined using particle induced X-ray emission (PIXE). The temperature dependence of real ( ) and imaginary ( ) components of AC magnetic susceptibility (ACMS) at different magnetic field amplitude (3–15 Oe) was investigated. The analysis of the temperature dependence of ACMS was performed using Bean critical state model. The values of the critical current density J c at T > Tp ( Tp is the inter-granular loss peak temperature) were calculated as a function of magnetic field and nanosized CoFe2O4 content. It was found that the low nanosized CoFe2O4 addition content (x = 0.01) improves the critical current density J c of Gd-123 superconducting phase. The observed variation of J c with temperature indicated that the weak links are changed from superconductor– normal metal–superconductor (SNS) for free sample to superconductor–insulator–superconductor (SIS) type of junctions for samples added with nanosized CoFe2O4 of x > 0.01. We also discussed the experimental results in the framework of the critical state model to estimate the effective volume fraction of the grains f g using Cole–Cole plots. Keywords: Gd-123 phase; nanosized CoFe2O4; AC magnetic susceptibility (ACMS); critical current density; particle induced X-ray emission (PIXE)
1 Introduction Gd-123 is one of the rare earth superconductor of * Corresponding author. E-mail:
[email protected]
RBa2Cu3O7δ (R-123, R = Y and rare earth) system, and it has received a lot of attention because it exhibits better properties than Y-123 [1,2]. The addition of nanoparticles into the bulk superconductors is an effective method to increase the pinning forces and thus to enhance the critical current density J c [3–7]. Moreover, the addition of some magnetic particles
www.springer.com/journal/40145
J Adv Ceram 2016, 5(1): 93–101
94
such as Fe–B alloy particles [8] and α-Fe2O3 [9] into the Gd-123 bulk superconductor enhances J c under the self-field. The behavior of high-temperature superconductors (HTSCs) under the external magnetic fields is of great importance in the engineering application field. Several techniques such as transport, magnetization, and AC susceptibility have been applied to study the complicated flux motions of HTSCs under varying temperatures and fields [10–13]. In particular, the complex AC susceptibility ( i ) has been widely used to study the vortex dynamics and loss mechanism of HTSCs. It is also employed to estimate some important physical parameters like superconducting transition temperature Tc and critical current density J c . The real part of susceptibility ( ) is a measurement of the magnetic shielding generated by supercurrents, while the imaginary part ( ) is related to losses. The shapes of and are strongly influenced by the classes of compounds, the fabrication process, the thermal treatments, the morphologies of the samples, and the measuring conditions. Wimbush et al. [14] reported the effect of nanosized ferrite CoFe2O4 on the magnetic properties of YBa2Cu3O7δ thin film. A reduction in J c dependence on applied field was observed as a result of Y(Fe,Co)O3 formation instead of CoFe2O4. Mumtaz et al. [15] investigated the effect of nanosized ZnFe2O4 on the electrical and magnetic properties of (Cu0.5Tl0.5)-1223. A suppression of Tc (0) and diamagnetism with increasing nanosized ZnFe2O4 concentration was reported. In this paper, we studied the effect of nanosized CoFe2O4 addition on GdBa2Cu3O7δ using AC magnetic susceptibility technique. The critical current density values J c at different temperatures T > Tp were calculated, and the behavior of the superconducting parameters as a function of nanosized CoFe2O4 content was also discussed.
2 Experimental techniques Nanosized CoFe2O4 powder was prepared by chemical co-precipitation method. Pure chemical reagents of FeCl3 and CoCl2·6H2O were first dissolved in bi-distilled water and the Co/Fe molar ratio was fixed to 1/2. An alkaline solution (NaOH) was added to the
salt solution till the pH was adjusted to 12.5. The solution was heated with continuous stirring at 60 ℃ for 2 h. The co-precipitated powder was filtered and washed for several times with bi-distillated water and dried in air atmosphere at 90 ℃ for 24 h. Finally, the dried powder was calcined in air at 600 ℃ for 4 h. The characterizations of nanosized CoFe2O4 using X-ray diffraction (XRD), transmission electron microscopy (TEM), and vibrating sample magnetometer (VSM) were described in our previous works [16,17]. Superconducting samples of type (CoFe2O4)xGdBa2 Cu3O7δ (0≤x≤0.1) were prepared by the conventional solid-state reaction technique. The starting materials Gd2O3, BaCO3, and CuO (purity≥99.9%) were crushed in an agate mortar and sifted using a 125 μm sieve to get a homogeneous mixture. The powder was subjected to calcination processes in air at 840 ℃ and 880 ℃ for 24 h each. The resulting powder was ground and sifted, and nanosized CoFe2O4 was added to the resulting powder. The powder was again mixed for a long time to ensure the homogenous distribution of nanosized CoFe2O4 inside the samples. The mixed powder was pressed in a disc form (1.5 cm in diameter and about 0.3 cm in thickness). Discs were sintered in air at 930 ℃ with a heating rate of 4 ℃/min, and held at this temperature for 24 h. The samples were cooled by a rate of 1 ℃/min down to 450 ℃ and kept at this temperature for 10 h under oxygen flow to control the oxygen content of the final compounds. Then, they were slowly cooled by a rate of 1 ℃/min to room temperature. The grain morphology of the samples was identified using Jeol scanning electron microscope (SEM) JSM-5300, operated at 25–30 kV, with a resolution power of 4 nm. Samples with dimension of 2 mm × 2 mm × 3 mm were mounted on the SEM stubs and then coated with gold using JEOL JFC-1100 E ion sputtering device. The SEM observations were carried out at magnifications up to 5000 and probe current of the order of 10 mA. The elemental content of the prepared samples was measured by the conventional in-vacuum particle induced X-ray emission (PIXE). The 1.7 MeV tandem accelerator of the Lebanese Atomic Energy Commission [18] was used to deliver 3 MeV proton beam on the samples with 3 μC of fluence. For ion beam analysis, a mass of 0.3 g of each sample was grinded very well to ensure homogeneity and then a thick target pellet with approximate dimension of 1 cm × 1 cm × 0.2 cm was formed. The use of 250 μm thick Al funny filter [19,20] as X-ray
www.springer.com/journal/40145
J Adv Ceram 2016, 5(1): 93–101
95
absorber and placed in front of the Si(Li) detector, allowed a good detection and consequently a quantification of all elements in one run. The target chamber contained a retractable collimated Si(Li) detector with 30 mm2 of active area and a 175 eV measured energy resolution at 5.9 keV. The thickness of the detector beryllium window was 13 μm, which allowed the detection of elements with Z > 10. The different PIXE spectra were processed with the Guelph PIXE software package GUPIX [21]. The AC magnetic susceptibility measurements were performed using a quantum design PPMS system equipped with a 9 T superconducting magnet.
(a)
(b)
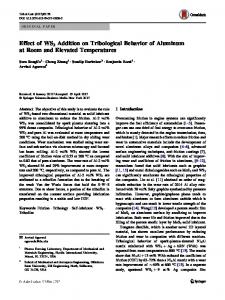
3 Results and discussion Table 1 summarizes the variation of relative volume fraction of Gd-123 determined from XRD, and superconducting transition temperature Tcr determined from electrical resistivity measurement with nanosized CoFe2O4 addition for (CoFe2O4)xGdBa2Cu3O7δ [16,17]. Figures 1(a) and 1(b) display the SEM micrographs of the fractured surface of (CoFe2O4)xGdBa2Cu3O7δ (x = 0, 0.1), respectively. sample morphologies show well connected rectangular-like grains randomly oriented in all directions. Namuco et al. [22] and Awad et al. [23] observed similar grain morphology for Gd-123. White patches and small white particles in addition to rectangular grains are observed for x = 0.1. This may be due to the sticking of nanosized CoFe2O4 on the surface of the grains, leading to increase in grain connectivity and filling up of cracks and voids. Mohanta et al. [24] have found similar grain morphology for Y-123 added with nanosized BaTiO3. It is observed that the grain size and the porosity Table 1 Relative volume fraction of Gd-123, average grain size, and superconducting transition temperatures obtained from resistivity (Tcr) and from AC susceptibility (Tcs) measurements for (CoFe2O4)xGdBa2Cu3O7δ (0≤x≤ 0.1) x 0 0.01 0.02 0.04 0.06 0.08 0.1
Gd-123 (%) Average grain Tcr from resistivity Tcs from [17] size (µm) (K) [17] susceptibility (K) 97.36 1.52 91.77 89.59 98.33 1.38 88.68 87.65 97.87 1.28 85.15 83.52 97.67 1.22 83.63 82.14 97.52 1.18 81.83 80.16 96.98 1.07 80.50 79.13 96.00 0.98 79.95 78.57
Fig. 1 SEM images for (CoFe2O4)xGdBa2Cu3O7δ with x = (a) 0 and (b) 0.1.
among the grains decrease with increasing nanosized CoFe2O4 addition. Furthermore, randomly distributed spherical grains are observed, indicating the formation of BaCuO2 secondary phase. The grain size variation of (CoFe2O4)xGdBa2Cu3O7δ with nanosized CoFe2O4 addition is recorded in Table 1. It is clear that the grain size shows a decrement behavior from 1.52 to 0.98 μm as x increases from 0 to 0.1, which suggests that nanosized CoFe2O4 acts as a well growth inhibitor which limits the grain size [25]. Typical PIXE spectra of (CoFe2O4)xGdBa2Cu3O7δ (x = 0, 0.1) are shown in Figs. 2(a) and 2(b), respectively. Notice that the K X-ray lines identify Cu, whereas L X-ray lines identify Ba and Gd. The appearance of Sr K X-ray lines, which is found as impurity in BaCO3, at the ppm level in PIXE spectra for Gd-123 phase does not affect the stoichiometry of the investigated samples. This accurate detection of low elemental content could be due to the large cross section of X-ray and low background contribution. So PIXE technique is the most useful technique for detecting the low contaminations.
www.springer.com/journal/40145
J Adv Ceram 2016, 5(1): 93–101
96
SrK
1000
100
10 3
5
7
9
11
13
15
17
Energy (keV)
CuK
CuK
(b) 1000000
SrK
SrK
GdL GdL
10000
GdL
BaL BaL BaL
Counts
100000
1000
100
10 3
5
7
9
11
13
15
17
Energy (keV)
Fig. 2 PIXE spectra for (CoFe2O4)xGdBa2Cu3O7δ with x = (a) 0 and (b) 0.1.
The real element content for (CoFe2O4)xGdBa2 Cu3O7δ are listed in Table 2. It is clear that the stoichiometric ratios of the different elements are nearly close to the stoichiometric starting compositions with experimental errors of about 3% for Gd, 5% for Ba and Cu, and 10% for Co. The Ba and Cu stoichiometric ratios are slightly higher than their nominal values for x > 0.01 of (CoFe2O4)xGdBa2Cu3O7δ. This is probably due to the formation of BaCuO2 as impurities, confirming the XRD results. It is interesting to mention that the error percentages of Co element are higher than those of the rest elements. This is attributed to the superposition of Co peaks with Cu peaks. On the other side, the stoichiometric ratios of Co show a systematic and continuous increase with x. Also, it is observed that there is a missing of the Fe and Co peaks which may be due to overlapping of heavier element (GdLβ1 =
7.102 keV) over the lighter element (FeKβ = 7.057 keV and CoKα = 6.924 keV). Usually, the real part of AC magnetic susceptibility of copper oxide-based type II superconductors has two contributions. The first one is the sharp drop which is attributed to the transition within grains (intra-), while the second is the gradual change, corresponding to the occurrence of the superconducting coupling between grains or matrix (inter-). The temperature variation of (T ) at different AC applied magnetic fields Ba for (CoFe2O4)xGdBa2Cu3O7δ (x = 0, 0.01) are shown in Figs. 3(a) and 3(b), respectively. Through the variation of versus temperature, it is possible to obtain Tcs as the temperature at which changes from positive to negative value [26], and their values are listed in Table 1. It is clear that Tcs is suppressed as nanosized CoFe2O4 addition increases from 0 to 0.1 wt%, which is in good agreement with that of Tcr obtained from the resistivity measurements. This suppression in Tc can be interpreted because of the ferromagnetism role of nanosized CoFe2O4 that would cancel the supercurrents and destroy the 0.2
(a)
T (K) 0 40
50
60
70
80
90
100
110
-0.4
-0.6
-0.8
-1
0.2
(b)
T (K) 0 40 -0.2
50
60
70
80
90
100
110 3 Oe 6 Oe 9 Oe
x 0 0.01 0.02 0.04 0.06 0.08 0.1
Gd 0.95 1.01 1.01 1.01 1.02 1.03 1.04
Ba 1.97 2.02 2.13 2.15 2.16 2.17 2.18
Cu 2.98 3.04 3.24 3.25 3.25 3.27 3.29
Co — 0.0038 0.0074 0.0120 0.0180 0.0300 0.0340
12 Oe
-0.4
'(S.I)
Table 2 Real element content of Gd, Ba, Cu, and Co obtained from PIXE technique for (CoFe2O4)xGdBa2Cu3O7δ (0≤x≤ 0.1)
120
3 Oe 6 Oe 9 Oe 12 Oe 15 Oe
-0.2
'(S.I)
SrK
GdL GdL
Counts
10000
GdL
BaL BaL BaL
CuK
100000
CuK
(a)
15 Oe
-0.6
-0.8
-1
Fig. 3 Variation of real AC magnetic susceptibility versus temperature at different applied fields for (CoFe2O4)xGdBa2Cu3O7δ with x = (a) 0 and (b) 0.01.
www.springer.com/journal/40145
120
J Adv Ceram 2016, 5(1): 93–101
97
copper-oxide ceramic type II-granular superconductor [30,31]. The first peak appears at a temperature Tg slightly below Tc , indicating the maximum hysteresis loss which is due to the motion of intra-granular Abrikosov vortices within the superconducting grains [31]. The second loss peak appears at a temperature Tp lower than Tg and is caused by the motion of inter-granular Josephson coupling [32]. The variation of versus temperature for (CoFe2O4)xGdBa2 Cu3O7δ (x = 0, 0.01) are shown in Figs. 5(a) and 5(b), respectively. In a superconductor sample with strongly connected grains, the two peaks are merged [33]. As seen from Figs. 5(a) and 5(b), there is a missing of the intra-grain peaks at Tg which may be due to overlapping with the much broader inter-grain Tp peaks [29]. These observations indicate that our samples have small separation between the intra-grain and the dissipative inter-grain transition. This means that the applied magnetic field is not sufficient to penetrate the intra-grains of superconductor, signifying (a)
0.015
0.01
0.005
0 40
50
60
70
80
90
100
xx=0.01 = 0.01 wt.% xx=0.02 = 0.02 wt.%
120
0.03 3 Oe 6 Oe 9 Oe 12 Oe 15 Oe
0.02
xx=0.04 = 0.04 wt.%
-0.8
110
T (K)
xx=0 = 0.0 wt.%
-0.9
xx=0.06 = 0.06 wt.% xx=0.08 = 0.08 wt.%
-0.7
xx=0.1 = 0.1 wt.%
0.02
-0.6 -0.5
'' (S.I)
' (S.I )
3 Oe 6 Oe 9 Oe 12 Oe 15 Oe
0.02
(b)
-1
0.025
''(S.I)
long-range coupling of Cu ion in the CuO layer. This result is consistent with the known behavior of the bulk superconductors adding with small amounts of magnetic impurities [8,27,28]. Generally, the Tc values determined from the resistivity are slightly higher than those determined from susceptibility measurements. This is because any tiny part of the material going superconductive losses its resistance, and when one or more continuous superconducting paths are in place between the measuring electrodes the resistance equals zero. In contrast, diamagnetic susceptibility measurements depend on macroscopic current loops to shield the magnetic field B from an appreciable fraction of the sample material, and this happens when full superconducting current paths become available [10]. To investigate the flux flow regime and pinning within the samples, we plotted versus the applied field Ba at 42 K, to show the diamagnetic suppression in Fig. 4. The magnetic field dependence of for our investigated samples is almost linear relation where the slopes are considered as the rate of the shift in the magnitude of diamagnetism with applied field Ba . The comparisons between the obtained slopes can investigate the samples which can strongly resist the field and hence have more pinning ability [29]. This analysis implies that the samples with nanosized CoFe2O4 of x = 0.01 have the largest pinning ability (smallest slope), as shown in the inset of Fig. 4. The imaginary part of susceptibility is related to losses. Usually, two peaks in the complex AC magnetic susceptibility (ACMS) may be observed, describing the inter- and intra-granular losses in
-5.00 -4.80 3-3 dx′/dB d'/dB (S.I/Oe) a (10 a×10 S.l/Oe)
-0.4 -0.3 -0.2 -0.1
-4.60
-4.20 -4.00 -3.80
0.01
-3.60 -3.40 0
0.02
0.04
2
4
6
8
10
x
x (wt.%)
0 0
0.01
-4.40
12
0.06
0.08
14
0.1
16
B (Oe) Baa(Oe)
0.00 40
Fig. 4 Magnetic field dependence of for (CoFe2O4)xGdBa2Cu3O7δ at 42 K. The inset shows the variation of d / dBa versus x for (CoFe2O4)xGdBa2 Cu3O7δ (0≤x≤0.1).
50
60
70
80
90
100
110
T (K)
Fig. 5 Variation of imaginary AC magnetic susceptibility versus temperature at different applied fields for (CoFe2O4)xGdBa2Cu3O7δ with x = (a) 0 and (b) 0.01.
www.springer.com/journal/40145
120
J Adv Ceram 2016, 5(1): 93–101
98
superconductor (SINS) junctions [35]. The dependence of J c (T ) on 1
3.00
Jc(T) (105A/cm2)
nn== 1.83
3 Oe 6 Oe 9 Oe 12 Oe 15 Oe
3.50
nn=1.69 =
2.50 2.00
n n == 1.64
1.50 1.00
n = 1.62
0.50 n n == 1.26
0.00 0.12
0.14
0.16
0.18
0.2
0.22
0.24
1-T/Tcc) 1-(T/T 5.00
(b)
3 Oe 6 Oe 9 Oe 12 Oe 15 Oe
4.50 4.00
n== 1.83 n
3.50 3.00
nn = = 1.68
2.50 2.00 nn = 1.62
1.50 1.00
n= n = 1.52
0.50
n= n = 1.44
0.00 0.1
0.12
0.14
0.16
0.18
0.2
0.22
1-T/Tcc) 1-(T/T 2.00
(c)
3 Oe 6 Oe 9 Oe 12 Oe 15 Oe
1.80 1.60
nn== 1.43
1.40
Jc(T) (105A/cm2)
n
T (3) J c (T ) J c (0) 1 Tc where J c (0) is the critical current density at 0 K and n is the critical exponent. The value of n is 2 for superconductor–normal metal–superconductor (SNS) junctions [40] and 1 for superconductor– insulator–superconductor (SIS) junctions [41]. The values of n between 1 and 2 indicate the formation of superconductor–insulator–normal metal–
4.00
(a)
where 0 is the permeability of vacuum and rg is the average grain size estimated from SEM. Also, The values of J c (T ) are easily calculated over a wide range of temperature (70.2–77.2 K) in terms of the values of (T ) and J c (Tp ) as follows [34,37, 38]: (T ) 0.5 J c (T ) / J c (T ) at T Tp (2) It is well known that the polycrystalline superconductors are arrays of weak links, which behave like Josephson junctions. The temperature dependence of the critical current that flows through the Josephson junctions is calculated according to the empirical scaling relation [39]:
T at different Tc
values of Ba for (CoFe2O4)xGdBa2Cu3O7δ (x = 0, 0.01, 0.1) is shown in Figs. 6(a), 6(b), and 6(c), respectively. The variation of J c (0) , obtained from the best fitting to Eq. (3), versus nanosized CoFe2O4 content at different applied magnetic field is shown in
Jc(T) (105A/cm2)
good electrical contacts between the superconducting grains. These results are in agreement with those obtained by Sedky et al. [34] for Re-123 superconductors and Awad et al. [10] for Tl-1223 superconducting phase. It is observed that the inter-granular loss peak at Tp slightly shifts to lower temperature by increasing the applied field due to losses associated with the motion of inter-granular Josephson tunneling. For temperatures between the end of the peak in and Tc for a given measuring field, the grains are decoupled, while below Tp the grains are coupled. This coupling permits the real part of susceptibility to reach 1 (SI) in small fields [35]. The maximum of dissipative inter-grains, occurs when the superconducting volume is penetrated by the applied magnetic field; that is, when the shielding current is equal to the critical current density of this volume. In this case, the flux pinning is the only mechanism controlling the flux dynamics. We can estimate the inter-granular critical current density as a function of peak temperature Tp by using the Bean critical state model [36]: B J c (Tp ) a (1) 0 rg
nn== 1.40
1.20 1.00 0.80
n = 1.39 n=
0.60 0.40
n= n =1.38
0.20 n= n = 1.28
0.00 0
0.02
0.04
0.06
0.08
0.1
1-T/Tcc) 1-(T/T
Fig. 6
Dependence of J c T on 1
T at different Tc
applied fields for (CoFe2O4)xGdBa2Cu3O7δ with x = (a) 0, (b) 0.01, and (c) 0.1.
www.springer.com/journal/40145
0.12
J Adv Ceram 2016, 5(1): 93–101
99
Fig. 7. It is clear that the critical current density at 0 K is enhanced with x up to 0.01 and then it is suppressed with a further increase in x. The increase in J c may be attributed to the increase in the volume fractions of Gd-123 phase or the diffusion of nanosized CoFe2O4 in the added samples over the pore surfaces, grain boundaries, and twin boundaries. This can increase flux pinning and coupling between grains, leading to increase the critical current density. While, the decrease in J c is attributed to the suppression of volume fractions of Gd-123 phase. Also, the excessive addition of nanosized CoFe2O4 induces large agglomerations between the grains and not through the boundaries and voids, which deteriorates the inter-granular critical current density [34]. The values of n are close to 2 for x = 0 and 0.01 suggesting weak links of SNS type. While the values of n decrease for x > 0.01 confirming SIS weak links. The decrease in n values could be due to the cancellation of supercurrents by the ferromagnetic nanosized ferrite CoFe2O4. Since the demagnetizing correction would cause = 1 for enough low temperature, we normalized experimental AC susceptibility data (T ) and (T ) to | | at the lowest temperature for each sample. Clem and other workers [42,43] have described the principle of the separation of the contribution from grains and the coupling matrix. It is well known that both real and imaginary parts of ACMS in superconducting state depend on sample geometry [44]. While applying the Cole–Cole ( / | as a function of / | min | ) plots of | min susceptibility is assumed to reduce the geometrydependent factor [45]. Cole–Cole plots can be used to estimate the grain fraction of the superconducting
samples, which can be used to obtain a quantitative analysis of the grains and matrix contributions. Figure 8 shows the Cole–Cole plots at applied magnetic field of 9 Oe for (CoFe2O4)xGdBa2Cu3O7δ. The grain volume fraction f g is determined by the onset value or extrapolated onset value. It is clear that, the grain volume fraction f g increases up to x = 0.01 for (CoFe2O4)x GdBa2Cu3O7δ and then decreases for x > 0.01.
4 Conclusions In this work, we used AC magnetic susceptibility measurement to estimate the values of Tc , J c , and f g of Gd-123 superconducting phase added with nanosized CoFe2O4. A reduction in Tc was observed as x increased from 0 to 0.1, consisting with the results of adding magnetic impurities to HTSCs. The values of J c at T Tp were found to be dependent on the applied field and nanosized CoFe2O4 content. The value of J c (0) enhanced with x up to 0.01, and then it was suppressed with a further increase in x. These results could be attributed to the improvement of pinning capability within the samples and suggested the presence of pinning sources generated by the suitable small amount of nanosized ferrite CoFe2O4 addition. The critical exponent n, determined from critical current density, was found to be close to 2, indicating weak links of SNS type. While the values of n decreased for x > 0.01 confirming SIS weak links. Acknowledgements
This work was performed in the Superconductivity and 0.03
90 3 Oe 6 Oe 9 Oe 12 Oe 15 Oe
80
0.02
''/ 'min
2 2 JcJ(0) (1055(A/cm A/cm ) ) c(0)×10
70
xx==0 0.0 wt.% xx==0.01 0.01 wt.% xx==0.04 0.04 wt.% xx==0.1 0.1 wt.%
0.025
60 50 40
0.015
0.01
30
0.005
20
fg
10
0
0 0
0.01
0.02
0.03
0.04
0.05
0.06
0.07
0.08
0.09
0.1
-1
Fig. 7 Variation of J c (0) versus nanosized CoFe2O4 content at different applied magnetic fields.
-0.8
-0.6
-0.4
-0.2
'/ 'min
x x (wt.%)
Fig. 8 Cole–Cole plots for (CoFe2O4)xGdBa2Cu3O7δ at Ba = 9 Oe.
www.springer.com/journal/40145
0
100
J Adv Ceram 2016, 5(1): 93–101
Metallic-Glass Lab, Physics Department, Faculty of Science, Alexandria University, Alexandria, Egypt, in cooperation with the Accelerator Laboratory, Lebanese Atomic Energy Commission, CNRS, Beirut, Lebanon, and the American University of Beirut, Beirut, Lebanon.
[16]
[17]
References [1] Muralidhar M, Jirsa M, Sakai N, et al. Current progress in ternary LREBa2Cu3Oy materials and their application. Mat Sci Eng B 2008, 151: 90–94. [2] Sakai N, Lee S, Chikumoto N, et al. Delamination behavior of Gd123 coated conductor fabricated by PLD. Physica C 2011, 471: 1075–1079. [3] Xu C, Hu A, Ichihara M, et al. Enhanced flux pinning of air-processed Gd123 by doping ZrO2 nanoparticles. Physica C 2007, 460–462: 1341–1342. [4] Xu C, Hu A, Sakai N, et al. Flux pinning properties and superconductivity of Gd-123 superconductor with addition of nanosized SnO2/ZrO2 particles. Physica C 2006, 445–448: 357–360. [5] Xu Y, Hu A, Xu C, et al. Effect of ZrO2 and ZnO nanoparticles inclusions on superconductive properties of the melt-processed GdBa2Cu3O7−δ bulk superconductor. Physica C 2008, 468: 1363–1365. [6] Zhang YF, Izumi M, Li YJ, et al. Enhanced JC in air-processed GdBa2Cu3O7−δ superconductor bulk grown by the additions of nano-particles. Physica C 2011, 471: 840–842. [7] Abou Aly AI, Mohammed NH, Awad R, et al. Determination of superconducting parameters of GdBa2Cu3O7−δ added with nanosized ferrite CoFe2O4 from excess conductivity analysis. J Supercond Nov Magn 2012, 25: 2281–2290. [8] Xu Y, Izumi M, Zhang YF, et al. Enhancement of critical current density in Gd123 bulk superconductor doped with magnetic powder. Physica C 2009, 469: 1215–1217. [9] Zhang YF, Izumi M, Xu Y, et al. Enhanced performance in bulk superconductor GdBa2Cu3O7δ with additions of α-Fe2O3 particles. J Phys: Conf Ser 2010, 234: 012052. [10] Awad R, Abou-Aly AI, Ibrahim IH, et al. Superconducting properties of zinc substitution in Tl-2223 phase. J Alloys Compd 2008, 460: 500–506. [11] Çelebi S. Comparative AC susceptibility analysis on Bi–(Pb)–Sr–Ca–Cu–O high-Tc superconductors. Physica C 1999, 316: 251–256. [12] Lee CY, Kao YH. Low-field magnetic susceptibility studies of high-Tc superconductors. Physica C 1995, 241: 167–180. [13] Yamada N, Akune T, Sakamoto N, et al. Temperature dependence of irreversibility fields in Re doped Hg-1223 superconductors. Physica C 2004, 412–414: 425–429. [14] Wimbush SC, Yu R, Bali R, et al. Addition of ferromagnetic CoFe2O4 to YBCO thin films for enhanced flux pinning. Physica C 2010, 470: S223–S224. [15] Mumtaz M, Naeem S, Nadeem K, et al. Study of
[18]
[19] [20]
[21] [22]
[23]
[24]
[25]
[26]
[27]
[28]
[29]
[30]
[31]
[32]
nano-sized (ZnFe2O4)y particles/CuTl-1223 superconductor composites. Solid State Sci 2013, 22: 21–26. Awad R, Abou Aly AI, Mohammed NH. Physical and mechanical properties of GdBa2Cu3O7−δ added with nanosized CoFe2O4. J Supercond Nov Magn 2014, 27: 1757–1767. Abou Aly AI, Mohammed NH, Awad R, et al. Magneto-conductivity analysis for GdBa2Cu3O7−δ added with nanosized ferrite CoFe2O4. J Supercond Nov Magn 2013, 26: 2419–2428. Roumié M, Nsouli B, Zahraman K, et al. First accelerator based ion beam analysis facility in Lebanon: Development and applications. Nucl Instr Meth B 2004, 219–220: 389–393. Harrison JF, Eldred RA. Adv X-ray Anal 1973, 17: 560–569. Nejedly Z, Campbell JL, Gama S. An Excel utility for the rapid characterization of “funny filters” in PIXE analysis. Nucl Instr Meth B 2004, 219–220: 136–139. Maxwell JA, Teesdale WJ, Campbell JL. The Guelph PIXE software package II. Nucl Instr Meth B 1995, 95: 407–421. Namuco SB, Lao ML, Sarmago RV. Granular responses of GdBa2Cu3O7δ using ac magnetic susceptibility measurement under ac and dc magnetic fields. Physics Procedia 2013, 45: 169–172. Awad R, Abou-Aly AI, Mahmoud SA, et al. Normal-state conduction mechanisms in GdBa2Cu3−xRuxO7−δ superconducting phase. J Supercond Nov Magn 2011, 24: 2227. Mohanta A, Behera D. Effect of granularity and inhomogeneity in excess conductivity of YBa2Cu3O7−δ+ xBaTiO3 superconductor. Physica B 2011, 406: 877–884. Amira A, Bouaicha F, Boussouf N, et al. Substitution of Sr2+ by Eu3+ in Bi-2201 ceramics, effects on structure and physical properties. Solid State Sci 2010, 12: 699–705. Sedky A, Youssif MI. Correlation between superconducting volume fraction and critical current density in copper oxide superconducting systems. Physica C 2004, 403: 297–303. Wang XL, Horvat J, Gu GD, et al. Enhanced flux pinning by Fe point defects in Bi2Sr2Ca(Cu1−xFex)2O8+δ single crystals. Physica C 2000, 337: 221–224. Xu Y, Izumi M, Tsuzuki K, et al. Flux pinning properties in a GdBa2Cu3O7−δ bulk superconductor with the addition of magnetic alloy particles. Supercond Sci Technol 2009, 22: 095009 Bahgat AA, Shaisha EE, Saber MM. Study of microstructure and magnetic properties in copper oxide superconducting systems through AC magnetic susceptibility. Physica B 2007, 399: 70–76. Ilonca G, Pop AV, Yang T-R, et al. Transport properties and ac susceptibility of (Bi1.6Pb0.4)Sr2Ca2Cu1−xCox)3Oy superconductors. Int J Inorg Mater 2001, 3: 763–767. Huth M, Schmitt M, Adrain H. Influence of composition and long term annealing on the weak link behaviour of the high-Tc superconductor (Bi,Pb)2+xSr2−yCa2+yCu3+zO10+δ. Physica C1991, 178: 203–212. Müller K-H, MacFarlane JC, Driver R. Josephson vortices and flux penetration in high temperature superconductors.
www.springer.com/journal/40145
101
J Adv Ceram 2016, 5(1): 93–101 Physica C 1989, 158: 69–75. [33] Gömöry F. Characterization of high-temperature superconductors by AC susceptibility measurements. Supercond Sci Technol 1997, 10: 523 [34] Sedky A, Youssif MI, Khalil SM, et al. On the correlation between order parameter, superconducting volume fraction and critical current density in R:123 superconductors. Solid State Commun 2006, 139: 126–131. [35] Salamati H, Kameli P. Effect of deoxygenation on the weak-link behavior of YBa2Cu3O7−δ superconductors. Solid State Commun 2003, 125: 407–411. [36] Bean CP. Magnetization of high-field superconductors. Rev Mod Phys 1964, 36: 31 [37] Sedky A, Youssif MI. Low-field AC susceptibility study of critical current density in Eu:123 and Bi:2223 superconductors. J Magn Magn Mater 2001, 237: 22–26. [38] Murphy SD, Renouard K, Crittenden R, et al. AC susceptibility of sintered high Tc superconductors—Bean’s model and shielding current. Solid State Commun 1989, 69: 367–371. [39] Lee MW, Tai MF, Luo SC, et al. Critical current densities in K3C60/Rb3C60 powders determined from AC/DC susceptibility measurements. Physica C 1995, 245: 6–11 [40] De Gennes PG. Boundary effects in superconductors. Rev
Mod Phys 1964, 36: 225. [41] Ambegaokar V, Baratoff A. Tunneling between superconductors. Phys Rev Lett 1963, 10: 486 [42] Farbod M, Batvandi MR. Doping effect of Ag nanoparticles on critical current of YBa2Cu3O7−δ bulk superconductor. Physica C 2011, 471: 112–117. [43] Clem JR. Granular and superconducting-glass properties of the high-temperature superconductors. Physica C 1988, 153: 50–55. [44] Müller K-H. AC susceptibility of high temperature superconductors in a critical state model. Physica C 1989, 159: 717–726. [45] Cho JH. Linear and nonlinear susceptibilities of a Bi2Sr2CaCu2O8 single crystal with isotropic columnar defects. Physica C 2001, 361: 99–106. Open Access The articles published in this journal are distributed under the terms of the Creative Commons Attribution 4.0 International License (http://creativecommons. org/licenses/by/4.0/), which permits unrestricted use, distribution, and reproduction in any medium, provided you give appropriate credit to the original author(s) and the source, provide a link to the Creative Commons license, and indicate if changes were made.
www.springer.com/journal/40145