solution on: (i) the efficiency of electrochemical deposition of nickel hydroxide; and (it) the molecular weight of the ... plaques produces superior battery electrodes compared to .... have been shown to occur (including the hydrogen evolu-.
The Effect of Temperature and Ethanol on the Deposition of Nickel Hydroxide Films Christopher C. Streinz,a Sathya Matupally,* and John W. Weidner** Department of Chemical Engineering, University of South Carolina, Columbia, South Carolina 29208, USA ABSTRACT The objective of this work was to determine the effect of the temperature and the ethanol content of the Ni(NQ)2 solution on: (i) the efficiency of electrochemical deposition of nickel hydroxide; and (it) the molecular weight of the deposited film. An electrochemical quartz crystal nanobalance (EQCN) was used to measure the mass of films electrochemically deposited from Ni(NO3)2 solutions and constant current discharges were used to determine the electrochemical capacity of the films. The data indicates that increasing the temperature increases both the efficiency of the deposition reaction and the molecular weight of the deposited film. The increased efficiency at higher temperatures is attributed to a decrease in the concentration of a nickel complex at the surface of the electrode. The lower complex concentration decreases the diffusion rate of this species away from the electrode surface and hence increases the rate at which the complex precipitates from the solution. The increase in the molecular weight at higher temperature is attributed to a combination of increased rate of deposition and an increase in the lattice spacing of the active material. The data also indicate that increasing the ethanol content of the solution had no noticeable effect on the efficiency of deposition, when water was present. In pure ethanol, however, the chemistry of deposition seemed to change considerably. However, increasing the ethanol content of the solution resulted in an increase of the molecular weight of the film. Increase in the molecular weight with an increase in the ethanol content of the solution is due to an increase in the relative percentage of ethanol incorporated in the active material. The data also indicate that the n u m b e r of electrons in the discharge reaction is approximately 1.4 electrons per nickel atom.
Introduction Nickel hydroxide is one of the most commonly used active materials for the positive electrode in rechargeable batteries. It is also an electrochromic material and is considered an attractive candidate for potential application in "smart windows. ''~'~ Nickel hydroxide is commonly prepared electrochemically by cathodic precipitation at high temperatures (ranging from 70-90~ from a solution containing a mixture of ethanol and water. It has been shown that the electrochemical impregnation of porous nickel plaques produces superior battery electrodes compared to those made by the conventional chemical loading process (see Gross 3 for a review of both the chemical and electrochemical impregnation processes). However, a fundamental understanding of how the various operating conditions (e.g., temperature, ethanol content) affect the impregnation process is not well understood. In electrochemical impregnation, a nickel plaque is cathodically polarized in a Ni(NO3)2 solution. Nitrate is reduced according to the following reaction 4-~ NO~ + 6H20 + 8e- ~ NH3 + 9 OH-
[1]
One additional OH- ion per eight electrons passed may be generated from the a m m o n i a / a m m o n i u m - i o n equilibrium as expressed by NH3 + H20 r
NH$ + OH-
[2]
In acid and neutral conditions, equilibrium tends toward the right-hand side of Eq. 2, gand therefore, if the pH at the electrode surface does not exceed 8, the nitrate reduction reaction can effectively be written as follows 1~ N Q - + 7H20 + 8e- ~ NH4§ + 10 OH-
[3]
The production of OH- increases the surface pH of the electrode, resulting in the precipitation of Ni(OH)~ at the electrode surface according to the following reaction ~-8'1~ Ni 2+ + 2 OH ~ Ni(OH)2$
[4]
There are two simplifications implied by Eq. 4. First, it is unlikely that nickel hydroxide precipitates as pure Ni(OH)2. Spectroscopic evidence shows that solvent and/or ions are incorporated into the film as the material de* Electrochemical Society Student Member. ** Electrochemical Society Society Active Member. Present Address: Cabot Corporation, Cab-O-SIL Division, Tuscola, Illinois 61953, USA.
positsJ However, very little evidence exists as to what extent the quantity of solvent incorporated into the film depends on the deposition conditions. The second simplification implied by Eq. 4 is that all the hydroxyl ions produced by the electrochemical reaction (e.g., Eq. 3) result in precipitation. This has led previous researchers to use Faraday's law to estimate the rate of deposition of nickel hydroxide films. 11'14-18 However, we found in a previous study 12 that while estimating the moles of nickel hydroxide that are deposited based on the number of coulombs passed works in dilute solutions of Ni(NO3)2 (e.g., 0.i M), deviations from Faraday's law occur at high Ni(NO3)2 concentrations. As the Ni(NO3)2 concentration was increased from 0.i to 2.0 M, the rate of deposition decreased by more than one order of magnitude. The coulombic inefficiency of the deposition process in concentrated solutions was attributed to the formation of a nickel complex that diffuses away from the surface before deposition can occur, thus consuming electrochemically generated OH.- Assuming the complex is the polymeric species Ni4(OH)~+, 13 a two-step precipitation reaction was proposed 12
4Ni 2++ 4 OH- r
Ni~(OH)~+
Ni4(OH)~+ + 4 OH- ~ 4Ni(OH)2$
[5] [6]
Based on this two-step process, operating under conditions which inhibit the reaction of the nickel complex with additional hydroxyls will reduce the coulombic efficiency of the process. The objective of this work was to determine the effect of solution temperature and ethanol content of the solvent on: (i) the efficiency of electrochemical deposition of nickel hydroxide; and (it) the molecular weight of the deposited film. An electrochemical quartz crystal nanobalance (EQCN) was used to measure in situ the mass of the deposited films. After formation, the films were electrochemically charged and discharged in 3 % KOH to determine the moles of nickel deposited. Coupling the deposition data with the discharge data enabled the deposition efficiency and the molecular weight of the deposited film to be calculated. In addition, the n u m b e r of electrons per mole of nickel taking part in the discharge process was determined.
Experimental An electrochemical quartz crystal nanobalance (EQCNElchema Model EQCN-501) was used to make in situ measurements of the mass deposited on a planar gold electrode
J. Electrochem. Soc., Vol. 142, No. 12, December 1995 9 The Electrochemical Society, Inc.
4051
4052
J. Electrochem. Soc., Vol. 142, No. 12, December 1995 9 The Electrochemical Society, Inc.
during cathodic chronopotentiometric deposition in Ni(NO~)2 solutions. The EQCN is described in more detail elsewhere. 12'19Briefly, the working electrode consists of a quartz crystal with a thin layer of gold sputtered on both sides. The electrode area exposed to solution during deposition is 0.2 cm 2. The resonant frequency of the reference crystal is 10.000 MHz. The EQCN has a frequency resolution of 1 Hz which corresponds to 1.1 ng mass change. TM A Pine Model AFRDE5 bipotentiostat was used for all current and potential control. The counterelectrode consisted of a platinum screen. Depositions were carried out in Ni(NO3)2 solutions prepared with reagent grade Ni(NO3)2 9 6H20. Solution concentrations ranged from 0.1-1.0 M at applied current values of 0.5 mA (2.5 mA/cm2). Solvents consisting of 0, 50, 75, and 100 v/o ethanol were used. It should be noted that the solution consisting of 100 v/o ethanol was not truly anhydrous since the solute contained a 6:1 molar ratio of H20:Ni(NQ)2. Depositions were carried out at room temperature (23-25~ and controlled temperatures of 50 and 75~ using a jacketed flow-through cell. To confirm that the deposited active material was Ni(OH)2, selected films were examined via cyclic voltammetry in 3 w/o KOH. The characteristic charge and discharge peaks were readily observed indicating the presence of the Ni(OH)2/NiOOH couple. The physical appearance of the deposits also provided evidence for the deposition of Ni(OH)2. In all cases the freshly deposited films were transparent and green, consistent with that reported by others. 12'17 Charging resulted in the formation of the black NiOOH.I~. 17 Films deposited under selected conditions were rinsed in distilled water, charged, and then discharged at a constant current of 50 btA in 3.0 w/o KOH. All discharges were conducted at room temperature. The electrochemical capacity of each film (determined by the time to discharge) was compared to its deposited mass and used to evaluate the deposits obtained under the different deposition conditions.
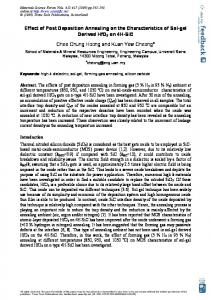
Results and Discussion T h e effect o f t e m p e r a t u r e . ~ T h e effect of temperature is illustrated in Fig. 1 which contains plots of mass vs. time for deposition in 1.0 M Ni(NO3)2 dissolved in a solvent mixture of 50/50 v/o ethanol/water. Independent of the temperature, the mass is observed to increase linearly with time (with regression values, R ~, consistently greater than 0.999), indicating a constant deposition rate. This is consistent with our earlier studies of the deposition from Ni(NO3)2 dissolved in 50/50 v/o ethanol/water solutions at RT.~ The deposition rates (slopes of the mass vs. time curves) are essentially identical at RT and 50~ However, the deposition rate at 75~ is approximately 65% greater than that at RT and 50~ (5.6 vs. 3.4 ~g/min). The mass vs. time curves and deposition rates given in this paper are 1 O0
,
.
,
,
,
9
,
9
,
.
,
.. .
90 ~O
y
9
,
.
,
,
i
,
,
9
i
,
,
f
S o l , = 1 0 / / 8 . , .-"//" S o . = 9 / 8
........::,.."
70
60
"
""
....:.."
4o
- ~ R
30 20 10 0 - ' l O
,
0
,
,
1
,
t
2
,
i
5
,
I
i
4
i
i
5
i
5
,
i
7
,
8
9
i
10
Time (rain)
Fig. 1. Mass
vs.
time for deposition in 1.0 M NilNO3)2 at 0.5 mA
in 50/50 ethanol/water solutions at RI, 50, and 75~ The deposition rate at 75~ is approximately 65% greater than that at RT and 50 C
(5.6
vs.
3.4 ixg/min). The dashed lines are the ideal mass
curves from Eq. 7 for the two values of SOIl-.
vs.
time
9
,
9
,
.
,
9
,
.
,
-
,
9
,
.
,
.
,
9
,
22 20 S o . = 1o / s
18
/
/
~
~
E 16 14 ea 12
g
10 B 6
Cb 4 2 --
0
i 2
1
i .5
,
i 4
,
i 5
i
I 6
I
Inverse C o n c e n t r a U o n
i 7
1 8
i 9
i
i 1(3
i 8
i 9
,
i ~0
(l/real)
24 22 2O
F
i a/~
So.
18 16 14
# g
"2 "0 S
Q
6 4 2 t
0 0
,
h 2
,
i 5
,
i 4
,
i
,
5
I 6
,
averse Concertrouon
i 7
(/moo
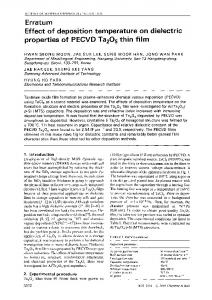
Fig. 2. Deposition rate vs. inverse concenh'ation at RT and 75~ in (a, top) 50/50 v/o ethanol solvents, (b, bottom) aqueous solvents. The dashed lines are the ideal rates from Eq. 7 for the two values of SON-. A significant increase in deposition rate is observed at 75~ at all concentrations. reproducible within a relative error of 5%. Also shown in Fig. 1 are the ideal mass vs. time curves assuming: (i) pure Ni(OH)2 is deposited; a n d (it) the electrochemically generated hydroxyl ions are completely consumed in the deposition process. Under these ideal conditions, the slope of the lines in Fig. 1 were calculated from Faraday's law dm = r o _ So~iAM ~ dt 2F
[7]
where r ~ is the ideal deposition rate (g/s), So~ 9is the stoichiometric coefficient for hydroxyl ions per electron (see reaction 1 or 3), i is the applied current density (A/cm2), A is the electrode area (0.2 cm2), and M ~ is the molecular weight of pure Ni(OH)2 (93 g/mol). The 2 in the denominator results from the 2 tool of hydroxyl ions required to deposit I tool of Ni(OH)2 (see reaction 4). It can be seen in the Fig. 1 that the difference in the predicted rates from the two nitrate reduction reactions (Eq. 1 and 3) is relatively small. Other reduction reactions have been shown to occur (including the hydrogen evolution reaction), although as with Eq. 1 and 3 they have stoichiometric coefficients close to one (i.e., they produce OHions in an approximately 1:1 ratio of OH to e-)P Therefore, the failure of Eq. 7 to predict the deposition rates must be due to violations in the assumptions which lead to Eq. 7. The violation of assumption (it) was discussed in our previous study in which the underutilization (inefficiency) of electrochemically generated hydroxide ions was attributed to the formation of Ni4(OH)44§ which in concentrated Ni(NQ)2 solutions diffuses away from the reaction interface before deposition occurs. 12Relaxing the two assumptions that resulted in Eq. 7, the measured deposition rate, r (g/s), can be related to the ideal rate as follows r = er ~ M~
[81
where 9 is the deposition efficiency and M is the actual molecular weight of the deposited film. Determination of
J. Electrochem. Soc., Vol. 142, No. 12, December 1995 9 The Electrochemical Society, Inc. the deposition efficiency requires knowledge of the actual molecular weight. In our earlier publication it was assumed that M was equal to M~ 1~This assumption is shown below to be invalid since deposition rates greater than that predicted by Eq. 7 are obtained. This is only possible if the actual molecular weight is greater than that of pure Ni(OH)~. Although Eq. 7 does not show an explicit dependence of rate on the Ni(NO~)2 concentration, our previous study revealed that the deposition efficiency and hence the deposition rate is inversely related to this parameter in concentrated solutions. Figure 2a and b illustrate the effect of Ni(NO3)2 concentration on the deposition rates at RT, 50, and 75~ in 50 v/o ethanol and aqueous solvents, respectively. The horizontal dashed lines show the ideal deposition rates (calculated from Eq. 7) for the nitrate reduction reactions given in Eq. 1 and 3. At each concentration in Fig. 2a the deposition rates were virtually identical at RT and 50~ while the deposition rate at 75~ is up to 70% greater than that observed at the lower temperatures (13.6 vs. 8.0 ~g/min at 0.5 M). A similar trend was observed in Fig. 2b. Note that the higher rate at RT compared to 50~ is within experimental error. A feature in these curves not observed in our previous study is that under certain conditions (0.2 and 0.1 M Ni(NO~)2 at 75~ the deposition rate is significantly greater than that predicted by Faraday's law (Eq. 7). As discussed earlier, there are two possible explanations: (i) the electrochemical reaction for the reduction of nitrate could be different t h a n that given in Eq. 1 or 3; and (if) the molecular weight of the deposited film may be greater than that of pure Ni(OH)~. Equation 3 gives the highest stoichiometric constant reported (10:8), yet it is not sufficient to explain the high deposition rates observed. It is more likely that the molecular weight of the deposition product is greater than 93 g/mol, indicating that the deposited films contain co-deposited water and/or ethanol. This is consistent with the widely accepted view that the deposition product is ~-Ni(OH)2, which has been shown to contain approximately 2/3 mol of H20 per tool Ni(OH)~. 2~ Determination of the dischargeable capacity of Ni(OH)2 films via discharge curves provides an additional relationship for M. The dischargeable capacity, Q, is related to the moles of nickel deposited by q-
mFn M
[9]
where m and M are the mass and molecular weight of the deposited film, respectively, and n is the n u m b e r of electrons in the discharge reaction per atom of Ni. From Eq. 9, M can be calculated iI n is known. Though the charge/discharge reaction at the nickel hydroxide electrode is customarily assumed to involve a single electron transfer, 22 there is ample evidence in the literature that the n u m b e r of electrons taking part in the reaction is greater than 1. For example, Corrigan and Knight T Mhave shown using iodometric and electrochemical measurements that the average oxidation state of the charged nickel hydroxide can be as high as 3.6+0.1 which means that approximately 1.6 electrons participate in the charge/discharge reaction. It is assumed here that the n u m b e r of electrons involved in the charge/discharge reaction is considered an unknown. Since there are only two equations (Eq. 8 and 9) and four unknowns (e, n, So~-, and M) three assumptions need to be made in order to extract information from these equations: (i) The highest observed deposition rate is 100% efficient. This corresponds to deposition from aqueous 0.1 M Ni(NO3)2 at 75~ (the deposition rate under these conditions was approximately 25 ~g/min); (if) Equation 3 is the dominant electrochemical reaction occurring during the deposition stated in assumption (i)~ (i.e., SOH- = 10/8); and (iii) The n u m b e r of electrons in the charge/discharge reaction, n, is independent of the deposition conditions. Even if the actual efficiency of deposition under the conditions in assumption (i) is less than 100%, it will not affect the relative trends observed in the deposition data. In aqueous so-
0.5 O.4
,
'
i
,
,
,
i
,
,
4053 .
,
,
,
,
~
,
.
,
.
,
.
,
9
,
9
1.0 M Ni(N03)2
Q
O1 0.3
50
0.2
0-
0.1
0.0
k
.
0
J
100
.
i
.
200
J
.
300
, 400
.
i 500
,
i
,
600
i
,
700
.
i
.
,
.
,
.
900 1000 1100 ~200
BOO
time (sec)
Fig. 3. Discharge curves performed at RT in 3.0 w/o KOH. The films were deposited from 1.0 M Ni(N03)2 solutions in 50 v/o ethanol at RT, 50, and75~ Each deposition was 10 min in duration, resulting in film masses of 34, 34, and 56 ~g, respectively. The dischargeable capacities support tee deposition data in Fig. 1 that show a greater deposition rate at 75~ lutions it is most likely that the reduction of nitrate proceeds according to Eq. 3 since deposition of Ni(OH)2 occurs in the pH range of 6-8. 4 Assumption (iii) should be valid since it has been reported that solvent and/or ions incorporated during the deposition process are removed from the film on voltammetric cycling and therefore do not affect the discharge process. 8'2~Consistent with this we observed that the cyclic voltammograms in 3 % KOH were not affected by the various deposition conditions. Based on the above three assumptions, the following procedure was followed to obtain e, n , and M: (i) Equation 8 was used (with e = 1.0 and SOH of 10/8) to solve for M at the greatest deposition rate observed (25 ~g/min; the discharge curve is shown in Fig. 4); (if) Equation 9 was used to calculate n; (iii) Equation 9 was used to solve for M for all other deposition conditions using the value of n determined in step (if) above; (iv) Equation 8 was used to calculate 9 for all other deposition conditions using the values of M calculated in step (iii) above and SOIl- from Eq. 1 and 3. Discharge curves for the films deposited at RT, 50, and 75~ from 1.0 M Ni(NO3)2 in 50 v/o ethanol solutions (see Fig. 1) are shown in Fig. 3. Each deposition was 10 min in duration, resulting in film masses of approximately 34, 34, and 56 ~g for the films deposited at RT, 50, and 75~ respectively. Even though the mass of the films deposited at 75~ is approximately 65 % greater than the films deposited at 50~ the dischargeable capacity is only 40% greater. This indicates that most, but not all, of the increased deposition rate measured at 75~ is due to the increased deposition of Ni(OH)2, rather than co-deposited solvent. The re-
0.5 0.1 M N i ( N 0 5 ) 2 0.4 RT
>~ >
0.3 0.2
E o
75C A q u e o u s - * ..... 75C 5 0 Z EtOH RTAqueous ....... RTSOZ EtOH
0.1
0.0
Q
L
500
'
lOlOQ
RT
,
1500
,
,.I
2000
,
9
i
i
2500
5(300
time (sec)
Fig. 4. Discharge curves performed at RT in 3% KOH. The films were deposited from 0.1 M Ni(NO~)2 solution. Each deposition was 5 min in duration, resulting in film masses of 90 and 125 l~g for the aqueous solution at RT and 75~ respectively, and 96 and 115 ~g for the 50/50 v/o ethanol solution at RT and75~ respectively.
J. Electrochem. Soc., Vol. 142, No. 12, December 1995 9 The Electrochemical Society, Inc.
4054
Table I. Molecular weights and deposition efficiencies for the films deposited under various conditions. [Ni(NO3)2] Temp. M (~ 0.1 0.1 1.0 0.1 0.1 1.0 1.0 0.1 1.0 0.1 1.0
75 25 25 75 25 75 25 25 25 25 25
Solvent Aqueous Aqueous Aqueous 50%EtOH 50%EtOH 50%EtOH 50% EtOH 75% EtOH 75% EtOH 100%EtOH 100%EtOH
Mw(Eq.3) (g/tool) 128 116 107 133 125 131 109 131 123 148 153
Efficiency Efficiency Eq. (3), (%) Eq.(1),(%) 100 80 13 88 78 22 16 78 16 51 30
b
of R e a c t i o n 6 are a c c e l e r a t e d a t i n c r e a s e d t e m p e r a t u r e s . A c c e l e r a t i n g t h e r e a c t i o n of t h e complex, r e d u c e s its c o n c e n t r a t i o n a t t h e i n t e r f a c e w h i c h r e d u c e s t h e r a t e of diffusion of t h i s species a w a y f r o m t h e e l e c t r o d e a n d t h e r e f o r e i n c r e a s e s t h e d e p o s i t i o n efficiency. However, t h e c o n c e n t r a t i o n of t h e c o m p l e x species, a n d c o n s e q u e n t l y t h e efficiency, a p p e a r s to b e m u c h m o r e s e n s i t i v e to t h e c o n c e n t r a t i o n of Ni(NO3)~ t h a n it is to t h e t e m p e r a t u r e . T h e m o l e c u l a r w e i g h t of t h e films d e p o s i t e d a t 75~ is also g r e a t e r t h a n t h a t of t h e films d e p o s i t e d a t RT. T h i s i m p l i e s t h a t t h e q u a n t i t y of s o l v e n t i n c o r p o r a t e d i n t o t h e a c t i v e m a t e r i a l i n c r e a s e s w i t h t e m p e r a t u r e . As t h e t e m p e r a t u r e increases, t h e d e p o s i t i o n r a t e i n c r e a s e s a n d t h e solv e n t m o l e c u l e s w h i c h are t r a p p e d i n t h e i n t e r l a m e l f a r p l a n e s of t h e n i c k e l h y d r o x i d e are u n a b l e to leave t h e f i l m a t a r a t e c o m p a r a b l e to t h e k i n e t i c s of d e p o s i t i o n . This h y p o t h e s i s w a s v e r i f i e d b y d e p o s i t i n g 50 Fg of t h e a c t i v e m a t e r i a l a t 1.0 a n d 3.0 m A i n 1.0 M Ni(NO3)2 solution. T h e d e p o s i t i o n r a t e o b s e r v e d a t 3.0 m A w a s a p p r o x i m a t e l y five t i m e s g r e a t e r t h a n t h a t at 1.0 mA. T h e h i g h r a t e d e p o s i t i o n r e s u l t e d i n a film w i t h 30% less d i s c h a r g e a b l e c a p a c i t y t h a n t h e one o b t a i n e d f r o m t h e l o w r a t e d e p o s i t i o n . S i n c e the masses were identical, high rate depositions result in m o r e s o l v e n t i n c o r p o r a t i o n i n t o t h e film (i.e., h i g h m o l e c u l a r weight).
,
.
L
.
,
9
,
.
,
.
,
.y
, ,.
.....-':"
-
,
.
r
,
,
.
i
,
,
.-"
So.=1o/8 . " . ' "
90
-~
98 87 24 18 87 18 57 33
maining rate increase must be due to solvent incorporation into the film. A similar mismatch between mass and capacity change is observed for films deposited from 0.i M Ni(NO3)~ solutions. Discharge curves from these films are shown in Fig. 4. Each deposition was 5 min in duration, resulting in film masses of 90 and 125 ~g for the aqueous solution at RT and 75~ respectively, and 96 and 115 ~g for the 50 v/o ethanol solution at RT and 75~ respectively. At 75~ the rates of deposition are 39 and 20% greater than at RT from the aqueous and 50 v/o ethanol solutions, respectively, but the discharge capacity was only 24 and 14% greater. In order to separate the increased rate due to increased deposition efficiency from that due to increased solvent incorporation, the procedure reported above was followed. First, the molecular weight of the film deposited from an aqueous solution of 0.1 M Ni(NO3)2 at 75~ was determined to be 128 g/mol using Eq. 8 (e = 1.0 and Soil- = I0/8). This corresponds to a deposition product of approximately Ni(OH)2 9 2H20. Substituting this molecular weight into Eq. 9 yields a value for n of 1.38 electrons per nickel atom. Equation 7 was then used to solve for M for all other deposition conditions using n = 1.38. Some of the molecular weights are listed in Table I. Finally, the efficiency of the deposition process was estimated from Eq. 8 for two values of Soil . In aqueous solutions the reduction of nitrate most likely proceeds according to Eq. 3 (i.e., Soil = 10/8). However, in solutions of water and ethanol it is not known what the dominant reaction is. Therefore, the deposition effieiencies shown in Table I use Eq. 3 when the solvent is pure water and Eq. 1 and 3 when the solvent is water/ethanol. As shown in Table I, deposition at 75~ is more efficient than that at RT in both concentrated and dilute Ni(NO3)2 solutions. This suggests that either the equilibrium reaction s h o w n i n Eq. 6 lies f a r t h e r t o t h e r i g h t o r t h e k i n e t i c s
.
110
/" .." So.=9/s
70
.......}.."
10 110
~
0
'
I
,
I
1
r
2
I
,
~
5
,
f
4
,
I
5
,
T
6
,
7
B
9
i
10
Time (rain)
Fig. 5. Mass vs. deposition time for deposition in 1.0 M Ni(NO3)2 at 0.5 mA. The measured deposition rates were 2.7, 3.4, 3.9, and 8.6 p$1/min for the 0, 50, 75, and 100 v/o ethanol solutions, respectivel~.~he dashed lines are ~e ideal mass vs. time curves from E'q. 7 for the two values of SOt 9
Not only is the rate of deposition important in determining the molecular weight of the deposited film, but the lattice spacing available for the solvent may also be important. This conclusion was drawn by comparing films deposited at 25~ from a 0.i M Ni(NO3)2 in 50 v/o ethanol solutions to those deposited at 75~ in 1.0 M solutions. The molecular weights of the films deposited under the two conditions were essentially equal (4% difference) even though the rate in the former case (i.e., lower temperature and lower concentration) was 56% higher. We concluded that the additional solvent that would be incorporated owing to the higher rate was olfest by the decreased lattice spacing at the lower temperature. An alternate explanation is that more nitrate was incorporated into the film in the more concentrated solution. Therefore, a film was deposited at 25~ from a 0.I M Ni(NO3)~ solution saturated with NaNO~. Neither the deposition rate nor the molecular weight of the deposited film was affected by the nitrate concentration indicating that it was probably the increased lattice spacing of the films at 75~ compared to 25~ that decreased the tendency of the solvent to move out of the film.
The effect of ethanol.--Plots of m a s s vs. t i m e for d e p o s i t i o n in 1.0 M Ni(NO~)~ dissolved in solvents consisting of 0, 50, 75, and i00 v/o ethanol at 0.5 mA (2.5 mA/em ~) are shown in Fig. 5. Also plotted in Fig. 5 are the mass vs. time curves predicted from Faraday's law (Eq. 7). Independent of the solvent composition, the mass of the deposit increased linearly with time, indicating a constant rate of deposition. Deposition rates were observed to increase as the ethanol content increased, with the most significant 0,5
,
.
,
.
,
.
,
.
,
9
,
9
,
.
,
1.0 M N i ( N 0 3 ) 2 0.4
5 0.3
0.2
OZ EtOH I
o o_
507. EtOH ;
I
1007. EtOH
-~ 757. EtOH
0.1
0.0
0,
, 200 , , 400 , , 600 , i, 800 '" ' 1000 ' ' 1200 ' " 1 4'00' 1"006 time (sec)
Fig. 6. Discharae curves performed at RT in 3.0 w/a KOH. The films were deposl'fed from 1.0 M Ni(.N.O3)2solution. Each deposition. was 10 min in duration resulting in film masses of 27, 34, 39, and 86 ~g for.the solutions containing 0, 50, 75, and 100 v/o ethanol, respectively.
J. Electrochem. Soc., Vol. 142, No. 12, December 1995 9 The Electrochemical Society, Inc. -
i
-
,
-
,
.
,
.
,
9
,
.
,
.
9
.
j
.
,
41
,
51
,
61
.
7l
'
~*
'
91
'
1 I0
20 18 c
E
s..v.=.?.L~ .............
16 14
12 10
~a c]
8 6
~
4
0Z EtOH
2 0
0
,
~
21
31
Inverse Conc entrotion ( I / t o o l )
Fig. 7. Deposition rate vs. inverse Ni(NO3}2 concentration at 0.5 mA for 0, 50, 75, and 100 v/o ethanol solutions. The horizontal dashed lines show the ideal deposition rates calculated from Eq. 7 for the two values of SOH-. increase observed between 75 and 100 v/o. The measured deposition rates were 2.7, 3.4, 3.9, and 8.6 t~g/min for the 0, 50, 75, and 100 v/o ethanol solutions, respectively. Typical discharge curves for films deposited from the above solutions are shown in Fig. 6. Each deposition was 10 min in duration, resulting in film masses of 27, 34, 39, and 86 Ixg for the solutions containing 0, 50, 75, and 100 v/o ethanol, respectively. The rates of deposition from the 100, 75, and 50% ethanol solutions are 220, 45, and 26% greater than that from the aqueous solution, but the capacities calculated from the discharge times are 120, 20, and 19% greater. Again, this implies that the measured mass change observed in Fig. 5 is due to a combination of increased Ni(OH)2 and solvent deposition. The effect of Ni(NO3)2 concentration on the deposition rate is illustrated in Fig. 7. The horizontal dashed lines show the ideal deposition rates calculated from Eq. 7. At both 1.0 and 0.5 M Ni(NO3)2, the deposition rate increases with increasing ethanol content. However, at 0.1 M Ni(NO3)2 the deposition rate is lowest at the highest ethanol content. This anomalous trend suggests that the chemistry in pure ethanol is different from that occurring in solvents containing water. This may be due either to the nickel complex formation given in Eq. 5 or the electrochemical reduction reaction occurring at the surface of the electrode. 'l~Fpical discharge curves for films deposited from 0.1 M Ni(NO3)2 solutions are shown in Fig. 8. Each deposition was 5 min in duration, resulting in film masses of 90, 96, 101, and 76 t~g for the solutions containing 0, 50, 75, and 100 v/o ethanol, respectively. Figure 8 shows that the dischargeable capacity for the films deposited from the solutions containing 0, 50, and 75 v/o ethanol are essentially identical. This 0.5 Q.1 M Ni(N05)2 0.4
0.3
0.2
1 00Z EtOH
50Z EtOH 75Z EtOH
0.1
07. EtOH 0,0 0
200
400
600
800 1000
1200
1400
1600
1800
2000 2200
t;me ( s e c )
Fig. 8. Discharge curves performed at RT in 3.0 w/a KOH. The films were deposited from 0.1 M Ni(NO3) 2 solution. Each deposition was 5 min in duration resulting in film masses of 90, 96, 101, and 76 ~g for the solutions containing O, 50, 75, and 100 v/o ethanol, respectively.
4055
indicates that the differences in the rate of increasing mass from 0.1 M Ni(NO~)2 are not owing to different deposition rates of Ni(OH)2 b u t to differences in the molecular weight of the films (increasing co-deposition of water and/or ethanol with increasing ethanol in solution). Finally, the capacity of the film deposited from the 100 v/o ethanol solution is seen to be 35% less than that of the other films, but the mass of deposit is only 16% less than the film deposited from the aqueous solution. Again, this indicates that the efficiency of the deposition process or the electrochemical reaction changes significantly when very little water is present in solution. The molecular weights listed in Table I show two trends with respect to ethanol content. First, the molecular weight of the deposit is observed to decrease with increasing Ni(NO3)2 concentration. As stated earlier, this is mostly likely due to the decrease in deposition rate at higher concentrations. The values of 107 and 109 g/tool for the 1.0 M solutions dissolved in aqueous and 50 v/o ethanol solutions, respectively, are consistent with the value of 105 g/tool reported elsewhere. 2~ The second trend observed in Table I is that the molecular weight of the deposit increases with increasing ethanol content in the solvent. The value of 153 g/mol for the 1.0 M solution dissolved in 100 v/o ethanol corresponds to a deposition product of approximately Ni(OH)z - 4/3EtOH. The increased molecular weight with increasing ethanol is likely due to the increased incorporation of ethanol into the film. This further supports the argument that solvent rather than ions are the cause of molecular weights being higher than the 93 g/mot expected for pure Ni(OH)2.
Conclusions An electrochemical quartz crystal nanobalance (EQCN) was used to measure in situ the mass of the nickel hydroxide films and constant current discharges were used to determine the electrochemical capacity of the films. These data were used to determine the effects of temperature and ethanol content of the nitrate solution on: (i) the efficiency of electrochemical deposition of nickel hydroxide; and (it) the molecular weight of the deposited active material. The increase in the efficiency at high temperature was attributed to a n increased rate of reaction of the nickel complex at the surface of the electrode. The increase in molecular weight at high temperature was attributed to a combination oi an increase in the rate of deposition caused by the increase in efficiency and a n increase in the lattice spacing of the active material. The effect of ethanol on efficiency was insignificant except in 100% ethanol. The absence of water in the solvent seems to have an effect on the deposition chemistry. The molecular weight, however, increased with increasing ethanol content confirming the assumption that solvent is incorporated into the film during the deposition process. Understanding the effect of operating conditions on the efficiency of the electrochemical reaction and the molecular weight of the deposited active material should lead to improvements in the quality of porous plaques which are electrochemically impregnated. For example, increased efficiency not only lowers operating costs but it may also result in a more uniform deposition since less current is needed for a given deposition rate. The quality of the impregnated porous plaques can also be affected by the amount of solvent incorporated into the active material. Higher molecular weight means greater solvent content in the deposited material and consequently an accelerated decrease in porosity over time. As the porosity decreases the uniformity of the electrochemical reaction decreases because the effective ionic conductivity of the solution decreases. The degree to which efficiency and molecular weight affect the quality of the impregnated plaques, however, will require a mathematical model incorporating m a terial transport into the pores and the appropriate solution chemistry. Optimum conditions suggested in growing planar films may not be appropriate for porous plaques. For example, this study suggests that impregnating at low concentrations of nickel nitrate is most desirable due to the
J. Electrochem. Soc., Vol. 142, No. 12, December 1995 9 The Electrochemical Society, Inc.
4056
high efficiencies that are achieved. However, low concentrations of nickel may lead to nonuniform loading if the nickel cannot penetrate the porous plaque. The fundamental understanding of the deposition process gained through this work should enable the impregnation of porous plaques to be more thoroughly modeled and ultimately enable higher quality and less expensive electrodes to be manufactured. These data may also be used in conjunction with a model of a planar electrode to deduce the chemical equilibrium constants that govern the deposition process.
Acknawlegments The authors acknowledge financial support from the Office of Research and Development of the United States Central Intelligence Agency for this project. The authors also acknowledge Mark Hines for valuable discussions regarding aqueous nickel chemistry and Jenny Wu for experimental assistance. Manuscript submitted March script received Aug. 22, 1995.
30, 1995; revised manu
The University of South Carolina assisted in meeting the publication costs of this article. REFERENCES 1. M. K. Carpenter, R. S. Conell, and D. A. Corrigan, Solar Energy Mater., 16, 333 (1987). 2. R Delichere, S. Joiret, A. Hugot-Le Goff, K. Bange, and B. Metz, This Journal, 135, 1856 (1988). 3. S. Gross, Review of Electrochemical Impregnation for Nickel Cadmium Cells, Jet Propulsion Laboratory,
California Institute of Technology, Pasadena, CA (1977). 4. H. N. Seiger and V. J. Puglisi, in Proceedings of the Power Sources Symposium, 26, 115 (1974). 5. D. E Pickett and J. T. Maloy, This Journal, 125, 1026 (1978). 6. K. Ho, ibid., 134, 52C (1987). 7. K. Ho and J. Jorn~, ibid., 137,149 (1990). 8. E Portemer, A. Delahaye-Vidal, and M. Figlarz, ibid., 139, 671 (1992). 9. Langes Handbook of Chemistry, 14th ed., J. A. Dean, Editor, McGraw-Hill, Inc., New York (1992). 10. R K. Ng and E. W. Schneider, This Journal, 133, 17 (1986). ii. D.A. Corrigan and R. M. Bendert, ibid., 136,723 (1989). 12. C. C. Streinz, A. P. Hartman, S. Motupally, and J. W. Weidner, ibid., 142, 1084 (1995). 13. C. E Baes and R. E. Mesmer, The Hydrolysis of Cations, p. 242, John Wiley & Sons, New York (1976). 14. D. M. MacArthur, This Journal, 117, 730 (1970). 15. D. A. Corrigan, ibid., 134, 377 (1987). 16. D.A. Corrigan and S. L. Knight, ibid., 136, 613 (1989). 17. R. M. Bendert and D. A. Corrigan, ibid., 136, 1369 (1989). 18. S. I. Cordoba-Torresi, C. Gabrielli, A. Hugot-Le Goff, and R. Torresi, ibid., 138, 1548 (1991). 19. Technical Manual, Electrochemical Quartz Crystal Nanobalance, System EQCN-500, Elchema, Potsdam, NY. 20. H. Bode, K. Dehmelt, and J. Witte, Electrochim. Acta, 11, 1079 (1966). 21. D. M. MacArthur, This Journal, 422, 730 (1970). 22. R. Barnard and C. E Randell, J. Appl. EIectrochem., 13, 97 (1983).
Initiation of Corrosion Pits at Inclusions on 304 Stainless Steel Ruoru Ke* and Richard Alkire** Department of Chemical Engineering and Materials Research Laboratory, University of Illinois at Urbana-Champaign, Urbana, Illinois 61820, USA ABSTRACT Onset of pitting corrosion on 304 stainless steel in 0.I M NaCI was investigated at the site of approximately 200 inclusions. A photolithography technique was used to locate individual sites repeatedly in order to characterize them by a combination of scanning electron microscopy, energy dispersive x-ray, and Auger electron spectroscopy methods. Growth of pits to significant size was found to occur only at MnS and mixed MnS/oxide inclusions which had sizes above 0.7 ~m. In early stages of initiation, the inclusion dissolved, the Mn and Cl surface concentrations were found to be high within the pit cavity, and the S concentrations were high in the cavity as well as the surrounding area. Smaller sulfide inclusions and all multielement oxide inclusions either did not initiate pits or initiated only small trenches before becoming repassivated. Under conditions of severe corrosion, Cu was detected on MnS inclusions, and was traced to the appearance of flower-like deposits which formed prior to significant pit growth.
Introduction It is well known that the sites where corrosion pits form are frequently related to microscopic features of a metal surface. ~-6For stainless steel, the location of corrosion pits has been found to be associated with inclusions and second phase precipitates, as shown in the extensive works of Wraglen, I Eklund, 2- and Szklarska-Smialowska?-6 It has been recognized that sulfide iclusions, if present, will act as pit nucleation sites, ~ although questions remain about the relative importance of various types of inclusions on the pitting of stainless steel. 7In the present paper, the behavior of inclusions of various compositions was monitored during initiation of pitting of 304SS in C1- containing solution in order to relate inclusion composition to corrosion behavior. Smialowski et al. ~ investigated pitting of 18Cr-9Ni austenitic stainless steel i n 0.5 M NaC1 and proposed that pits preferentially nucleate at sulfide inclusions present * Electrochemical Society Student Member. ** Electrochemical Society Fellow.
either in the form of separate particles or as shells surrounding the oxides; they reported that no pitting occurred at particles composed only of oxides. However, Wagner et al. 7reported that pits were seen to nucleate at various nonmetallic inclusions in various 18Cr-10Ni steels including oxide, sulfides, silicates, and also at precipitates of carbides and carbonitrides. Cihal et al. 8investigated 18Cr-9Ni with 0.4-0.9% Ti in which nonmetallic inclusions of titan i u m sulfides, oxides, and carbonitrides were present, and found that only the oxides were effective in nucleating pits. High spatial resolution scanning electron microscopy (SEM) and surface analytical studies have provided evidence that MnS inclusion dissolution is the initial step in a variety of systems in which pit formation occurs on stainless steels 316 and 3047 -6'9-~2 According to Horowitz, 13both choloride and thiosulfate ions have been shown to be aggressive species which chemisorb on the stainless steel passive film. In addition, it has been demonstrated 14'~5that thiosulfate ions alone (i.e., in the absence of C1-) exert no noticeable aggressive effect on the passive film. Lott and Alkire g'~~reported that both