Hindawi Publishing Corporation Mathematical Problems in Engineering Volume 2014, Article ID 781395, 9 pages http://dx.doi.org/10.1155/2014/781395
Research Article The Effect of Travel Information on Travelers’ Choice of Travel Modes and Routes: A Case Study of the Travel between the Campuses Linjie Gao,1 Zhicai Juan,2 Anning Ni,1 and Peng Jing2 1 2
School of Naval Architecture, Ocean & Civil Engineering, Shanghai Jiao Tong University, Shanghai 200240, China Antai College of Economics & Management, Shanghai Jiao Tong University, Shanghai 200052, China
Correspondence should be addressed to Linjie Gao;
[email protected] Received 18 November 2013; Revised 25 January 2014; Accepted 27 January 2014; Published 10 March 2014 Academic Editor: Baozhen Yao Copyright © 2014 Linjie Gao et al. This is an open access article distributed under the Creative Commons Attribution License, which permits unrestricted use, distribution, and reproduction in any medium, provided the original work is properly cited. The traffic state of the urban road network is determined by travelers’ choices of travel modes and routes. With the development of science and technology, people tend to have more travel choices and their distinctive temperaments often lead to different choices even in the same situation. Therefore, a study of different factors that may affect people’s travel choices plays a crucial role in the optimization of the traffic system. Focusing on the four major travel modes between Minhang campus and Xuhui campus of Shanghai Jiao Tong University (SJTU) in Shanghai, China, this paper tries to gather the information of the factors that affect travel choices and the extent of such effects both in general cases and when prior information is given by means of questionnaires. Based on data processing, the paper draws pie charts on the travel choices under different circumstances and makes a qualitative analysis of the influential factors. Then, a quantitative analysis is made by using the models of utility function and linear programming. Finally, in contrast with the results, the paper finds out the extent of the effect of travel information on the choice of travel modes and routes of the travelers with different temperaments.
1. Introduction In everyday life, our travel is faced with the choices of travel modes and routes. Since every traveler expects to spend the shortest time arriving at the destination at the least cost, they must make the choice according to the comparison and contrast of the available information. Therefore, the effect of the travel information on the travelers’ choice behavior remains the focus of research scholars in the world. With a clear understanding of such a choosing process and its influential factors, we can promote the research and optimization of the travel behavior and the thorough traffic network. The combination of fare, time, stability, comfort, convenience, and other factors will affect travelers’ choice of travel modes and routes in different ways. As we know, travel information has an effect on travelers’ expectation
of the utility of the travel plan which is closely related to travelers’ temperament. That is to say, travelers with different temperaments will make different choices when confronted with the same information. Consequently, it is significant to study the effect of travelers’ temperament on the travel choice. This paper mainly focuses on how the variables of the factors that determine the utility expectation affect the choice of travel modes and routes of the travelers with different temperaments facing various travel information. Also, the paper aims to analyze the effect of the travel information on the travel behavior. The paper consists of five sections as follows. Section 2 is literature review, concerning the focus of research. Section 3 relates the research thought and the research methods. Section 4 dwells upon the data collection and the modeling analysis. And the last section is about the research conclusion and the future research directions.
2
Mathematical Problems in Engineering Table 1: Characteristics of travel modes.
Travel modes
Fare
Time
School bus
¥4
40–45 min
Bus and metro
¥5
60–70 min
Once every 5 to 10 minutes
Regular bus
¥2
70–80 min
Once every 15 minutes
over ¥80
40–50 min
Anytime
Taxi
Frequency 10 times a day from Mon to Fri; 4 times a day on weekends
Convenience 5-to-20-minute walk to school bus stop; wait in line 15 minutes in advance for students 15-to-20-minute walk to bus stop; 0-to-10-minute wait; 0-to-5 minutes for transfer 20-minute walk to bus stop; 0-to-15-minute wait Less-than-15-minute walk to entrance
Stability
Comfort
8
8
10
6
8
5
6
9
Notes: stability scale 1 to 10: the least stable to the most stable; comfort scale 1 to 10: the least comfortable to the most comfortable.
2. Literature Review With the development of information and communication technology, travelers are increasingly concerned about travel information before and during the travel and accordingly make their travel choices. Since the effect of travel information on travelers’ choice during the actual travel is hard to obtain and analyze, most researchers focus more on the collection of the stated preference data and the analysis of the effect of travel information on travel decision behavior and traffic system under experimental and virtual circumstances. Since the 1990s, the scholars, represented by Hani Mahmassani at University of Texas in the USA and Yasunori Iida at Kyoto University in Japan, have made a lot of advancements in the field. By setting up the traffic simulation platform and constructing the two-route network or simple network with single origin and destination, they studied the effect of travelers’ behavior on traffic system with the available travel information in the experimental and analytical methods and analyzed the effect of travel information and its reliability on travel behaviors [1–4]. Later, Koutsopulos et al. made further studies in this direction [5–11]. Ewing et al. examined the relationship between mode of travel to school and the full range of factors that might affect mode choice [12]. ShuSen et al. classified travel into rigid travel and flexible travel. Shu-Sen et al. held that travelers also take fare, comfort, safety, and other factors of various travel modes into account, besides travel properties as travel distance and destination [13]. Wei-Guo and Si-Ji made a study of travelers’ choice of travel modes in the simulation method rather than in the traditional mathematical and sampling method [14]. de Palma and Picard studied on route choice decision based on the ordered probit analysis and econometric estimates under travel time uncertainty [15]. Khattak et al. analyzed travelers’ willingness to pay for better quality information received from a traveler information system [16]. Besides, Chorus et al. made route choice and mode choice studies based on simulation [17–19]. All the researchers have made abundant studies of travelers’ choice of travel modes or routes, or the combined choice of both. In their studies, the factors that affect travelers’ choice
mainly focus on time, fare, stability, comfort, and convenience. The research methods of theirs are either qualitative, by posing the influential factors, or comparison and contrast of the results in the simulation or experimental methods, or by means of actual sampling. However, seldom did they make a quantitative analysis of all the factors. This paper will make a study of the extent of the effect of the variables of the factors on the choice of travel modes and routes of travelers with different temperaments, in the combined qualitative and quantitative methods.
3. Research Thought and Methodology In the recent 15 years, almost every university has several campuses due to the large-scale consolidation of universities and colleges in China. Commuting between campuses is increasingly becoming representative of urban travel. Therefore, this paper makes a study of the commuting system of Minhang campus and Xuhui campus of Shanghai Jiao Tong University (SJTU) in China, choosing students as the respondents. With a distance of 25 kilometers between the two campuses, the optional travel modes consist of school buses, the transfer from buses to metro (bus and metro), regular buses, and taxis. The characteristics of the four travel modes are shown in Table 1. First of all, travelers are divided into four types according to the four temperaments from Galen [20]: (i) sanguine (Type A travelers): excited-pleasant and shallow-broad, (ii) choleric (Type B travelers): exited-unpleasant and deep-broad, (iii) phlegmatic (Type C travelers): calm-pleasant and shallow-narrow, (iv) melancholic (Type D travelers): calm-unpleasant and deep-narrow.
Mathematical Problems in Engineering
Classification of travelers
3 Optional travel modes and routes
In general cases
Influential factors
Given/not given the prior information
When time is pressing
Questionnaire Adjustment of the weight of the variables
In bad weather Data processing
Utility function Pie charts
Qualitative analysis
Quantitative analysis Linear programming
The extent of the effect of travel information
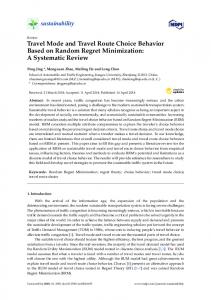
Figure 1: Framework of research.
Thereafter, we design the questionnaire with the subject of the effect of travel information on the travelers’ choice of travel modes and routes. Second, we study the choosing behavior of the travelers with the four temperaments under the following three circumstances by means of paper questionnaires and online survey. (A) Given (or not given) the prior information of various travel modes, how travelers choose the available travel modes and routes. (B) Under different preconditions, how travelers choose the travel modes and routes. (C) How travelers change their former decisions with the change of the variables of the travel modes (fare, schedule, comfort, routes, etc.). Finally, by screening the collected questionnaires, we take in the valuable data, make a quantitative analysis of the priority of choosing travel modes by means of utility function and make a contrast with the actual research results; then, by making adjustments to the weight of the variables (fare, time, stability, comfort, and convenience) by way of linear programming, we make the results of utility function approaching the actual results and arrive at the extent of the effect of the variables on the choice of travel modes. The framework of the research is shown in Figure 1.
4. Data Collection and Modeling Analysis 4.1. Data Collection. A total of 597 questionnaires had been issued to students, 420 in paper version and 177 sent online. At the end of the survey, 459 questionnaires were collected, 282 in paper version and 177 received online. Through the initial screening, there are 204 valid questionnaires excluding
255 invalid questionnaires (which cannot be used in the qualitative analysis).
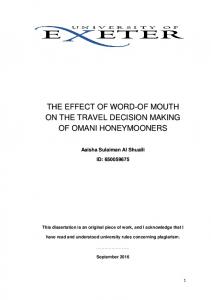
4.2. Qualitative Analysis of the Influential Factors 4.2.1. Time Outweighs Comfort (concerning the Extent of Their Effect). As we know, taxis take priority among the four travel modes, when time and comfort are concerned. From Figures 2(a), 2(b), and 2(c), we can see that there is a drastic rise in the percentage of choosing taxis as the travel mode when time is pressing and in bad weather. The 1% in general cases increases to 33% when time is pressing and to 25% in bad weather. There are more respondents who tend to give priority to time (by taking taxis) when time is pressing than those who tend to give priority to comfort (by taking taxis) in bad weather.
4.2.2. Comfort Outweighs Stability (concerning the Extent of Their Effect). From Figure 2(d), we can see, concerning commuting with a frequency of five days a week, only a small proportion of respondents choose regular buses and taxis; comparatively, the percentage of choosing the transfer from buses to metro decreases from 44% to 27%; however, the percentage of choosing school buses increases from 46% to 67%. That is to say, under such circumstances, school buses occupy a predominant position. As we see, when the transfer from buses to metro and school buses are concerned, they bear similarities in time, fare, and convenience but differ in comfort and stability which may affect travelers’ choice. Due to the limit of capacity, school buses cannot allow all the students to wait in line on board. Therefore, school buses are more comfortable while the transfer from buses to metro tend to be more stable. On average, comfort outweighs
4
Mathematical Problems in Engineering When time is pressing
In general cases 1% 9%
12%
33%
46%
44%
3%
School bus Bus and metro
Regular bus Taxi
52%
School bus Bus and metro
(a)
Regular bus Taxi (b)
Under the condition of commuting five days a week 5% 1%
In bad weather 25% 27% 44%
7% 67%
24% School bus Bus and metro
Regular bus Taxi (c)
School bus Bus and metro
Regular bus Taxi (d)
Figure 2: The proportion of the choices of travel modes under different circumstances.
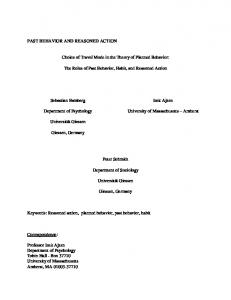
stability among the five factors that influence the travelers’ choice. 4.2.3. The Extent of the Effect of Stability on Travelers’ Choice Rises with the Extent of the Travelers’ Introversion. In general cases, if given prior information (the estimated time, fare, and route of various travel modes), the choices of travelers with different temperaments are shown in Figure 3. The transfer from buses to metro is characteristic of stability. As is seen from Figure 3, the percentage of travelers’ choosing the transfer from buses to metro is changing with their different temperaments. For those extroverted travelers,
the percentage is 25% for sanguine (Type A travelers) and 27% for choleric (Type B travelers); while for those introverted travelers, the percentage rises to 31% for phlegmatic (Type C travelers) and 53% for melancholic (Type D travelers). Therefore, we think the introverted travelers tend to choose the travel modes of strong stability and the extent of the effect of stability on travelers’ choice rises with the extent of the travelers’ introversion.
4.2.4. The Effect of Fare Is Evident, Especially Greater on Introverted Travelers. We see from Figure 4, only 16% of respondents are willing to choose school buses as the travel
Mathematical Problems in Engineering
14%
5
Type A travelers 0%
15%
Type B travelers 0%
58%
25% 61%
School bus Bus and metro
27%
Regular bus Taxi
School bus Bus and metro
(a)
Regular bus Taxi (b)
Type C travelers 2%
Type D travelers 7% 0%
14%
40%
53% 53%
31%
School bus Bus and metro
Regular bus Taxi (c)
School bus Bus and metro
Regular bus Taxi (d)
Figure 3: The proportion of the choices of travel modes of travelers with different temperaments.
mode, when the fare rises from ¥4 to ¥8. It is easy to see that travelers are greatly affected by the factor of fare. From Figure 5, we can see that 19% of Type A students, 26% of Type B students, 10% of Type C students, and 6% of Type D students keep choosing school buses, even when there is a rise of fare from ¥4 to ¥8. Therefore, we consider introverted travelers to be more affected by the change of fare. In another word, the effect of fare is greater on introverted travelers than extroverted ones. 4.3. The Quantitative Analysis of the Factors 4.3.1. Quantitative Evaluation of the Factors. According to the data from the questionnaire of the factors that affect the choice of travel modes, we average the evaluation data from
travelers with different temperaments and the travelers on the whole, as is seen in Table 2. 4.3.2. Quantitative Evaluation of the Travel Modes. We average the data of overall evaluation of all travel modes chosen by different types of respondents in the survey, as is seen in Table 3. 4.3.3. Linear Programming. Due to the few samples of Type D travelers, we failed to make a quantitative analysis. The frequently chosen travel modes between two campuses are school buses and the transfer from buses to metro, rather than regular buses and taxis. According to the observation of the data, travelers’ evaluation of the regular buses does
6
Mathematical Problems in Engineering Table 2: The evaluation utility of the factors that affect the travel mode choice.
Types of travelers
Travel modes School Bus Bus and Metro Regular Bus Taxi School Bus Bus and Metro Regular Bus Taxi School Bus Bus and Metro Regular Bus Taxi School Bus Bus and Metro Regular Bus Taxi School Bus Bus and Metro Regular Bus Taxi
Type A travelers
Type B travelers
Type C travelers
Type D travelers
Type A travelers
Fare 2.58 1.32 1.95 0.16 2.76 1.24 2.00 0.00 2.58 1.50 1.92 0.00 3.00 1.60 1.40 0.00 2.67 1.38 1.91 0.04
Time 2.47 1.37 0.37 1.79 2.48 1.62 0.10 1.81 2.08 1.75 0.29 1.88 0.80 2.00 0.80 2.40 2.22 1.62 0.29 1.87
Stability 2.05 2.00 0.74 1.21 1.52 2.38 0.90 1.19 1.58 2.50 0.83 1.08 1.00 2.20 0.80 2.00 1.65 2.30 0.83 1.22
Comfort 1.84 1.37 0.32 2.47 1.81 1.33 0.38 2.48 2.08 1.33 0.38 2.21 1.00 1.60 1.20 2.20 1.86 1.36 0.42 2.36
Convenience 2.05 1.37 0.42 2.16 1.76 1.67 0.38 2.19 1.75 1.67 0.75 1.83 1.00 1.80 1.20 2.00 1.78 1.59 0.58 2.04
Regular bus 1.05 1.10 1.13 1.60
Taxi 0.21 0.33 0.60 1.60
Table 3: The overall evaluation utility of the travel modes. Types of travelers Type A travelers Type B travelers Type C travelers Type D travelers
School bus 2.53 2.10 2.17 0.00
Bus and metro 2.21 2.48 2.43 2.80
To what extent that when the fare increases you would not consider taking school buses? 16% 24%
not agree with the real condition. Therefore, disregarding the regular buses, the analysis is only made of the other three travel modes: school buses, the transfer from buses to metro, and taxis. Consider the following. Assume that 𝑋, 𝑌, 𝑍, 𝑃, and 𝑄 represent the variables of the five factors: fare, time, stability, comfort, and convenience.
10%
26%
Assume that 𝑆 = 𝑎 + 𝑏 + 𝑐 + 𝑑 + 𝑒, and 0 ⩽ 𝑆 ⩽ 1.
24%
¥5 ¥6 ¥7
Assume that 𝑎, 𝑏, 𝑐, 𝑑, and 𝑒 represent the weight of the five factors: fare, time, stability, comfort, and convenience.
We get the evaluation of all the travel modes. ¥8 Over ¥8
Figure 4: The analysis of the effect of fare on the choice of school buses.
School buses: 𝑆1 = 𝑎 ∗ 𝑋11 + 𝑏 ∗ 𝑌12 + 𝑐 ∗ 𝑍13 + 𝑑 ∗ 𝑃14 + 𝑒 ∗ 𝑄15. (1)
Mathematical Problems in Engineering
7 Type B travelers
Type A travelers 19%
22%
26%
29%
6%
28%
11% 16%
25% 18% ¥5 ¥6 ¥7
¥5 ¥6 ¥7
¥8 Over ¥8
¥8 Over ¥8
(a)
(b)
Type D travelers
Type C travelers 10%
0%
14%
14%
6%
27%
47% 35%
27% 20% ¥5 ¥6 ¥7
¥8 Over ¥8 (c)
¥5 ¥6 ¥7
¥8 Over ¥8 (d)
Figure 5: The analysis of the effect of fare on different types of travelers’ choice of school buses.
Transfer from buses to metro: 𝑆2 = 𝑎 ∗ 𝑋21 + 𝑏 ∗ 𝑌22 + 𝑐 ∗ 𝑍23 + 𝑑 ∗ 𝑃24 + 𝑒 ∗ 𝑄25. (2) Taxis: 𝑆4 = 𝑎 ∗ 𝑋41 + 𝑏 ∗ 𝑌42 + 𝑐 ∗ 𝑍43 + 𝑑 ∗ 𝑃44 + 𝑒 ∗ 𝑄45. (3) According to the data in Table 3, we can see the relation among 𝑆1, 𝑆2, and 𝑆4 for the three types of travelers as follows: for Type A travelers, 𝑆1 > 𝑆2 > 𝑆4; for Type B travelers, 𝑆2 > 𝑆1 > 𝑆4; for Type C travelers, 𝑆2 > 𝑆1 > 𝑆4.
According to linear programming macro command, we set target function as MIN (1 − 𝑆), with the constraints as follows: (1) 𝑆 ≤ 1, 𝑎 > 0, 𝑏 > 0, 𝑐 > 0, 𝑑 > 0, 𝑒 > 0; (2) Type A travelers: 𝑆1 > 𝑆2 > 𝑆4; Type B travelers: 𝑆2 > 𝑆1 > 𝑆4; Type C travelers: 𝑆2 > 𝑆1 > 𝑆4; (3) setting constraints on the upper and lower limits of the weight 𝑎, 𝑏, 𝑐, 𝑑, and 𝑒 in various cases, as is shown in Table 4. The processing results of linear programming are shown in Table 5. (/ represents that there are no results that agree with the condition.)
8
Mathematical Problems in Engineering Table 4: The range of the weight of the factors.
Upper limit Lower limit
0.5 0.05
0.5 0.1
0.5 0.15
0.45 0.05
0.45 0.1
0.45 0.15
0.4 0.05
0.4 0.1
0.4 0.15
Table 5: The extent of importance of the factors. Types of travelers
Type A travelers
Type B travelers
Type C travelers
Overall travelers
Upper limit 0.50 0.50 0.50 0.45 0.45 0.45 0.40 0.40 0.40 0.5 0.5 0.45 0.45 0.4 0.4 0.5 0.5 0.45 0.45 0.4 0.4 0.50 0.50 0.45 0.45 0.40 0.40
Lower limit 0.05 0.10 0.15 0.05 0.10 0.15 0.05 0.10 0.15 Total 0.05 0.1/0.15 0.05 0.1/0.15 0.05 0.1/0.15 Total 0.05 0.1/0.15 0.05 0.1/0.15 0.05 0.1/0.15 Total 0.05 0.1/0.15 0.05 0.1/0.15 0.05 0.1/0.15 Total
Fare 0.48 0.42 0.35 0.45 0.42 0.35 0.40 0.40 0.35 3.62 0.05 / 0.05 / 0.06 / 0.16 0.05 / 0.05 / 0.06 / 0.16 0.05 / 0.05 / 0.05 / 0.15
Time 0.05 0.10 0.15 0.05 0.10 0.15 0.05 0.10 0.15 0.90 0.15 / 0.09 / 0.05 / 0.29 0.15 / 0.09 / 0.05 / 0.29 0.05 / 0.05 / 0.05 / 0.15
Stability 0.05 0.10 0.15 0.09 0.10 0.15 0.15 0.12 0.15 1.05 0.50 / 0.45 / 0.40 / 1.35 0.50 / 0.45 / 0.40 / 1.35 0.50 / 0.45 / 0.40 / 1.35
Comfort 0.37 0.28 0.20 0.36 0.28 0.20 0.35 0.28 0.20 2.53 0.05 / 0.05 / 0.05 / 0.15 0.05 / 0.05 / 0.05 / 0.15 0.05 / 0.05 / 0.05 / 0.15
Convenience 0.05 0.10 0.15 0.05 0.10 0.15 0.05 0.10 0.15 0.90 0.25 / 0.36 / 0.34 / 0.96 0.25 / 0.36 / 0.34 / 0.96 0.24 / 0.18 / 0.11 / 0.53
Optimized results 0.00 0.00 0.00 0.00 0.00 0.00 0.00 0.00 0.00 0.00 / 0.00 / 0.10 / 0.00 / 0.00 / 0.10 / 0.11 / 0.22 / 0.34 /
Notes: the column of optimized results represents the weight that cannot be classified into a certain category after linear programming.
4.3.4. The Analysis of the Results. From Table 5, we can see that for Type A travelers, the ranking of the factors that affect the choice of travel modes and routes is fare > comfort > stability > time and convenience. For Types B and C travelers, the ranking is stability > convenience > time > comfort > fare. For all the travelers, the ranking is stability > convenience > fare, time, and comfort. Therefore, we can see that the prior information consisting of all the influential factors has a different effect on the choice of travel modes and routes of the travelers with different temperaments. The overall analysis of the travelers conceals the effect of temperaments on travel behaviors. From the figures of the optimized results in the quantitative analysis of all the travelers, we can also see that there is a bigger error
if the analysis of travel behaviors excludes the distinction of temperaments.
5. Conclusion This paper has classified travelers into four types according to the temperaments and collected the evaluation data of the factors that affect their choice of travel modes and routes under three different circumstances. We have made a detailed study of the extent of the importance of the effect of the five factors on the different types of travelers’ choice of travel modes and routes in general cases and with prior information, by means of the qualitative and quantitative analysis. We can discover the important effect of
Mathematical Problems in Engineering temperaments on travelers’ choice of travel modes and routes. For Type A travelers (sanguine) and Type B/C travelers (choleric/phlegmatic), the ranking of the factors that affect their choices of travel modes and routes is inconsistent. The future study should be directed to the expansion of samples to travelers with different occupations and the collection of data by more advanced means of smartphones, travel logs, and so forth. Through the deep analysis of a large quantity of data, the study should also be made of the interaction of all the factors affecting travel choice behaviors so as to have a more profound understanding of the process of travel choice behaviors and provide the foundation for the policymaking of transportation demand management.
Conflict of Interests The authors declare that there is no conflict of interests regarding the publication of this paper.
Acknowledgment This research is supported by the National Natural Science Foundation of China (50808123).
References [1] H. S. Mahmassani and P. S. T. Chen, “An investigation of the reliability of real-time information for route choice decisions in a congested traffic system,” Transportation, vol. 20, no. 2, pp. 157–178, 1993. [2] H. S. Mahmassani and Y. H. Liu, “Dynamics of commuting decision behaviour under advanced traveller information systems,” Transportation Research C, vol. 7, no. 2-3, pp. 91–107, 1999. [3] Y. Iida, T. Akiyama, and T. Uchida, “Experimental analysis of dynamic route choice behavior,” Transportation Research B, vol. 26, no. 1, pp. 17–32, 1992. [4] B. Z. Yao, P. Hu, X. H. Lu, J. J. Gao, and M. H. Zhang, “Transit network design based on travel time reliability,” Transportation Research C, 2014. [5] H. N. Koutsopoulos, A. Polydoropoulou, and M. Ben-Akiva, “Travel simulators for data collection on driver behavior in the presence of information,” Transportation Research C, vol. 3, no. 3, pp. 143–159, 1995. [6] S. Peeta and J. W. Yu, “A hybrid model for driver route choice incorporating en-route attributes and real-time information effects,” Networks and Spatial Economics, vol. 5, no. 1, pp. 21–40, 2005. [7] J. W. Yu and S. Peeta, “Experimental analysis of a hybrid route choice model to capture dynamic behavioral phenomena under advanced information systems,” KSCE Journal of Civil Engineering, vol. 15, no. 1, pp. 175–185, 2011. [8] C. G. Chorus, T. A. Arentze, and H. J. P. Timmermans, “Information impact on quality of multimodal travel choices: conceptualizations and empirical analyses,” Transportation, vol. 34, no. 6, pp. 625–645, 2007. [9] C. G. Chorus, J. L. Walker, and M. E. Ben-Akiva, “A joint model of travel information acquisition and response to received messages,” Transportation Research C, vol. 26, no. 1, pp. 61–77, 2013.
9 [10] C. G. Chorus, J. L. Walker, and M. E. Ben-Akiva”, “Traveler decision making under conditions of knowledge limitations and information provision,” in Proceedings of the 86th Annual Meeting of the Transportation Research Board, Washington, DC, USA, 2007. [11] B. Z. Yao, P. Hu, M. H. Zhang, and S. Wang, “Artificial bee colony algorithm with scanning strategy for periodic vehicle routing problem,” Simulation, vol. 89, no. 6, pp. 762–770, 2013. [12] R. Ewing, W. Schroeer, and W. Greene, “School location and student travel: analysis of factors affecting mode choice,” Transportation Research Record, no. 1895, pp. 55–63, 2004. [13] H. Shu-Sen, S. Rui, and T. Yuan, “Behavior of urban residents travel mode choosing and influencing factors—taking Beijing as an example,” Communications Standardization, vol. 9, pp. 124– 127, 2008. [14] L. Wei-Guo and H. Si-Ji, “Simulation method for the research of the passengers’ traffic mode choice behavior,” Journal of System Simulation, vol. 14, no. 1, pp. 47–50, 2002. [15] A. de Palma and N. Picard, “Route choice decision under travel time uncertainty,” Transportation Research A, vol. 39, no. 4, pp. 295–324, 2005. [16] A. J. Khattak, Y. Yim, and L. S. Prokopy, “Willingness to pay for travel information,” Transportation Research C, vol. 11, no. 2, pp. 137–159, 2003. [17] C. G. Chorus, T. A. Arentze, and H. J. P. Timmermans, “Information impact on quality of travel choices: analysis of data from a multimodal travel simulator,” in Proceedings of the 86th Annual Meeting of the Transportation Research Board, Washington, DC, USA. [18] L. Gao, Z. Juan, and A. Ni, “Model and algorithm of dynamic routing based on simulation,” in Proceedings of the 10th International Conference of Chinese Transportation Professionals (ICCTP ’10), pp. 2397–2407, ASCE, August 2010. [19] J. Wahle, A. L. C. Bazzan, F. Kl¨ugl, and M. Schreckenberg, “The impact of real-time information in a two-route scenario using agent-based simulation,” Transportation Research C, vol. 10, no. 5-6, pp. 399–417, 2002. [20] D. Lester, “Galen’s four temperaments and four-factor theories of personality: a comment on ‘toward a four-factor theory of temperament and/or personality’,” Journal of Personality Assessment, vol. 54, no. 1-2, pp. 423–426, 1990.
Advances in
Operations Research Hindawi Publishing Corporation http://www.hindawi.com
Volume 2014
Advances in
Decision Sciences Hindawi Publishing Corporation http://www.hindawi.com
Volume 2014
Journal of
Applied Mathematics
Algebra
Hindawi Publishing Corporation http://www.hindawi.com
Hindawi Publishing Corporation http://www.hindawi.com
Volume 2014
Journal of
Probability and Statistics Volume 2014
The Scientific World Journal Hindawi Publishing Corporation http://www.hindawi.com
Hindawi Publishing Corporation http://www.hindawi.com
Volume 2014
International Journal of
Differential Equations Hindawi Publishing Corporation http://www.hindawi.com
Volume 2014
Volume 2014
Submit your manuscripts at http://www.hindawi.com International Journal of
Advances in
Combinatorics Hindawi Publishing Corporation http://www.hindawi.com
Mathematical Physics Hindawi Publishing Corporation http://www.hindawi.com
Volume 2014
Journal of
Complex Analysis Hindawi Publishing Corporation http://www.hindawi.com
Volume 2014
International Journal of Mathematics and Mathematical Sciences
Mathematical Problems in Engineering
Journal of
Mathematics Hindawi Publishing Corporation http://www.hindawi.com
Volume 2014
Hindawi Publishing Corporation http://www.hindawi.com
Volume 2014
Volume 2014
Hindawi Publishing Corporation http://www.hindawi.com
Volume 2014
Discrete Mathematics
Journal of
Volume 2014
Hindawi Publishing Corporation http://www.hindawi.com
Discrete Dynamics in Nature and Society
Journal of
Function Spaces Hindawi Publishing Corporation http://www.hindawi.com
Abstract and Applied Analysis
Volume 2014
Hindawi Publishing Corporation http://www.hindawi.com
Volume 2014
Hindawi Publishing Corporation http://www.hindawi.com
Volume 2014
International Journal of
Journal of
Stochastic Analysis
Optimization
Hindawi Publishing Corporation http://www.hindawi.com
Hindawi Publishing Corporation http://www.hindawi.com
Volume 2014
Volume 2014