The effectiveness of brief, spaced practice on student difficulties with basic and essential engineering skills Brendon D. Mikula, Andrew F. Heckler Department of Physics The Ohio State University Columbus, OH, 43210
[email protected],
[email protected]
Abstract—Through extensive testing and interviews of sophomore, junior, and senior engineering students in a Materials Science Engineering course at The Ohio State University, we found that these students struggle with many skills necessary for their coursework. Often these “essential skills” were prerequisite to the course and little to no instruction time was spent on them. Online training was developed to attempt to improve these skills. Students participated in the training several times over the term, with each assignment taking 10-20 minutes and consisting of 10 questions. Students were allowed unlimited attempts on each assignment and were required to achieve mastery (80% or better) for full credit. Training covered a wide range of topics: interpreting log plots and log scales, using metric prefixes for various conversions, estimating typical values of common material properties, employing dimensional analysis, and operating equations when given variables in mixed units. Unlike the success achieved by the log plots training, most of the topics saw little and insufficient improvement as a result of training, despite the basic nature of the skills. Future improvements to the training will focus on determining which factors will help to convince students of the importance of mastering these prerequisite skills. Keywords—engineering, computer training, online homework, mastery learning, student understanding, essential skills
I.
INTRODUCTION AND THEORETICAL BACKGROUND
Many engineering students at The Ohio State University are required to take an introductory course in Materials Science Engineering. Students are expected to leave the course with mastery of certain categories of knowledge which are utilized frequently during coursework, some of which are considered prerequisite to the course. An example of this knowledge is the ability to read and interpret log plots, training on which has been successful across multiple terms [1]. Through interviews with instructors and exploratory pilot testing, we found that students have significant difficulties with a number of other basic skills essential to a functional understanding of materials science engineering and engineering in general. The “essential skills” studied here consist both of prerequisite skills to the course—e.g., metric prefixes and conversions, dimensional analysis, and operating equations when given variables with mixed units—as well as skills the instructor expects to impart to the students—e.g., order of
978-1-4673-5261-1/13/$31.00 ©2013 IEEE
magnitude estimates and patterns of common material properties. One critical aspect of the essential skills is that they are necessary for solving the types of problems posed in exams— even the simpler ones. Therefore, it is expected that students are near 100% accuracy with these skills. Even if students are 80% accurate with these essential skills, this lack of mastery is a critical bottleneck for successful performance. Here we demonstrate that a worrisome 20-50% of students performed poorly in many of these categories. Despite this, instructional time was typically not dedicated to the prerequisite skills. In this study, we developed a series of computer-based training tasks, assigned as homework, to attempt to address these issues. The training employs the method of mastery learning, in which time on task is allowed to vary to allow each student to obtain a required level of mastery. The two most influential versions of mastery learning are Bloom’s Learning For Mastery [2] and Keller’s Personalized System of Instruction [3]. Though these strategies vary in many ways, Block and Burns describe their similarities in [4]: (1) they prespecify a set of course objectives that students will be expected to master at some high level, (2) they break the course into a number of smaller learning units so as to teach only a few of the course’s objectives at one time, (3) they teach each unit for mastery--all students are first exposed to a unit’s material in a standard fashion; then they are tested for their mastery of the unit’s objectives, and those whose test performance is below mastery are provided with additional instruction, (4) they evaluate each student’s mastery over the course as a whole, on the basis of what the student has and has not achieved rather than on how well he has achieved relative to his classmates. In a meta-analysis of courses utilizing mastery criterion for learning, Kulik showed in [5] that mastery learning is effective in improving student performance on exams at all levels of learning. This improvement is greater for students with weaker content knowledge, making mastery learning a useful remediation tool. Another successful, and more recent, approach to learning is to use computer training as part of coursework. This has been successful in many forms: Multimedia learning modules
2013 IEEE Frontiers in Education Conference 1059
viewed before lecture improved performancce on immediate and delayed post-tests when compared to reeading static text and figures alone [6]; deficiencies in m math are largely remediated by the adaptive ALEKS tutor pprogram [7]; and integration of physics simulations, such as circcuit building, into lab have been successful in improving conteent knowledge as well as proficiency at actual lab tasks [8]; to naame a few. The prerequisite nature of many of the knoowledge gaps we observed in Materials Science Engineering sstudents suggests that computer-based training graded for masterry may be able to provide successful remediation of these difficuulties. This paper aims to investigate and ddescribe student difficulties with engineering essential skills. A more complete understanding of the knowledge state of thee current student population is invaluable to future steps in correcting these difficulties. Also presented are the results oof mastery-based training, which can be used as a model or sstarting place for future corrective measures. II.
METHODS
Exploratory data taken during Autum mn quarter 2011 showed poor performance at the essential skkills described in this paper. During Autumn semester 2012, computer-based training was given to N = 271 students inn an introductory Materials Science Engineering course at The Ohio State University. Most of the students in this classs are sophomore and junior engineering majors. For 6 weeks during the term, beginning in week 6, students completed the “Essential Skills Quizzes”, each worth approximately the same amount of credit as one homework assignment. There were 6 quizzes, each remaining open to the students for one weeek. Students all followed the same training pattern; theyy were allowed unlimited attempts on each quiz and were reqquired to achieve mastery--80% or better--to obtain full credit. C Content in the six Essential Skills Quizzes was divided approoximately evenly between interpreting log scales and the ““essential skills” mentioned above. Time spent on each week’ss quiz varied due to the mastery grading criterion, but averraged around 15 minutes per quiz. The “essential skills” compprised the entirety of Essential Skills Quizzes 2 and 4, and half oof Essential Skills Quiz 6. The remainder of the six Essentiaal Skills Quizzes covered log scales; these results are not considdered here. In addition to the Essential Skills Quizzees, students were again awarded approximately one homework’s worth of points to attend a “FLEX homework” session, whhere the students completed the essential skills assessment, whiich took about 30 minutes; cumulative time spent during the tterm on essential skills training and assessment averaged arounnd 70 minutes per student. In order to better assess the imppact of both the essential skills quizzes and instruction, the population was randomly split into two conditions: 127 pree-Essential Skills Quiz (week 4) participants and 144 post-Esseential Skills Quiz (week 13) participants. Twenty students perr condition were selected for interview data; these students werre video recorded while taking the essential skills assessment annd were asked to think out loud and respond to prompts from m the proctor. An overview of the experimental design can be seen in Fig. 1.
Fig. 1. Experimental conditions used in this study. Students in both conditions took the same assessment but at different times; all students completed the Essential Skills Quizzes concu urrently.
Training with the Essentiaal Skills Quizzes was administered on Carmen, a course management website used by The Ohio State University and developed d by Desire2Learn. Each quiz draws randomly from a categorized question bank, so that the content each student seees is the same for a given quiz, but the specific questions maay not be. This also means that consecutive attempts at a singlle quiz by a single student will not yield the same 10 questionss, but rather a new set of 10 on the same topics. This pseudo-ran ndomization was included to attempt to reduce the number of stud dents simply copying down solutions from earlier attempts or fro om other students. Training was consistent with the t four common traits of mastery learning described by Block B as follows: (1) the “essential skills” to be learned an nd their importance to the students were specified to the studeents prior to training, (2) he topics covered by the Essential Sk kills Quizzes were divided into 6 separate quizzes, with one qu uiz given per week, (3) each Essential Skills Quizzes was masteery graded and all students were given quizzes over the same co ontent. Upon completing an attempt, Carmen provided the correect answers to all questions on the quiz, allowing the students th he opportunity to learn from their errors, (4) As the entire coursee was not taught in mastery learning style--just the Essentiaal Skills Quizzes--student mastery over the course as a whole could not be evaluated. However, students were awarded more points for mastering more of the quizzes. In this sense, students were rewarded by their mastery alone, not by the time it took to achieve. Thus, the computer-based Essential Skills Quizzes fit within the standard framework of mastery learning, as described above. III.
RESU ULTS
All comparisons were betw ween-student. Correctness between pretest and posttest wass compared using a Chisquared test and numerical valu ues were compared using appropriate t tests. Effect sizes aree reported using Cohen’s d such that a positive d means imp provement, not merely an increase in proportion. Results are presented by category: A. Metric Conversions Engineering students are expeected to be proficient in converting between metric units (micrograms ( to kilograms, centimeters to nanometers, megapaascals to gigapascals, etc.). Pretest students averaged only 74.8% correct on simple metric conversion problems--surprisingly far f from ceiling, given the simplicity of the skill and its consttant use in the engineering
2013 IEEE Frontiers in Education Conference 1060
Fig. 2. Metric conversion training questions came in thhree types: scientific notation questions (top); decimal form questions (middlee); and “find the unit” questions (bottom), which were given with multiple choicee options.
courses the student had already taken. Traaining on metric conversions comprised 6 of the 10 questions inn Essential Skills Quiz #2 plus 2 of the 10 questions in Essentiaal Skills Quiz #6, and involved three problem types (Fig. 2). Despite the fact that students had to achieve mastery during the Essential Skills Quizzes, we foundd that training on metric conversions resulted in no significant cchange in student performance. One of the three metric converssion questions on the essential skills assessment asked studeents to make a volumetric conversion from cubic centimeterss to cubic meters. There was no significant difference in scores from pretest (73%) to posttest (71%). The most common eerror was to treat the problem as a length conversion (centim meters to meters), ignoring the volumetric nature of the probblem (Fig. 3). It should be noted, however, that volumetric prroblems were not included in the training, thus students faileed to utilize any skills they may have acquired from this quiz. The remaining two metric conversion quuestions involved only linear conversions and gave conflictiing results. One question asked students to convert from micrograms to megagrams, working in scientific notationn; this question significantly improved from 62% to 74% (χ2(1)^2 = 4.053, p = 0.044, d = 0.25). The other question assked students to convert from kilometers to centimeters in deecimal form; this question showed a marginal decrease from m 89% to 82% (χ2(1)^2 = 2.652, p = 0.103, d = -0.20). Overall, student performance on metric conversions yielded rather limited and inconsistent ressults. Given the importance and relative simplicity of thhe task, student performance is unacceptable low. On averagee, students scored just 74.8% correct on the three metric convversion questions before training and 75.5% after (t = 0.193, p = 0.847). B. Dimensional Analysis Students in engineering are expected to uunderstand units, meaning they need to be able to analyze the dimensional relationships between variables in an equatioon with minimal
Fig 3. Common answer patterns on an example metric conversion problem. Students were asked to convert from cubic meters to cuubic centimeters. The most common error was to treat the problem as a length cconversion, as though converting from meters to centimeters. Neither of these changes were statistically significant.
Fig 4. Dimensional analysis training questio ons came in three categories: unit breakdown questions (top); find the misssing unit questions (left), where students were given an equation and units fo or all but one of the variables, then asked to solve for the units of the remaining g variable; and specialized find the missing unit questions (right) dealing with h the difference between the gas constant, R, and the Boltzmann constant, k. Each category consisted of both multiple choice questions and directed fill--in-the-blank questions where the student indicated the powers of respectivee units. An example of multiple choice responses is shown (right).
effort. For example, students shoulld be able to determine the units of a given quantity in an eq quation based on the other variables involved (e.g., Fig. 4). Students would also be expected to know whether to usee the gas constant or the Boltzmann constant—identical con nstants in different units— depending on the units of the oth her variables. Training on dimensional analysis involved th hree problem types and consisted of 7 of the 10 questions in i Essential Skills Quiz #4, plus 3 of the 10 questions in Essential Skills Quiz #6. kills categories, training on In contrast to other essential sk dimensional analysis resulted in significant gains in student performance for the category as a whole, improving average scores on the dimensional analysiss portion of the assessment from 43% to 57% (t = 3.922, p = 0..0001, d = 0.48); it is worth noting that this is still far from ceilin ng, despite a relatively large effect size. Significant gains were allso seen on many individual questions. One item on the assessm ment gave the students the equation for the theoretical density y of a crystalline metallic solid as well as appropriate unitts for all but one of the variables. The students were then taasked with finding the units for the remaining variable. Sign nificant improvement was shown after training (χ2 (1)^2 = 6..781, p = 0.009, d = 0.32), with correctness increasing from 71% % to 84%. Another similar question involved determining the units of a variable in the exponent of the eq quation for the equilibrium number of vacancies in a material. Through interviews, it became apparent that some studentss were merely balancing the sides of the equation, ignorant to the fact that the exponent itself must be unitless. Part of the way w through the pretest, this question was updated to the form sh hown in Fig. 5. This updated question showed significant im mprovement in terms of correctness (χ2(1) = 7.500, p = 0.006, d = 0.49) from 33% to 56%, while the most common error--the e belief that more information was needed to answeer the question--decreased significantly (χ2(1)^2 = 4.545, p = 0.033, d = 0.38) from 42% to 25%. Most students claiming to need more information indicated that the rest of the equation n was required.
2013 IEEE Frontiers in Education Conference 1061
q from the assessment and Fig. 7. An example mixed unit equations question patters of right and wrong answers. Asteriskss indicate statistical significance at p< 0.05 level. m the essential skills Fig. 5. An example dimensional analysis question from assessment and patterns of right and wrong answerss. Asterisks indicate statistical significance at the p < 0.05 level. Student coommitting an inverse error submitted an answer that was the reciprocal of the coorrect answer.
Interestingly, students who believed that thhe problem could be solved with the given information showed an improvement in correctness from 56% to 72%, though thiis result fell just outside the range of significance (χ2(1)^2 = 3.670, p = 0.055, d = 0.43). The lack of statistical significcance--despite a respectable effect size--is likely due to smalll pretest sample sizes, a deficiency owed to the change in preteest versions of the problem and the larger proportion of studentts believing more information was needed in the pretest conditionn. C. Mixed Unit Equations Engineers in the field use equations to calculate values from measurements, and the instruments providing these measurements don’t always do so in consistennt units. As such, it is essential that engineering students be able to operate equations--to find the value of the dependennt variable--when presented with independent variables in mixedd units.
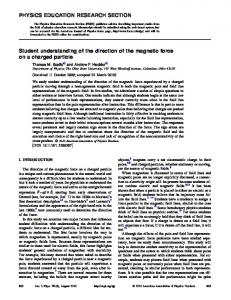
As a part of training, students were presented with an equation as well as values for the independent variables involved, which were purposefully given in mixed units (Fig. 6). Students were then asked to o calculate the dependent variable in specified “target units..” Training on mixed unit equation consisted of 3 of 10 questions in Essential Skills Quiz 4. Training was somewhat successful in improving average assessment scores on mixed unit eq quation questions from 36% to 48% (t = 2.765, p= 0.006, d=0.3 34), leaving posttest scores still below 50%. xed unit equations category While overall scores in the mix showed significant improvement in n student performance, two of the three individual question ns in the essential skills assessment failed to do so. Scorres on the diffusion flux question, increased from 40% to 46%, 4 but this improvement was not statistically significant (χ2(1 1)^2 = 1.144, p = 0.285, d = 0.13). The question statement and common errors--explicitly converting to incorrect target unitts, forgetting the mole to atoms conversion, and erring exactly y by some power of 10--are shown in Fig. 7. For this item, the t only error significantly affected by training was students giiving an answer in different target units than specified in the prob blem statement. A similar question involving a conversion from psi to gigapascals using Hooke’s law allso showed no significant change in student performance (χ2(1 1)^2 = 2.279, p = 0.131, d = 0.18) from pre (35%) to post (44%).. The simplest question provided d students with a force in newtons and an area in square millimeters, then asked for a force in kilopascals; this was the only mixed unit equation question to show significant improv vement (χ2(1)^2 = 8.992, p = 0.003, d = 0.37), with correctness increasing from 35% to 53%. It is worth emphasis that this was the simplest of the three questions of this type presen nted in the essential skills assessment, and 47% of students arre still submitting incorrect answers after training.
Fig 6. An example of a mixed unit equation train quuestion is shown. All questions in this category had the same form, but manyy dealt with different equations.
perties D. Typical Values of Material Prop Engineers are expected to kno ow approximate values for various material properties and oth her physical constants. For example, an engineer should know w that melting points and Young’s moduli are usually higherr for metals than polymers. They should also be able to provide a rough value for a specific material that is within a reasonablee range. Training on typical values contained two problem typess (Fig. 8) and consisted of 4 of the 10 questions in Essential Skillls Quiz #2.
2013 IEEE Frontiers in Education Conference 1062
most of this came from significaant increases in the larger ranges--students in the “within 10x”” range increased from 48% to 75% (χ2(1)^2 = 18.531, p < 0.00 001, d = 0.57). Conversely, students in the “within 20%” range did d not significantly change (χ2(1)^2 = 1.988, p = 0.159, d = 0.18) from pre (9%) to post (15%). Student responses for alu uminum displayed strange behavior; students in the “within n 10x” range significantly increased (χ2(1)^2 = 10.349, p = 0.0 001, d = 0.41) from 55% to 74%, while those in the “within 20%” 2 range actually saw a significant decrease (χ2(1)^2 = 5.3 395, p = 0.020, d = -0.30) from 21% to 10%. In essence, stu udent responses settled into something resembling orbit around d the correct answer. This approach yielded no significant chan nge in student responses for the question about HDPE for all ranges. Fig 8. Typical values training questions had two categoories: multiple choice (top); and ranking questions (bottom), which containedd 2-5 materials to be appropriately ranked by some material property.
Training on estimates of typical valuues of material properties produced a range of results from siggnificant gains to marginal losses. Cumulative student performaance on questions in this category showed a nonsignificant changge (t = 1.461, p = 0.145, d = 0.18) from pre (35%) to post (40%). A series of three questions asked studentts to estimate the Young’s modulus of three materials: copperr, aluminum, and high-density polyethylene (HDPE). Since studdent responses to these questions spanned such a broad range,, we analyze the results a number of ways. One metric was to use an “acceptable range” for the numerical answers, which was set by a course instructor (see Fig. 9). By thiss metric, student responses to the question on copper shoowed significant improvement (χ2(1)^2 = 5.377, p = 0.020, d = 0.30), with the percentage of students in the acceptable rangee increasing from 34% to 49%. Student estimates of the Youn ung’s modulus of aluminum showed no significant improvem ment (χ2(1)^2 = 0.805, p = 0.370, d = 0.11) from pre (40% %) to post (45%). HDPE started and remained at 25% withinn the acceptable range, showing no change at all. Note that nonne of the posttest values are higher than 50%, despite the ffact that training contained problems dealing with Young’s moddulus.
f more on the relative The final metric attempts to focus values of student responses, rather than the magnitude of the value itself. Through discussions with w the course instructor, it was expected of the students thatt they at least give higher Young’s modulus values for the metals m than for the polymer. Students giving a higher value for HDPE than for aluminum 9 p = 0.002, d = 0.40) decreased significantly (χ2(1)^2 = 9.280, from 55% to 36%; students giving g a higher value for HDPE than for copper decreased significaantly (χ2(1)^2 = 6.250, p = 0.012, d = 0.32) from 59% to 43%. The percentage of students incorrectly giving a higher Young’’s modulus for HDPE than for both aluminum and copper fell significantly (χ2(1)^2 =4.314, p = 0.038, d = 0.27) as well, from 49% to 36%. These values can be seen in Fig. 11. Despiite statistical significance, it is again worth noting that posttest students still make at least one of these errors about 40% of thee time. Students were also asked to ratte their confidence in their answers. Student confidence increassed significantly for copper (t = 2.477, p = 0.014, d = 0.43) and a HDPE (t = 2.410, p = 0.017, d = 0.43), but decreased non--significantly for aluminum (t = -1.159, p = 0.248, d = -0.20). Neither N pretest nor posttest confidence rankings exceeded 2..2 out of 5 for any of
A second metric was to determine whether student responses were in any of four increasingly large “ballparks”: within 20% of the correct answer, within 2x thhe correct answer, within 5x the correct answer, and within 10x the correct answer. This metric revealed a slightly moree detailed picture which can be seen Fig. 10. While student perrformance on the copper question showed some improvement aacross the board,
Fig 9. “Acceptable ranges” for the Young’s modulus of m materials used on the essential skills assessment, specified by the instructor.
Fig 10. Classification of student estimates of the Young’s modulus of copper, aluminum, and high-density polyethylene (HDPE) ( in relation to the actual value. Asterisks indicate significant change at the p < 0.05 level, though not all of these changes were improvements.
2013 IEEE Frontiers in Education Conference 1063
Fig 11. Relative value error frequencies for typical vaalue problems asking student to estimate Young’s modulus of aluminum, coopper and HDPE. As these are errors, a decrease in percentage correspponds to increasing correctness.
the three materials involved, and changes in sttudent confidence did not match student improvement in terms off correctness. Finally, posttest students were asked to ggive approximate melting points for metals, polymers, andd ceramics—this question was not included in the pretest. S Student responses were judged based on the correct relative oorder of melting points; 71% of students ordered the melting points correctly. This leaves almost 30% of posttest students unnable to correctly rank typical melting points of three distinct maaterial classes. E. Interview Data Twenty students each from pretest posttestt conditions were subjected to “think-aloud” interviews as theey completed the FLEX assessment. The most striking feeature of these interviews was that many students not only aadmitted that they lacked certain knowledge and skills, but seem med content with that fact. Some excerpts from interviews are shhown below: • “Usually I look [the metric prefixes/connversions] up.” • “[Metric prefixes are] readily availablle on the internet and textbook.” • When asked if they felt it was importaant to memorize: “I feel like there’s always a table for it..” • Some students described their lack of memorization of these topics as a conscious choice: “II’ve always been able to look them up. So, as of now, I haven’t decided to memorize them.” (Emphasis is authoor’s) The prevailing view for certain knowleedge components seems to be something along the lines of “W Why memorize it when I can always look it up?” Perhaps the whhole experience is best described by one student in particular. W When this student struggled on metric conversions, the proctoor stated “I can answer any questions you have [about mettric prefixes and conversions] once you’re done.” to which thhe student replied “Or I can just go on Wikipedia.” IV.
DISCUSSION
Computer-based, mastery-graded trainingg on engineering “essential skills” has been effective for some kknowledge, while failing to be effective other knowledge. 20--30% of students were unable to perform simple metric converssions, and neither instruction nor training was able to alter these numbers. Almost 30% of posttest students were unable to coorrectly rank the typical melting points of polymers, metals, andd ceramics. More than 50% of students were unable to ccorrectly operate
Fig 12. Training effectiveness as measured performance p on the essential skills assessment, averaged by category. Only dim mensional analysis and mixed unit equations showed statistically significant imp provement at the p