Morgantown, West Virginia. 2002. Keywords: Finite ... My appreciation also goes to Mr. Eric Saunders, MAE Research. Associate, who worked ...... this thesis were mild steel, which were taken from Brown and Song (1992). Table 3.3 shows the ...
The Effects of Process Parameters on Steel Welding Response in Curved Plates Mokhtar Awang
Thesis Submitted to the College of Engineering and Mineral Resources at West Virginia University in Partial Fulfillment of the Requirements for the Degree of Master of Science in Mechanical Engineering
Victor H. Mucino, Ph.D., Chair Eric Johnson, Ph.D. Jacky Prucz, Ph.D. Ronald Klein, Ph.D. Department of Mechanical Aerospace Engineering Morgantown, West Virginia 2002
Keywords: Finite Element Method, Welding Simulation, Arc Welding, Process Parameters, Curved Plate, Welding Response
Abstract The Effects of Process Parameters on Steel Welding Response in Curved Plates Mokhtar Awang In large steel fabrication industries such as shipbuilding, and high-speed train guideway, the problem of residual stresses and overall distortion has been and continues to be a major issue. In the last few decades, various research efforts have been directed at the control of the welding process parameters aiming at reducing the distortions and residual stress effects. Yet, in actual practice, large amounts of resources are still being spent in reworking welds, which in turn increases the production cost and delays work completion. It is assumed that in order to reduce the residual stresses and distortions from a welding operation, it is necessary to understand the effects of welding process parameters on the responses. In this thesis, a study has been conducted to assess the effects of heat input, speed rate, restraint, plate curvature, and gap on arc welding responses as applied to steel welding. A single pass corner joint arc welding has been chosen in this study. The arc welding process is simulated using Finite Element Method (FEM) program ANSYS®. The simulations were carried out using a two-step process; non-linear heat transfer that produces the dynamic temperature distribution throughout the weld seam and the plates, and the elasto-plastic analysis, which yields residual stresses, strains, and displacement. The “birth and death” element feature was used in the finite element model to simulate the welding process. The responses along several longitudinal cross sections were obtained after the plate cooled down to room temperature. The results show that all parameters, except for the gap between the plates have a significant effect on the responses. Relationships between the parameters and the responses have been drawn based on the simulation results.
iii
Acknowledgement This thesis is dedicated to my wife Ku Zilati, my daughter Amanda, and my son Faris. With my infinite gratitude and appreciation for my mom and parents in-law who have prayed for my success and taught me the virtues of hard work, patience, and the pursuit of excellence. I would like to thank Prof. Victor H. Mucino for his support and encouragement throughout my research with him. My work with him has been both rewarding and challenging. I also appreciate the freedom and trust that he has given me. I have been very fortune to have both, Prof. Eric Johnson and Prof. Jacky Prucz, who have been delivered priceless knowledge to me. The Conduction Heat Transfer and Theory of Elasticity courses taught by Dr. Johnson and Dr. Prucz, respectively were very useful in this research. I also would like to thank Prof. Ronald Klein, Principal Investigator of Maglev Research group, for providing necessary guidance and helpful suggestions throughout my work on this research. My appreciation also goes to Mr. Eric Saunders, MAE Research Associate, who worked with me in the initial stage to develop the finite element model of welding process. I also give a full credit to him for keeping the ALPHA machines running all times. Without him, the large amount of simulation work would have been impossible.
iv
Table of Contents Abstract
ii
Acknowledgement
iii
Table of Contents
iv
List of Figures
viii
List of Tables
xi
Nomenclature
xii
List of Abbreviations
xiv
Chapter 1:
Introduction
1
1.1
Introduction to Welding
…………………………………………….1
1.2
Type of Arc Welding
…………………………………………….1
1.3
1.2.1
Shielded Metal Arc Welding (SMAW)
…………………….2
1.2.2
Gas Tungsten Arc Welding (GTAW)
…………………….2
1.2.3
Gas Metal Arc Welding (GMAW)
…………………………….2
1.2.4
Submerged Arc Welding (SAW)
…………………………….2
Type of Welding Joints
…………………………………………….3
1.3.1
Butt Joint
…………………………………………………….3
1.3.2
Corner Joint
…………………………………………………….3
1.3.3
Edge Joint
…………………………………………………….4
1.3.4
Lap Joint
…………………………………………………….4
1.3.5
T Joint
…………………………………………………….5
1.4
Problem Statement
1.5
Objectives of the Thesis
…………………………………………….6
1.6
Scope of the Thesis
…………………………………………….7
Literature Review
8
Chapter 2:
…………………………………………………….6
v 2.1
Introduction and Background
2.2
Physics of Arc Welding
………………………………………..….10
2.3
Theory of Heat Transfer
…………………………………………...11
2.4
Heat Affected Zone (HAZ)
…………………………………………...13
2.5
Theory of Welding Deformations
…………………………………...16
2.6
Type of Welding Deformations
…………………………………...19
2.7
Residual Stress
Chapter 3:
…………………………….………8
…………………………………………………...21
Modeling and Simulation of Welding
23
3.1
Overview of Welding Simulation
3.2
Verification of Butt Welding Process Using ANSYS® 3.2.1
3.3
Simulation Results
…………………………………...23 …………...23
…………………………………………...26
Finite Element Analysis of Corner Joint 3.3.1
Introduction
3.3.2
Model Descriptions and Meshes
3.3.3
Material Properties
…………………………...28
…………………………………………………...28 …………………………...29
…………………………………………...31
3.4
“Birth and Death” Feature
…………………………………………...33
3.5
Heat Transfer Analysis
…………………………………………...33
3.5.1
Model Assumptions …………………………………………...37
3.6
Mechanical Analysis
3.7
Thermo-Mechanical Results …………………………………………...39
Chapter 4: 4.1
Study of Weld Responses Introduction
…………………………………………...37
44
…………………………………………………………...44
vi
4.2
4.3
4.4
4.5
4.6
4.7
Chapter 5:
Effects of Heat Input …………………………………………………...45 4.2.1
Introduction
…………………………………………………...45
4.2.2
Analysis of Results
Effects of Weld Speed
…………………………………………...46 …………………………………………...51
4.3.1
Introduction
…………………………………………………...51
4.3.2
Analysis of Results
…………………………………………...51
Effects of Restraint
…………………………………………………...56
4.4.1
Introduction
…………………………………………………...56
4.4.2
Analysis of Results
…………………………………………...57
Effects of Plate Curvatures without a Gap 4.5.1
Introduction
4.5.2
Analysis of Results
…………………………...63
…………………………………………………...63 …………………………………………...64
Effects of Plate Curvatures with a Gap 4.6.1
Introduction
4.6.2
Analysis of Results
…………………………...69
…………………………………………………...69 …………………………………………...70
Comparison of Using and Not Using a Gap between Plates …………...75 4.7.1
Introduction
…………………………………………………...75
4.7.2
Analysis of Results
…………………………………………...75
Discussions and Conclusions
80
5.1 Discussions
…………………………………………………………...80
5.2 Conclusions
…………………………………………………………...81
Bibliography
83
vii Appendix Appendix A
Formulas for USUM and Von Mises Stress …………………...86
Appendix B
Line Heat Source
Appendix C
Plots of Welding Responses Against Locations Along the Arc
Appendix D
…………………………………………...87
Length for Heat Input Variables
…………………………...92
Sample of ANSYS® Data File
………………………….128
viii
List of Figures Figure 1.1
Butt Joint Arrangement.
Figure 1.2
Corner Joint Arrangement.
Figure 1.3
Edge Joint Arrangement.
Figure 1.4
Lap Joint Arrangement.
Figure 1.5
T Joint Arrangement.
Figure 2.1
Illustration of Melt-Pool Zone(MPZ) and Heat Affected Zone(HAZ).
Figure 2.2
Approximate Relationships Among Peak Temperature, Distance From Weld Interface, and the Iron-Carbon Phase Diagram (Weisman, 1976).
Figure 2.3
Schematic Representation of Changes of Temperature and Stresses During Welding (Weisman, 1976).
Figure 2.4
Various Type of Welding Distortion. (a) Transverse Shrinkage in a ButtJoint; (b) Angular Change in a Butt-Joint; (c) Angular Change in a TJoint; (d) Longitudinal Distortion in a Fillet Joint.
Figure 2.5
Deformation of Welded Plate Under the Influence of a Longitudinal Moving Heat Source.
Figure 2.6
Contraction and Expansion Phenomena.
Figure 3.1
Thermal Properties of Inconel 600 used by Friedman (1975).
Figure 3.2
Mechanical Properties of Inconel 600 used by Friedman (1975).
Figure 3.3
Illustration of Butt-Joint Arc Welding Process.
Figure 3.4
Temperature Histories Distribution from Friedman’s Paper (1975).
Figure 3.5
Temperature Histories Distribution from Heat Transfer Analysis.
Figure 3.6
Illustration of Single-Pass Corner-Joint Welding with Three Clamps on Each Plate.
Figure 3.7
Three Different Models Used in Thesis. (a) Low Curvature of 0.0000 (Straight Plates); (b) Medium Curvature of 0.0025 1/mm (R = 400 mm); (c) High Curvature of 00.67 1/mm (R = 150 mm).
Figure 3.8
Finite Element Mesh of Three Dimensional Curved Plates.
Figure 3.9
Plot of Temperature Distribution at Various Locations of Vertical and Horizontal Plates, Respectively.
ix Figure 3.10
X-Displacement Contour.
Figure 3.11
Y-Displacement Contour.
Figure 3.12
Z-Displacement Contour.
Figure 3.13
USUM Contour.
Figure 3.14
X-Stress Contour.
Figure 3.15
Y-Stress Contour.
Figure 3.16
Z-Stress Contour.
Figure 3.17
Von Mises Stress Contour.
Figure 4.1
Graphs Illustrate the Effects of Varying Heat Input on Displacements.
Figure 4.2
Graphs Illustrate the Effects of Varying Heat Input on Stresses.
Figure 4.3
Graphs Illustrate the Effects of Varying Heat Input on Elastic Strains.
Figure 4.4
Graphs Illustrate the Effects of Varying Heat Input on Plastic Strains.
Figure 4.5
Graphs Illustrate the Effects of Varying Speed on Displacements.
Figure 4.6
Graphs Illustrate the Effects of Varying Speed on Stresses.
Figure 4.7
Graphs Illustrate the Effects of Varying Speed on Elastic Strains.
Figure 4.8
Graphs Illustrate the Effects of Varying Speed on Plastic Strains.
Figure 4.9
Three Restraint Sets Used for FEA. (a)- Restraint #1; (b)- Restraint #2; (c)- Restraint #3.
Figure 4.10
Graphs Illustrate the Effects of Varying Restraint on Displacements.
Figure 4.11
Graphs Illustrate the Effects of Varying Restraint on Stresses.
Figure 4.12
Graphs Illustrate the Effects of Varying Restraint on Elastic Strains.
Figure 4.13
Graphs Illustrate the Effects of Varying Restraint on Plastic Strains.
Figure 4.14
(a) Illustration of a Finite Element Mesh of Curved Plate Model without Gap; (b) 2-D Schematic Drawing of Corner Joint without Gap
Figure 4.15
Graphs Illustrate the Effects of Varying Curvature without a Gap on Displacements.
Figure 4.16
Graphs Illustrate the Effects of Varying Curvature without a Gap on Stresses.
Figure 4.17
Graphs Illustrate the Effects of Varying Curvature without a Gap on Elastic Strains.
x Figure 4.18
Graphs Illustrate the Effects of Varying Curvature without a Gap on Plastic Strains.
Figure 4.19
(a) Illustration of a Finite Element Mesh of Curved Plate Model with a Gap; (b) 2-D Schematic Drawing of Corner Joint with a Gap
Figure 4.20
Graphs Illustrate the Effects of Varying Curvature with a Gap on Displacements.
Figure 4.21
Graphs Illustrate the Effects of Varying Curvature with a Gap on Stresses.
Figure 4.22
Graphs Illustrate the Effects of Varying Curvature with a Gap on Elastic Strains.
Figure 4.23
Graphs Illustrate the Effects of Varying Curvature with a Gap on Plastic Strains.
Figure 4.24
Mesh Generation of Weld Material and Plates. (a) Plates without a Gap; (b) Plates with a Gap.
Figure 4.25
Graphs Illustrate the Effects of with and without a Gap on Displacements.
Figure 4.26
Graphs Illustrate the Effects of with and without a Gap on Stresses.
Figure 4.27
Graphs Illustrate the Effects of with and without a Gap on Elastic Strains.
Figure 4.28
Graphs Illustrate the Effects of with and without a Gap on Plastic Strains.
xi
List of Tables Table 3.1
Design Matrix of Welding Parameters Used in the Finite Element Simulation.
Table 3.2
Dimensions of Three Plate Curvatures Used in the Analyses.
Table 3.3
Temperature-Dependent Material Properties for Both Steel Plate and Weld.
Table 4.1
Range of Heat Input Used for FEA.
Table 4.2
Range of Welding Speed Used for FEA.
Table 4.3
Three Type of Restraints Used for FEA.
Table 4.4
Three Types of Curvature without Gap.
Table 4.5
Three Types of Curvature with a Gap.
xii
Nomenclature c
:
Specific heat,
g”’
:
Heat generated inside the element
h
:
Convection heat transfer coefficient
k
:
Thermal conductivity
kx
:
Thermal conductivity in x-direction
ky
:
Thermal conductivity in y-direction
kz
:
Thermal conductivity in z-direction
q’
:
Heat per unit length
q”
:
Heat flux per unit area
q”rad
:
Heat loss due to radiation
q”con
:
Heat loss due to convection
r
:
Region in which 95% of the heat flux is deposited
t
:
Time
v
:
Heat source speed
x
:
Distance perpendicular to the weld line
z
:
Distance along the direction of the weld line
E
:
Modulus of elasticity
H
:
Combined convection and radiation heat transfer
I
:
Current
K0
:
Modified Bessel function of the second kind, zero order
Q
:
Heat input
T
:
Body Temperature
T∞
:
Surrounding temperature
T0
:
Initial temperature
V
:
Voltage
α
:
Thermal diffusivity (k/ρc)
ε
:
Thermal emissivity, strain
σ
:
Stefan-Boltmann constant
xiii σy
:
Normal stresses in y-direction
τxy
:
Shearing stresses
σx
:
Normal stresses in x-direction
η
:
Arc efficiency
ρ
:
Density of the material
∆T
:
Temperature gradient
∇
:
Derivator (∂ / ∂x, ∂ / ∂y, ∂ / ∂z )
[C(T)] :
Specific heat matrix
[K(T)] :
Conductivity matrix
{T}
:
Vector of nodal temperature
:
Vector of time derivative of {T}
•
{T }
{Q(T)}:
Nodal heat flux vector
{σ}
:
Stress vector
[D]
:
Stiffeness matrix
{ε}
:
Strain vector
{εth}
:
Thermal strain vector
xiv
List of Abbreviations ANSYS®
:
A finite element analysis program developed by Swanson Analysis System, Inc.
SMAW
:
Shielded Metal Arc Welding
GTAW
:
Gas Tungsten Arc Welding
GMAW
:
Gas Metal Arc Welding
SAW
:
Submerged Arc Welding
FE
:
Finite element
FEA
:
Finite element analysis
FEM
:
Finite element model
HAZ
:
Heat Affected Zone
MPZ
:
Melt-pool zone
PDE
:
Partial differential equation
Chapter 1: Introduction 1.1
Introduction to Welding
Generally, welding can be defined as any process in which two or more pieces of metal are joined together by the application of heat, pressure, or a combination of both. Most of the processes may be grouped into two main categories: pressure welding, in which the weld is achieved by pressure; and heat welding, in which the weld is achieved by heat. Heat welding is the most common welding used today. Arc welding, which is heat-type welding, is one of the most important manufacturing operations for the joining of structural elements for a wide range of applications, including guide way for trains, ships, bridges, building structures, automobiles, and nuclear reactors, to name a few. It requires a continuous supply of either direct or alternating electric current, which create an electric arc to generate enough heat to melt the metal and form a weld. The arc welding process is a remarkably complex operation involving extremely high temperatures, which produce severe distortions and high levels of residual stresses. These extreme phenomena tend to reduce the strength of a structure, which becomes vulnerable to fracture, buckling, corrosion and other type of failures. 1.2
Type of Arc Welding
The most widely used arc welding processes are shielded metal arc, gas tungsten arc, gas metal arc, and submerged metal arc.
1
1.2.1
Shielded Metal Arc Welding (SMAW)
In shielded metal-arc welding, a metallic electrode, which conducts electricity, is coated with flux and connected to a source of electric current. The metal to be welded is connected to the other end of the same source of current. By touching the tip of the electrode to the metal and then drawing it away, an electric arc is formed. The intense heat of the arc melts both parts to be welded and the point of the metal electrode, which supplies filler metal for the weld. 1.2.2
Gas Tungsten Arc Welding (GTAW)
In gas tungsten arc welding, a tungsten electrode is used in place of the metal electrode used in shielded metal arc welding. A chemically inert gas, such as argon, helium, or hydrogen, is used to shield the metal from oxidation. The heat from the arc formed between the electrode and metal melts the edges of the metal. Metal for the weld may be added by placing a bare wire in the arc or the point of the weld. The GTAW process could be used with almost all metals and produces a high-quality weld. However, the rate of welding is considerably slower than in other processes. 1.2.3
Gas Metal Arc Welding (GMAW)
In gas metal arc welding, a bare electrode is shielded from the air by surrounding it with argon or carbon dioxide gas or by coating the electrode with flux. The electrode is fed into the electric arc, and melts off in droplets to enter the liquid metal that forms the weld. 1.2.4
Submerged Arc Welding (SAW)
Submerged arc welding is similar to gas metal arc welding, but in this process no gas is used to shield the weld. Instead, the arc and tip of the wire are submerged beneath a layer
2
of granular, fusible material formulated to produced a proper weld. This process is very efficient but is only used with steel.
1.3 Type of Welding Joints Welds are made at the junction of the various pieces that make up the weldment. The junctions of parts, or joints, are defined as the location where two or more members are to be joined. Parts being joined to produce the weldment may be in the form of rolled plate, sheet, pipes, castings, forgings, or billets. The five basic types of welding joints for plates are listed below. 1.3.1
Butt Joint
A joint between two members lying approximately in the same plane as shown in Figure 1.1.
Figure 1. 1 1.3.2
Butt Joint Arrangement.
Corner Joint
A joint between two members located approximately at right angles to each other in the form of an angle as shown in Figure 1.2.
3
Figure 1. 2 1.3.3
Corner Joint Arrangement.
Edge Joint
A joint between the edges of two or more parallel or mainly parallel members as shown in Figure 1.3
Figure 1. 3
1.3.4
Edge Joint Arrangement.
Lap Joint
A joint between two overlapping members as shown in Figure 1.4.
4
Figure 1. 4
1.3.5
Lap Joint Arrangement.
T Joint
A joint between two members located approximately at right angles with respect to each other in the form of a T as shown in Figure 1.5.
Figure 1. 5
T Joint Arrangement.
5
1.4
Problem Statement
The problem of welding distortion during large steel fabrications leads to dimensional inaccuracies and misalignments of structural members, which can result in corrective tasks or rework when tolerance limits are exceeded. This in turn, increases the cost of production and leads to delays. In fabrication and design industries, for example, expenses for rework such as straightening could cost millions of dollars. Therefore, the problems of distortion and residual stresses are always of great concern in welding industry. In order to deal with this problem, it is necessary to predict the amount of distortion resulting from the welding operations. One way to predict the distortion and shrinkage of steel welding is through numerical analysis such as finite element analysis (FEA). Once the techniques to predict the distortion and shrinkage are identified, then the problems can be controlled accordingly. Within the welding procedures, there are many factors such as welding process type, welding process parameters, welding sequence, preheat patterns, level of constraint and joint details that contribute to the distortion of the welded structure. Knowing which parameters have an effect on the quality of the weld and which parameters give the most significant effect on the weld quality are the main issues in welding industry.
1.5
Objectives of the Thesis
The objective of this research is first, to simulate the complex arc welding process by using the finite element code ANSYS®. Then, after the model is built and verified, the main objective of the thesis is to study the effects of varying the welding process parameters on the thermo-mechanical responses. In addition to that, the aim of this thesis is also to find a relationship between welding parameters and thermo-elasto-plastic responses.
6
1.6
Scope of the Thesis
In this thesis, the responses of single pass corner-joint of arc welding are evaluated through the finite element software ANSYS®. The study of this thesis covers only the effects of varying heat input, welding speed, welding clamping (restraint), curvature, and the presence of a gap on the thermo mechanical responses of the weldment after cooling down to room temperature. These thermo mechanical responses included directional and total displacements (i.e., X, Y, Z directions and USUM), directional stresses, von Mises stress, directional elastic strains, directional plastic strains, and directional total strains.
7
Chapter 2: Literature Review 2.1
Introduction and Background
The research activity in welding simulation started decades ago. Rosenthal (1946) was among the first researchers to develop an analytical solution of heat flow during welding based on conduction heat transfer for predicting the shape of the weld pool for two and three-dimensional welds. Using the Fourier partial differential equation (PDE) of heat conduction, he introduced the moving coordinate system to develop solutions for the point and line heat sources and applied this successfully to address a wide range of welding problems. His analytical solutions of the heat flow made possible for the first time the analysis of the process from a consideration of the welding parameters namely the current, voltage, welding speed, and weld geometry. Understanding of the theory of heat flow is essential in order to study the welding process analytically, numerically or experimentally. Since the pioneering work of Rosenthal, considerable interest in the thermal aspects of welding was expressed by many researchers such as Kamala and Goldak (1993), Nguyen et al. (1999), and Komanduri and Hou (2000). The most critical input data required for welding thermal analysis are the parameters necessary to describe the heat input to the weldment from the arc. Goldak et al. (1984) derived a mathematical model for welding heat sources based on a Gaussian distribution of power density. They proposed a doubled ellipsoidal distribution in order to capture the size and shape of the heat source of shallow and deeper penetrations. Some researchers have also developed the thermal finite element simulation to investigate the temperature distribution of a metal such as Kraus (1986), Tekriwal and Muzumder (1988), Yeung, and Thorthon (1999), and Bonifaz (2000). Over the past few years, finite element methods have been used extensively in an attempt to predict distortion and residual stresses due to welding operations such as the studies by 8
Friedman (1975), Brown and Song (1992), Mechaleris and Debiccari (1997), Frewin and Scott (1999), and Taylor et al. (1999). Generally, the finite element method has already been proven to be a successful tool to simulate the complex welding process as performed by Friedman (1975). His 2-D finite element analysis work was then used by Taylor et al. (1999) to verify their 3-D computational modeling of welding phenomena. The results of finite element analysis done by Taylor el al. (1999) were in reasonable agreement with the result obtained by Friedman (1975). The Freidman’s work has also been used in this thesis as a verification finite element model. Most of the welding research in the past was conducted to investigate the distribution of residual stress and distortion of welded metal. The work performed by Mandal and Sundar (1997) for example, estimates the welding shrinkage in a welded butt joint by applying a mathematical model approach. Michaleris and Debiccari, and Okumoto (1997,1998) conducted thermo-elasto-plastic finite element analysis for welding simulation to predict the welding distortion. They have claimed that their approaches have been proven consistent to experimental and empirical data. Furthermore, Puchaicela (1998) in his article reviewed and analyzed several formulas and figures in an attempt to provide a practical guide for the control and reduction of distortion. Not only the welding residual stress and distortion have been studied by welding researchers, but the effects of welding parameter, welding sequence, welding joint geometry, and root opening has also been investigated by several researchers in the past. Harwig et al. (1999) for instance, studied the effect of welding parameters and electrode classification on the diffusible hydrogen content of gas shielded flux cored arc welds. In 1999, Tsai et al. studied the effect of welding sequence on buckling and warping behavior of a thin-plate panel structure. Tsai et al. (2001) have also investigated the effects of welding parameters and joint geometry on the magnitude and distribution of residual stresses on thick-section butt joints. The effect of the root opening on mechanical properties, deformation and residual stress has been reported by Jang et al. (2001).
9
As shown by the above researchers, residual stress distribution and distortion in a welded plate are strongly affected by many parameters and by their interaction. Yet, certain aspects of the welding phenomenon are still subject to further research specifically the effects of heat input, welding speed, restraint, plate curvature, and gap on arc welding responses as applied to curved steel plate welding.
2.2
Physics of Arc Welding
The physics of welding deals with complex physical phenomena associated with welding, including heat, electricity, magnetism, light, and sound. By the application of intense heat, metal at the joint between two parts is melted and caused to intermix. Generally, it is described by an electric field between the positive anode and the negative cathode surrounded by an ionization gas. In arc welding, the intense heat needed to melt metal is produced by an electric arc. On the metal, there is a thin layer of surface electrons, which are accelerated in the field towards the anode. These electrons collide with the atoms in the gas, causing impact ionization where the atoms are decomposed into electrons and positive ions, which cause further ionization. The current of electrically charged particles in the arc and the temperature are interrelated as high temperatures increase ionization causes the temperature rise due to the released energy. To obtain welding conditions the temperature or the current must initially be brought up to a certain level, which is done by igniting the arc. Arc ignition is accomplished by the short-circuit current which occurs as the anode and the cathode are brought into brief contact. The short-circuit current shortly increases the temperature and the current and subsequently the arc can be maintained in the electric field existing under normal welding conditions. The arc is surrounded by a magnetic field directing the charged particles towards the center of the arc, causing the arc to localize in spots on the anode and the cathode. When the electrically charged particles impact on the anode and the cathode, the anode and the cathode spots are heated to high temperatures. The high temperature of approximately 3000 to 5000 C causes both the
10
electrode and the welded metal to melt. Due to suction force of the plasma flow, droplets of the electrode material are deposited on the metal.
2.3
Theory of Heat Transfer
In general, the rate of the heat transfer through conduction is given by the Fourier equation. q" = − k∇T
(1)
where, q”
is the heat flux,
k
is the thermal conductivity of the material,
T
is temperature, and
∇ = ( ∂ / ∂x , ∂ / ∂y , ∂ / ∂z )
The conservation of energy in a differential form can be written as:
ρc
∂T ∂ ∂T ∂ ∂ ∂T ∂ ∂T = kx + ky + kz + g "' ∂t ∂x ∂x ∂x ∂y ∂y ∂z ∂z
(2)
where, ρ
is the density of the material,
c
is specific heat,
g”’
is heat generated inside the element, and
t
is time.
If the thermal conductivity of the material, k is assumed constant, then Eq. 2 becomes; ∂ 2T ∂ 2T ∂ 2T ∂T = α 2 + 2 + 2 + g" ' ∂t ∂y ∂z ∂x where, α
is thermal diffusivity (k/ρc) 11
(3)
Eq. 3, now, is the differential equation of heat conduction for a stationary, homogeneous, isotropic solid with constant thermal conductivity, k. The solution to this equation is strongly dependent on the boundary conditions and initial conditions. In this thesis, temperature dependent thermal properties were assumed, therefore, nonlinear equations were solved with all complexity related to their solution. The boundary conditions for the heat transfer coefficient are divided into radiation and convection. 1)
The radiation heat transfer formula is
(
q" rad = σε T 4 − T∞4
)
(4)
where,
2)
ε
is the emissivity,
σ
is the Stefan-Boltmann constant,
T
is body temperature, and
T∞
is surrounding temperature.
The second boundary condition is convection heat transfer, which is given as, q"con = h(T − T∞ )
(5)
where, h
is convection heat transfer coefficient,
T
is body temperature, and
T∞
is surrounding temperature.
Solving Eq. 3 with the appropriate boundary and initial conditions yields for a line heat source equation (i.e Eq. 6). Appendix B derives the equation of the line heat source for an infinite solid.
12
T - T0 =
q' vx vr exp - K 0 2 pk 2a 2a
(6)
where,
2.4
T
is temperature,
T0
is initial temperature,
q’
is the heat per unit length,
v
is heat source speed,
ξ
is defined as rcosΦ
r
is defined as ξ 2 + y 2
α
is thermal diffusivity (k/ρc).
Heat Affected Zone (HAZ)
A welded joint consists of melt-pool zone (MPZ), heat affected zone (HAZ), and unaffected base metal. The HAZ is defined as the portion of the base metal that has not been melted, but whose mechanical properties or microstructure have been altered by the heat of the welding. The HAZ is crucial to the strength of the weldment since the cracking and fracture occur inside the HAZ region. During welding, the temperature at this region is very severe. As a result, it contains a variety of microstructures some of which have weak toughness and strength properties. Figure 2.1 depicts a melt-pool zone (MPZ) and heat affected zone (HAZ) in the weldment during welding process.
13
Heat source Melt-pool zone Heat affected zone
Base metal
Figure 2.1
Illustration of Melt-Pool Zone and Heat Affected Zone (HAZ).
The effects of temperature distribution on microstructure of material in the HAZ have been reported by Weisman (1976). Figure 2.2 illustrates the relationships of HAZ and the iron carbon phase diagram. The HAZ can be divided into four regions; each of the regions is defined by a different type of material microstructure. In the first region of HAZ, rapid austenitic grain growth takes place when the temperature is close to the melting point. Hardenability in this region increases due to large grain size. If the cooling rate is high enough, it can readily transform to martensite. Region 2 of HAZ falls into lower austenite range. The material of this zone may also transform to martentite if the cooling rate is fast enough. The hardenability in this region will not be significantly increased by grain growth due to low temperature in order to promote grain growth. In region 3, some grains transform to austenite and some do not. A small amount of martensite may form in this region. This zone is normally not very hard, but if martensite exists, the material may be brittle. Lastly, in region 4, the metal is not heated enough to form austenite, but rather the heat source serves to temper the metal to a soft condition.
14
Figure 2.2 Approximate Relationships Among Peak Temperature, Distance from Weld Interface, and the Iron-Carbon Phase Diagram (Weisman, 1976).
15
2.5
Theory of Welding Deformations
During the heating and cooling cycles of a welding process, many factors affect shrinkage of the metal, making accurate predictions of distortion complex and difficult. The physical and mechanical properties of the metal that affect the degree of distortion change with the application of the heat. As the temperature of the weld increases, the yield strength, the modulus of elasticity and the thermal conductivity of the steel decrease, whereas, the specific heat and the coefficient of thermal expansion increase. The changes in temperature and stresses during welding process have been reported by Weisman (1976). To illustrate physically how residual stresses are formed during welding process, a bead fillet on a plate will be described as shown schematically in Figure 2.3(a). The figure also shows the arc, which is moving at a speed v, is located at the origin O. The hatched area, M-M’, in Figure 2.3(a) shows the region where plastic deformation occurs during the welding. The egg-shaped region near the origin O indicates the region where the metal is melted. The metal outside the hatched area remains elastic during the entire welding cycles. To describe the temperature changes during welding, several cross-sections are analyzed as shown in Figure 2.3(b). In some distance ahead of the welding torch, which is section along A-A, the temperature gradient, ∆T due to the welding is almost zero. Along section B-B, which crosses the welding arc, the temperature change is very high and the distribution is very uneven. Along section C-C, which is some distance behind the welding arc, the temperature change becomes less steep and more even. Finally, along section D-D, which is very far from the welding arc, the temperature change due to welding has returned to nearly zero. The distribution of stresses σx, in the X-direction at cross sections A-A, B-B, C-C, and DD are illustrated in Figure 2.3(c). Normal stresses in y-direction, σy, shearing stresses,
τxy, also exist, but are usually much smaller than σx. Along section A-A, the thermal stresses due to welding are almost zero. Stresses in region below the weld pool at
16
section B-B are also almost zero because molten metal cannot support a load. Stresses in the heat-affected zone (HAZ) are compressive, because the expansion of these areas is restrained by surrounding metal where the temperature is lower. Since the metal temperature in these regions is high and the yield strength of material is low, the stresses are as high as the yield strength of the material at the corresponding temperature. The magnitude of compressive stress reaches a maximum with increasing distance from the weld or with decreasing temperature. Stresses in regions away from the weld line, however, are tensile to balance with the compressive stresses in areas near the weld. At section C-C, where the weld metal and heat-affected zone have cooled, the result is in tensile stresses in regions near the weld as they try to shrink and compressive stresses at greater distance. Finally, section D-D represents a cooled-down region, where hightensile stresses are present in the HAZ zone and compressive stresses exist in base plate away from the weld.
17
Y D
C
A
B Melted region
M
X M’
Region where plastic deformation occurs during welding D
B
C
A
(a) Weldment of large plate. Section D-D
Section C-C
Section B-B
Section A-A
∆T≈0
∆T≈0
(b) Temperature distribution during welding. Residual stress
Compressive
Tensile
(c) Stress σx distribution during welding.
Figure 2. 3 Schematic Representation of Changes of Temperature and Stresses During Welding (Weisman, 1976).
18
Stress ≈ 0
2.6
Type of Welding Deformations
During welding, there are non-uniform heating and cooling cycles in the weld and adjacent base metal, which causes complex thermal strains. The stresses resulting from the strains produce internal forces causing shrinkage of the material. The stresses that would exist in a weldment after all external loads are removed are called residual stresses. Depending on the shrinkage pattern and the shape of the structure welded, various deformations such as bending, buckling and rotation take place. When steel structure parts connected by welding, they are accompanied by not only welding residual stresses but also distortion. The distortion found in the welded structures is caused by four fundamental dimension changes that occur during welding process. •
Transverse shrinkage of butt joints- dimensional reduction in a
direction perpendicular to the welding line. •
Longitudinal shrinkage of butt joints- dimensional reduction in a
direction parallel to the weld
line. The amount of the longitudinal
shrinkage is small in comparison to transverse shrinkage, about 1/1000 of the weld length as reported by Weisman (1976). •
Angular distortion of butt joints – an angular change that occurs due to
a non-uniform thermal contraction through the thickness of the plate. The non-uniform thermal contraction originates from the uneven heating through the thickness during welding. •
Angular distortion of fillet welds – similar to the angular distortion of
welds in butt joints, the non-uniform thermal contraction through the thickness of the flanges creates a moment M about the flange neutral axes.
19
•
Longitudinal bending distortion – produced by bending stresses
induced by the longitudinal shrinkage forces of the welds not coinciding with the neutral axis of the weldment.
(a)
(b)
(c)
(d)
Figure 2. 4 Various Type of Welding Distortion. (a) Transverse Shrinkage in a Butt-Joint; (b) Angular Change in a Butt-Joint; (c) Angular Change in a T-Joint; (d) Longitudinal Distortion in a Fillet Joint.
20
2.7
Residual Stress
The residual stress exists in the weldment primarily because the weld material that has been melted contracts on cooling down from melting point to room temperature. Figure 2.5 shows the deflection of a welded plate when a longitudinal edge is heated by a moving welding arc. The metal near the heat source is heated to higher temperatures than the metal away from the heat source. The hotter metal expands, and the plate first deforms as shown by curve AB. Due to the existence of plastic strains, after the plate cools to room temperature, the final deformation δ remains as shown by curve ABCD. To explain this phenomenon, lets consider a butt joint welding with a gap and without a gap. When the weld material first starts to solidify, the heated material expands but the base metal prevents it. As shown in the Figure 2.6 (a), element 1 is in tension but element 2 is in compression. When the weld cools down, the opposite phenomena will be observed; the weld material contracts but the base metal stops it. Consequently, element 1 is in compression and element 2 is in tension as shown in Figure 2.6 (b). As a result, the metal plates will deform in such a way that the top surface is in tension and bottom surface is in compression. For the case of butt joint welding without gap, less deformation is expected due to the bottom surface if freely to expand as it cools down. δ Deflection, δ A
Weld
B
δ x
C Time
δf
Weld D δf Figure 2.5 Deformation of Welded Plate Under the Influence of a Longitudinal Moving Heat Source. 21
Without gap
With Gap
Weld Material
1
3
Base Metal 2
a)
4
Solidifying Weld
Weld Material
1
3
Base Metal 2
b)
4
Cooled Weld
Figure 2.6
Contraction and Expansion Phenomena.
22
Chapter 3: Modeling and Simulation of Welding 3.1
Overview of Welding Simulation
As presented by several researchers, finite element method (FEM) has been successfully used to evaluate thermo mechanical response of the complex welding process. In this thesis, the finite element (FE) package ANSYS® has been used to simulate the arc welding process. The finite element simulation of welding process requires two analyses; transient thermal analysis and elasto-plastic analysis. To simplifying the simulation procedure, uncoupled numerical simulations were used. In such uncoupled analyses, the results of the transient thermal analysis which include the temperature distribution, will be used for the second analysis together with the temperature dependent mechanical properties of the material i.e., thermal expansion coefficient, modulus of elasticity, Poisson’s ratio, etc. Density in this analysis is assumed constant. In this study, no experimental data were available to verify the simulation results. Instead, the results of the simulation were compared to numerical results obtained from previous researcher. Once the simulation results matched the numerical results, the same finite element formulations were used to simulate the welding process through out this study.
3.2
Verification of Butt Welding Process Using ANSYS®
In this study, a finite element simulation of a single-pass corner joint welding was verified using the work of Friedman (1975). To do this, a simple butt-joint welding whose welding parameters are consistent to those of Friedman’s model; heat input Q=703 Watts, the characteristic length of heat flux r = 5.08 mm, and welding speed of 2.12
23
mm/sec was simulated using ANSYS® codes. The model then was verified by comparison of its temperature distribution at some chosen nodes with the Friedman’s model. The temperature dependent material properties for the thermal and mechanical analyses were equivalent to those used in Friedman’s analyses as plotted in Figure 3.1 and Figure 3.2, respectively. Figure 3.3 depicts plate geometry of the butt-joint welding which is similar to the Friedman’s model. However, since the temperature distribution of the butt-joint welding is symmetric about the weld line, only half of the weldment needs to be modeled.
Figure 3. 1
Thermal properties of Inconel 600 used by Friedman (1975).
24
Figure 3. 2
Mechanical Properties of Inconel 600 used by Friedman (1975).
25
Heat Source
Y
Base Plate
Weld Material
X
Welding Direction L
Gap t R
W
Z Notes:
Drawing not to scale t = 2.54 mm R = 2.54 mm W = 150 mm L = 250 mm
Figure 3. 3
3.2.1
Illustration of Butt-Joint Arc Welding Process
Simulation Results
The results shows that the temperature histories at various locations from the weld line are in reasonable agreement with the result obtained by Friedman (1975). The peak temperatures for both models were almost identical. The distances from the weld line of the verification model were slightly different from Friedman’s due to mesh size. Phase change effect was not included in the verification model. Figure 3.4 and Figure 3.5 show the temperature distribution curves from Friedman’s and verification models, respectively.
26
TEMPERATURE HISTORIES AT VARIOUS DISTANCE FROM WELDLINE
2500
TEMPERATURE (K)
2000 1500 1000 500 0 TIME (MIN)
Figure 3.4
Temperature Histories Distribution from Friedman’s Paper (1975).
TEMPERATURE HISTORIES AT VARIOUS DISTANCE FROM WELDLINE 2500
TOP SURFACE x= 0.00
2000 TEMPERATURE (K)
x= 0.00
BOTTOM SURFACE
x= 3.89 mm x= 3.89 mm
1500
x= 6.87 mm x= 10.26 mm x = 23.20 mm
1000
500
0 -0.10
0.00
0.10
0.20
0.30
0.40
0.50
TIME (MIN)
Figure 3. 5
Temperature Histories Distribution from Heat Transfer Analysis.
27
3.3
Finite Element Analysis of Corner-Joint Welding
3.3.1
Introduction
Corner-joint welding of steel plates was simulated through out this research by applying the same approach as used in the butt-joint welding. However, since the heat distribution was not symmetric in curved plates, vertical and horizontal plates had to be included in the model. Figure 3.6 depicts a typical corner-joint with single pass weld, in which the torch travels constantly along the backside corner of the steel plate. In this thesis, a 3D thermo-elasto-plastic analysis was performed on three types of plate curvatures, namely low, medium, and high. Table 3.1 shows the design matrix of welding parameters used in the finite element simulation.
Welding Torch
Clamping (Typical)
Welding Direction
Weld materia
Base
Figure 3. 6
Illustration of Single-Pass Corner-Joint with Three Clamps on Each Plate. 28
Table 3. 1
Design Matrix of Welding Parameters Used in the Finite Element Simulation.
Case
Study of:
Heat Input Speed
Restraint
Curvature
1 2 3 4
Effect of Heat Input Effect of Speed Effect of Restraint Effect of Curvature without a Gap Effect of Curvature with a Gap Effect of Gap
Changed* 1200 W 1200 W 1200 W
2.10 mm/s Changed* 2.10 mm/s 2.10 mm/s
Set #2 Set #2 Changed* Set #2
0.0025 0.0025 0.0025 Changed*
Gap/No Gap No Gap No Gap No Gap No Gap
1200 W
2.10 mm/s
Set #2
Changed*
Gap
1200 W
2.10 mm/s
Set #2
0.0000
Gap & No Gap
5 6
Note: * low, medium, and high values were applied.
3.3.2
Model Descriptions and Meshes
Three different models were used in this study as shown in Figure 3.7. First, a steel plate with radius of curvature 150 mm, the second model represents the radius of curvature 400 mm, and the third model represents straight steel plates. The length of arc traveled and the thickness of the geometries are the same. Table 3.2 shows the geometries of the steel plate used through out this thesis. Table 3. 2
Dimensions of Three Plate Curvatures Used in the Analyses.
Radius of
Arc Length
Width
Thickness
Curvature, r
(mm)
(mm)
(mm)
150
279.25
100
6
106.67
400
279.25
100
6
40
Infinity
279.25
100
6
∞
29
Angle
R=∞ (Straight)
R = 400 mm
(a)
(b)
R = 150 mm
(c) Figure 3.7 Three Different Models Used in Thesis. (a) Low Curvature of 0.0000 (Straight Plates); (b) Medium Curvature of 0.0025 1/mm (R = 400 mm); (c) High Curvature of 00.67 1/mm (R = 150 mm).
The meshes used for all models are gradually refined from fine to coarse, according to the expected reduction in temperature gradient moving away from the heat source as shown in Figure 3.8. A total of 1250 solid elements and 500 shell elements were used in the models. Nodes and elements numbers were consistent for all models.
30
Figure 3. 8
3.3.3
Finite Element Mesh of Three-Dimensional Curved Plates.
Material Properties
Several different materials have been used in structures where welding is involved, with low carbon steel being the most common. The weldment material properties employed in this thesis were mild steel, which were taken from Brown and Song (1992). Table 3.3 shows the temperature dependent material properties used for the heat transfer and transient elasto-plastic analyses. For simplicity, the deposited weld material was also assumed to be, low carbon steel. Two sets of temperature dependent material properties were needed in the analyses. The heat transfer analysis requires thermal conductivity, specific heat, density (constant) and combined convection and radiation heat coefficient. On the other hand, the modulus of elasticity, Poisson ratio, and thermal expansion coefficient are required for elasto-plastic analysis. 31
The modulus of elasticity is a measure of the stiffness of a material. A higher modulus material is more likely to resist distortion. The amount of expansion or contraction a metal will undergo during a heating or a cooling cycle depends on the coefficient of thermal expansion. Therefore, the possibility of distortion will be larger in metals having a higher coefficient of thermal expansion because they are expected to experience higher shrinkage during cooling of the weld metal and the adjacent metal. Thermal conductivity gives a measure of the ease of heat flow through a material. A metal with low thermal conductivity does not dissipate heat rapidly, and steep temperature gradients result. Hence, the shrinkage effect in the weld and in the adjacent plate increases.
Table 3. 3 Weld.
Temperature-Dependent Material Properties for Both Steel Plate and
Temperatures Modulus of Poisson Thermal Ex. Thermal (Celsius) Elasticity Ratio Coef.(10-6 /0C) Conductivity (MPa) (W/m oK) 0 314 0.2786 10 51.9
Specific Heat (J/kgoK)
100
349
0.3095
11
51.1
499.2
300
440
0.331
12
46.1
565.5
450
460
0.338
13
41.05
630.5
550
410
0.3575
14
37.5
705.5
600
330
0.3738
14
35.6
773.3
720
58.8
0.3738
14
30.64
1080.4
800
58.8
0.4238
14
26
931
1450
1.29
0.4738
15
29.45
437.93
1510
1.0
0.499
15
29.7
400
1580
0.01
0.499
15
29.7
735.25
5000
0.01
0.499
15.5
42.2
400
32
450
3.4
“Birth and Death” Feature
The material deposition is modeled using an element “birth and death” technique. To achieve the “death element” effect, the ANSYS® code does not actually remove the element from the model. Instead, the weld elements are first deactivated by multiplying their stiffness (or conductivity, or other analogous quantity) by a huge reduction factor. Meanwhile, to obtain the “birth element” effect, the ANSYS® program then reactivates the “death element” by allowing its stiffness, mass, element loads, etc. return to their original values.
3.5
Heat Transfer Analysis
The first part of the finite element simulation of arc welding is heat transfer analysis. In the finite element formulation, this equation can be written for each element as follows; •
[C(T)]{T}+ [K (T)]{T} = {Q(T)}
(7)
where, [C(T)] is specific heat matrix [K(T)] is conductivity matrix {T} •
{T }
is vector of nodal temperatures isvector of time derivative of {T}
{Q(T)} is nodal heat flux vector The Eq. 7 now, is simply the vector and matrix form of Eq. 2. This analysis requires an integration of the heat conduction equation with respect to time. The CrankNicholson/Euler theta integration method is applied to solve these system equations. This implicit method is employed to discretize the governing equation with respect to 33
time and solve the equation at discrete time points. The difference between any two points is known as the time integration, which is specified by the user (ANSYS® Users Manual, 2001). In ANSYS® the heat transfer analysis was conducted using element type SOLID70. This element type has a three-dimensional thermal conduction capability, and eight nodes with a single degree of freedom (temperature) at each node. The element is applicable to a three-dimensional, steady-state or transient thermal analysis. The element can also compensate for mass transport heat flow from a constant velocity field (ANSYS® Users Manual, 2001). Since only one surface load can be applied on solid element SOLID70, shell element type SHELL57 was also used to simulate heat lost through convection and radiation on the surface. The heat input from the welding electrode was modeled by using heat flux as the input for the heat transfer from the rod to the work piece. This heat flux is based on the welder setting and the efficiency of the arc. The Gaussian heat flux distribution on the surface of the weldment, directed parallel to the electrode, is given by Goldak et al. (1986) as follows:
z + v(( r ) − t) 3Q x 2 v q(x, z, t) = exp[−3( ) ]exp[−3( )2 ] 2 r r πr where, x
is the distance perpendicular to the weld line
z
is the distance along the direction of the weld line
v
is the speed rate of the electrode
r
is the region in which 95% of the heat flux is deposited, and Q = ηVI
(where η, V, and I are arc efficiency, arc voltage, and current, respectively)
34
(8)
The heat loss was modeled using convection and radiation heat transfer. The convective coefficient was assumed to vary with temperature. The result of the heat transfer analysis is the time dependent temperature distribution at each node of the element. Figure 3.9 shows the temperature distribution at various locations of vertical and horizontal base plate. Notice that the legends (i.e “V-19.03, etc) of both graphs represent the distances from the weld line. The graphs show that the temperature distributions on vertical and horizontal plates are almost identical although the geometry is not symmetric.
35
(a) Temperature Distribution in the Horizontal Plate
(b) Temperature Distribution in the Vertical Plate Figure 3. 9 Plot of Temperature Distribution at Various Locations of Vertical and Horizontal Plates, Respectively. 36
3.5.1
Model Assumptions
To simplify the heat transfer analysis, the following assumptions were made (Bonifaz, 2000): 1)
All boundaries except the top surface were assumed to satisfy the adiabatic condition.
2)
The portion underneath the arc was assumed to be insulated during the time the arc was applying to the surface.
3)
A combined convection and radiation boundary condition was used on the remaining of the top surface. The formula is as follows: H = 24.1 X 10⁻⁴ εT1.61 Where, H is the combined convection and radiation heat transfer coefficient, ε is thermal emissitivity, and T is the temperature.
4)
The analysis is based on quasi-steady state, i.e., the heat source is moving at a constant velocity.
5)
Effective depth of penetration is shallow, thus, Gaussian heat flux distribution was used on Heat Affected Zone (HAZ).
3.6
Mechanical Analysis
To evaluate the distortion and residual stress distribution the heat transfer analysis was performed first in order to find nodal temperatures as a function of time. Then in the second part of the analyses, a non-linear structural analysis was carried using the temperature distributions, which were obtained from the heat transfer analysis. In this analysis, quasi-static equation of equilibrium is given by ∇σ + F = 0
(9)
where ∇
is deferential operator
σ
is the stress 37
F
is the body force
The stress-strain relationship is defined as follows: {σ } = [D]{ε e }
(10)
where {σ }
is stress vector
[D]
is stiffeness matrix
{ε e }
is elastic strain vector
For the deformation of metals, the von Mises yield criterion is employed and the elastic strain is given by
ε =ε −ε −ε e
pl
(11)
th
where
εe
is the elastic strain
ε
is total strain
εpl
is plastic strain
εth
is thermal strain
The stress-strain relationship now becomes {σ } = [D]({ε } − {ε pl } − {ε th })
(12)
In the second analysis, element SOLID70 was replaced by a three-dimensional (3-D) structural element SOLID45. The element is defined by eight nodes having three degrees of freedom at each node (translations in the nodal x, y, and z directions). The element has plasticity, creep, swelling, stress stiffening, large deflection, and large strain capabilities (ANSYS® Users Manual, 2001).
38
3.7
Thermo-Mechanical Results
The residual stress and plastic deformation were obtained after the model cooled down to room temperature. The figures 12-19 show the displacements, stresses, and strains distributions at the time of 1590 sec. The maximum value could be found in the red region.
39
Figure 3. 10 X-Displacement Contour.
Figure 3. 11 Y-Displacement Contour.
40
Figure 3. 12 Z-Displacement Contour.
Figure 3. 13 USUM Contour.
41
Figure 3. 14 X-Stress Contour.
Figure 3. 15 Y-Stress Contour.
42
Figure 3. 16 Z-Stress Contour.
Figure 3. 17 Von Mises Stress Contour.
43
Chapter 4: 4.1
Study of Weld Response
Introduction
In this thesis, six cases with different combinations of parameters have been studied. The six cases are as described in Table 3.1. Each parameter was investigated with low, medium, and high values. The parameters are classified into three categories as follows: •
Welding process parameters Heat input Welding speed
•
Welding geometry Curvature Gap (on or off)
•
Welding fixture Restraint
Thermo-mechanical responses such as residual stresses, strains, and displacements were obtained from the finite element elasto-plastic analysis. The responses were taken along longitudinal cross sections at seven distances from the weld line; 0.00, 5.86 mm, 14.56 mm, 27.42 mm, 45.41 mm, 83.80 mm, and 100.00 mm. The locations of the constraints for all models, except the model with restraint #1, were located along the cross section 83.80 mm from the weld line. For all six cases, the responses at each node along the seven longitudinal cross sections were plotted over the nodes along the cross sections.
Since the responses of the curved
plates are not symmetric, both plates; vertical and horizontal, were analyzed. Appendix C shows a sample of the plots of the responses against the nodes along the arc length. The plots represent the case of varying heat input on horizontal plate.
44
To summarize all the plots, the maximum absolute values of the responses were then plotted against the longitudinal cross sections. The study of thermo mechanical responses in this chapter is based on the aforementioned plots. 4.2
Effects of Heat Input
4.2.1
Introduction
Heat input is one of the most important process parameters in controlling weld response. It can be referred to as an electrical energy supplied by the welding arc to the weldment. In practice, however, heat input can approximately (i.e., if the arc efficiency is not taken into consideration) be characterized as the ratio of the arc power supplied to the electrode to the arc travel speed, as shown in the following equation: Q=
I x V x 60 v
(13)
Where, I is welding current ; V is welding arc voltage; v is the arc welding speed, and Q is the heat input . The most important characteristic of heat input is that it governs the cooling rates in welds and thus, affects the microstructure of the weld metal and the heat- affected zone. A change in microstructure directly affects the mechanical properties of welds. In this thesis, the effect of heat input on welding responses was evaluated using three values (heat input in Watt), characterized as low, medium, and high. Table 4.1 illustrates the values used for the analyses. This evaluation was carried out by considering the rest of parameters; welding speed, and restraint were kept constant at medium values.
Table 4.1
Range of Heat Input Used for FEA.
LOW
MEDIUM
HIGH
900 Watts
1200 Watts
1500 Watts
45
4.2.2
Analysis of Results
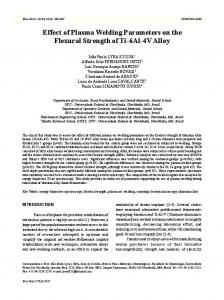
The effects of varying heat input on the thermo mechanical responses is illustrated in Figures 4.1-4.4. Obviously, the results showed that the welding heat input has significant effect on the welding responses. When the heat input increases, the responses such as displacements, stresses, and strains also increase. An increase of 25 % of heat input results in a significant increase in the Y-displacement (78 %), X-stresses (36 %), and Xelastic strain (36 %). In the horizontal plate, Figure 4.1(c) showed that Y-displacement is more sensitive to heat input as compared to other directional displacements. On the other hand, as shown in Figure 4.1(b), X-displacement in the vertical plate is more sensitive to heat input as compared to ‘Y’ and ‘Z’ displacements. From both plots, it is shown that the maximum displacement occurs along cross section 5.86 mm from the weld line which is in the heat affected zone. Figures 4.2 and 4.3, however, showed opposite behavior for directional stresses and elastic strains. X-stress Y-stress changed significantly to the heat input in horizontal plate and vertical plate, respectively. As shown in Figure 4.4, on the other hand, heat input variables do not have a significant impact on plastic strains.
46
Max. Abs. X-Displacement vs Long. Cross Section
0.2 0.15
900 1200 1500
0.1 0.05 0 0
20
40
60
80
100
Max. Abs. X-Disp. (mm)
Max. Abs. X-Disp. (mm)
Max. Abs. X-Displacement vs Long. Cross Section
0.2 0.15
900 1200 1500
0.1 0.05 0
120
0
20
Longitudinal Cross Section (mm)
(a) X-Displacement (Horizontal Plate)
900 1200 1500
0.1 0.05 0 60
80
100
Max. Abs. Y-Disp. (mm)
Max. Abs. Y-Disp. (mm)
0.15
40
120
0.15
900 1200 1500
0.1 0.05 0
120
0
20
40
60
80
100
120
Longitudinal Cross Section (mm)
(c) Y-Displacement (Horizontal Plate)
(d) Y-Displacement (Vertical Plate)
Max. Abs. Z-Displacement vs Long. Cross Section
Max. Abs. Z-Displacement vs Long. Cross Section
0.2
0.15
900 1200 1500
0.1 0.05
Max. Abs Z-Disp. (mm)
0.2 Max. Abs Z-Disp. (mm)
100
0.2
Longitudinal Cross Section (mm)
0
0.15
900 1200 1500
0.1 0.05 0
0
20
40
60
80
100
120
0
20
Longitudinal Cross Section (mm)
40
60
80
100
120
Longitudinal Cross Section (mm)
(e) Z-Displacement (Horizontal Plate)
(f) Z-Displacement (Vertical Plate) Max. USUM vs Long. Cross Section
Max. USUM vs Long. Cross Section
0.2
0.15
900 1200 1500
0.1 0.05
Max. USUM (mm)
0.2 Max. USUM (mm)
80
Max. Abs. Y-Displacement vs Long. Cross Section
0.2
20
60
(b) X-Displacement (Vertical Plate)
Max. Abs. Y-Displacement vs Long. Cross Section
0
40
Longitudinal Cross Section (mm)
0.15
900 1200 1500
0.1 0.05 0
0 0
20
40
60
80
100
0
120
(g) USUM (Horizontal Plate) Figure 4.1
20
40
60
80
100
120
Longitudinal Cross Section (mm)
Longitudinal Cross Section (mm)
(h) USUM (Vertical Plate)
Graphs Illustrate the Effects of Varying Heat input on Displacements.
47
350 300 250 200 150 100 50 0
Max. Abs. X-Stress vs Long. Cross Section
900 1200 1500
0
20
40
60
80
100
Max. Abs. X-Stress (MPa)
Max. Abs. X-Stress (MPa)
Max. Abs. X-Stress vs Long. Cross Section
350 300 250 200 150 100 50 0
120
900 1200 1500
0
20
Longitudinal Cross Section (mm)
(a) X-Stress (Horizontal Plate)
900 1200 1500
40
60
80
100
120
20
100
20
100
120
Max. Abs. Z-Stress (MPa)
Max. Abs. Z-Stress (MPa)
Max. Von Mises (MPa)
Max. Von Mises (MPa)
100
120
350 300 250 200 150 100 50 0
900 1200 1500
0
Longitudinal Cross Section (mm)
20
40
60
80
100
120
Longitudinal Cross Section (mm)
(g) Von Mises Stress (Horizontal Plate) Figure 4.2
80
Max. Von Mises Stress vs Long. Cross Section
900 1200 1500
80
60
(f) Z-Stress (Vertical Plate)
350 300 250 200 150 100 50 0 60
40
Longitudinal Cross Section (mm)
Max. Von Mises Stress vs Long. Cross Section
40
120
900 1200 1500
0
120
(e) Z-Stress (Horizontal Plate)
20
100
350 300 250 200 150 100 50 0
Longitudinal Cross Section (mm)
0
80
Max. Abs. Z-Stress vs Long. Cross Section
900 1200 1500
80
60
(d) Y-Stress (Vertical Plate)
350 300 250 200 150 100 50 0 60
40
Longitudinal Cross Section (mm)
Max. Abs. Z-Stress vs Long. Cross Section
40
120
900 1200 1500
0
(c) Y-Stress (Horizontal Plate)
20
100
350 300 250 200 150 100 50 0
Longitudinal Cross Section (mm)
0
80
Max. Abs. Y-Stress vs Long. Cross Section
Max. Abs.Y-Stress (MPa)
Max. Abs.Y-Stress (MPa)
350 300 250 200 150 100 50 0 20
60
(b) X-Stress (Vertical Plate)
Max. Abs. Y-Stress vs Long. Cross Section
0
40
Longitudinal Cross Section (mm)
(h) Von Mises Stress(Vertical Plate)
Graphs Illustrate the Effects of Varying Heat Input on Stresses.
48
Max. X-Elas. Strain vs Long. Cross Section
0.0015 0.001
900 1200 1500
0.0005 0 0
20
40
60
80
100
Max. Abs. X-Elas. Strain
Max. Abs. X-Elas. Strain
Max. X-Elas. Strain vs Long. Cross Section
0.0015 0.001
900 1200 1500
0.0005 0
120
0
20
Longitudinal Cross Section (mm)
(a) X-Elastic Strains (Horizontal Plate)
80
100
120
Max. Abs. Y-Elas. Strain vs. Long. Cross Section
0.0015
0.0015 900 1200 1500
0.001 0.0005
Max. Y-Elas. Strain
Max. Y-Elas. Strain
60
(b) X-Elastic Strains (Vertical Plate)
Max. Abs. Y-Elas. Strain vs. Long. Cross Section
0
0.001
900 1200 1500
0.0005 0
0
20
40
60
80
100
120
0
20
Longitudinal Cross Section (mm)
40
60
80
100
120
Longitudinal Cross Section (mm)
(c) Y-Elastic Strains (Horizontal Plate)
(d) Y-Elastic Strains (Vertical Plate)
Max. Z-Elas. Strain vs. Long. Cross Section
Max. Z-Elas. Strain vs. Long. Cross Section
0.0015
0.0015
0.001
900 1200 1500
0.0005 0
Max. Z-Elas. Strain
Max. Z-Elas. Strain
40
Longitudinal Cross Section (mm)
0.001
900 1200 1500
0.0005 0
0
20
40
60
80
100
120
0
Longitudinal Cross Section (mm)
40
60
80
100
120
Longitudinal Cross Section (mm)
(e) Z-Elastic Strains (Horizontal Plate) Figure 4.3
20
(f) Z-Elastic Strains (Vertical Plate)
Graphs Illustrate the Effects of Varying Heat Input on Elastic Strains.
49
0.014 0.012 0.01 0.008 0.006 0.004 0.002 0
Max. Abs. X-Plas. Strain vs. Long. Cross Section
900 1200 1500
0
20
40
60
80
100
Max. Abs. X-Plas. Strain
Max. Abs. X-Plas. Strain
Max. Abs. X-Plas. Strain vs. Long. Cross Section
0.014 0.012 0.01 0.008 0.006 0.004 0.002 0
120
900 1200 1500
0
Longitudinal Cross Ssection (m m )
900 1200 1500
60
80
100
100
120
80
100
120
0.014 0.012 0.01 0.008 0.006 0.004 0.002 0
900 1200 1500
0
Logitudinal Cross Section (m m )
20
40
60
80
100
120
Logitudinal Cross Section (m m )
(e) Z-Plastic Strains (Horizontal Plate) Figure 4.4
60
Max. Abs. Z-Plas. Strain vs. Long. Cross Section
900 1200 1500
80
40
(d) Y-Plastic Strains (Vertical Plate)
Max. Abs. Z-Plas. Strain
Max. Abs. Z-Plas. Strain
0.014 0.012 0.01 0.008 0.006 0.004 0.002 0 60
20
Longitudinal Cross Section (m m )
Max. Abs. Z-Plas. Strain vs. Long. Cross Section
40
120
900 1200 1500
0
120
(c) Y-Plastic Strains (Horizontal Plate)
20
100
0.014 0.012 0.01 0.008 0.006 0.004 0.002 0
Longitudinal Cross Section (m m )
0
80
Max. Abs. Y-Plas. Strain vs. Long. Cross Section Max. Abs. Y-Plas. Strain
Max. Abs. Y-Plas. Strain
0.014 0.012 0.01 0.008 0.006 0.004 0.002 0 40
60
(b) X-Plastic Strains (Vertical Plate)
Max. Abs. Y-Plas. Strain vs. Long. Cross Section
20
40
Longitudinal Cross Ssection (m m )
(a) X-Plastic Strains (Horizontal Plate)
0
20
(f) Z-Plastic Strains (Vertical Plate)
Graphs Illustrate the Effects of Varying heat Input on Plastic Strains.
50
4.3
Effects of Welding Speed
4.3.1
Introduction
Welding speed represents the distance of the torch traveled along the weld line per unit of time. Based on the equation 13, the heat input is inversely proportional to the welding speed. Therefore, when the heat input is larger, the welding speed is slower for a constant heat input rate. In this research, low, medium, and high welding speeds were investigated while considering the rest of parameters constant at the medium-valued range. Table 4.2 illustrates three different values of speed used in the finite element analyses.
Table 4.2
4.3.2
Range of Welding Speed Used for FEA.
LOW
MEDIUM
HIGH
1.80 mm/sec
2.10 mm/sec
2.40 mm/sec
Analysis of Results
From the Figures 4.5 – 4.8, the effect of variable welding speeds is obvious. As the welding speed increases, the displacements, stresses, and strains decreases. An increase of 14.28 % of the welding speed, for instance, cause a decrease of 20 % in Ydisplacement, decrease of 32 % in X-stress, and decrease of 23 % in X-elastic strain. This trend was expected since heat input is inversely proportional to welding speed as given by Eq. 13. It is noted that the faster the welding speed is made, the less heat is absorbed by the base metal. From the plots also, the thermo mechanical responses of varying welding speed reflect the same trends as the heat inputs.
51
Max. Abs. X-Displacement vs Long. Cross Section
0.15 0.1
1.80 2.10 2.40
0.05 0 0
20
40
60
80
100
Max. Abs. X-Disp. (mm)
Max. Abs. X-Disp. (mm)
Max. Abs. X-Displacement vs Long. Cross Section
0.15 0.1
1.8 2.1 2.4
0.05 0
120
0
20
Longitudinal Cross Section (mm)
(a) X-Displacement (Horizontal Plate)
1.80 2.10 2.40
0.05 0 60
80
100
Max. Abs. Y-Disp. (mm)
Max. Abs. Y-Disp. (mm)
0.1
40
1.8 2.1 2.4
0.05 0 0
20
40
1.80 2.10
0.05
2.40
0 100
Max. Abs Z-Disp. (m m )
Max. Abs Z-Disp. (m m )
120
0.15 0.1
1.8 2.1
0.05
2.4
0 0
120
20
40
60
80
100
120
Longitudinal Cross Section (m m )
Longitudinal Cross Section (m m )
(e) Z-Displacement (Horizontal Plate)
(f) Z-Displacement (Vertical Plate)
Max. USUM vs Long. Cross Section
Max. USUM vs Long. Cross Section
0.2
0.2
0.15
1.80 2.10 2.40
0.1 0.05 0
Max. USUM (m m )
Max. USUM (m m )
100
Max. Abs. Z-Displacement vs Long. Cross Section
0.1
80
80
(d) Y-Displacement (Vertical Plate)
0.15
60
60
Longitudinal Cross Section (mm)
Max. Abs. Z-Displacement vs Long. Cross Section
40
120
0.1
120
(c) Y-Displacement (Horizontal Plate)
20
100
0.15
Longitudinal Cross Section (mm)
0
80
Max. Abs. Y-Displacement vs Long. Cross Section
0.15
20
60
(b) X-Displacement (Vertical Plate)
Max. Abs. Y-Displacement vs Long. Cross Section
0
40
Longitudinal Cross Section (mm)
0.15
1.8 2.1 2.4
0.1 0.05 0
0
20
40
60
80
100
120
0
Longitudinal Cross Section (m m )
20
40
60
80
100
Longitudinal Cross Section (m m )
(g) USUM (Horizontal Plate)
(h) USUM (Vertical Plate)
Figure 4.5 Graphs Illustrate the Effects of Varying Welding Speed on Displacements.
52
120
300 250 200 150 100 50 0
Max. Abs. X-Stress vs Long. Cross Section
1.80 2.10 2.40
0
20
40
60
80
100
Max. Abs. X-Stress (MPa)
Max. Abs. X-Stress (MPa)
Max. Abs. X-Stress vs Long. Cross Section
300 250 200 150 100 50 0
120
1.8 2.1 2.4
0
20
Longitudinal Cross Section (mm )
(a) X-Stress (Horizontal Plate)
1.80 2.10 2.40
40
60
80
100
120
2.4
20
2.40
100
Max. Abs. Z-Stress (MPa)
Max. Abs. Z-Stress (MPa)
100
120
300 250 200 150 100 50 0
1.8 2.1 2.4
0
120
20
40
60
80
100
120
Longitudinal Cross Section (m m )
Longitudinal Cross Section (m m )
(e) Z-Stress (Horizontal Plate)
(f) Z-Stress (Vertical Plate)
Max. Von Mises Stress vs Long. Cross Section
Max. Von Mises Stress vs Long. Cross Section
400
400
300
1.80 2.10 2.40
200 100 0
Max. Von Mises (MPa)
Max. Von Mises Stress (MPa)
80
Max. Abs. Z-Stress vs Long. Cross Section
1.80 2.10
80
60
(d) Y-Stress (Vertical Plate)
300 250 200 150 100 50 0 60
40
Longitudinal Cross Section (m m )
Max. Abs. Z-Stress vs Long. Cross Section
40
120
1.8 2.1
0
(c) Y-Stress (Horizontal Plate)
20
100
300 250 200 150 100 50 0
Longitudinal Cross Section (m m )
0
80
Max. Abs. Y-Stress vs Long. Cross Section Max. Abs.Y-Stress (MPa)
Max. Abs. Y-Stress (MPa)
300 250 200 150 100 50 0 20
60
(b) X-Stress (Vertical Plate)
Max. Abs. Y-Stress vs Long. Cross Section
0
40
Longitudinal Cross Section (mm )
300
1.8 2.1 2.4
200 100 0
0
20
40
60
80
100
120
0
Longitudinal Cross Section (mm)
40
60
80
100
Longitudinal Cross Section (mm)
(g) Von Mises Stress (Horizontal Plate) Figure 4.6
20
(h) Von Mises Stress(Vertical Plate)
Graphs Illustrate the Effects of Varying Welding Speed on Stresses.
53
120
Max. X-Elas. Strain vs Long. Cross Section
0.002 0.0015
1.80
0.001
2.10 2.40
0.0005 0 0
20
40
60
80
100
Max. Abs. X-Elas. Strain
Max. Abs. X-Elas. Strain
Max. X-Elas. Strain vs Long. Cross Section
0.002 0.0015
1.8
0.001
2.1 2.4
0.0005 0
120
0
Longitudinal Cross Section (m m )
60
80
100
120
(b) X-Elastic Strains (Vertical Plate)
Max. Abs. Y-Elas. Strain vs. Long. Cross Section
Max. Abs. Y-Elas. Strain vs. Long. Cross Section
0.002
0.0015 0.001
1.80 2.10
0.0005
2.40
Max. Y-Elas. Strain
0.002 Max. Y-Elas. Strain
40
Longitudinal Cross Section (m m )
(a) X-Elastic Strains (Horizontal Plate)
0
0.0015 0.001
1.8 2.1
0.0005
2.4
0 0
20
40
60
80
100
120
0
Longitudinal Cross Section (m m )
20
40
60
80
100
120
Longitudinal Cross Section (m m )
(c) Y-Elastic Strains (Horizontal Plate)
(d) Y-Elastic Strains (Vertical Plate)
Max. Z-Elas. Strain vs. Long. Cross Section
Max. Z-Elas. Strain vs. Long. Cross Section
0.002
0.002
0.0015
1.80 2.10 2.40
0.001 0.0005 0
Max. Z-Elas. Strain
Max. Z-Elas. Strain
20
0.0015
1.8
0.001
2.1 2.4
0.0005 0
0
20
40
60
80
100
120
0
Longitudinal Cross Section (m m )
40
60
80
100
Longitudinal Cross Section (m m )
(e) Z-Elastic Strains (Horizontal Plate)
Figure 4.7 Strains.
20
(f) X-Elastic Strains (Vertical Plate)
Graphs Illustrate the Effects of Varying Welding Speed on Elastic
54
120
0.012 0.01 0.008 0.006 0.004 0.002 0
Max. Abs. X-Plas. Strain vs. Long. Cross Section
1.80 2.10 2.40
0
20
40
60
80
100
Max. Abs. X-Plas. Strain
Max. Abs. X-Plas. Strain
Max. Abs. X-Plas. Strain vs. Long. Cross Section
0.012 0.01 0.008 0.006 0.004 0.002 0
120
1.8 2.1 2.4
0
Longitudinal Cross Ssection (mm )
1.80 2.10 2.40
60
80
100
120
20
100
120
100
120
0.012 0.01 0.008 0.006 0.004 0.002 0
1.8 2.1 2.4
0
Logitudinal Cross Section (mm)
20
40
60
80
100
Logitudinal Cross Section (mm)
(e) Z-Plastic Strains (Horizontal Plate)
Figure 4.8 Strains.
80
Max. Abs. Z-Plas. Strain vs. Long. Cross Section
1.80 2.10 2.40
80
60
(d) Y-Plastic Strains (Vertical Plate)
Max. Abs. Z-Plas. Strain
Max. Abs. Z-Plas. Strain
0.012 0.01 0.008 0.006 0.004 0.002 0 60
40
Longitudinal Cross Section (mm)
Max. Abs. Z-Plas. Strain vs. Long. Cross Section
40
120
1.8 2.1 2.4
0
(c) Y-Plastic Strains (Horizontal Plate)
20
100
0.012 0.01 0.008 0.006 0.004 0.002 0
Longitudinal Cross Section (mm)
0
80
Max. Abs. Y-Plas. Strain vs. Long. Cross Section
Max. Abs. Y-Plas. Strain
Max. Abs. Y-Plas. Strain
0.012 0.01 0.008 0.006 0.004 0.002 0 40
60
(b) X-Plastic Strains (Vertical Plate)
Max. Abs. Y-Plas. Strain vs. Long. Cross Section
20
40
Longitudinal Cross Ssection (mm )
(a) X-Plastic Strains (Horizontal Plate)
0
20
(f) Z-Plastic Strains (Vertical Plate)
Graphs Illustrate the Effects of Varying Welding Speed on Plastic
55
120
4.4
Effects of Restraints
4.4.1
Introduction
To investigate the effect of the welding restraint on the responses, the finite element models with three types of restraints were built by considering medium plate curvature without a gap, medium heat input, and medium weld speed as indicated in Table 4.3. Low, medium, and high restraint sets are shown in Figure 4.9(a), 4.9(b), 4.9(c), respectively. Table 4.3
Three Types of Restraints Used for FEA.
LOW Set #1 Constraint at 3 nodes to avoid free body motion
MEDIUM Set #2 Constraint at 3 nodes on top and bottom surfaces of each plate, all degree of freedom
56
HIGH Set #3 Constraint at all nodes located along the arc length, all degree of freedom
(a)
(b)
Figure 4.9 Three restraint sets used for FEA. (a)- Restraint #1; (b)- Restraint #2; (c)- Restraint #3.
4.4.2
Analysis of Results
Restraints also have a significant effect on the weld responses. The model with the lowest restraint set tends to have a larger deformation, but lower stresses and strains as shown in Figure 4.10 and Figure 4.11, respectively. For example, changing from restraint #1 to restraint #2 and restraint #2 to restraint #3 causes an increase of 81 % and 47 % in Y-displacement, respectively.
57
From the graphs below, the effects of restraint #2 and restraint #3 were almost negligible. Three nodes clamping as described in restraint #2 gave almost the same response as clamping the whole set of nodes from one end to another end. Based on the graphs also, the largest x-displacement occurred at the far end from the weld line on horizontal and vertical plates with the lowest restraint (restraint #1). This response should be expected since no constraint was set at the edges of the plates. The stress decreases as the distance from the weld line increases towards the edge because of less temperature gradient.
58
Max. Abs. X-Displacement vs Long. Cross Section
0.6 0.5 0.4 0.3 0.2 0.1 0
1 2 3
0
20
40
60
80
100
Max. Abs. X-Disp. (m m )
Max. Abs. X-Disp. (m m)
Max. Abs. X-Displacement vs Long. Cross Section
0.6 0.5 0.4 0.3 0.2 0.1 0
120
1 2 3
0
20
Longitudinal Cross Section (m m )
(a) X-Displacement (Horizontal Plate)
2 3
60
80
100
Max. Abs. Y-Disp. (mm )
Max. Abs. Y-Disp. (m m)
1
40
120
2 3
20
Max. Abs Z-Disp. (mm )
Max. Abs Z-Disp. (mm )
2 3
100
100
120
0.6 0.5 0.4 0.3 0.2 0.1 0
120
1 2 3
0
20
Longitudinal Cross Section (m m)
40
60
80
100
120
Longitudinal Cross Section (m m)
(e) Z-Displacement (Horizontal Plate)
(f) Z-Displacement (Vertical Plate)
Max. USUM vs Long. Cross Section
Max. USUM vs Long. Cross Section
0.8
0.8
0.6
1 2 3
0.4 0.2 0
Max. USUM (m m )
Max. USUM (m m )
80
Max. Abs. Z-Displacement vs Long. Cross Section
1
80
60
(d) Y-Displacement (Vertical Plate)
0.6 0.5 0.4 0.3 0.2 0.1 0 60
40
Longitudinal Cross Section (m m)
Max. Abs. Z-Displacement vs Long. Cross Section
40
120
1
0
(c) Y-Displacement (Horizontal Plate)
20
100
0.6 0.5 0.4 0.3 0.2 0.1 0
Longitudinal Cross Section (mm )
0
80
Max. Abs. Y-Displacement vs Long. Cross Section
0.6 0.5 0.4 0.3 0.2 0.1 0 20
60
(b) X-Displacement (Vertical Plate)
Max. Abs. Y-Displacement vs Long. Cross Section
0
40
Longitudinal Cross Section (m m )
0.6
1 2 3
0.4 0.2 0
0
20
40
60
80
100
120
0
Longitudinal Cross Section (m m )
40
60
80
100
Longitudinal Cross Section (m m )
(g) USUM (Horizontal Plate)
Figure 4.10
20
(h) USUM (Vertical Plate)
Graphs Illustrate the Effects of Varying Restraint on Displacements.
59
120
Max. Abs. X-Stress vs Long. Cross Section
350 300 250 200 150 100 50 0
1 2 3
0
20
40
60
80
100
Max. Abs. X-Stress (MPa)
Max. Abs. X-Stress (MPa)
Max. Abs. X-Stress vs Long. Cross Section
350 300 250 200 150 100 50 0
120
1 2 3
0
20
Longitudinal Cross Section (m m )
(a) X-Stresses (Horizontal Plate)
2 3
60
80
100
Max. Abs.Y-Stress (MPa)
Max. Abs. Y-Stress (MPa)
1
40
2 3
20
100
Max. Abs. Z-Stress (MPa)
Max. Abs. Z-Stress (MPa)
2 3
120
1 2 3
0
20
2 3
100
80
100
120
350 300 250 200 150 100 50 0
1 2 3
0
120
20
40
60
80
100
Longitudinal Cross Section (m m )
Longitudinal Cross section (m m )
(g) Von Mises Stress (Horizontal Plate)
Figure 4.11
Max. Von Mises Stress (MPa)
Max. Von Mises Stress (MPa)
1
80
60
Max. Von Mises Stress vs Long. Cross Section
350 300 250 200 150 100 50 0 60
40
(f) Z-Stresses (Vertical Plate)
Max. Von Mises Stress vs Long. Cross Section
40
120
Longitudinal Cross Section (mm )
(e) Z-Stresses (Horizontal Plate)
20
100
350 300 250 200 150 100 50 0
Longitudinal Cross Section (mm )
0
80
Max. Abs. Z-Stress vs Long. Cross Section
1
80
60
(d) Y-Stresses (Vertical Plate)
350 300 250 200 150 100 50 0 60
40
Longitudinal Cross Section (m m)
Max. Abs. Z-Stress vs Long. Cross Section
40
120
1
0
120
(c) Y-Stresses (Horizontal Plate)
20
100
350 300 250 200 150 100 50 0
Longitudinal Cross Section (mm )
0
80
Max. Abs. Y-Stress vs Long. Cross Section
350 300 250 200 150 100 50 0 20
60
(b) X-Stresses (Vertical Plate)
Max. Abs. Y-Stress vs Long. Cross Section
0
40
Longitudinal Cross Section (m m )
(h) Von Mises Stress(Vertical Plate)
Graphs Illustrate the Effects of Varying Restraint on Stresses.
60
120
Max. X-Elas. Strain vs Long. Cross Section
0.0015 0.001
1
0.0005
2 3
0 0
20
40
60
80
100
Max. Abs. X-Elas. Strain
Max. Abs. X-Elas. Strain
Max. X-Elas. Strain vs Long. Cross Section
0.0015 0.001
1
0.0005
2 3
0
120
0
Longitudinal Cross Section (m m )
60
80
100
120
(b) X-Elastic Strains (Vertical Plate)
Max. Abs. Y-Elas. Strain vs. Long. Cross Section
Max. Abs. Y-Elas. Strain vs. Long. Cross Section
0.0015
0.0015
0.001
1
0.0005
2 3
0
Max. Y-Elas. Strain
Max. Y-Elas. Strain
40
Longitudinal Cross Section (m m )
(a) X-Elastic Strains (Horizontal Plate)
1 2 3
0.001 0.0005 0
0
20
40
60
80
100
120
0
Longitudinal Cross Section (m m )
20
40
60
80
100
120
Longitudinal Cross Section (m m )
(c) Y-Elastic Strains (Horizontal Plate)
(d) Y-Elastic Strains (Vertical Plate)
Max. Z-Elas. Strain vs. Long. Cross Section
Max. Z-Elas. Strain vs. Long. Cross Section
0.0015
0.0015
0.001
1
0.0005
2 3
0
Max. Z-Elas. Strain
Max. Z-Elas. Strain
20
1 2 3
0.001 0.0005 0
0
20
40
60
80
100
120
0
Longitudinal Cross Section (mm )
40
60
80
100
Longitudinal Cross Section (m m)
(e) Z-Elastic Strains (Horizontal Plate)
Figure 4.12
20
(f) Z-Elastic Strains (Vertical Plate)
Graphs Illustrate the Effects of Varying Restraint on Elastic Strains.
61
120
Max. Abs. X-Plas. Strain vs. Long. Cross Section
0.008 0.006 0.004
1 2
0.002
3
0 0
20
40
60
80
100
Max. Abs. X-Plas. Strain
Max. Abs. X-Plas. Strain
Max. Abs. X-Plas. Strain vs. Long. Cross Section
0.008 0.006 0.004
1 2
0.002
3
0
120
0
20
Longitudinal Cross Ssection (m m )
(a) X-Plastic Strains (Horizontal Plate)
0.004
1 2
0.002
3
0 60
80
100
Max. Abs. Y-Plas. Strain
Max. Abs. Y-Plas. Strain
0.006
40
1
0.004
2 3
0.002 0 0
20
0.002
3
0
100
120
0.008 0.006 0.004
1 2
0.002
3
0 0
120
20
40
60
80
100
Logitudinal Cross Section (m m )
Logitudinal Cross Section (m m )
(e) Z-Plastic Strains (Horizontal Plate)
Figure 4.13
Max. Abs. Z-Plas. Strain
Max. Abs. Z-Plas. Strain
0.004
1 2
100
80
Max. Abs. Z-Plas. Strain vs. Long. Cross Section
0.006
80
60
(d) Y-Plastic Strains (Vertical Plate)
0.008
60
40
Longitudinal Cross Section (m m )
Max. Abs. Z-Plas. Strain vs. Long. Cross Section
40
120
0.006
120
(c) Y-Plastic Strains (Horizontal Plate)
20
100
0.008
Longitudinal Cross Section (m m )
0
80
Max. Abs. Y-Plas. Strain vs. Long. Cross Section
0.008
20
60
(b) X-Plastic Strains (Vertical Plate)
Max. Abs. Y-Plas. Strain vs. Long. Cross Section
0
40
Longitudinal Cross Ssection (m m )
(f) Z-Plastic Strains (Vertical Plate)
Graphs Illustrate the Effects of Varying Restraint on Plastic Strains.
62
120
4.5
Effects of Plate Curvature without a Gap
4.5.1
Introduction
In this study, three curved base plates were modeled without a gap by considering the welding parameter combination of medium heat input, medium welding speed, and medium welding restraint. Table 4.4 shows the three types of curvature used to investigate the effects of plate curvature without a gap on the responses. Figure 4.14 illustrates the finite element mesh of curved plate without a gap. Table 4.4
Three Types of Curvature without Gap.
LOW
MEDIUM
HIGH
0.0000
0.0025 mm-1
0.0067 mm-1
Base Plate Weld Material No Gap
(b) 2-D Drawing
(a) Mesh Figure 4.14 (a) Illustration of a Finite Element Mesh of Curved Plate without Gap; (b) 2-D Schematic Drawing of Corner Joint without Gap.
63
4.5.2
Analysis of Results
Curvature is another important parameter that has an effect on weld responses. Based on the graphs shown in Figures 4.15 – 4.18, horizontal and vertical plates show a different behavior. The horizontal plate tends to have a linear relationship between the curvatures and the responses. However, the opposite behavior is observed on the vertical plate because of complex geometry; curve in x and z directions. From the graphs of the horizontal plate, when the curvature is increased, the responses; displacements, strains and stresses are also increased.
An increase 62.5 % of curvature, for instance, results an
increase of 161 % and 32 % in Y-displacement and X-stress, respectively.
64
0.14 0.12 0.1 0.08 0.06 0.04 0.02 0
Max. Abs. X-Displacement vs Long. Cross Section
0.0067 0.0025 0
0
20
40
60
80
100
Max. Abs. X-Disp. (mm)
Max. Abs. X-Disp. (mm)
Max. Abs. X-Displacement vs Long. Cross Section
0.14 0.12 0.1 0.08 0.06 0.04 0.02 0
120
0.0067 0.0025 0
0
20
Longitudinal Cross Section (mm)
(a) X-Displacement (Horizontal Plate)
0.0067 0.0025 0
40
60
80
100
120
0.1
0.0067 0.0025 0
0.05 0
120
0
20
40
60
80
100
120
Longitudinal Cross Section (mm)
(c) Y-Displacement (Horizontal Plate)
(d) Y-Displacement (Vertical Plate)
Max. Abs. Z-Displacement vs Long. Cross Section
Max. Abs. Z-Displacement vs Long. Cross Section
0.15
0.1
0.0067 0.0025 0
0.05
Max. Abs Z-Disp. (mm)
0.15 Max. Abs Z-Disp. (mm)
100
0.15
Longitudinal Cross Section (mm)
0
0.1
0.0067 0.0025 0
0.05 0
0
20
40
60
80
100
120
0
20
Longitudinal Cross Section (mm)
40
60
80
100
120
Longitudinal Cross Section (mm)
(e) Z-Displacement (Horizontal Plate)
(f) Z-Displacement (Vertical Plate) Max. USUM vs Long. Cross Section
Max. USUM vs Long. Cross Section
0.15
0.1
0.0067 0.0025 0
0.05
Max. USUM (mm)
0.15 Max. USUM (mm)
80
Max. Abs. Y-Displacement vs Long. Cross Section
Max. Abs. Y-Disp. (mm)
Max. Abs. Y-Disp. (mm)
0.14 0.12 0.1 0.08 0.06 0.04 0.02 0 20
60
(b) X-Displacement (Vertical Plate)
Max. Abs. Y-Displacement vs Long. Cross Section
0
40
Longitudinal Cross Section (mm)
0.1
0.0067 0.0025 0
0.05 0
0 0
20
40
60
80
100
0
120
20
40
60
80
100
120
Longitudinal Cross Section (mm)
Longitudinal Cross Section (mm)
(g) USUM (Horizontal Plate)
(h) USUM (Vertical Plate)
Figure 4.15 Graphs Illustrate the Effects of Varying Plate Curvature without Gap on Displacements. 65
350 300 250 200 150 100 50 0
Max. Abs. X-Stress vs Long. Cross Section
0.0067 0.0025 0
0
20
40
60
80
100
Max. Abs. X-Stress (MPa)
Max. Abs. X-Stress (MPa)
Max. Abs. X-Stress vs Long. Cross Section
350 300 250 200 150 100 50 0
120
0.0067 0.0025 0
0
20
Longitudinal Cross Section (mm)
(a) X-Stress (Horizontal Plate)
0.0067 0.0025 0
40
60
80
100
20
100
20
100
120
Max. Abs. Z-Stress (MPa)
Max. Abs. Z-Stress (MPa)
Max. Von Mises Stress(MPa)
Max. Von Mises Stress (MPa)
100
120
350 300 250 200 150 100 50 0
0.0067 0.0025 0
0
Longitudinal Cross Section (mm)
20
40
60
80
100
120
Longitudinal Cross Section (mm)
(g) Von Mises Stress (Horizontal Plate) Figure 4.16 on Stresses.
80
Max. Von Mises Stress vs Long. Cross Section
0.0067 0.0025 0
80
60
(f) Z-Stress (Vertical Plate)
350 300 250 200 150 100 50 0 60
40
Longitudinal Cross Section (mm)
Max. Von Mises Stress vs Long. Cross Section
40
120
0.0067 0.0025 0
0
120
(e) Z-Stress (Horizontal Plate)
20
100
350 300 250 200 150 100 50 0
Longitudinal Cross Section (mm)
0
80
Max. Abs. Z-Stress vs Long. Cross Section
0.0067 0.0025 0
80
60
(d) Y-Stress (Vertical Plate)
350 300 250 200 150 100 50 0 60
40
Longitudinal Cross Section (mm)
Max. Abs. Z-Stress vs Long. Cross Section
40
120
0.0067 0.0025 0
0
120
(c) Y-Stress (Horizontal Plate)
20
100
350 300 250 200 150 100 50 0
Longitudinal Cross Section (mm)
0
80
Max. Abs. Y-Stress vs Long. Cross Section
Max. Abs.Y-Stress (MPa)
Max. Abs. Y-Stress (MPa)
350 300 250 200 150 100 50 0 20
60
(b) X-Stress (Vertical Plate)
Max. Abs. Y-Stress vs Long. Cross Section
0
40
Longitudinal Cross Section (mm)
(h) Von Mises Stress(Vertical Plate)
Graphs Illustrate the Effects of Varying Plate Curvature without Gap
66
Max. X-Elas. Strain vs Long. Cross Section
0.0015 0.001
0.0067 0.0025 0
0.0005 0 0
20
40
60
80
100
Max. Abs. X-Elas. Strain
Max. Abs. X-Elas. Strain
Max. X-Elas. Strain vs Long. Cross Section
0.0015 0.001
0.0067 0.0025 0
0.0005 0
120
0
Longitudinal Cross Section (mm)
60
80
100
120
(b) X-Elastic Strains (Vertical Plate)
Max. Abs. Y-Elas. Strain vs. Long. Cross Section
Max. Abs. Y-Elas. Strain vs. Long. Cross Section
0.0015
0.0015
0.001
0.0067 0.0025 0
0.0005
Max. Y-Elas. Strain
Max. Y-Elas. Strain
40
Longitudinal Cross Section (mm)
(a) X-Elastic Strains (Horizontal Plate)
0
0.001
0.0067 0.0025 0
0.0005 0
0
20
40
60
80
100
120
0
Longitudinal Cross Section (mm)
20
40
60
80
100
120
Longitudinal Cross Section (mm)
(c) Y-Elastic Strains (Horizontal Plate)
(d) Y-Elastic Strains (Vertical Plate)
Max. Z-Elas. Strain vs. Long. Cross Section
Max. Z-Elas. Strain vs. Long. Cross Section
0.0015
0.001
0.0067 0.0025 0
0.0005 0
Max. Z-Elas. Strain
0.0015 Max. Z-Elas. Strain
20
0.001
0.0067 0.0025 0
0.0005 0
0
20
40
60
80
100
120
0
Longitudinal Cross Section (mm)
20
40
60
80
100
120
Longitudinal Cross Section (mm)
(e) Z-Elastic Strains (Horizontal Plate)
(f) Z-Elastic Strains (Vertical Plate)
Figure 4.17 Graphs Illustrate the Effects of Varying Plate Curvature without Gap on Elastic Strains.
67
Max. Abs. X-Plas. Strain vs. Long. Cross Section
0.01 0.008 0.0067 0.0025 0
0.006 0.004 0.002 0 0
20
40
60
80
100
Max. Abs. X-Plas. Strain
Max. Abs. X-Plas. Strain
Max. Abs. X-Plas. Strain vs. Long. Cross Section
0.01 0.008 0.0067 0.0025 0
0.006 0.004 0.002 0
120
0
20
Longitudinal Cross Ssection (mm)
(a) X-Plastic Strains (Horizontal Plate)
0.0067 0.0025 0
0.006 0.004 0.002 0 60
80
100
Max. Abs. Y-Plas. Strain
Max. Abs. Y-Plas. Strain
0.01
40
0.0067 0.0025 0
0.006 0.004 0.002 0 0
20
0.004 0.002 0 120
Max. Abs. Z-Plas. Strain
Max. Abs. Z-Plas. Strain
0.0067 0.0025 0
0.006
100
80
100
120
Max. Abs. Z-Plas. Strain vs. Long. Cross Section
0.01
80
60
(d) Y-Plastic Strains (Vertical Plate)
0.008
60
40
Longitudinal Cross Section (mm)
Max. Abs. Z-Plas. Strain vs. Long. Cross Section
40
120
0.01
120
(c) Y-Plastic Strains (Horizontal Plate)
20
100
0.008
Longitudinal Cross Section (mm)
0
80
Max. Abs. Y-Plas. Strain vs. Long. Cross Section
0.008
20
60
(b) X-Plastic Strains (Vertical Plate)
Max. Abs. Y-Plas. Strain vs. Long. Cross Section
0
40
Longitudinal Cross Ssection (mm)
0.01 0.008 0.0067 0.0025 0
0.006 0.004 0.002 0 0
Logitudinal Cross Section (mm)
20
40
60
80
100
120
Logitudinal Cross Section (mm)
(e) Z-Plastic Strains (Horizontal Plate)
(f) Z-Plastic Strains (Vertical Plate)
Figure 4.18 Graphs Illustrate the Effects of Varying Plate Curvature without Gap on Plastic Strains.
68
4.6
Effects of Plate Curvature with a Gap
4.6.1
Introduction
So far, all the analyses were conducted using the finite element models without a gap. In other words, the horizontal and vertical base plates were touching with each other. To study the effects of the plate curvature with a gap, finite element model was built with a gap between the two plates. The remaining parameters were kept constant at the medium-range values. Table 4.5 shows the same range of curvature used to evaluate the effect of curved plate with a gap on the response. Figure 4.19 depicts the finite element mesh of curved plate with a gap. Table 4.5
Three Types of Curvature with a Gap.
LOW
MEDIUM
HIGH
0.0000
0.0025 mm-1
0.0067 mm-1
Base Plate Weld Material
Gap
(b) 2-D Drawing
(a) Mesh Figure 4.19 (a) Illustration of a Finite Element Mesh of Curved Plate Model with a Gap; (b) 2-D Schematic Drawing of Corner Joint with a Gap.
69
4.6.2
Analysis of Results
The thermo-mechanical response of the curved base plate with a gap has the same effect as curved base plate without a gap. The results are shown in Figures 4.20 – 4.23. Based on the graphs of the horizontal plate, the largest curvature gives the largest displacements, strains, and stresses while the lowest curvature (straight plate) gives the lowest responses magnitude. Moreover, the curvature of the horizontal plate has more significant effect on the Y-displacement as compared to other directional displacements. As discussed in 4.5.2, the relationships between the curvature and the responses in the vertical plate are difficult to relate. Therefore, no general relationships are drawn for the vertical plate.
70
0.12 0.1 0.08 0.06 0.04 0.02 0
Max. Abs. X-Displacement vs Long. Cross Section
0.0067 0.0025 0
0
20
40
60
80
100
Max. Abs. X-Disp. (mm)
Max. Abs. X-Disp. (mm)
Max. Abs. X-Displacement vs Long. Cross Section
0.12 0.1 0.08 0.06 0.04 0.02 0
120
0.0067 0.0025 0
0
Longitudinal Cross Section (mm)
0.0067 0.0025 0
60
80
100
20
100
120
20
100
80
100
120
Max. USUM vs Long. Cross Section
0.0067 0.0025 0
80
60
(f) Z-Displacement (Vertical Plate)
Max. USUM (mm)
Max. USUM (mm)
0.14 0.12 0.1 0.08 0.06 0.04 0.02 0 60
40
Longitudinal Cross Section (mm)
Max. USUM vs Long. Cross Section
40
120
0.0067 0.0025 0
0
(e) Z-Displacement (Horizontal Plate)
20
100
0.12 0.1 0.08 0.06 0.04 0.02 0
Longitudinal Cross Section (mm)
0
80
Max. Abs. Z-Displacement vs Long. Cross Section
0.0067 0.0025 0
80
60
(d) Y-Displacement (Vertical Plate)
Max. Abs Z-Disp. (mm)
Max. Abs Z-Disp. (mm)
0.12 0.1 0.08 0.06 0.04 0.02 0 60
40
Longitudinal Cross Section (mm)
Max. Abs. Z-Displacement vs Long. Cross Section
40
120
0.0067 0.0025 0
0
120
(c) Y-Displacement (Horizontal Plate)
20
100
0.12 0.1 0.08 0.06 0.04 0.02 0
Longitudinal Cross Section (mm)
0
80
Max. Abs. Y-Displacement vs Long. Cross Section
Max. Abs. Y-Disp. (mm)
Max. Abs. Y-Disp. (mm)
0.12 0.1 0.08 0.06 0.04 0.02 0 40
60
(b) X-Displacement (Vertical Plate)
Max. Abs. Y-Displacement vs Long. Cross Section
20
40
Longitudinal Cross Section (mm)
(a) X-Displacement (Horizontal Plate)
0
20
0.14 0.12 0.1 0.08 0.06 0.04 0.02 0
0.0067 0.0025 0
0
120
20
40
60
80
100
120
Longitudinal Cross Section (mm)
Longitudinal Cross Section (mm)
(g) USUM (Horizontal Plate)
(h) USUM (Vertical Plate)
Figure 4.20 Graphs Illustrate the Effects of Varying Plate Curvature with a Gap on Displacements. 71
350 300 250 200 150 100 50 0
Max. Abs. X-Stress vs Long. Cross Section
0.0067 0.0025 0
0
20
40
60
80
100
Max. Abs. X-Stress (MPa)
Max. Abs X-Stress (MPa)
Max. Abs. X-Stress vs Long. Cross Section
350 300 250 200 150 100 50 0
120
0.0067 0.0025 0
0
20
Longitudinal Cross Section (mm)
(a) X-Stress (Horizontal Plate)
0.0067 0.0025 0
40
60
80
100
20
100
20
100
Max. Abs. Z-Stress (MPa)
Max. Abs. Z-Stress (MPa)
Max. Von Mises (MPa)
Max. Von Mises Stress (MPa)
80
100
120
Max. Von Mises Stress vs Long. Cross Section
0.0067 0.0025 0
80
60
(f) Z-Stress (Vertical Plate)
350 300 250 200 150 100 50 0 60
40
Longitudinal Cross Section (mm)
Max. Von Mises Stress vs Long. Cross Section
40
120
0.0067 0.0025 0
0
120
(e) Z-Stress (Horizontal Plate)
20
100
350 300 250 200 150 100 50 0
Longitudinal Cross Section (mm)
0
80
Max. Abs. Z-Stress vs Long. Cross Section
0.0067 0.0025 0
80
60
(d) Y-Stress (Vertical Plate)
350 300 250 200 150 100 50 0 60
40
Longitudinal Cross Section (mm)
Max. Abs. Z-Stress vs Long. Cross Section
40
120
0.0067 0.0025 0
0
120
(c) Y-Stress (Horizontal Plate)
20
100
350 300 250 200 150 100 50 0
Longitudinal Cross Section (mm)
0
80
Max. Abs. Y-Stress vs Long. Cross Section
Max. Abs.Y-Stress (MPa)
Max. Abs. Y-Stress (MPa)
350 300 250 200 150 100 50 0 20
60
(b) X-Stress (Vertical Plate)
Max. Abs. Y-Stress vs Long. Cross Section
0
40
Longitudinal Cross Section (mm)
350 300 250 200 150 100 50 0
0.0067 0.0025 0
0
120
20
40
60
80
100
120
Longitudinal Cross Section (mm)
Longitudinal Cross Section (mm)
(g) Von Mises Stress (Horizontal Plate)
(h) Von Mises Stress(Vertical Plate)
Figure 4.21 Graphs Illustrate the Effects of Varying Plate Curvature without a Gap on Stresses.
72
Max. X-Elas. Strain vs Long. Cross Section
0.0015 0.0067 0.0025 0
0.001 0.0005 0 0
20
40
60
80
Max. Abs. X-Elas. Strain
Max. Abs. X-Elas. Strain
Max. X-Elas. Strain vs Long. Cross Section
0.0015 0.001
0.0067 0.0025 0
0.0005 0 0
100 120
20
(a) X-Elastic Strains (Horizontal Plate)
80
100
120
Max. Abs. Y-Elas. Strain vs. Long. Cross Section
0.0015
0.0015
0.001
0.0067 0.0025 0
0.0005
Max. Y-Elas. Strain
Max. Y-Elas. Strain
60
(b) X-Elastic Strains (Vertical Plate)
Max. Abs. Y-Elas. Strain vs. Long. Cross Section
0
0.001
0.0067 0.0025 0
0.0005 0
0
20
40
60
80
100
120
0
20
Longitudinal Cross Section (mm)
40
60
80
100
120
Longitudinal Cross Section (mm)
(c) Y-Elastic Strains (Horizontal Plate)
(d) Y-Elastic Strains (Vertical Plate)
Max. Z-Elas. Strain vs. Long. Cross Section
Max. Z-Elas. Strain vs. Long. Cross Section
0.0015
0.001
0.0067 0.0025 0
0.0005
Max. Z-Elas. Strain
0.0015 Max. Z-Elas. Strain
40
Longitudinal Cross Section (mm)
Longitudinal Cross Section (mm)
0.001
0.0067 0.0025 0
0.0005 0
0 0
20
40
60
80
100
0
120
20
40
60
80
100
120
Longitudinal Cross Section (mm)
Longitudinal Cross Section (mm)
(e) Z-Elastic Strains (Horizontal Plate)
(f) Z-Elastic Strains (Vertical Plate)
Figure 4.22 Graphs Illustrate the Effects of Varying plate Curvature without a Gap on Elastic Strains.
73
Max. Abs. X-Plas. Strain vs. Long. Cross Section
0.01 0.008 0.0067 0.0025 0
0.006 0.004 0.002 0 0
20
40
60
80
100
Max. Abs. X-Plas. Strain
Max. Abs. X-Plas. Strain
Max. Abs. X-Plas. Strain vs. Long. Cross Section
0.01 0.008 0.0067 0.0025 0
0.006 0.004 0.002 0
120
0
Longitudinal Cross Ssection (mm)
0.0067 0.0025 0
0.006 0.004 0.002 0 80
100
Max. Abs. Y-Plas. Strain
Max. Abs. Y-Plas. Strain
0.01
60
0.0067 0.0025 0
0.006 0.004 0.002 0 0
0.004 0.002 0 120
Max. Abs. Z-Plas. Strain
Max. Abs. Z-Plas. Strain
0.0067 0.0025 0
0.006
100
60
80
100
120
Max. Abs. Z-Plas. Strain vs. Long. Cross Section
0.01
80
40
(d) Y-Plastic Strains (Vertical Plate)
0.008
60
20
Longitudinal Cross Section (mm)
Max. Abs. Z-Plas. Strain vs. Long. Cross Section
40
120
0.01
120
(c) Y-Plastic Strains (Horizontal Plate)
20
100
0.008
Longitudinal Cross Section (mm)
0
80
Max. Abs. Y-Plas. Strain vs. Long. Cross Section
0.008
40
60
(b) X-Plastic Strains (Vertical Plate)
Max. Abs. Y-Plas. Strain vs. Long. Cross Section
20
40
Longitudinal Cross Ssection (mm)
(a) X-Plastic Strains (Horizontal Plate)
0
20
0.01 0.008 0.0067 0.0025 0
0.006 0.004 0.002 0 0
Logitudinal Cross Section (mm)
20
40
60
80
100
120
Logitudinal Cross Section (mm)
(e) Z-Plastic Strains (Horizontal Plate)
(f) Z-Plastic Strains (Vertical Plate)
Figure 4.23 Graphs Illustrate the Effects of Varying Plate Curvature without a Gap on Plastic Strains.
74
4.7
Comparison of Using and Not Using a Gap between Plates
4.7.1
Introduction
In addition to the five cases, the responses of the finite element model (FEM) with a gap and without a gap were compared, holding the remaining parameters constant at the medium-range values. Figure 4.24 shows corner-joint welding with and without the presence of a gap.
4.7.2
Analysis of Results
The comparison between gap and no gap results does not seem to indicate that the use of a gap produces a significant effect on the weld response as shown in Figures 4.25 – 4.28. The plots of both parameters showed almost identical curves on every response. The presence of gap, however, has an effect on Y-displacement. The model without gap makes Y-displacement a little larger by 15 %. The presence of gap also affect the stresses, elastic and plastic strains by 14 %, 15 %, and 12 %, respectively. The differences were observed to occur in the HAZ.
(a)
(b)
Figure 4.24 Mesh Generation of Weld Material and Plates. (a) Plates without a Gap; (b) Plates with a Gap.
75
0.14 0.12 0.1 0.08 0.06 0.04 0.02 0
Max. Abs. Y-Displacement vs Long. Cross Section
Gap No Gap
0
20
40
60
80
100
Max. Abs. Y-Disp. (mm)
Max. Abs. X-Disp. (mm)
Max. Abs. X-Displacement vs Long. Cross Section
0.14 0.12 0.1 0.08 0.06 0.04 0.02 0
120
GAP NO GAP
0
20
Longitudinal Cross Section (mm)
(a) X-Displacement
GAP NO GAP
40
60
80
100
120
Max. USUM vs Long. Cross Section
80
100
120
Max. USUM (mm)
Max. Abs Z-Disp. (mm)
0.14 0.12 0.1 0.08 0.06 0.04 0.02 0 20
60
(b) Y-Displacement
Max. Abs. Z-Displacement vs Long. Cross Section
0
40
Longitudinal Cross Section (mm)
0.14 0.12 0.1 0.08 0.06 0.04 0.02 0
GAP NO GAP
0
20
Longitudinal Cross Section (mm)
40
60
80
Longitudinal Cross Section (mm)
(c) Z-Displacement
(d) USUM
Figure 4.25 Graphs Illustrate the Effects of with and without a Gap on Displacements.
76
100
120
350 300 250 200 150 100 50 0
Max. Abs. Y-Stress vs Long. Cross Section
GAP NO GAP
0
20
40
60
80
100
Max. Abs.Y-Stress (MPa)
Max. Abs. X-Stress (MPa)
Max. Abs. X-Stress vs Long. Cross Section
350 300 250 200 150 100 50 0
GAP NO GAP
0
120
(a) X - Stress
GAP NO GAP
100
80
100
120
350 300 250 200 150 100 50 0
GAP NO GAP
0
150
50
100
Longitudinal Cross Section (mm)
Longitudinal Cross Section (mm)
(c) Z - Stress Figure 4.26
60
Max. Von Mises Stress vs Long. Cross Section Max. Von Mises Stress (MPa)
Max. Abs. Z-Stress (MPa)
350 300 250 200 150 100 50 0 50
40
(b) Y- Stress
Max. Abs. Z-Stress vs Long. Cross Section
0
20
Longitudinal Cross Section (mm)
Longitudinal Cross Section (mm)
(d) Von Mises Stress
Graphs Illustrate the Effects of with and without a Gap on Stresses.
77
150
Max. Abs. Y-Elas. Strain vs. Long. Cross Section
0.002 Max. Y-Elas. Strain
0.002 0.0015 GAP
0.001
NO GAP
0.0005
0.0015 GAP
0.001
NO GAP
0.0005
0
0 0
20
40
60
80
100
120
0
20
Longitudinal Cross Section (mm)
40
60
80
100
120
Longitudinal Cross Section (mm)
(a) X-Elastic Strain
(b) Y-Elastic Strain Max. Z-Elas. Strain vs. Long. Cross Section
0.002 Max. Z-Elas. Strain
Max. Abs. X-Elas. Strain
Max. X-Elas. Strain vs Long. Cross Section
0.0015 GAP
0.001
NO GAP
0.0005 0 0
20
40
60
80
100
120
Longitudinal Cross Section (mm)
(c) Z- Elastic Strain Figure 4.27 Strains.
Graphs Illustrate the Effects of with and without a Gap on Elastic
78
Max. Abs. Y-Plas. Strain vs. Long. Cross Section
0.005
Max. Abs. Y-Plas. Strain
Max. Abs. X-Plas. Strain
Max. Abs. X-Plas. Strain vs. Long. Cross Section
0.004 0.003
GAP NO GAP
0.002 0.001 0 0
20
40
60
80
100
0.005 0.004 0.003
GAP NO GAP
0.002 0.001 0 0
120
20
40
60
80
100
Longitudinal Cross Section (mm)
Longitudinal Cross Section (mm)
(a) X-Plastic Strain
(b) Y-Plastic Strain
Max. Abs. Z-Plas. Strain
Max. Abs. Z-Plas. Strain vs. Long. Cross Section
0.005 0.004 0.003
GAP NO GAP
0.002 0.001 0 0
20
40
60
80
100
120
Longitudinal Cross Section (mm)
(c) Z- Plastic Strain Figure 4.28 Strains.
Graphs Illustrate the Effects of with and without a Gap on Plastic
79
120
Chapter 5: 5.1
Discussions and Conclusions
Discussions
In this thesis, a selected set of twelve cases was studied to assess the impact of some parameter variations on the response. These twelve cases were sufficient to evaluate the effect of the parameters on the responses since they represent low, medium, and high ranges. If the study were to identify the trends of varying the parameters, a full sensitivity analysis is required which means 162 cases of five different parameters will be evaluated. In actual welding practice, large structural steel plates normally have residual stresses prior to welding. For simplicity of finite element analyses, therefore, the steel plates are assumed to be in the state of stress free and perfectly undeformed. Therefore, the results obtained from the finite element simulations did not represent the actual outcome. The finite element simulation has limitations as far as the end shrinkages are concerned. Since the analysis is based on the assumption of a quasi-stationary state, the shrinkage effect at the start and end of the weld cannot be estimated. One way to overcome this limitation is to refine the mesh at the start and end of the weld. The computational efforts, however, will increase significantly.
80
5.2
Conclusions
After completed this research, several conclusion can be drawn from the results of this work. First, a complex welding process phenomena can be simulated using a commercial finite element package, namely ANSYS®. A special feature of “birth and death” element has been used to simulate the deposition of weld material. Second, based on the simulation results, distortion or shrinkage of the weldment can be predicted numerically. Thus, the experimental analysis, which might be costly can be avoided. Third, heat input, welding speed, restraint, and curvature have a significant impact on the weld responses. The conclusion that can be drawn from the simulation results are as follows: i)
When the heat input increases, the responses such as displacements, stresses, and strains also increase. An increase of 25 % of heat input results in a significant increase in the Y-displacement (78 %), X-stress (36 %), and X-elastic strain (36 %).
ii)
On the other hand, the opposite response behavior is observed when the welding speed increases. An increase of 14.28 % of the welding speed, for instance, results a decrease of 20 % of Y-displacement, 32 % of Xstress and, 23 % of X-elastic strain.
iii)
The model with the lowest restraint set tends to have larger deformations, but lower stresses and strains. For example, changing from restraint #1 to restraint #2 and restraint #2 to restraint #3 causes an increase of 81 % and 47 % in Y-displacement, respectively.
iv)
The larger the plate curvature, the larger the displacements, stresses and strains. An increase 62.5 % of curvature, for instance, results an increase of 161 % and 32 % in Y-displacement and X-stress, respectively.
81
Fourth, the effect of the gap in the weldment, however, is very small in this study and thus can be ignored. The plots of models with and without a gap show almost identical curves on every response. Fifth, relationships between the curvature and the responses in the vertical plate are difficult to relate. Therefore, no general relationships are drawn for the vertical plate. Sixth, the critical longitudinal cross section, which has largest residual stress and maximum displacements are located about 5 mm away from the weld line. This conclusion is in good agreement with Friedman (1975) as reported in his paper.
82
Bibliography 1) ANSYS® Users Manual, Revision 5.7, 2001. 2) American Welding Society, Structural Welding Code Steel-Steel, 1996. 3) Bonifaz E., “Finite Element Analysis of Heat Flow in Single-Pass Arc Welds”, Welding Research Supplement, May 2000, p 121-125. 4) Brown S., and Song H., “Implications of Three-Dimensional Numerical Simulations of Welding of Large Structures”, Welding Journal, Feb. 1992, p 5562. 5) Brown S., and Song H., “Finite Element Simulation of Welding of Large Structure”, Journal of Engineering for Industry, vol. 144, 1992, p 441-451. 6) Frewin M., and Scott D., “Finite Element Model of Pulsed Laser Welding”, Welding Research Supplement, Jan. 1999, p 15-22. 7) Friedman E., “Thermomechanical Analysis of the Welding Process Using the Finite Element Method”, Transaction of the ASME, 1975, p 206-213. 8) Goldak J., Bibby M., Moore J., House R., and Patel B., “Computer Modeling of Heat Flow in Welds”, Metallurgical Transactions B, vol. 17B, 1986, p 587-600. 9) Goldak J., Chakravarti A., and Bibby M., “A New Finite Element Model for Welding Heat Sources”, Metallurgical Transactions B, vol. 15B, 1984, p 229-305. 10) Harwig D., Longenecker D., and Cruz J., “Effects of Welding Parameters and Electrode Atmospheric Exposure on the Diffusible Hydrogen Content of Gas Shielded Flux Cored Arc Welds”, Welding Research Supplement, Sept. 1999, p 314-321. 11) Jang G., Kim H., and Kang S., “The Effects of Root Opening on Mechanical Properties, Deformation and Residual Stress of Weldments”, Welding Research Supplement, March 2001, p 80-89. 12) Kamala V. and Goldak J., “Error Due to Two Dimensional Approximation in Heat Transfer Analysis of Welds”, Welding Journal, Sept. 1993, p 440-446.
83
13) Komanduri R. and Hou Z., “Thermal Analysis of the Arc Welding Process: Part 1. General Solutions”, Metallurgical and Materials Transactions B, vol. 31B, Dec. 2000, p 1353-1370. 14) Kraus H., “Thermal Finite Element Formulation and Solution Versus Experimental Results for Thin-Plate GTA Welding”, Journal of Heat Transfer, vol. 108, 1986, p 591- 596. 15) Lancaster, J., Metallurgy of Welding, Chapman & Hall, 5th Ed., 1993. 16) The Lincoln Electric Company. The Procedure Handbook of Arc Welding. Twelfth Ed. 1973. 17) Mandal N. and Sundar C., “Analysis of Welding Shrinkage”, Welding Research Supplement, June 1997, p 233-238. 18) Michaleris P. and Debiccari A., “Prediction of Welding Distortion”, Welding Journal, April 1997, p 172-180. 19) Nguyen N., Ohta A., Matsouka K., Suzuki N., and Maeda Y., “Analytical Solutions for Transient Temperature of Semi-Infinite Body Subjected to 3-D Moving Heat Sources”, Welding Journal, Aug. 1999, p 265-274. 20) Okumoto Y., “Analysis of Residual Stress and Deformation Due to Welding”, 17th International Conference on Offshore Mechanics and Artic Engineering, 1998, p 1-7. 21) Puchaicela J., “Control of Distortion of Welded Steel Structures”, Welding Journal, August 1998, p49-52. 22) Rosenthal D., “The Theory of moving Sources of Heat and Its Application to Metal Treatments”, Transactions of A.S.M.E., Nov. 1946, p 849-866. 23) Taylor G., Hughes M., Strusevich N., and Pericleous K., “Finite Volume Methods Applied to the Computational Modeling of Welding Phenomena”, Second International Conference on CFD in the Minerals and Process Industries, Melbourne, Australia, Dec. 1999, p1-6. 24) Tekriwal P. and Mazumder J., “Finite Element Analysis of Three-Dimensional Transient Heat Transfer in GMA Welding”, Welding Research Supplement, July 1988, p150-156.
84
25) Tsai C., Kim D., Jaeger J., Shim Y., Feng Z., and Papritan J., “Design Analysis for Welding of Heavy W Shapes”, Welding Journal, Feb. 2001, p 35-41. 26) Tsai C., Park S., and Cheng W., “Welding Distortion of a Thin Plate Panel Structure”, Welding Research Supplement, May 1999, p156-165. 27) Yeung K. and Thornton P., “Transient Thermal Analysis of Spot Welding Electrodes”, Welding Research Supplement, Jan. 1999, p1-6. 28) Weisman C, American Welding Society, Welding Handbook: Fundamentals of Welding, Seventh Ed. vol. 1. 1976.
85
Appendix A
Appendix A
Formulas for USUM and von Mises Stress
A.1
USUM USUM =
A.2
U
2 X
2
2
+UY +U Z
Von Mises Stress Von Mises Stress, VM =
[
1 (σ 1 − σ 2 )2 + (σ 2 − σ 3 )2 + (σ 3 − σ 1 )2 2
86
]
Appendix B
Appendix B
Line Heat Source
Assumptions: •
Heat source moving parallel to the x- axis at velocity u.
•
u is constant.
•
Thermal conductivity is constant.
The conduction equation is given by; 1 ∂T ∂ 2 T ∂ 2 T ∂ 2 T = 2 + 2 + 2 α ∂t ∂t ∂y ∂z
(B-1)
Consider new coordinate system, T (t , x, y, z ) → T (t ' ,ξ , y, z )
ξ = x − ut t' = t Partial derivatives; ∂T ∂T ∂ξ ∂T ∂t ' . . = + ∂x ∂ξ ∂x ∂t ' ∂x
∂ 2T ∂ 2T = ∂x 2 ∂ξ 2
Now,
2
∂T ∂ξ + ∂ξ ∂x
,here
∂ 2ξ 2 ∂x
∂t ' =0 ∂x
∂ 2ξ ,but =0 ∂x 2
∂ 2T ∂ 2T = ∂x 2 ∂ξ 2 ∂T ∂T ∂ξ ∂T ∂t ' . . = + ∂t ∂ξ ∂t ∂t ' ∂t
87
Appendix B
Since
∂t ' ∂ξ = − u and = 1 then, ∂t ∂t
∂T ∂T ∂T = −u + ∂t ∂ξ ∂t ' Replacing Eq. B-1, heat conduction is now: 1 ∂T ∂T ∂ 2 T ∂ 2 T ∂ 2 T − u = + + + α ∂ξ ∂t ' ∂ξ 2 ∂y 2 ∂z 2
Note that, assumption of Quassi steady state,
Then,
∂ 2T ∂ 2T ∂ 2T u ∂T + 2 + 2 =− 2 α ∂ξ ∂ξ ∂y ∂z
Lets, θ = T − T0 and ψ (ξ ) = e
T − T0 = e
−
u ξ 2α
−
(B-2)
∂T =0 ∂t '
(B-3)
u ξ 2α
θ (ξ , y , z )
T − T0 = ϕ (ξ )θ (ξ , y , z ) ∂T ∂ϕ ∂θ = θ (ξ , y , z ) + ϕ (ξ ) (ξ , y , z ) ∂ξ ∂ξ ∂ξ
∂ 2 T ∂ 2ϕ ∂ϕ ∂θ ∂ 2θ ( , , ) 2 . = θ ξ y z = + ϕ ∂ξ ∂ξ ∂ξ 2 ∂ξ 2 ∂ξ 2
88
Appendix B u
∂ϕ u − 2α ξ u =− e = − ϕ (ξ ) 2α 2α ∂ξ
2
2
u
∂ 2ϕ u − 2α ξ u = = e ϕ (ξ ) ∂ξ 2 2α 2α
(B-4)
Substituting into the heat conduction equation (Eq. B-3):
∂ 2θ ∂ 2θ ϕ (ξ ) 2 + 2 ∂z ∂y
2
u ∂ 2θ u u ∂θ u ∂θ + +ϕ = − − ϕ (ξ )θ + 2 − ϕ ϕθ + ϕ 2 α 2α ∂ξ ∂ξ 2α ∂ξ 2α
Collection terms, yields; 2 u ∂θ u u ∂θ ∂ 2θ ∂ 2θ ∂ 2θ u 2 − + 2 + 2 = 2θ − θ+ 2 α ∂ξ 2α α ∂ξ ℑξ ∂y ∂z 2α
2
u ∇ 2θ = θ 2α
(B-5)
Now, assume an infinite body. For an infinite solid, assume a true line heat source that is stationary.
Heat source
Y
ξ
r Note: Assume isotherms.
89
Appendix B Note that, θ = θ ( r ) ≠ θ ( r , φ )
r 2 = ξ 2 + y2
ξ = r cos φ y = r sin φ
θ (ξ , y ) → θ ( r ) 2
1 ∂ 2θ u ∂ 2θ 1 ∂θ + + − θ =0 ∂r 2 r ∂r r 2 ∂z 2 2α
where, term
(B-6)
1 ∂ 2θ =0 r 2 ∂z 2
Boundary conditions: T-T0 = 0
as r→ ∞
(θ → 0) at r = 0,
line heat source, q’ will be; q' = − k 2πr
∂T ∂r
Solving for θ, yields;
θ = C 1 I 0 (ar ) + C 2 K 0 (ar ) where, a =
u 2α
The solution is now becomes, T − T0 = ϕ (ξ )[C 1 I 0 (ar ) + C 2 K 0 (ar )] where term C 1 I 0 (ar ) is zero since r→ ∞
90
(B-7)
Appendix B Now, T − T0 = ϕ (ξ )C 2 K 0 (ar )
lim r →∞
∂T (− 2πrk ) = q' ∂r
∂K (ar ) ∂T ∂ψ ∂ξ = C 2 K 0 (ar ) + C 2ψ (ξ ) 0 ∂r ∂ξ ∂r ∂r ∂T = −ae − aξ ∂r
r2 r 2 − y2
C 2 K 0 (ar ) + C 2 ae − aξ K 1 (ar )
(B-8)
Hence, ∂T q' = − k2π2 = k2π2π−1)− ae −aξ ∂r Term
Then,
r2
− ae −aξ
r 2 − y2
rΤ(v) C 2 K 0 (ar) + C 2 ae −aξ ar r2 − y2 r2
C 2 K 0 (ar ) = 0 as r → ∞
q' = 2πkC 2 ⇒ C 2 =
q' 2πk
(B-9)
The final solution for line heat source, then becomes; u
T − T0 =
q' − 2α ξ ur e K0 2πk 2α
(B-10)
91
Appendix C
Appendix C
Plots of Welding Responses Against Locations Along the Arc Length for Heat Input Variables.
The thermo elasto plastic responses from ANSYS® program has been analyzed using Microsoft Excel® graphs. The responses include directional and total displacements (X, Y, Z directions, and USUM), directional stresses (X, Y, Z directions), von Mises Stress, directional total stains (X, Y, Z directions), directional elastic strains (X, Y, Z directions), and directional plastic strains (X, Y, Z directions). Seven longitudinal cross sections of both plates (horizontal and vertical) at various locations have been considered. The plots below represent the responses versus the locations along the arc length (longitudinal cross section).
92
Appendix C
Y Displacement (mm) vs. Distance Along the Arc Length (mm)
0.1500
0.0400
0.1000
0.0200
0.0500
Displacement (mm)
Displacement (mm)
X Displacement (mm) vs. Distance Along the Arc Length (mm)
900 1200 1500
0.0000 0
50
100
150
200
250
300
-0.0500 -0.1000
-0.0200
0
50
100
150
200
250
300
-0.0400
-0.0800 Distance Along the Arc Length (mm)
Z Displacement (mm) vs. Distance Along the Arc Length (mm)
Displacement Intensity/USUM (mm) vs. Distance Along the Arc Length (mm) 0.2500 Displacement (mm)
0.1500 0.1000 0.0500 0.0000 -0.0500 0
900 1200 1500
-0.0600
Distance Along the Arc Length (mm)
0.2000
Displacement (mm)
0.0000
50
100
150
200
250
300
900 1200 1500
-0.1000 -0.1500
0.2000 0.1500
900 1200 1500
0.1000 0.0500 0.0000
-0.2000
0 Distance Along the Arc Length (mm)
50
100
150
200
250
Distance Along Arc Length (mm)
Displacement plots at the weld line.
93
300
Appendix C
X Stress (MPa) vs. Distance Along the Arc Length (mm)
Y Stress (MPa) vs. Distance Along the Arc Length (mm)
150
50 0
50 0 -50
0
50
100
150
200
250
300
Stress (MPa)
Stress (MPa)
100 900 1200 1500
-100
-50
0
150
200
250
300 900 1200 1500
-100 -150
-250 Distance Along the Arc Length (mm)
Distance Along the Arc Length (mm)
Z Stress (MPa) vs. Distance Along the Arc Length (mm)
Von Mises Stress (MPa) vs. Distance Along the Arc Length (mm)
350
300
300
250 Stress (MPa)
250 Stress (MPa)
100
-200
-150
200 150
900 1200 1500
100 50 0 -50 0
50
50
100
150
200
250
200
900 1200 1500
150 100 50
300
-100
0
-150
0 Distance Along the Arc Length (mm)
50
100
150
200
250
Distance Along the Arc Length (mm)
Stress plots at the weld line.
94
300
Appendix C
X Total Strain vs. Distance Along the Arc Length (mm)
Y Total Strain vs. Distance Along the Arc Length (mm)
0.0040 0.0020 50
100
150
200
250
300
Total Strain
-0.0020 0
900 1200 1500
-0.0040 -0.0060 -0.0080 -0.0100 -0.0120 -0.0140
900 1200 1500 50
100
150
200
250
Distance Along the Arc Length (mm)
Distance Along the Arc Length (mm)
Z Total Strain vs. Distance Along the Arc Length (mm) 0.0140 0.0120 0.0100 0.0080 Total Strain
Total Strain
0.0000
0.0040 0.0035 0.0030 0.0025 0.0020 0.0015 0.0010 0.0005 0.0000 -0.0005 0 -0.0010 -0.0015
0.0060
900 1200 1500
0.0040 0.0020 0.0000 -0.0020 0
50
100
150
200
250
300
-0.0040 -0.0060 Distance Along the Arc Length (mm)
Total-strain plots at the weld line.
95
300
Appendix C
X Elastic Strain vs. Distance Along the Arc Length (mm)
Y Elastic Strain vs. Distance Along the Arc Length (mm)
0.0002
0.0000 -0.0001 0
0.0001
100
150
200
250
300
-0.0002 50
100
150
200
250
300
Elastic Strain
-0.0001 0
900 1200 1500
-0.0002 -0.0003
-0.0003
900 1200 1500
-0.0004 -0.0005
-0.0004
-0.0006
-0.0005
-0.0007
-0.0006
-0.0008 Distance Along the Arc Length (mm)
Distance Along the Arc Length (mm)
Z Elastic Strain vs. Distance Along the Arc Length (mm) 0.0016 0.0014 0.0012 Elastic Strain
Elastic Strain
0.0000
50
0.0010 0.0008
900 1200 1500
0.0006 0.0004 0.0002 0.0000 -0.0002 0
50
100
150
200
250
300
-0.0004 Distance Along the Arc Length (mm)
Elastic-strain plots at the weld line.
96
Appendix C
Y Plastic Strain vs. Distance Along the Arc Length (mm)
4.00E-03
4.00E-03
2.00E-03
3.50E-03
0.00E+00
3.00E-03 50
100
150
200
250
300
Plastic Strain
-2.00E-03 0
900 1200 1500
-4.00E-03 -6.00E-03 -8.00E-03
2.50E-03 2.00E-03
900 1200 1500
1.50E-03 1.00E-03 5.00E-04
-1.00E-02
0.00E+00
-1.20E-02
-5.00E-04 0
-1.40E-02
-1.00E-03 Distance Along the Arc Length (mm)
50
100
1.20E-02 1.00E-02 8.00E-03 6.00E-03 4.00E-03
900 1200 1500
2.00E-03 0.00E+00 -2.00E-03 0
150
200
250
Distance Along the Arc Length (mm)
Z Plastic Strain vs. Distance Along the Arc Length (mm)
Plastic Strain
Plastic Strain
X Plastic Strain vs. Distance Along the Arc Length (mm)
50
100
150
200
250
300
-4.00E-03 -6.00E-03 -8.00E-03 Distance Along the Arc Length (mm)
Plastic-strain plots at the weld line.
97
300
Appendix C
X Displacement (mm) vs. Distance Along the Arc Length (mm)
Y Displacement (mm) vs. Distance Along the Arc Length (mm)
0.0600
0.1500 Displacement (mm)
Displacement (mm)
0.0400 0.0200 0.0000 -0.0200 0
50
100
150
200
250
300
-0.0400
900 1200 1500
-0.0600 -0.0800 -0.1000
0.0500
900 1200 1500
0.0000 0
50
100
150
200
250
300
-0.0500 -0.1000
Distance Along the Arc Length (mm)
Distance Along the Arc Length (mm)
Z Displacement (mm) vs. Distance Along the Arc Length (mm)
Displacement Intensity/USUM (mm) vs. Distance Along the Arc Length (mm)
0.1500
0.1600
0.1000
Displacement (mm)
Displacement (mm)
0.1000
0.0500 0.0000 -0.0500
0
50
100
150
200
250
300
900 1200 1500
-0.1000
0.1400 0.1200 0.1000
900 1200 1500
0.0800 0.0600 0.0400 0.0200 0.0000
-0.1500
0 Distance Along the Arc Length (mm)
50
100
150
200
250
Distance Along Arc Length (mm)
Displacement plots at 5.86 mm away from the weld line.
98
300
Appendix C
X Stress (MPa) vs. Distance Along the Arc Length (mm)
Y Stress (MPa) vs. Distance Along the Arc Length (mm)
150
15 10
50 0 -50
0
50
100
150
200
250
300
Stress (MPa)
Stress (MPa)
100 900 1200 1500
-100
5 0 0
-5
150
200
250
300
-15 Distance Along the Arc Length (mm)
Distance Along the Arc Length (mm)
Z Stress (MPa) vs. Distance Along the Arc Length (mm)
Von Mises Stress (MPa) vs. Distance Along the Arc Length (mm) 300
350 300
250 Stress (MPa)
250 Stress (MPa)
100
-10
-150
200 900 1200 1500
150 100 50 0 -50 0
50
900 1200 1500
200
900 1200 1500
150 100 50
50
100
150
200
250
300
0
-100
0 Distance Along the Arc Length (mm)
50
100
150
200
250
Distance Along the Arc Length (mm)
Stress plots at 5.86 mm away from the weld line.
99
300
Appendix C
X Total Strain vs. Distance Along the Arc Length (mm)
Y Total Strain vs. Distance Along the Arc Length (mm)
0.0010
0.0020
0.0005
0.0015 0
50
100
150
200
250
300
Total Strain
-0.0005
900 1200 1500
-0.0010
0.0010
900 1200 1500
0.0005
-0.0015 0.0000
-0.0020
0
50
100
150
200
250
-0.0005
-0.0025
Distance Along the Arc Length (mm)
Distance Along the Arc Length (mm)
Z Total Strain vs. Distance Along the Arc Length (mm) 0.0020 0.0015 0.0010 Total Strain
Total Strain
0.0000
0.0005 0.0000 -0.0005
0
50
100
150
200
250
300
900 1200 1500
-0.0010 -0.0015 -0.0020 Distance Along the Arc Length (mm)
Total-strain plots at 5.86 mm away from the weld line.
100
300
Appendix C
Y Elastic Strain vs. Distance Along the Arc Length (mm)
0.0006
0.0002
0.0004
0.0001 0.0000 900 1200 1500
0.0000 -0.0002
0
50
100
150
200
250
Elastic Strain
0.0002
300
-0.0004
-0.0001 0
50
100
150
200
250
-0.0002 -0.0003 -0.0004
-0.0006
-0.0005
-0.0008
-0.0006 Distance Along the Arc Length (mm)
Distance Along the Arc Length (mm)
Z Elastic Strain vs. Distance Along the Arc Length (mm) 0.0016 0.0014 0.0012 Elastic Strain
Elastic Strain
X Elastic Strain vs. Distance Along the Arc Length (mm)
0.0010 0.0008
900 1200 1500
0.0006 0.0004 0.0002 0.0000 -0.0002 0
50
100
150
200
250
300
-0.0004 Distance Along the Arc Length (mm)
Elastic-strain plots at 5.86 mm away from the weld line.
101
300
900 1200 1500
Appendix C
X Plastic Strain vs. Distance Along the Arc Length (mm)
Y Plastic Strain vs. Distance Along the Arc Length (mm)
0.001
0.0025
0.0005
0.002 50
100
150
200
250
300
Plastic Strain
-0.0005 0
900 1200 1500
-0.001 -0.0015
0.0015 900 1200 1500
0.001 0.0005
-0.002 0
-0.0025 -0.003
-0.0005
0
Distance Along the Arc Length (mm)
50
100
150
200
0.001 0.0005 0 -0.0005 0
250
Distance Along the Arc Length (mm)
Z Plastic Strain vs. Distance Along the Arc Length (mm)
Plastic Strain
Plastic Strain
0
50
100
150
200
250
-0.001 -0.0015
300
900 1200 1500
-0.002 -0.0025 -0.003 Distance Along the Arc Length (mm)
Plastic-strain plots at 5.86 mm away from the weld line.
102
300
Appendix C X Displacement (mm) vs. Distance Along the Arc Length (mm)
Y Displacement (mm) vs. Distance Along the Arc Length (mm) 0.2000
0.0600 Displacement (mm)
Displacement (mm)
0.0400 0.0200 0.0000 -0.0200 0
100
200
300
400
-0.0400
900 1200 1500
-0.0600 -0.0800 -0.1000
0.1500 0.1000
900 1200 1500
0.0500 0.0000 -0.0500
0
100
200
300
400
-0.1000 Distance Along the Arc Length (mm)
Distance Along the Arc Length (mm)
Z Displacement (mm) vs. Distance Along the Arc Length (mm)
Displacement Intensity/USUM (mm) vs. Distance Along the Arc Length (mm)
0.1500
0.1600
0.0500
Displacement (mm)
Displacement (mm)
0.1400 0.1000 900 1200 1500
0.0000 0
100
200
300
400
0.1200 0.1000
900 1200 1500
0.0800 0.0600 0.0400 0.0200
-0.0500
0.0000 -0.1000
0 Distance Along the Arc Length (mm)
100
200
300
Distance Along Arc Length (mm)
Displacement plots at 14.56 mm away from the weld line.
103
400
Appendix C X Stress (MPa) vs. Distance Along the Arc Length (mm)
Y Stress (MPa) vs. Distance Along the Arc Length (mm)
250 200
100
Stress (MPa)
Stress (MPa)
150 900 1200 1500
50 0 -50 0
100
200
300
400
-100 -150
5 4 3 2 1 0 -1 0 -2 -3 -4 -5
100
Distance Along the Arc Length (mm)
150
250
100
Stress (MPa)
Stress (MPa)
300
900 1200 1500
50 0 100
200
300
400
Von Mises Stress (MPa) vs. Distance Along the Arc Length (mm)
200
0
300
Distance Along the Arc Length (mm)
Z Stress (MPa) vs. Distance Along the Arc Length (mm)
-50
200
900 1200 1500
400
200
900 1200 1500
150 100 50
-100
0
-150
0 Distance Along the Arc Length (mm)
100
200
300
Distance Along the Arc Length (mm)
Stress plots at 14.56 mm away from the weld line.
104
400
Appendix C
X Total Strain vs. Distance Along the Arc Length (mm)
Y Total Strain vs. Distance Along the Arc Length (mm)
0.0012
0.0008
0.0010
0.0006
0.0008
0.0004 900 1200 1500
0.0002 0.0000 -0.0002 0
Total Strain
0.0004
100
200
300
400
900 1200 1500
0.0002 0.0000 -0.0002
-0.0004
0
100
200
300
-0.0004
-0.0006
-0.0006
-0.0008
Distance Along the Arc Length (mm)
Distance Along the Arc Length (mm)
Z Total Strain vs. Distance Along the Arc Length (mm) 0.0006 0.0004 0.0002 Total Strain
Total Strain
0.0006
0.0000 -0.0002 0
100
200
300
-0.0004
400
900 1200 1500
-0.0006 -0.0008 -0.0010 Distance Along the Arc Length (mm)
Total-strain plots at 14.56 mm away from the weld line.
105
400
Appendix C
X Elastic Strain vs. Distance Along the Arc Length (mm)
Y Elastic Strain vs. Distance Along the Arc Length (mm) 0.0002
0.0012 0.0010
0.0001
0.0004
900 1200 1500
0.0002 0.0000 -0.0002 0
Elastic Strain
0.0006
100
200
300
400
-0.0004
0.0000 0
100
200
300
-0.0001 -0.0002 -0.0003
-0.0006 -0.0008
-0.0004 Distance Along the Arc Length (mm)
Distance Along the Arc Length (mm)
Z Elastic Strain vs. Distance Along the Arc Length (mm) 0.0010 0.0008 0.0006 Elastic Strain
Elastic Strain
0.0008
0.0004 0.0002 0.0000 -0.0002 0
100
200
300
400
900 1200 1500
-0.0004 -0.0006 -0.0008 Distance Along the Arc Length (mm)
Elastic-strain plots at 14.56 mm away from the weld line.
106
400
900 1200 1500
Appendix C
X Plastic Strain vs. Distance Along the Arc Length (mm)
Y Plastic Strain vs. Distance Along the Arc Length (mm)
0.00035
0.001
0.0003
0.0008 Plastic Strain
0.0002 0.00015
900 1200 1500
0.0001 0.00005 0 -0.00005 0
100
200
300
0.0006 900 1200 1500
0.0004 0.0002
400
0
-0.0001 -0.00015
-0.0002
0
Distance Along the Arc Length (mm)
100
200
0.0002 0 -0.0002
300
Distance Along the Arc Length (mm)
Z Plastic Strain vs. Distance Along the Arc Length (mm)
Plastic Strain
Plastic Strain
0.00025
0
100
200
300
400 900 1200 1500
-0.0004 -0.0006 -0.0008 -0.001 -0.0012 Distance Along the Arc Length (mm)
Plastic-strain plots at 14.56 mm away from the weld line.
107
400
Appendix C
Y Displacement (mm) vs. Distance Along the Arc Length (mm)
0.0400
0.1500
0.0200
0.1000
0.0000 -0.0200
0
100
200
300
400
-0.0400
Displacement (mm)
Displacement (mm)
X Displacement (mm) vs. Distance Along the Arc Length (mm)
900 1200 1500
-0.0600
900 1200 1500
0.0000 0
100
200
300
400
-0.0500 -0.1000
Distance Along the Arc Length (mm)
Distance Along the Arc Length (mm)
Z Displacement (mm) vs. Distance Along the Arc Length (mm)
Displacement Intensity/USUM (mm) vs. Distance Along the Arc Length (mm)
0.1000
0.1600
0.0800
0.1400 Displacement (mm)
Displacement (mm)
-0.0800
0.0500
0.0600 0.0400 0.0200 0.0000 -0.0200 0
100
200
300
400
900 1200 1500
-0.0400
0.1200 0.1000
900 1200 1500
0.0800 0.0600 0.0400 0.0200
-0.0600
0.0000
-0.0800
0 Distance Along the Arc Length (mm)
100
200
300
Distance Along Arc Length (mm)
Displacement plots at 27.42 mm away from the weld line.
108
400
Appendix C
X Stress (MPa) vs. Distance Along the Arc Length (mm)
Y Stress (MPa) vs. Distance Along the Arc Length (mm) 2
200
2
150
1 1
Stress (MPa)
Stress (MPa)
250
900 1200 1500
100 50 0 -50
0
100
200
300
0 -1 0
100
400
-2 -3 Distance Along the Arc Length (mm)
Distance Along the Arc Length (mm)
Z Stress (MPa) vs. Distance Along the Arc Length (mm)
Von Mises Stress (MPa) vs. Distance Along the Arc Length (mm) 250 200
100
200
300
400
Stress (MPa)
Stress (MPa)
300
-2
400
-100
100 80 60 40 20 0 -20 0 -40 -60 -80 -100 -120
200
-1
900 1200 1500
900 1200 1500
150
900 1200 1500
100 50 0 0
Distance Along the Arc Length (mm)
100
200
300
Distance Along the Arc Length (mm)
Stress plots at 27.42 mm away from the weld line.
109
400
Appendix C
X Total Strain vs. Distance Along the Arc Length (mm)
Y Total Strain vs. Distance Along the Arc Length (mm) 0.0002
0.0012 0.0010
0.0001 Total Strain
0.0006 900 1200 1500
0.0004 0.0002 0.0000 -0.0002 0
100
200
300
400
0.0000 0
100
200
300
-0.0001 -0.0002 -0.0003
-0.0004
-0.0004
-0.0006
Distance Along the Arc Length (mm)
Distance Along the Arc Length (mm)
Z Total Strain vs. Distance Along the Arc Length (mm) 0.0004 0.0002 Total Strain
Total Strain
0.0008
0.0000 -0.0002
0
100
200
300
-0.0004
400
900 1200 1500
-0.0006 -0.0008 Distance Along the Arc Length (mm)
Total-strain plots at 27.42 mm away from the weld line.
110
400
900 1200 1500
Appendix C
X Elastic Strain vs. Distance Along the Arc Length (mm)
Y Elastic Strain vs. Distance Along the Arc Length (mm)
0.0012 0.0010 Elastic Strain
0.0006 900 1200 1500
0.0004 0.0002 0.0000 -0.0002 0
100
200
300
400
-0.0004 -0.0006
100
Distance Along the Arc Length (mm)
200
0.0004 0.0003 0.0002 0.0001 0.0000 -0.0001 0 -0.0002 -0.0003 -0.0004 -0.0005 -0.0006 -0.0007
300
Distance Along the Arc Length (mm)
Z Elastic Strain vs. Distance Along the Arc Length (mm)
Elastic Strain
Elastic Strain
0.0008
0.0002 0.0001 0.0001 0.0000 -0.0001 0 -0.0001 -0.0002 -0.0002 -0.0003 -0.0003 -0.0004 -0.0004
100
200
300
400
900 1200 1500
Distance Along the Arc Length (mm)
Elastic-strain plots at 27.42 mm away from the weld line.
111
400
900 1200 1500
Appendix C
Y Plastic Strain vs. Distance Along the Arc Length (mm) 0.00007 0.00006 0.00005 Plastic Strain
0.00002 0.000018 0.000016 0.000014 0.000012 0.00001 0.000008 0.000006 0.000004 0.000002 0 -0.000002 0
900 1200 1500
0.00004
900 1200 1500
0.00003 0.00002 0.00001 0
100
200
300
400
-0.00001
0
Distance Along the Arc Length (mm)
100
200
0.00001 0 -0.00001 0
300
Distance Along the Arc Length (mm)
Z Plastic Strain vs. Distance Along the Arc Length (mm)
Plastic Strain
Plastic Strain
X Plastic Strain vs. Distance Along the Arc Length (mm)
100
200
300
400
-0.00002 -0.00003
900 1200 1500
-0.00004 -0.00005 -0.00006 -0.00007 -0.00008 -0.00009 Distance Along the Arc Length (mm)
Plastic-strain plots at 27.42 mm away from the weld line.
112
400
Appendix C
X Displacement (mm) vs. Distance Along the Arc Length (mm)
Y Displacement (mm) vs. Distance Along the Arc Length (mm)
0.0400 0.0200 0.0100 0.0000 -0.0100 0
100
200
300
400
-0.0200
Displacement (mm)
Displacement (mm)
0.0300
900 1200 1500
-0.0300 -0.0400
0.0600 0.0400
900 1200 1500
0.0200 0.0000 -0.0200 0 -0.0400
100
200
300
400
-0.0600 Distance Along the Arc Length (mm)
Distance Along the Arc Length (mm)
Z Displacement (mm) vs. Distance Along the Arc Length (mm)
Displacement Intensity/USUM (mm) vs. Distance Along the Arc Length (mm)
0.0600
0.1400
0.0500
0.1200
0.0400
Displacement (mm)
Displacement (mm)
-0.0500
0.1400 0.1200 0.1000 0.0800
0.0300 0.0200
900 1200 1500
0.0100 0.0000 -0.0100 0
100
200
300
400
0.1000
0.0600 0.0400
-0.0200
0.0200
-0.0300
0.0000
-0.0400
900 1200 1500
0.0800
0 Distance Along the Arc Length (mm)
100
200
300
Distance Along Arc Length (mm)
Displacement plots at 45.41 mm away from the weld line.
113
400
Appendix C
X Stress (MPa) vs. Distance Along the Arc Length (mm)
Y Stress (MPa) vs. Distance Along the Arc Length (mm)
200
8 6
100
Stress (MPa)
Stress (MPa)
150 900 1200 1500
50 0 0
100
200
300
4 2 0 -2
0
100
300
400
-4
400
-50
-6 Distance Along the Arc Length (mm)
Distance Along the Arc Length (mm)
Z Stress (MPa) vs. Distance Along the Arc Length (mm)
Von Mises Stress (MPa) vs. Distance Along the Arc Length (mm)
80 60 Stress (MPa)
40 Stress (MPa)
200
900 1200 1500
20 0 -20 0
100
200
300
400
900 1200 1500
-40 -60 -80 -100
200 180 160 140 120 100 80 60 40 20 0
900 1200 1500
0 Distance Along the Arc Length (mm)
100
200
300
Distance Along the Arc Length (mm)
Stress plots at 45.41 mm away from the weld line.
114
400
Appendix C
X Total Strain vs. Distance Along the Arc Length (mm)
Y Total Strain vs. Distance Along the Arc Length (mm)
0.0010
0.0002 0.0002
0.0008
0.0001 Total Strain
0.0001 900 1200 1500
0.0004 0.0002
-0.0002
0.0000 -0.0001 0
100
200
300
-0.0001 -0.0002
0.0000 0
100
200
300
-0.0002
400
-0.0003 -0.0003
-0.0004
Distance Along the Arc Length (mm)
Distance Along the Arc Length (mm)
Z Total Strain vs. Distance Along the Arc Length (mm) 0.0003 0.0002 0.0001 Total Strain
Total Strain
0.0006
0.0000 -0.0001 0
100
200
300
-0.0002
400
900 1200 1500
-0.0003 -0.0004 -0.0005 Distance Along the Arc Length (mm)
Total-strain plots at 45.41 mm away from the weld line.
115
400
900 1200 1500
Appendix C
X Elastic Strain vs. Distance Along the Arc Length (mm)
Y Elastic Strain vs. Distance Along the Arc Length (mm)
0.0010
0.0002 0.0002 0.0001 Elastic Strain
0.0006 900 1200 1500
0.0004 0.0002 0.0000 -0.0002
0
100
200
300
0.0001 0.0000 -0.0001 0
100
200
300
-0.0001 -0.0002 -0.0002
400
-0.0003
-0.0004
-0.0003 Distance Along the Arc Length (mm)
Distance Along the Arc Length (mm)
Z Elastic Strain vs. Distance Along the Arc Length (mm) 0.0003 0.0002 0.0001 Elastic Strain
Elastic Strain
0.0008
0.0000 -0.0001 0
100
200
300
-0.0002
400
900 1200 1500
-0.0003 -0.0004 -0.0005 Distance Along the Arc Length (mm)
Elastic-strain plots at 45.41 mm away from the weld line.
116
400
900 1200 1500
Appendix C
Y Plastic Strain vs. Distance Along the Arc Length (mm)
Plastic Strain
1 0.9 0.8 0.7 0.6 0.5 0.4 0.3 0.2 0.1 0
900 1200 1500
0
100
200
300
1 0.9 0.8 0.7 0.6 0.5 0.4 0.3 0.2 0.1 0
400
900 1200 1500
0
Distance Along the Arc Length (mm)
100
200
300
Distance Along the Arc Length (mm)
Z Plastic Strain vs. Distance Along the Arc Length (mm)
Plastic Strain
Plastic Strain
X Plastic Strain vs. Distance Along the Arc Length (mm)
1 0.9 0.8 0.7 0.6 0.5 0.4 0.3 0.2 0.1 0
900 1200 1500
0
100
200
300
400
Distance Along the Arc Length (mm)
Plastic-strain plots at 45.41 mm away from the weld line.
117
400
Appendix C
0.0700 0.0600 Displacement (mm)
0.0350 0.0300 0.0250 0.0200 0.0150 0.0100 0.0050 0.0000 -0.0050 0 -0.0100 -0.0150 -0.0200
Y Displacement (mm) vs. Distance Along the Arc Length (mm)
900 1200 1500 100
200
300
400
0.0500 0.0400
900 1200 1500
0.0300 0.0200 0.0100 0.0000 -0.0100 0
100
200
300
400
Distance Along the Arc Length (mm)
Distance Along the Arc Length (mm)
Z Displacement (mm) vs. Distance Along the Arc Length (mm)
Displacement Intensity/USUM (mm) vs. Distance Along the Arc Length (mm)
0.0100
0.0800
0.0050
0.0700 Displacement (mm)
Displacement (mm)
Displacement (mm)
X Displacement (mm) vs. Distance Along the Arc Length (mm)
0.0000 -0.0050
0
100
200
300
-0.0100
400
900 1200 1500
-0.0150 -0.0200
0.0600 0.0500 900 1200 1500
0.0400 0.0300 0.0200 0.0100 0.0000 -0.0100 0
-0.0250 Distance Along the Arc Length (mm)
100
200
300
Distance Along Arc Length (mm)
Displacement plots at 83.80 mm away from the weld line.
118
400
Appendix C
X Stress (MPa) vs. Distance Along the Arc Length (mm)
Y Stress (MPa) vs. Distance Along the Arc Length (mm)
200
30 20
100 50 0 -50
0
100
200
300
400
Stress (MPa)
Stress (MPa)
150
900 1200 1500
10 0 0
-10
100
200
300
400
900 1200 1500
-20
-100 -150
-30 Distance Along the Arc Length (mm)
Distance Along the Arc Length (mm)
Z Stress (MPa) vs. Distance Along the Arc Length (mm)
Von Mises Stress (MPa) vs. Distance Along the Arc Length (mm)
100
180 160 140
0 0
100
200
300
-50
400
Stress (MPa)
Stress (MPa)
50 900 1200 1500
120
900 1200 1500
100 80 60 40
-100
20 0
-150
0 Distance Along the Arc Length (mm)
100
200
300
Distance Along the Arc Length (mm)
Stress plots at 83.80 mm away from the weld line.
119
400
Appendix C
X Total Strain vs. Distance Along the Arc Length (mm)
Y Total Strain vs. Distance Along the Arc Length (mm) 0.0003
0.0010 0.0008
0.0002
0.0002 0.0000 -0.0002 0
100
200
300
400
Total Strain
0.0004 900 1200 1500
-0.0004
0.0001 0.0000 -0.0001
0
100
200
300
-0.0002
-0.0006
-0.0003
-0.0008
Distance Along the Arc Length (mm)
Distance Along the Arc Length (mm)
Z Total Strain vs. Distance Along the Arc Length (mm)
Total Strain
Total Strain
0.0006
0.0004 0.0003 0.0002 0.0001 0.0000 -0.0001 0 -0.0002 -0.0003 -0.0004 -0.0005 -0.0006 -0.0007
100
200
300
400
900 1200 1500
Distance Along the Arc Length (mm)
Total-strain plots at 83.80 mm away from the weld line.
120
400
900 1200 1500
Appendix C
X Elastic Strain vs. Distance Along the Arc Length (mm)
Y Elastic Strain vs. Distance Along the Arc Length (mm)
0.0010
0.0003
0.0008
0.0002 Elastic Strain
0.0004 0.0002 0.0000 -0.0002 0
100
200
300
400
900 1200 1500
-0.0004
0.0001 0.0000 -0.0001
0
100
200
300
-0.0002
-0.0006 -0.0008
-0.0003 Distance Along the Arc Length (mm)
Distance Along the Arc Length (mm)
Z Elastic Strain vs. Distance Along the Arc Length (mm)
Elastic Strain
Elastic Strain
0.0006
0.0004 0.0003 0.0002 0.0001 0.0000 -0.0001 0 -0.0002 -0.0003 -0.0004 -0.0005 -0.0006 -0.0007
100
200
300
400
900 1200 1500
Distance Along the Arc Length (mm)
Elastic-strain plots at 83.80 mm away from the weld line.
121
400
900 1200 1500
Appendix C
X Plastic Strain vs. Distance Along the Arc Length (mm)
Y Plastic Strain vs. Distance Along the Arc Length (mm)
0.0000035
0.000004
0.000003
0.0000035 0.000003 Plastic Strain
0.000002
900 1200 1500
0.0000015 0.000001 0.0000005
0.0000025
-0.0000005
900 1200 1500
0.000002 0.0000015 0.000001 0.0000005
0
0 0
100
200
300
400
-0.0000005 0
Distance Along the Arc Length (mm)
100
200
0.000001 0 -0.000001 0
300
Distance Along the Arc Length (mm)
Z Plastic Strain vs. Distance Along the Arc Length (mm)
Plastic Strain
Plastic Strain
0.0000025
100
200
300
400
-0.000002 900 1200 1500
-0.000003 -0.000004 -0.000005 -0.000006 -0.000007 -0.000008 Distance Along the Arc Length (mm)
Plastic-strain plots at 83.80 mm away from the weld line.
122
400
Appendix C
X Displacement (mm) vs. Distance Along the Arc Length (mm)
Y Displacement (mm) vs. Distance Along the Arc Length (mm) 0.0500 0.0400
0.0150 0.0100 0.0050
Displacement (mm)
0.0250 0.0200 900 1200 1500
0.0000 -0.0050 0 -0.0100 -0.0150
100
200
300
400
0.0300 0.0200
900 1200 1500
0.0100 0.0000 -0.0100 0
100
200
300
400
-0.0200 -0.0300 Distance Along the Arc Length (mm)
Distance Along the Arc Length (mm)
Z Displacement (mm) vs. Distance Along the Arc Length (mm)
Displacement Intensity/USUM (mm) vs. Distance Along the Arc Length (mm)
0.0100
0.0600
0.0050
0.0500
Displacement (mm)
Displacement (mm)
Displacement (mm)
0.0350 0.0300
0.0000 -0.0050
0
100
200
300
-0.0100
400
900 1200 1500
-0.0150 -0.0200
0.0400
900 1200 1500
0.0300 0.0200 0.0100 0.0000
-0.0250
0 Distance Along the Arc Length (mm)
100
200
300
Distance Along Arc Length (mm)
Displacement plots at 100.00 mm away from the weld line.
123
400
Appendix C
X Stress (MPa) vs. Distance Along the Arc Length (mm)
Y Stress (MPa) vs. Distance Along the Arc Length (mm)
250
30
200
25
100
900 1200 1500
50 0 -50 0
Stress (MPa)
Stress (MPa)
150
100
200
300
400
20 15
900 1200 1500
10 5 0 -5 0
-100
-10
-150
-15 Distance Along the Arc Length (mm)
350
60
300
20 0 300
-40
400
Stress (MPa)
Stress (MPa)
40
200
300
400
Von Mises Stress (MPa) vs. Distance Along the Arc Length (mm)
80
100
200
Distance Along the Arc Length (mm)
Z Stress (MPa) vs. Distance Along the Arc Length (mm)
-20 0
100
900 1200 1500
-60
250
150 100
-80
50
-100
0
-120
900 1200 1500
200
0 Distance Along the Arc Length (mm)
100
200
300
Distance Along the Arc Length (mm)
Stress plots at 100.00 mm away from the weld line.
124
400
Appendix C
X Total Strain vs. Distance Along the Arc Length (mm)
Y Total Strain vs. Distance Along the Arc Length (mm)
0.0012
0.0003
0.0010
0.0002
0.0008
0.0001 900 1200 1500
0.0002 0.0000 -0.0002 0
Total Strain
0.0004
100
200
300
400
0.0000 -0.0001
0
100
200
300
-0.0002
-0.0004
-0.0003
-0.0006
-0.0004
-0.0008
Distance Along the Arc Length (mm)
Distance Along the Arc Length (mm)
Z Total Strain vs. Distance Along the Arc Length (mm)
Total Strain
Total Strain
0.0006
0.0004 0.0003 0.0002 0.0001 0.0000 -0.0001 0 -0.0002 -0.0003 -0.0004 -0.0005 -0.0006 -0.0007
100
200
300
400
900 1200 1500
Distance Along the Arc Length (mm)
Total-strain plots at 100.00 mm away from the weld line.
125
400
900 1200 1500
Appendix C
X Elastic Strain vs. Distance Along the Arc Length (mm)
Y Elastic Strain vs. Distance Along the Arc Length (mm)
0.0012
0.0003
0.0010
0.0002
0.0004
900 1200 1500
0.0002 0.0000 -0.0002 0
Elastic Strain
0.0006
100
200
300
400
-0.0004
0.0001 0.0000 -0.0001
0
100
200
300
-0.0002 -0.0003
-0.0006 -0.0008
-0.0004 Distance Along the Arc Length (mm)
Distance Along the Arc Length (mm)
Z Elastic Strain vs. Distance Along the Arc Length (mm)
Elastic Strain
Elastic Strain
0.0008
0.0004 0.0003 0.0002 0.0001 0.0000 -0.0001 0 -0.0002 -0.0003 -0.0004 -0.0005 -0.0006 -0.0007
100
200
300
400
900 1200 1500
Distance Along the Arc Length (mm)
Elastic-strain plots at 100.00 mm away from the weld line.
126
400
900 1200 1500
Appendix C
Y Plastic Strain vs. Distance Along the Arc Length (mm)
Plastic Strain
1 0.9 0.8 0.7 0.6 0.5 0.4 0.3 0.2 0.1 0
900 1200 1500
0
100
200
300
1 0.9 0.8 0.7 0.6 0.5 0.4 0.3 0.2 0.1 0
400
900 1200 1500
0
Distance Along the Arc Length (mm)
100
200
300
Distance Along the Arc Length (mm)
Z Plastic Strain vs. Distance Along the Arc Length (mm)
Plastic Strain
Plastic Strain
X Plastic Strain vs. Distance Along the Arc Length (mm)
1 0.9 0.8 0.7 0.6 0.5 0.4 0.3 0.2 0.1 0
900 1200 1500
0
100
200
300
400
Distance Along the Arc Length (mm)
Plastic-strain plots at 100.00 mm away from the weld line.
127
400
Appendix D
Appendix D B.1
Sample of ANSYS® Data File
Introduction
ANSYS® program requires two type of analyses in order to simulate the welding process; transient thermal analysis, and elastic-plastic analysis. Both analyses use different set of input data and boundary conditions. In transient thermal analysis, for instance, it requires temperature dependent material properties of thermal conductivity, and specific heat. The response of transient thermal analysis, which is temperature distribution at each node, was used as an input data for the elastic plastic analysis in addition to modulus of elasticity, thermal coefficient expansion, poisson’s ratio (temperature dependent material properties).
B.2
The ANSYS® Data File
!* Changing View /VIEW, 1 ,1,1,1 /ANG, 1 /AUTO, 1 /REP,FAST /PREP7 /UNITS,SI /COM /COM NODE DEFINITIONS CSYS,0 !
Creating Nodes
N,1,0.7,0.281214938488428E-18,0. N,2,0.7,-0.6E-02,0.
. . . N,2756,0.506417810916901,0.26788841933012E-02,-0.257115006446838 !
Material Properties
MP,DENS,1,7.820000E+03 MPTEMP,1,273,373,573,723 ,823,873 MPTEMP,7,993,1073,1783,1853,5273 MPDATA,EX,1,1,200E9,200E9,200E9,150E9,110E9,88E9 MPDATA,EX,1,7,20E9,20E9,2E9,.2E9,0.00002E9 MPDATA,NUXY,1,1,0.2786,.3095,.331,.338,.3575,.3738
128
Appendix D MPDATA,NUXY,1,7,.3738,.4238,.4738,0.499,0.499 MPDATA,ALPX,1,1,10E-6,11E-6,12E-6,13E-6,14E-6,14E-6 MPDATA,ALPX,1,7,14E-6,14E-6,15E-6,15E-6,15.5E-6 MPDATA,KXX,1,1,51.9,51.1,46.1,41.05,37.5,35.6 MPDATA,KXX,1,7,30.64,26,29.7,31,42.2 MPDATA,C,1,1,450,499.2,565.5,630.5,705.5,773.3 MPDATA,C,1,7,1080.4,931,400,735.25,400 !Yeild Stress TB,BKIN,1, 6 ! Activate a data table with 6 points TBTEMP,273 ! Temperature = 0.0 TBDATA,1,290E6,0.0E6 ! Yield = 290,000,000; Tangent modulus = 0.0E6 TBTEMP,573 TBDATA,1,200E6,0.0E6 TBTEMP,823 TBDATA,1,120E6,0.0E6 TBTEMP,993 TBDATA,1,9.8E6,0.0E6 TBTEMP,1473 TBDATA,1,2.0E6,0.0E6 TBTEMP,5000 TBDATA,1,.0098E6,0.0E6 /COM REAL CONSTANT TABLE, ELEMENT TABLES, AND /COM ELEMENT COORDINATE SYSTEM DEFINITION /COM /COM IDEAS PROPERTY: 2 NAME :SOLID2 /COM R,1,0. R,2,0.00001 ET, 1, 70, 0, 0, 0, 0, 0, 0 ET, 2, 57, 0, 0, 0, 0, 0, 0 TYPE, 1 $ REAL, 1 $ MAT, 1 ESYS, 0 !
Creating Elements
EN,26,1,2,4,3,57,107,207,157 EN,27,57,107,207,157,58,108,208,158 . . . EN,1274,2704,2754,1304,1554,2705,2755,1305,1555 EN,1275,2705,2755,1305,1555,2706,2756,1306,1556 eplot TYPE, 2 $ REAL, 2 $ MAT, 1 ESYS, 0 EN, 1276, 16, 18, 907, 807 . . . EN, 1775, 1555, 2705, 2706, 1556 CSYS,0 FINISH
129
Appendix D !* Variable to be changed Film=10 Q=1200 R=0.006 V=0.00210 X=0.279253/50 XJ=0.280188/50 XI=0.282232/50 XH=0.284703/50 XG=0.287742/50 XF=0.291457/50 Tscale=X/V X0=0.0 X1=0.004472 X2=0.007151 X3=0.010328 X4=0.014231 X5=0.019032 X6=0.024875 a=(3*Q)/(3.141593*R**2) B0=exp(-3*X0**2/R**2) B1=exp(-3*X1**2/R**2) B2=exp(-3*X2**2/R**2) B3=exp(-3*X3**2/R**2) B4=exp(-3*X4**2/R**2) B5=exp(-3*X5**2/R**2) B6=exp(-3*X6**2/R**2) /SOLU ANTYPE,TRANS ! NONLINEAR TRANSIENT DYNAMIC ANALYSIS OUTRES,,ALL ! Controls the solution data written to the database. !TRNOPT,FULL ! ANANYSIS OPTIONS TRNOPT,FULL ! ANANYSIS OPTIONS PSTRES,on ! Press Stress Option NLGEOM,on ! Large Deflection Option NROPT,Full,,On ! Newton-Rasphon Solution TREF,295 !*Applying initial temp to the plate TUNIF,295 !*
Boundary Conditions
*DIM,Conv1,TABLE,10,1,1, , , *DIM,Rad1,TABLE,10,1,1, , , ESEL,S,ELEM,, 26, 375 SFE,ALL,5,CONV,0,%Conv1% ! Film Coefficients SFE,ALL,3,CONV,0,%Conv1% ! Film Coefficients SFE,ALL,5,CONV,2,295 ! Bulk Temperatures SFE,ALL,3,CONV,2,295 ! Bulk Temperatures ESEL,ALL ESEL,S,ELEM,, 676, 1025 SFE,ALL,5,CONV,0,%Conv1% ! Film Coefficients SFE,ALL,3,CONV,0,%Conv1% ! Film Coefficients SFE,ALL,5,CONV,2,295 ! Bulk Temperatures
130
Appendix D SFE,ALL,3,CONV,2,295 Esel,ALL
! Bulk Temperatures
ESEL,S,ELEM,, 1276, 1525 ESEL,A,ELEM,, 1526, 1775 SFE,ALL,2,CONV,0,%Conv1% ! Film Coefficients SFE,ALL,2,CONV,2,295 ! Bulk Temperatures Esel,ALL ESEL,S,ELEM,, 376, 625 SFE,ALL,5,CONV,0,%Conv1% ! Film Coefficients SFE,ALL,5,CONV,2,295 ! Bulk Temperatures Esel,ALL ESEL,S,ELEM,, 1026, 1225 SFE,ALL,3,CONV,0,%Conv1% ! Film Coefficients SFE,ALL,3,CONV,2,295 ! Bulk Temperatures Esel,ALL !
Combined Convection and Radiation Heat Transfer Coefficient
Conv1(1,0,1) = 250 Conv1(1,1,1) = 14.86344*Film Conv1(2,0,1) = 450 Conv1(2,1,1) = 38.29201*Film Conv1(3,0,1) = 650 Conv1(3,1,1) = 69.21918*Film Conv1(4,0,1) = 850 Conv1(4,1,1) = 106.6106*Film Conv1(5,0,1) = 1050 Conv1(5,1,1) = 149.8134*Film Conv1(6,0,1) = 1250 Conv1(6,1,1) = 198.3632*Film Conv1(7,0,1) = 1450 Conv1(7,1,1) = 251.9060*Film Conv1(8,0,1) = 1650 Conv1(8,1,1) = 310.1595*Film Conv1(9,0,1) = 1850 Conv1(9,1,1) = 372.8915*Film Conv1(10,0,1) = 5000 Conv1(10,1,1) = 1848.322*Film
!Heat Flux Distribution *DIM,E1001,TABLE,21,1,1,time,temp, SFE, 626,2,HFLUX, ,%E1001% SFE, 626,5,HFLUX, ,%E1001% Z=X* 0 E1001( 1,0,1) = (Tscale* 0)+( 0-10) E1001( 1,1,1) = A*(B1+B0)/2*exp(-3*((Z+R-V*((Tscale* 0)+( 0-10)))/R)**2) E1001( 2,0,1) = (Tscale* 0)+( 1-10) E1001( 2,1,1) = A*(B1+B0)/2*exp(-3*((Z+R-V*((Tscale* 0)+( 1-10)))/R)**2) E1001( 3,0,1) = (Tscale* 0)+( 2-10) E1001( 3,1,1) = A*(B1+B0)/2*exp(-3*((Z+R-V*((Tscale* 0)+( 2-10)))/R)**2)
131
Appendix D E1001( 4,0,1) = (Tscale* 0)+( 3-10) E1001( 4,1,1) = A*(B1+B0)/2*exp(-3*((Z+R-V*((Tscale* 0)+( 3-10)))/R)**2) E1001( 5,0,1) = (Tscale* 0)+( 4-10) E1001( 5,1,1) = A*(B1+B0)/2*exp(-3*((Z+R-V*((Tscale* 0)+( 4-10)))/R)**2) E1001( 6,0,1) = (Tscale* 0)+( 5-10) E1001( 6,1,1) = A*(B1+B0)/2*exp(-3*((Z+R-V*((Tscale* 0)+( 5-10)))/R)**2) E1001( 7,0,1) = (Tscale* 0)+( 6-10) E1001( 7,1,1) = A*(B1+B0)/2*exp(-3*((Z+R-V*((Tscale* 0)+( 6-10)))/R)**2) E1001( 8,0,1) = (Tscale* 0)+( 7-10) E1001( 8,1,1) = A*(B1+B0)/2*exp(-3*((Z+R-V*((Tscale* 0)+( 7-10)))/R)**2) E1001( 9,0,1) = (Tscale* 0)+( 8-10) E1001( 9,1,1) = A*(B1+B0)/2*exp(-3*((Z+R-V*((Tscale* 0)+( 8-10)))/R)**2) E1001(10,0,1) = (Tscale* 0)+( 9-10) E1001(10,1,1) = A*(B1+B0)/2*exp(-3*((Z+R-V*((Tscale* 0)+( 9-10)))/R)**2) E1001(11,0,1) = (Tscale* 0)+(10-10) E1001(11,1,1) = A*(B1+B0)/2*exp(-3*((Z+R-V*((Tscale* 0)+(10-10)))/R)**2) E1001(12,0,1) = (Tscale* 0)+(11-10) E1001(12,1,1) = A*(B1+B0)/2*exp(-3*((Z+R-V*((Tscale* 0)+(11-10)))/R)**2) E1001(13,0,1) = (Tscale* 0)+(12-10) E1001(13,1,1) = A*(B1+B0)/2*exp(-3*((Z+R-V*((Tscale* 0)+(12-10)))/R)**2) E1001(14,0,1) = (Tscale* 0)+(13-10) E1001(14,1,1) = A*(B1+B0)/2*exp(-3*((Z+R-V*((Tscale* 0)+(13-10)))/R)**2) E1001(15,0,1) = (Tscale* 0)+(14-10) E1001(15,1,1) = A*(B1+B0)/2*exp(-3*((Z+R-V*((Tscale* 0)+(14-10)))/R)**2) E1001(16,0,1) = (Tscale* 0)+(15-10) E1001(16,1,1) = A*(B1+B0)/2*exp(-3*((Z+R-V*((Tscale* 0)+(15-10)))/R)**2) E1001(17,0,1) = (Tscale* 0)+(16-10) E1001(17,1,1) = A*(B1+B0)/2*exp(-3*((Z+R-V*((Tscale* 0)+(16-10)))/R)**2) E1001(18,0,1) = (Tscale* 0)+(17-10) E1001(18,1,1) = A*(B1+B0)/2*exp(-3*((Z+R-V*((Tscale* 0)+(17-10)))/R)**2) E1001(19,0,1) = (Tscale* 0)+(18-10) E1001(19,1,1) = A*(B1+B0)/2*exp(-3*((Z+R-V*((Tscale* 0)+(18-10)))/R)**2) E1001(20,0,1) = (Tscale* 0)+(19-10) E1001(20,1,1) = A*(B1+B0)/2*exp(-3*((Z+R-V*((Tscale* 0)+(19-10)))/R)**2) E1001(21,0,1) = (Tscale* 0)+(20-10) E1001(21,1,1) = A*(B1+B0)/2*exp(-3*((Z+R-V*((Tscale* 0)+(20-10)))/R)**2) . . . *DIM,O1050,TABLE,21,1,1,time,temp, SFE,1275,5,HFLUX, ,%O1050% Z=X*49 O1050( 1,0,1) = (Tscale*49)+( 0-10) O1050( 1,1,1) = A*(B2+B1)/2*exp(-3*((Z+R-V*((Tscale*49)+( 0-10)))/R)**2) . . . O1050(21,0,1) = (Tscale*49)+(20-10) O1050(21,1,1) = A*(B2+B1)/2*exp(-3*((Z+R-V*((Tscale*49)+(20-10)))/R)**2) !
Killing the Weld Element ESEL,S,ELEM,,626,675 EKILL,ALL ESEL,ALL
132
Appendix D
!
Load Steps
!* Time Step 1 Time, 1*Tscale NSUBST,15 ESEL,S,ELEM,, 626 EALIVE,ALL ESEL,ALL LSWRITE, 1 . . . !* Time Step 50 Time, 50*Tscale NSUBST,15 ESEL,S,ELEM,, 675 EALIVE,ALL ESEL,ALL LSWRITE, 50 !* Time Step 51 Time, 15*Tscale+100* NSUBST,10 LSWRITE, 51 . . . !* Time Step 80 Time, 15*Tscale+50* NSUBST,10 LSWRITE, 80 LSSOLVE,1, SAVE
1
31
80,1
133