International Journal of Computer and Information Science and Engineering Volume 1 Number 4
The Effects of Software Size on Development Effort and Software Quality Zhizhong Jiang, Peter Naudé, and Binghua Jiang
A common approach to predict development effort is to first estimate the software size, and then use some guidelines on productivity rates to arrive at the time and effort needed to complete the project [7]. Past studies have developed a multitude of models to estimate development effort. For instance, The COCOMO method uses a set of parameters gathered from studies of earlier projects to predict the time needed for the development. However, whereas many models have been proposed, in practice, these models are used rarely or unsuccessfully [8]. This is owing to the complicacy and unreliability of the proposed models. Therefore, estimating software development effort still remains a complex problem which attracts considerable research [9]. One of our goals in this study is to develop a simple model with reasonable accuracy for the estimate of development effort. Our second objective is to identify the relationship between software default and software size. Given that software size is constantly growing, the issue of software quality requires more attention. A fundamental objective of software development is to deliver high quality products that are correct, consistent, and complete [10]. Lo and Huang [11] point out that software failures that occur later will result in maintenance costs, and even a loss of system availability and performance. The correct performance of a software system is an important issue of many critical systems [12]. This study works on the latest release of the ISBSG (International Software Benchmarking Standards Group) database with 4106 projects ever developed worldwide. This paper is organized as follows. Section II gives an overview of the database. Section III builds the model for estimating the total effort for the development, and section IV validates the model with diagnostic plot. Section V generalizes the average amount of effort spent on each phase of the development, and presents the estimates for the effort used in software building, testing and implementation. Section VI identifies the strong correlation between software fault and software size. Finally, section VII presents the conclusion to the study.
Abstract—Effective evaluation of software development effort is an important issue during project plan. This study provides a model to predict development effort based on the software size estimated with function points. We generalize the average amount of effort spent on each phase of the development, and give the estimates for the effort used in software building, testing, and implementation. Finally, this paper finds a strong correlation between software defects and software size. As the size of software constantly increases, the quality remains to be a matter which requires major concern.
Keywords—Development effort, Function points, Software quality, Software size. I. INTRODUCTION
W
ITH the dramatic improvements in hardware performance, software has become the key factor influencing the success of computer-based systems [1]. In the course of time, hardware costs have decreased dramatically, but software is still costly to develop and maintain [2]. In spite of many advanced debugging systems and models developed for predicting software reliability, software quality has remained to be a continuing concern. In software development the two primary problems that have yet to be solved satisfactorily are making systems cost-effective and of higher quality. Researchers and practitioners have found it useful to regard software development as an economic production process [3]. Estimating the amount of effort required for developing a system is an important management concern [4]. Accurate estimate is essential since the client and project management must agree on the boundaries of cost, time, quality, and capability [5]. A low cost estimate may either cause loss or compromise the quality of the software developed, resulting in partially functional or insufficiently tested software that requires later high maintenance costs [6]. Manuscript received June 28, 2007. This research was supported by the ISBSG (International Software Benchmarking Standards Group). Zhizhong Jiang was with Harbin Institute of Technology (China), and University of Oxford. He is now with University of Manchester, Booth Street West, Manchester, M15 6PB, UK (phone:+44(0)8708328157; fax: +44 (0) 1612756596; e-mail:
[email protected]). Peter Naudé was with University of Bath, UK. He is now a Professor in Manchester Business School, University of Manchester, Booth Street West, Manchester, M15 6PB, UK (e-mail:
[email protected]). Binghua Jiang was with London School of Economics and Political Science (LSE). She is now a consultant in Paragon Consulting Group Ltd in central London (email:
[email protected]).
II. BACKGROUND The common difficulty in the study of software metrics is the lack of accessible and reliable large dataset [13]. Many contemporary metrics repositories have limited use due to their obsolescence and ambiguity of documentation [14]. The data repository maintained by the International Software Benchmarking Standards Group (ISBSG) does not have the above deficiencies and has been widely researched
230
International Journal of Computer and Information Science and Engineering Volume 1 Number 4
[13, 15-18]. The latest release of ISBSG data repository (Release 10) contains information on 4106 projects, and each project is recorded with 107 metrics or descriptive pieces of information. The manual accompanied with the data gives detailed descriptions of project attributes. The data repository is regularly updated with substantial projects added in every year. Our study will be focused on the analysis of the data Release 10.
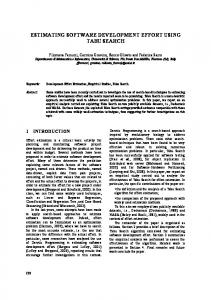
measured with function points which are based on various counting standards (e.g., IFPUG, NESMA, Mark II). Among these counting standards, NESMA is considered to produce equivalent results with IFPUG [25]. In data Release 10, 3281 out of 4106 projects applied IFPUG as size count approach, and there are further 152 projects using NESMA. Thus, to give more reliable results, projects using size count approaches other than IFPUG and NESMA were excluded, and a sample size of 3433 was used for the analysis. We first examine the distributions for the two variables Effort and Functional Size (FS). Fig. 1 is the histogram of the variable Effort, which indicates that the data are highly skewed. After the logarithmic transformation the skewness is greatly improved, and the data approximate to normal distribution (see Fig. 2).
III. THE ESTIMATION OF TOTAL DEVELOPMENT EFFORT For a specific software project, it is necessary to evaluate the development efforts required, thus completing the task within the budget of time and cost. Past studies focused on four distinct approaches for the estimate of software development effort [19]: (1) Historical-Experiential models These involve expert judgment based on experience with similar projects and historically maintained information about projects. (2) Statistically-based models Among these methods, regression analysis is the main technique used which describes the relationship between development effort and its predictor variables such as project size. (3) Analytical-based models This approach is on the basis of a mathematical relationship between the manpower used during software development and effort in all life cycle phases.
Fig. 1 Histogram of development effort
(4) Composite models These models integrate the methods of analytic equations, regression analysis, and expert judgment.
400
231
Frequency
300
Our research will be focused on statistically-based models. As Fenton [20] observed, most of the approaches for estimating development effort involve a prediction system in which the underlying model has the form E = f(S), where E is the development effort and S is a measure of project size. The function f may involve other product attributes (e.g., complexity or required reliability) and process and resource attributes (e.g., programmer’s experience). Accordingly, the estimate of project size is necessary, which will be plugged into the model to predict the development effort. Two methods for the estimate of project size have been widely applied: lines of code (LOC) and function points (FP). The main limitation of a LOC-based model is that it is usually difficulty to provide accurate estimates of lines of code for the development [4]. On the other hand, while the measure of function points has been criticized relating to its reliability [21] and usefulness of the complexity adjustments [22], it has been extensively used as a part of overall estimation and planning techniques for software development [23, 24]. In the ISBSG data repository, total development effort is reflected by the metric Summary Work Effort, which is the total effort in hours spent on the project. Project size is
200
100
0 0.00
2.50
5.00
7.50
10.00
12.50
log(Effort)
Fig. 2 Histogram of development effort after logarithmic transformation
Similarly, the variable FS has skewed distribution (see Fig. 3). Therefore, we applied logarithmic transformation which greatly rectified the skewness. The data approach to normal distribution (see Fig. 4).
International Journal of Computer and Information Science and Engineering Volume 1 Number 4
based on a large sample size of 3433, this model was fitted with reasonable accuracy. This model can be used to predict development effort based on project size, which is measured with function points. IV. MODEL VALIDATION In linear model it is assumed that the residuals are normally distributed with zero mean and homogeneity of variance [26]. Equal scatter of residual points about the horizontal axis indicates that the residuals have homogeneity of variance [27]. We plotted the residuals against the fitted values in Fig. 6 below. The graph displays that the points evenly scatter along the horizontal axis without obvious patterns. Therefore, the assumption of homogenous variance is validated.
Fig. 3 Histogram of functional size
Fig. 4 Histogram of functional size after logarithmic transformation Fig. 6 Plot of residuals against the fitted values
We now check the assumption of normality of the residuals. Fig. 7 shows that the pattern of the residuals conforms well to the normal curve. Therefore, the normal assumption is validated.
Fig. 5 The scatterplot of development effort against project size after logarithmic transformation
We now examine the potential relationship between development effort and project size with the scatterplot in Fig. 5 above. It shows that these two variables are highly correlated with a positive linear relationship. Running regression analysis, we obtained the following result:
ln (Effort) = 3.645 + 0.736 × ln(Size)
Fig. 7 Histogram of the residuals from linear regression
V. THE EFFORT FOR DIFFERENT DEVELOPMENT PHASES
or
Software development usually experiences a series of phases, such as planning, design, building and testing. A good software project needs to successfully manage these development phases. The ISBSG data repository contains the fields which record the amount of effort spent on each development phase of the project. We calculated the average
Effort = 38.3 × Size 0.736 The multiple R2 reported for the fitted model is 0.475, which means that 47.5% of the variance in the dependent variable Effort can be explained by the project size. Therefore,
232
International Journal of Computer and Information Science and Engineering Volume 1 Number 4
amount of effort used in each phase in Table I below. Note that our analysis has excluded those cases of which the sum of effort for each development phase does not match the total development effort reported.
is insignificant to estimate the effort used before project design. However, it is feasible and practical to forecast the effort required for such development phases as software building, testing, and implementation. Similar to the analytic procedures in section III, we generalized the models in Table III which can be used to estimate the effort needed for software building, testing, and implementation. The column multiple R2 gives the goodness-of-fit of the model.
TABLE I AVERAGE AMOUNT OF EFFORT SPENT ON EACH DEVELOPMENT PHASE
Effort
Average (in hours)
Percentage
Plan
182
7.2%
Specify
401
15.9%
Design
324
12.9%
Build
952
37.8%
Test
443
17.6%
Implement
217
8.6%
Summary
2519
100%
TABLE III MODELS FOR THE PREDICTION OF EFFORT IN SOFTWARE BUILDING, TESTING, AND IMPLEMENTATION
BuildEffort = 18.10×Size0.736 TestEffort = 12.24×Size
ImplementEffort = 0.55×Size
< 10-5
Specify
0.438
< 10-5
Design
0.611
0.0001
Build
0.592
< 10-5
Test
0.478
< 10-5
Implement
0.532
< 10-5
0.340
Software fault is a structural imperfection in a software system that may lead to the system’s eventually failing [29]. In spite of many advanced debugging systems and models developed for predicting software reliability, software has suffered much from its failures. For instance, the ISBSG data repository records one parameter Total Defects Delivered specifying the total number of faults in the software which was reported in the first month of its use. Among the 4106 projects in the database, a staggering number of 484 projects were reported with faults in the first month of use. With the increasing complicacy inherent in software development, more attention should be paid to software quality. Project size is measured with function points which are based on various counting standards (e.g., IFPUG, NESMA, Mark II). As before, we retained those projects with counting approach IFPUG or NESMA, since these two counting standards are considered to produce equivalent results. The values for the variable Total Defects Delivered range widely from 0 to 2554, which entails a logarithmic transformation. We then use Shapiro-Wilk test to check the normal assumption of the data. The significance of the test indicates that the variable Total Defects Delivered deviates from normal distribution. Therefore, we used nonparametric test (Spearman’s correlation test) to find the relationship between software defect and size. For our study, the reported p-value is far smaller than 10-5, which indicates that there is strong relationship between software defect and size. Furthermore, the nonparametric correlation coefficient is 0.451, which proves that these two variables are positively related. Therefore, the rising of software size tends to result in more software deflects. With the trend of increasing size of software, it is inevitable that software fault becomes a serious problem. Hence much attention should be paid to the development of advanced debugging systems for testing software reliability.
Software size Correlation p-value coefficient 0.519
0.293 1.067
VI. THE RELATIONSHIP BETWEEN SOFTWARE FAULT AND SOFTWARE SIZE
TABLE II RESULTS OF SPEARMAN CORRELATION TEST
Plan
0.421
0.667
Table I shows that the average amount of effort spent on the whole development is 2519 man-hours. Of the total development effort, a large proportion (37.8%) is spent on software building, while planning (7.2%) and implementation (8.6%) cost much less effort. To improve software reliability, a great amount of effort (17.6%) is used in software testing. Considering the many issues that have been raised on software quality, it is necessary that much effort spent on software testing. As we have found in section III, there exists a strong positive relationship between total development effort and software size. Using statistical tests, we found the effort used in each development phase is also strongly correlated with software size. Table II below summarizes the results of the correlation test. Since the data for functional size deviate from normal distribution, we applied Spearman’s correlation test other than those tests used for normally distributed variables. Spearman’s correlation test is a common nonparametric test that calculates the correlation based on the ranked order of the two series [28].
Effort
Multiple R2
Estimation model
Project size that is measured with function points is evaluated in the design stage of the development. Therefore, it
233
International Journal of Computer and Information Science and Engineering Volume 1 Number 4
VII. CONCLUSION This paper worked on the latest release of the ISBSG database, which is a large database recording the software projects ever developed worldwide. A model for the estimate of development effort was developed based on software size. This model can be applied during software plan and design. This study also summarized the average amount of effort spent on each development stage, and presented the formulae to estimate the effort for software building, testing, and implementation. This study also found a strong positive correlation between software fault and size. With the growing of software size, software quality remains to be an ongoing concern and calls for more serious attention.
REFERENCES [1] [2] [3]
[4]
[5] [6]
[7]
[8] [9]
[10] [11] [12]
[13]
[14]
[15]
[16]
[17]
[18]
R. S. Pressman, Software Engineering: A Practitioner's Approach. London: McGraw-Hill, 2005. J. C. Vliet, Software Engineering: Principles and Practice. Chichester: Wiley, 1993. R. D. Banker, H. Chang, and C. F. Kemerer, "Evidence on economies of scale in software development," Information and Software Technology, vol. 36, pp. 275-282, 1994. A. Heiat and N. Heiat, "A model for estimating efforts required for developing small-scale business applications," Journal of Systems and Software, vol. 39, pp. 7-14, 1997. D. V. Steward, Software Engineering with Systems Analysis and Design. Belmont, California: Brooks/Cole, 1987. A. Lee, C. H. Cheng, and J. Balakrishnan, "Software development cost estimation: Integrating neural network with cluster analysis," Information & Management, vol. 34, pp. 1-9, 1998. W. S. Humphrey and N. D. Singpurwalla, "Predicting (individual) software productivity," IEEE Transactions on Software Engineering, vol. 17, pp. 196-207, 1991. M. van Genuchten and H. Koolen, "On the use of software cost models," Information & Management, vol. 21, pp. 37-44, 1991. G. R. Finnie, G. E. Wittig, and J. M. Desharnais, "A comparison of software effort estimation techniques: Using function points with neural networks, case-based reasoning and regression models," Journal of Systems and Software, vol. 39, pp. 281-289, 1997. L. Dai and K. Cooper, "Modeling and performance analysis for security aspects," Science of Computer Programming, vol. 61, pp. 58-71, 2006. W. Kuo, "Software reliability estimation: A realization of competing risk," Microelectronics and Reliability, vol. 23, pp. 249-260, 1983. J. Lo and C. Huang, "An integration of fault detection and correction processes in software reliability analysis," Journal of Systems and Software, vol. 79, pp. 1312-1323, 2006. Q. Liu and R. C. Mintram, "Preliminary data analysis methods in software estimation," Software Quality Journal, vol. 13, pp. 91-115, 2005. W. Harrison, "A flexible method for maintaining software metrics data: a universal metrics repository," Journal of Systems and Software, vol. 72, pp. 225-234, 2004. C. J. Lokan, "An empirical analysis of function point adjustment factors," Information and Software Technology, vol. 42, pp. 649-660, 2000. R. Jeffery, M. Ruhe, and I. Wieczorek, "A comparative study of two software development cost modeling techniques using multiorganizational and company-specific data," Information and Software Technology, vol. 42, pp. 1009-1016, 2000. J. J. Cuadrado-Gallego, M. Sicilia, M. Garre, and D. Rodríguez, "An empirical study of process-related attributes in segmented software costestimation relationships," Journal of Systems and Software, vol. 79, pp. 353-361, 2006. J. Moses, M. Farrow, N. Parrington, and P. Smith, "A productivity benchmarking case study using Bayesian credible intervals," Software Quality Journal, vol. 14, pp. 37-52, 2006.
234
[19] S. D. Conte, H. E. Dunsmore, and V. Y. Shen, Software Engineering Metrics and Models. Menlo Park, California: Benjamin/Cummings Publishing Company, 1986. [20] N. Fenton, "Software measurement: A necessary scientific basis," IEEE Transactions on Software Engineering, vol. 20, pp. 199-206, 1994. [21] C. F. Kemerer, "Reliability of function points measurement: a field experiment," Communications of the ACM, vol. 36, pp. 85-97, 1993. [22] C. R. Symons, "Function point analysis: difficulties and improvements," IEEE Transactions on Software Engineering, vol. 14, pp. 2-11, 1988. [23] C. F. Kemerer and B. S. Porter, "Improving the reliability of function point measurement: an empirical study," IEEE Transactions on Software Engineering, vol. 18, pp. 1011-1024, 1992. [24] G. Orr and T. E. Reeves, "Function point counting: one program's experience," Journal of Systems and Software, vol. 53, pp. 239-244, 2000. [25] NESMA, NESMA FPA Counting Practices Manual 2.0: Nesma Association, 1996. [26] A. C. Rencher, Linear Models in Statistics. New York: John Wiley & Sons, 2000. [27] W. J. Krzanowski, An Introduction to Statistical Modelling. London: Arnold, 1998. [28] J. D. Gibbons, Nonparametric Methods for Quantitative Analysis. Columbus, Ohio: American Sciences Press, 1985. [29] J. C. Munson, A. P. Nikora, and J. S. Sherif, "Software faults: A quantifiable definition," Advances in Engineering Software, vol. 37, pp. 327-333, 2006.
Zhizhong Jiang is a PhD student at Manchester Business School, University of Manchester, United Kingdom. He received his B.E.(first-class honors) from Harbin Institute of Technology (China) and MSc in Applied Statistics from University of Oxford. Peter Naudé is a Professor of Marketing at Manchester Business School, University of Manchester, United Kingdom. He publishes widely in business studies and information systems. Binghua Jiang is a consultant in Paragon Consulting Group Ltd, London. She received her B. E (first-class honors) from Tongji University, Shanghai, and MSc with distinction in Analysis, Design, and Management of Information System from London School of Economics and Political Science (LSE).