University of Tennessee, Knoxville
Trace: Tennessee Research and Creative Exchange Masters Theses
Graduate School
12-2003
The Effects of Temperature and Solids Retention Time on Activated Sludge Treatment Performance Jack McClendon Carley University of Tennessee - Knoxville
Recommended Citation Carley, Jack McClendon, "The Effects of Temperature and Solids Retention Time on Activated Sludge Treatment Performance. " Master's Thesis, University of Tennessee, 2003. http://trace.tennessee.edu/utk_gradthes/1910
This Thesis is brought to you for free and open access by the Graduate School at Trace: Tennessee Research and Creative Exchange. It has been accepted for inclusion in Masters Theses by an authorized administrator of Trace: Tennessee Research and Creative Exchange. For more information, please contact
[email protected].
To the Graduate Council: I am submitting herewith a thesis written by Jack McClendon Carley entitled "The Effects of Temperature and Solids Retention Time on Activated Sludge Treatment Performance." I have examined the final electronic copy of this thesis for form and content and recommend that it be accepted in partial fulfillment of the requirements for the degree of Master of Science, with a major in Environmental Engineering. Dr. Kevin G. Robinson, Major Professor We have read this thesis and recommend its acceptance: Dr. Gregory Reed, Dr. Chris Cox Accepted for the Council: Carolyn R. Hodges Vice Provost and Dean of the Graduate School (Original signatures are on file with official student records.)
To the Graduate Council:
I am submitting herewith a thesis written by Jack McClendon Carley entitled “The Effects of Temperature and Solids Retention Time on Activated Sludge Treatment Performance.” I have examined the final electronic copy of this thesis for form and content and recommend that it be accepted in partial fulfillment of the requirements for the degree of Master of Science, with a major in Environmental Engineering.
Dr. Kevin G. Robinson Major Professor
We have read this thesis and recommend its acceptance:
Dr. Gregory Reed
Dr. Chris Cox
Accepted for the Council: Dr. Anne Mayhew Vice Provost and Dean of Graduate Studies
(Original signatures are on file with official student records.)
The Effects of Temperature and Solids Retention Time on Activated Sludge Treatment Performance
A Thesis Presented for the Master of Science Degree The University of Tennessee, Knoxville
Jack McClendon Carley December 2003
Acknowledgements
I would like to begin by thanking the members of my Master’s Committee, Dr. Kevin G Robinson, Dr. Greg Reed and Dr. Chris Cox for their time and patience in anticipation and review of this work.
Additionally, I would like to extend my gratitude to Dr.
Robinson and his editorial direction in completing this work.
I would also like to thank my colleagues in their help and support in collecting data for this study; Mr. Shawn Hawkins, Mr. Jason Flowers, Mrs. Merve Oguz, Mr. Jack Parker.
Special thanks are in order to my parents Glee L. Greenwood and Dr. Thomas G. Carley. The support they provided has allowed the pursuit and achievement of this goal. I would especially like to give emphasis to the support and encouragement my mother Glee has provided during my degree work; without her undying support, fulfillment of this goal would not have been possible.
ii
Abstract A bench-scale treatment system with external clarifier was used to determine the effects of solids retention time (SRT) and temperature on treatment performance while simulating the full scale activated sludge process. Four bench-scale reactors, operating at SRTs of 20, 10, 5 and 2 days, were fed settled municipal wastewater collected after primary clarification from the Kuwahee wastewater treatment plant in Knoxville, TN. Three operational temperatures were investigated during this study, 22o C, 12o C and 7o C. The order and duration of operation at each temperature was first 22o C for 61 days, next 7o C for 47 days and lastly 12o C for 105 days. Experimental results indicate that carbon treatment performance improved, on average with increasing SRT; however, carbon treatment performance was not effected by operational temperatures studied to the same extent.
On average, carbon oxidation
improved with increasing SRT at each operational temperature; however, carbon oxidation was more efficient at 12o C than 22o C.
CODT treatment performance at 7o C
was poor irrespective of SRT. The difference in performance between 22o C and 12o C was attributed to acclimation of biomass from startup at 22o C to operation at 12o C beginning at 108 days. Sludge volume index (SVI) and effluent suspended solids (ESS) values also indicated that SRT had a greater impact on biosolids settling than did temperature. During this study, nitrification was observed to be viable at 22o C and 12o C despite reported sensitivity of lower SRTs (2 and 5 days) to process changes and low operational iii
temperature. According to these observations, higher SRTs would be recommended for full-scale
treatment
especially
during
wintertime
or
sub-optimum
temperatures.
Nitrification at 7o C was observed to be almost nonexistent for all SRTs studied during this research. Based on the data presented in this study, an SRT of 5 days and a process temperature of 12o C are necessary to achieve effective carbon treatment, biosolids settling, and nitrification. A comparison of the full and bench scale (5-day SRT) systems, based on the operational and environmental parameters considered in this study revealed inadequacies of the bench scale system in simulating the full scale facility.
Carbon treatment
performance as well as MLSS levels, differed in the two systems. The full scale facility consistently discharged significantly lower carbon levels than did the bench scale system. Additionally MLSS levels were significantly higher in the full scale facility.
Nitrification
performance was better in the bench scale system at temperatures above 12o C but were significantly poorer at 7o C. Overall, the large variability in the performance data obtained for the two systems indicated that the bench scale system did not effectively simulate the full scale facility.
iv
Table of Contents
Chapter 1.0 Introduction..................................................................................................... 1 Chapter 2.0 Literature Review............................................................................................ 4 2.1 Conventional Activated Sludge Treatment Process .............................................. 4 2.2 Municipal Wastewater Characteristics .................................................................. 7 2.3 Nitrification Process Overview.............................................................................. 9 2.3.1 Microbiology of Nitrification............................................................................. 9 2.3.2 Energy and Synthesis Pathways ....................................................................... 11 2.4 Environmental Effects on Nitrification and other Biochemical Unit Processes.. 15 2.4.1 Temperature ..................................................................................................... 15 2.4.2 Effect of Temperature on Nitrification............................................................. 17 2.5 Cold Temperature and Nitrification in Biological Wastewater Treatment ......... 21 2.6 pH and Alkalinity ................................................................................................ 24 2.7 Dissolved Oxygen................................................................................................ 27 Chapter 3.0 Materials and Methods .................................................................................. 29 3.1 System Specifications .......................................................................................... 29 3.2 Reactor Vessel ..................................................................................................... 29 3.3 Mixing System..................................................................................................... 31 3.4 External Clarifier with Scraper Arm.................................................................... 32 3.5 Influent Feed/Recycle System ............................................................................. 34 3.6 Aeration System................................................................................................... 35 3.7 Light Attenuation................................................................................................. 37 3.8 System Start Up ................................................................................................... 37 3.8.1 Reactor Seeding................................................................................................ 37 3.9 System Operation................................................................................................. 38 3.9.1 SRT Control ..................................................................................................... 38 3.9.2 Temperature Control ........................................................................................ 39 3.9.3 Dissolved Oxygen Control............................................................................... 39 3.9.4 Waste Collection/Preservation......................................................................... 40 3.9.5 Sample Collection............................................................................................ 41 3.10 Sampling and Analysis Procedures ..................................................................... 41 3.10.1 Solids Analysis.............................................................................................. 41 3.10.2 Nitrogen Analysis ......................................................................................... 43 3.10.3 Sludge Volume Index (SVI) ......................................................................... 45 3.10.4 Chemical Oxygen Demand (CODT ) ............................................................. 45 3.10.5 Alkalinity ...................................................................................................... 47 3.10.6 pH/Temperature ............................................................................................ 47 3.10.7 Dissolved Oxygen (DO)................................................................................ 47 Chapter 4.0 Results and Discussion.................................................................................. 49 4.1 COD Treatment Performance .............................................................................. 49 4.2 Solids Analysis Data ............................................................................................ 55 4.3 Biosolids Settling ................................................................................................. 63 v
4.4 Effluent Suspended Solids ................................................................................... 72 4.5 Nitrification Performance Data............................................................................ 76 4.5.1 Ammonia removal performance....................................................................... 76 4.5.2 Examination of steady state for nitrification.................................................... 81 4.5.3 Alkalinity Observations .................................................................................... 90 4.6 Examination of Full Scale Simulation Using the Bench Scale Reactor / Clarifier System............................................................................................................................ 93 Chapter 5.0 Summary and Conclusions .......................................................................... 105 5.1 Evaluation of Bench Scale Reactor Design and Operation ............................... 105 5.2 Evaluation of Carbon Treatment Performance .................................................. 106 5.3 Examination of Nitrification Performance ........................................................ 106 5.4 Evaluatio n of Bench Scale Simulation of Full Scale System............................ 107 5.5 Conclusions ........................................................................................................ 108 References ....................................................................................................................... 109 Appendices...................................................................................................................... 117 Appendix A. Full Scale Plant Data ................................................................................ 118 Appendix B. Bench Scale Data...................................................................................... 122 Vita.................................................................................................................................. 126
vi
List of Tables Table 1. General U.S. municipal wastewater characteristics. ............................................ 8 Table 2. Average wastewater temperatures measured during this treatability study. ...... 49 Table 3. Summary of CODT data during defined steady state operation at various operational temperatures. ........................................................................................... 53 Table 4. Average MLSS concentration during defined steady state operation. ............... 59 Table 5. Average percent MLVSS during defined steady state operation. ...................... 64 Table 6. Average SVI values during defined steady state operation. .............................. 68 Table 7. Average ESS concentrations during defined steady state operation. ................. 76 Table 8. Average ratio of alkalinity destroyed per ammonia oxidized expressed as mg CaCO3 / mg NH4 +-N................................................................................................... 92 Table 9. Average carbon and nitrogen values for the full scale and bench scale systems during periods of similar operating temperature. ..................................................... 103
vii
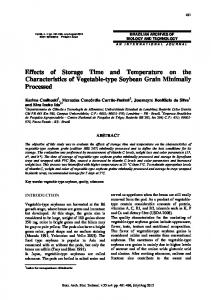
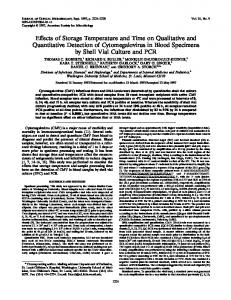
List of Figures Figure 1. Process diagram for complete mix activated sludge treatment system. ............. 5 Figure 2. Oxidation stages of nitrogen compounds in wastewater treatment .................. 12 Figure 3. Schematic landscape illustration of lab scale unit. ........................................... 30 Figure 4. A picture of the entire treatment system consisting of the reactors and clarifiers...................................................................................................................... 30 Figure 5. Effect of temperature (ranging from 22o C to 7o C) on CODT treatment performance................................................................................................................ 51 Figure 6. MLSS concentration due to changing temperature and COD concentrations throughout the treatability study. ............................................................................... 56 Figure 7. F/M ratios for each SRT studied during this bench-scale study. ...................... 61 Figure 8. Effect of temperature (22o C to 7o C) on settling performance throughout the treatability study. ........................................................................................................ 65 Figure 9. A comparison of SVI and F/M ratios for the 20-day SRT during this study. .. 70 Figure 10. A comparison of SVI and F/M ratios for the 10-day SRT during this study. 70 Figure 11. A comparison of SVI and F/M ratios for the 5-day SRT during this study. .. 71 Figure 12. A comparison of SVI and F/M ratios for the 2-day SRT during this study. .. 71 Figure 13. Effluent suspended solids (ESS) concentration throughout the treatability study. .......................................................................................................................... 73 Figure 14. Ammonia removal as a function of temperature over the course of the treatability study. ........................................................................................................ 77 Figure 15. Nitrogen speciation plot for the 20-day SRT indicating the occurance of comp lete nitrification. ................................................................................................ 82 Figure 16. Nitrogen speciation plot for the 10-day SRT indicating the occurance of complete nitrification. ................................................................................................ 84 Figure 17. Nitrogen speciation plot for the 5-day SRT indicating the occurance of complete nitrification. ................................................................................................ 86 Figure 18. Nitrogen speciation plot for the 2-day SRT indicating the occurance of complete nitrification. ................................................................................................ 88 Figure 19. Fluctuations in effluent alkalinity as a result of decreasing temperature throughout this treatability study. ............................................................................... 91 Figure 20. A plot of operational SRT for KUBs Kuwahee WWTP during this study. ... 94 Figure 21. A plot of influent temperature for KUBs Kuwahee WWTP during this study. .................................................................................................................................... 94 Figure 22. A comparison of full and bench scale (5-day SRT) influent carbon data ...... 96 Figure 23. A comparison of full and bench scale (5-day SRT) effluent carbon data during .................................................................................................................................... 96 this study. .......................................................................................................................... 96 Figure 24. A comparison of Mixed Liquor Suspended Solids for both the full and bench .................................................................................................................................... 98 Figure 25. A plot of SVI for the full and bench scale (5-day SRT) systems during this . 98 study. ................................................................................................................................. 98 Figure 26. A plot of F/M ratios for the full and bench scale (5-day SRT) systems during this study. ................................................................................................................... 99 viii
Figure 27. A plot of ammonia treatment data for both the full and bench scale (5-day 100 SRT) systems for this study. .................................................................................... 100 Figure 28. A plot of ammonia treatment data for both the full and bench scale (5-day 100
ix
Nomenclature and Abbreviations Nomenclature b pH q qmax Q Qr Qw S So Se T V X Xe Y θ or θN θc θcd θcmin µ µmax µN,max
Specific Biomass Decay Rate Hydrogen Ion Concentration Specific Substrate Utilization Rate Maximum Specific Substrate Utilization Rate Flow Rate Recycle Flow Rate Wastage Flow Rate Rate-limiting Substrate Concentration Influent Substrate Concentration Effluent Substrate Concentration Temperature (Absolute or Centigrade) Volume Cell Mass Concentration Cell Mass Concentration in Effluent Yield Coefficient Thermal Coefficient Solids Retention Time Design Biological Solids Retention Time Minimum Biological Solids Retention Time to Ensure Nitrification Specific Growth Rate Maximum Specific Growth Rate Maximum Specific Nitrifier Growth Rate Abbreviations
ASCE BOD BOD5 COD CODT DO ESS F: M HDPE HRT HVAC IC i.d. LDL
American Society of Civil Engineers Biological Oxygen Demand Five Day Biological Oxygen Demand Chemical Oxygen Demand Total Chemical Oxygen Demand Dissolved Oxygen Effluent Suspended Solids Food to Microorganism Ratio High Density Polyethylene Hydraulic Retention Time Heating Ventilation Air Conditioning Ion Chromatograph Inside Diameter Lower Detection Limit x
MGD MLSS MLVSS MST NOB NOD NPT O.D. RRNA SBR SRT SVI TKN USEPA VSS WEF WWTP
Million Gallons Per Day Mixed Liquor Suspended Solids Mixed Liquor Volatile Suspended Solids Maximum Storage Time Nitrite Oxidizing Bacteria Nitrogenous Oxygen Demand National Pipe Thread Outside Diameter Ribosomal Ribonucleic Acid Sequencing Batch Reactor Solids Retention Time Sludge Volume Index Total Kjeldahl Nitrogen United States Environmental Protection Agency Volatile Suspended Solids Water Environment Federation Wastewater Treatment Plant
xi
Chapter 1.0 Introduction Many different treatment strategies are employed for the removal of biochemical oxygen demand (BOD) and conversion of organic nitrogen (N) to nitrate from municipal wastewater before it is discharged to receiving waters.
Bacteria, cultivated in these
treatment processes, perform biological functions that utilize BOD and organic nitrogen consequently removing the target pollutants (BOD) or converting them to more innocuous forms (i.e. nitrogen).
Environmental engineers use these microbial mediated
processes as tools to remediate target pollutants from aquatic environments. Organic carbon within a wastestream creates an oxygen demand when discharged into receiving waters.
Biochemical oxygen demand is the quantity of oxygen used by
microorganisms in the aerobic stabilization of wastewaters and polluted waters.
In
wastewater engineering, BOD is frequently used to define influent and effluent characteristics and to assess treatment process efficiency (Aziz and Tebbutt, 1979). Additionally, nitrogenous compounds are important in wastewater management due to the detrimental impact of these compounds on aquatic environments (Yantarasri et al. 1992).
For example, ammonia-nitrogen (NH4 +-N) discharged ni to receiving streams
can result in oxygen depletion, eutrophication, and toxicity to aquatic life forms (USEPA 1993). Microbial utilization of ammonia is a process whereby this compound is removed from wastewater streams.
Nitrification is the biological process whereby free and saline
ammonia is oxidized to nitrite (NO2 -) and then nitrate (NO3 -) (Ekama et al. 1984).
1
Nitrifying bacteria are used to ameliorate potential anthropogenic damage to aquatic environments through reduction of ammonia in wastewater during sewage treatment. In a typical municipal wastewater environment, ammonia can far exceed the nutritional demands of microorganisms in biotreatment reactors.
Activated sludge is one
of the most common types of treatment techniques used in the removal of ammonianitrogen and BOD from a municipal waste stream (ASCE Manual No. 76).
A typical
activated sludge system is an aerobic, suspended-growth, continuous flow reactor with an external clarifier; although, many process variations exist.
External clarification allows
for recycle of settled biomass from reactor effluent, which can improve treatment performance by increasing the concentration of biosolids in the reactor. The efficiency of biologically mediated processes, such as the ones supported in activated sludge, are dependent on certain operational and environmental factors, such as solids retention time (SRT), temperature, pH, dissolved oxygen (DO) and alkalinity.
Hence the efficacy of
this wastewater treatment process is dependent on these parameters. Solids retention time (SRT) plays a large part in carbon and nitrogen removal and subsequent process control.
Solids retention time is defined as the average amount of
time that bacteria are present within the reactor.
This amount of time is controlled by
removing a calculated amount of biomass (typically new growth) from the reactor contents.
Subsequently, treatment performance can be modified by altering biomass
removal rates and therefore SRT. Temperature also plays a very important role in biological treatment.
The
temperature to which the nitrifying bacteria are exposed effects the metabolic processes involved in nitrification and the rate of growth of those bacteria. Cold temperature and 2
its negative effect on reaction rates become an important factor in ensuring efficient ammonia removal performance in wastewater treatment. Since temperature can not be controlled practically, quantification of the effect of temperature allows engineers to make process modifications to provide consistent and efficient level of treatment under less than optimal conditions. This study was part of a larger research project whose overall goal was the comparison of traditional physio-chemical methods and molecular techniques to assess treatment performance.
Such a comparison would allow for correlation of bacterial
numbers with treatment performance data. This bench scale study attempted to simulate a local, full scale municipal WWTP through the assessment of activated sludge treatment performance using traditional physio-chemical methods of analysis while investigating temperature and SRT as the main operational and environmental parameters.
The
specific objectives of this study include: 1. to develop and optimize a bench-scale reactor/external clarifier (with biosolids recycle) that simulates the nitrifying activated sludge process used in the local fullscale municipal WWTP, and 2. to evaluate bench-scale performance relative to full-scale operation and assess
the
effectiveness of the bench-scale system in simulating the full-scale process, and 3. to determine the impact of a major operational parameter (SRT), and a major environmental parameter (temperature), on carbon and nitrogen removal.
3
Chapter 2.0 Literature Review 2.1
Conventional Activated Sludge Treatment Process Bacteria have long been employed in wastewater treatment to remove organic
carbon and ammonia.
There are two basic options in biological wastewater treatment
design, attached or suspended growth systems, which promote the growth of bacteria involved in removal of anthropogenic compounds present in municipal wastewater.
The
most widely used treatment process for biological removal of nitrogenous and carbonaceous compounds is the complete mix activated sludge suspended growth process (Figure 1). In this process, the introduction of a continuous flow of wastewater is rapidly distributed, due to vigorous mixing, throughout the aeration basin.
Biological treatment
occurs while wastewater is in contact with microorganisms contained within activated sludge.
Separation of solids containing required bacteria for treatment from the
wastewater stream is achieved through clarification.
Clarification is typically achieved
through gravity separation of flocculated solids from the treated wastewater. Typical activated sludge design includes the use of a secondary clarifier. secondary clarifier offers several advantages in treatment operation.
The
First, the clarifier
provides a means to concentrate and collect the mixed-liquor suspended solids (MLSS) and recycle them back to the aeration chamber, thereby increasing the contact time between microorganisms and the wastewater.
This introduces the concept of solids
retention time (SRT) also denoted as sludge age (θc).
4
Figure 1. Process diagram for complete mix activated sludge treatment system.
Simply put, SRT is the average amount of time the bacteria exist within the aeration chamber.
Lawrence and McCarty (1970) identify SRT as a central variable in the
development of a unified basis for biological treatment design and operation. SRT is felt to be a particularly useful parameter because of its basic relationship to bacterial growth rate and the relative ease with which it can be used in design calculations and in the control of biological treatment systems (Lawrence & McCarty, 1970). For an activated sludge system without a secondary clarifier, the hydraulic retention time (HRT) would be equal to the SRT. With solids recycle, SRTs can be achieved which exceed the HRT of the system.
Therefore, solids recycle allows for the decoupling of SRT from HRT,
providing control of the residence time for the solids within the treatment system. In a complete mix activated sludge system that allows for solids recycle, time of contact between bacteria and wastewater is increased. This provides an increased chance that
5
the target compound(s) will be remeidated, and therefore increasing the efficacy of the treatment system. Secondly, the concentrated biomass in the ‘underflow’ (i.e. the recycle flow of settled solids) can be a suitable location to remove excess biomass in order to control SRT. Wastage of solids is necessary in a recycle system to avoid a build-up of biomass in the reactor and clarifier. Wastage of solids is also the means to control SRT. SRT further defined is the total amount of biomass in the treatment system divided by the total amount of biomass lost or wasted daily (Lawrence & McCarty, 1970).
While longer
SRTs provide more efficient treatment in general, maintenance of high solids concentrations can adversely affect the separation of solids from treated effluent in the clarifier resulting in an increase of effluent suspended solids.
Calculated control of
waste solids, and therefore SRT, for complete mix activated sludge is one of the more useful tools wastewater engineers employ to ensure efficient wastewater treatment. The SRT of the reactor system is directly related to the growth rate of the microorganisms involved in the treatment process (Lawrence & McCarty, 1970). With constant conditions, such as available substrate, pH, dissolved oxygen (DO) and temperature, the operation of a complete mix activated sludge system will arrive at steady state.
Steady state is an operational condition that exists when the rate of bacterial
growth and the rate of solids removal are equal, resulting in a constant concentration of biomass in the aeration chamber over time.
This operational characteristic for complete
mix activated sludge is necessary to make simplifying assumptions when determining kinetic coefficients.
6
It is also important to mention that secondary clarification can influence the microbial community structure present in the complete mix activated sludge system. Secondary clarification takes advantage of the settling characteristics of the floc (i.e. a conglomerate of bacteria).
Flocculating bacteria have a selective advantage over non-
flocculating bacteria for several reasons.
Settable flocs will be returned to the reactor
through gravity separation, whereas freely growing bacteria tend to remain in suspension, and will ultimately be lost in the effluent; thus, selecting for flocculating bacteria. Flocculation can also provide protection for bacteria from natural predators, such as protozoa, since these organisms mainly feed on freely growing cells (Eckenfelder et al, 1998).
2.2
Municipal Wastewater Characteristics Municipal
wastewater
has
general
characteristics
inherent
due
to
the
anthropogenic origin of this waste stream. The components that make up the wastewater from a community depend on the type of collection system used and may include domestic wastewater, industrial wastewater, infiltration and storm water Eddy, 1981).
(Metcalf and
Metcalf and Eddy (1991) present typical U.S. wastewater characteristics
based on the general strength of the wastewater (Table 1).
These typical wastewater
characteristics agree with other sources (Tchobanoglous & Burton, 1991 and WEF Manual of Practice No. 8, 1991) containing similar categorical information.
As can be
seen from Table 1, the values for BOD5 and COD for typical U.S. municipal wastewater range between 110 to 400 mg/L and 250 to 1000 mg/L, respectively. The nondegradable fraction of the oxygen demand is an important factor when defining treatment. Viessman and Hammer (1991) report a refractory portion of organic compounds range from 20 to 7
40%. Ekama et al. (1984) report that the unbiodegradeable particulate COD fraction is less than 10% for settled wastewater. The nitrogen speciation presented in Table 1 shows total nitrogen ranging between 20 and 85 mg/L where ammonia-nitrogen comprises approximately 60% of the total leaving 40% as organically bound nitrogen.
The presence of nitrite (NO2 -) and
nitrate (NO3 -) in untreated domestic wastewater is insignificant with respect to the total nitrogen concentration. McCarty (1970) reported NO2 - and NO3 - concentrations in raw wastewater ranging from 0 to 0.1 mg/L and 0 to 0.5 mg/L, respectively.
Table 1. General U.S. municipal wastewater characteristics. Concentration
Item Biochemical Oxygen Demand (BOD5 ) mg/L Chemical Oxygen Demand (COD), mg/L Suspended Solids Total Volatile Nitrogen (as N), mg/L Organic Ammonia Total Phosphorus (as P) mg/L Organic Inorganic Total *
Weak
Medium
110 250
220 500
100 80
220 165
8 12 20
15 25 40
1 3 4
3 5 8
adapted from Metcalf and Eddy (1991)
8
2.3
Nitrification Process Overview
2.3.1
Microbiology of Nitrification Activated sludge should be understood as an artificial living ecosystem, which is
under continuous influence of abiotic and biotic factors (Eckenfelder et al., 1998). The general health of the biomass contained within the activated sludge process is dependent on the interactions between populations of bacteria present and other environmental factors, including but not exclusive to temperature, substrate concentration, pH and dissolved oxygen concentration. According to Eckenfelder et al. (1998), activated sludge microorganisms can be segregated into two major groups, decomposers and consumers. Decomposers are responsible for biochemical degradation of polluting substances in wastewater, and include bacteria, fungi and colorless cyanophyta.
Consumers utilize
bacterial and other microbial cells as a substrate; this segment of the activated sludge population includes predator type organisms such as phagotrophic protozoa and microscopic metazoa.
Nitrifying bacteria are part of the decomposer class of
microorganisms present in activated sludge. There are two distinct, physiologically defined groups of bacteria that catalyze the two half-reactions (ammonia and nitrite oxidation) involved in nitrification (Bock et al., 1992). Nitrifying bacteria are classified as chemolithoautotrophs, a group of bacteria that derive cellular energy from oxidation of inorganic nitrogen.
Chemolithoautotrophs
assimilate inorganic carbon, present as alkalinity in aquatic systems, in the form of new cells and cellular compounds.
Sixteen species of lithoautotrophic ammonia-oxidizing
bacteria have been isolated and described (Jones et al., 1998). 9
Ammonia oxidizers comprise two groups within the class of Proteobacteria. Nitrosococcus oceanus and N. halophilus belong to the gamma (γ) subclass of the class Proteobacteria (Woese et al., 1984), while the members of the genera Nitrosomonas, Nitrosospira, Nitrosovibrio, and Nitrosolobus, as well as Nitrosococcus mobilis constitute a closely related assemblage within the beta subclass of Proteobacteria (Pommerening-Roser et al., 1996). Based on ultra-structural properties, cultivated nitriteoxidizing bacteria have been assigned to the four recognized genera Nitrobacter, Nitrospina, Nitrococcus, and Nitrospira (Juretschko et al., 1998). The specific genera of ammonia and nitrite oxidizing bacteria present is dependent on the environmental locus (Prosser, 1989). Investigation of the diversity and ecology of nitrifying bacteria in natural and engineered systems by traditional cultivation techniques has been hampered by slow bacterial growth and by the biases inherent in culture-based studies (Wagner et al, 1993). Mobarry et al. (1996) studied nitrifying microbial community populations in activated sludge and biofilm systems using 16s rRNA targeted DNA probes for phylogenetically defined groups of autotrophic ammonia- (AOB) and nitrite-oxidizing (NOB) bacteria. These experiments revealed that Nitrosomonas and Nitrobacter species occurred in clusters (i.e. flocs) and frequently were in contact within heterotrophic sludge flocs (Mobarry et al., 1996). Also very little hybridization was observed with the Nitrobacter and Nitrosovibrio-Nitrosospira-Nitrosolobus probes, indicating that their contribution to nitrification in this system was minor or that there were uncharacterized AOB present. Quantitative hybridization with oligonucleotide probes have shown that, in ammonia-rich systems like activated sludge or biofilm reactors, the dominant AOB were members of 10
the beta (β) subgroup of the Proteobacteria and, more specifically, Nitrosomonas species (Roberts and Lewis, 2001). 2.3.2
Energy and Synthesis Pathways
Nitrification is a chemolithotrophic process where nitrifying bacteria utilize energy generated from the oxidation of inorganic nitrogen (Eckenfelder and Grau, 1998). Figure 2 shows the oxidation states of various nitrogenous compounds. oxidation states correlates with more highly reduced compounds.
Lower values of Reduced compounds
have electrons that are released during oxidation in the form of hydrogen ions..
These
electrons are captured during bacterial catabolism as NADH+H+ and FADH2 for use in oxidative phosphorylation (Shuler, 1992).
The greater the reduction-oxidation potential
between substrate and end product, the more energy is available through the oxidation of that compound. As described earlier, nitrification is performed in two distinct processes by different kinds of chemolithotrophic microorganisms, ammonia oxidizing bacteria (AOB) and nitrite oxidizing bacteria (NOB).
During nitrification the oxidation state of nitrogen
incrementally changes from –3 to +5, as indicated by Figure 2.
The two-step process of
nitrification can be described by the following stoichiometric relationships:
NH4 + + 1.5 O2 → NO2 - + H2 O + 2 H+ + 250 kJ
(1)
NO2 - + 0.5 O2 → NO3 - + 75 kJ
(2)
11
Figure 2. Oxidation stages of nitrogen compounds in wastewater treatment *
adapted from Barnes and Bliss (1983)
12
Equation 1 and Equation 2 represent the separate processes facilitated by (1) AOB and (2) NOB. The free energy change (∆G) for the two reactions is –250 kJ and –75 kJ, respectively.
From these ∆G values, the first step in nitrification (ammonia oxidation)
yields approximately three times the amount of free energy compared to the second step (nitrite oxidation).
This is supported by the change in oxidation state between the
product and reactant for the two steps. The first step provides a change in oxidation state from –3 to +3, whereas the second step provides a change in oxidation state from +3 to +5.
The oxidation-reduction potential during the conversion of ammonia to nitrite is
three times greater as compared to the oxidation of nitrite to nitrate.
The difference in
oxidation-reduction potential and ∆G are relatively similar in comparison of both steps. Both the reduction-oxidation potential and free energy change illustrate that ammonia oxidation utilizes the majority of available energy from the overall process of nitrification. The stoichiometric description of the first step of nitrification, oxidation of ammonia to nitrite is somewhat of an over simplification.
This bioprocess is a
summation of two coupled biological reactions (Equations 3 and Equation 4).
NH3 + O2 +2 e- + 2 H+ → NH2 OH +H2 O
(3)
NH2 OH + H2 O + 0.5 O2 → NO2 - + 2 H2 O
(4)
These two equations illustrate the conversion of ammonia to an intermediate compound, hydroxylamine (NH2 OH).
Energetically, it is necessary to couple these
reactions due to the fact that Equation 3 is endergonic and energy is produced only in the 13
following step (i.e. the oxidation of hydroxylamine to nitrite) (Eckenfelder and Grau, 1998). Due to the complexity of ammonia oxidation to nitrite, the pathway by which Nitrosomonas metabolizes ammonia to nitrite is still speculative (Grady et al., 1980). An alternate hypothesis proposed by Grady et al. (1980) is presented as Equation 5.
NH4 + + energy → (NH2 ) → NH2 OH → NHOH → (NOH) → NO → NO2 -
(5)
The compounds in parenthesis are thought to be free radical-like intermediates, which are bound to an enzyme (Grady et al., 1980). If it is assumed that the empirical formula for the elemental composition of a bacterial cell is C5 H7 NO2 , stoichiometric relationships can be derived for theoretical cell growth for AOB and NOB (Equation 6 and Equation 7) (Gujer et al., 1974; USEPA, 1993).
15 CO2 + 13 NH4 + → 10 NO2 - + 3 C5 H7 NO2 + 23 H+ + 4 H2 O
(6)
5 CO2 + NH4 + + 10 NO2 - + 2 H2 O → 10 NO3 - + C5 H7 NO2 + H+
(7)
Through the combination of energy and synthesis equations presented previously, overall
synthesis-oxidation
equations
can
be
concluded
using
measurements of yields and oxygen consumption for AOB and NOB.
representative The overall
synthesis-oxidation relationships are presented by Equation 8 and Equation 9 for Nitrosomonas and Nitrobacter, respectively (USEPA, 1975).
14
55 NH4 + + 76 O2 + 109 HCO3 - → C5 H7 NO2 + 54 NO2 - + 57 H2 O + 104 H2 CO3
(8)
400 NO2 - + NH4 + + 4 H2 CO3 + HCO3 - + 195 O2 → C5 H7 NO2 + 3 H2 O + 400 NO3 -
(9)
The overall synthesis-oxidation reaction for the entire nitrification process is presented by Equation 10 (USEPA, 1993).
NH4 + + 1.83 O2 + 1.98 HCO3 - → 0.021 C5 H7 NO2 + 1.04 H2 O + 0.98 NO3 - + 1.88 H2 CO3
(10)
In these equations, yields for Nitrosomonas and Nitrobacter are 0.15 mg cells / mg NH4 +-N and 0.02 mg cells / mg NO2 --N, respectively. On this basis, the removal of 20 mg/L of ammonia nitrogen would yield only 1.8 mg/L of nitrifying organisms (USEPA, 1993). Such low yields can prove to be problematic when adverse conditions limit bacterial metabolism.
These low biomass yields provide, in part, a basis for
sensitivity of the nitrification process.
2.4
Environmental Effects on Nitrification and other Biochemical Unit Processes
2.4.1
Temperature It is a well-known fact that nitrification is a temperature-sensitive process that can
be affected by seasonal temperature variations (Harremoes et al., 1998; Sinkjaer et al., 1996; USEPA, 1993; Tendaj et al., 1992; Ford, 1980). Knowledge of the favorable range 15
for some environmental parameters, i.e., dissolved oxygen (DO), pH, etc., may be utilized directly in optimizing a treatment process.
However, seasonal variation of
temperature is not an environmental factor that can be directly controlled in most activated sludge systems (Sharma et al., 1976). Bacteria generally flourish in an environment, which meets certain prerequisites for growth.
Temperature is one of those prerequisites.
Autotrophic and heterotrophic
bacteria involved in biological wastewater treatment can be generally classified, based on growth as a function of temperature, as mesophilic.
This stems from the origin of the
bacteria, which are from the digestive tract of humans (heterotrophic) and other soilborne bacteria (autotrophs).
Mesophilic bacteria grow best in temperate environments
between 20 and 50o C, as compared to psycrophiles and thermophiles, which prefer colder (50o C) conditions, respectively (Shuler, 1992).
However the
nitrification process has been observed over a range of temperatures from approximately 4o C to 45o C (USEPA, 1993). The overall optimum temperature reported for growth of nitrifying bacteria appears to be in the range of 28 - 36o C with some variation in reported range of values.
The Manual for Nitrogen Control published by the USEPA (1993)
reported a temperature growth optimum for Nitrosomonas as being about 35o C and an optimum growth range for Nitrobacter as 35 – 42o C.
These values were originally
presented by Buswell et al., (1954); Deppe and Engle, (1960) and Laudelout and Van Tichelen, (1960).
Grunditz and Dalhammar (2001) isolated and characterized, with
respect to temperature, Nitrosomonas and Nitrobacter from a nitrifying activated sludge from a large wastewater treatment plant in Stockholm. characterized with respect to temperature.
The test organisms were
The highest activity was found at a 16
temperature of 35o C for Nitrosomonas and at 38o C for Nitrobacter. These values agree with the optimum temperature ranges for nitrification presented by the U.S. EPA, (1993). Full-scale WWTPs are exposed to temperature variation from seasonal changes, wind exposure and influent wastewater (Jansen et. al., 1992).
In northern climates,
significantly greater SRTs are required for complete nitrification in winter than are necessary during summer (Sharma et. al., 1976).
This illustrates the point that cold
process temperatures are unavoidable or even commonplace for some treatment plants, thus constituting an operational difficulty.
Understanding temperature effects on
biological wastewater treatment, environmental engineers can avoid potential process failure through appropriate design and operational changes.
Correcting kinetic constants
for low or sub-optimum process temperatures redefines the minimum operating SRT (θcmin ) and subsequently the design SRT (θcd).
There is a pronounced decrease in
nitrification at temperatures below 18o C with little nitrifier growth occurring below 5o C (Ford, 1980).
Conversely, at higher temperatures Barritt (1933) found that the thermal
death point of a pure culture of Nitrosomonas was between 54 and 58o C. 2.4.2
Effect of Temperature on Nitrification It has been shown that temperature effects the kinetics of nitrifier growth and
substrate utilization rates. microbial population.
There are five main kinetic parameters which describe a
These kinetic parameters are the maximum specific growth rate
(µmax), maximum specific substrate utilization rate (qmax), saturation constant (K S), the yield coefficient (Y) and the microbial decay rate (b). The following discussion reviews
17
literature findings on the effect of temperature on these kinetic coefficients with respect to nitrification. Maximum specific growth rate, µN,max The maximum specific growth rate is a commonly reported parameter in quantification of microbial growth. In some of the earliest studies observing temperature effects on nitrification, Downing et al. (1964) reported that the growth rate constant roughly doubles for each 10o C increase in temperature in the range of 7o C to 25o C. Knowles et al. (1965) observed an increase in maximum specific growth rate for Nitrosomonas was 9.5% per degree Centigrade, and 5.9% increase per degree Centigrade for Nitrobacter.
Srna & Baggaley (1975) measured the effect of rapid temperature
changes on nitrification reactions via batch studies on a marine nitrifying filter system. The results revealed that a 4o C increase in temperature caused about a 50% increase in the rate of nitrification, and a 1o C drop caused a 30% decrease when compared with calculated values at 21.3o C. Jenkins et al. (1967) reported a 3% increase in growth rate for a 10o C increase in temperature.
In a laboratory experiment, Painter and Loveless
(1983) observed a 4-8% increase in the rate of nitrification per degree Centigrade. Sozen et al. (1996) reported that net growth for nitrifiers was highly variable within a range of 0.24-0.52 d-1 , with an average value of 0.38 d-1 . At 10o C, the net growth rate was observed to drop to 0.14 d-1 , ranging from 0.10-0.17 d-1 , which showed less variation than at 20o C. Considering a practical temperature range (< 30o C), temperature optima for growth are rarely encountered in municipal wastewater treatment. However operation at 18
cold temperatures result in slow growth rates of nitrifying bacteria hindering treatment performance especially with respect to ammonia oxidation. Maximum specific substrate utilization rate, qN,max There is a direct relationship between the maximum specific substrate utilization rate and the maximum rate of growth.
This equation represents a linear relationship
between these two maximum rates via a proportionality constant (the growth yield coefficient).
Therefore theoretically qmax and µmax should have the same response to
temperature.
Other references also documented suppressed rates of ammonia oxidation
with decline in temperature (Stark, 1996; Jansen, 1992; Wong-Chong et al., 1978). For heterotrophic activity, the maximum substrate utilization rate was found to increase with increases in temperature in both aerobic and anaerobic biological systems (Novak 1974). Tchobanoglous and Schroeder (1985) suggest a theta (θ) value of 1.047 for BOD temperature corrections. Saturation Constant, KS Early work by Downing et. al. (1964) reported an equation from estimation of a trendline from a log-normal plot of KS versus temperature. This research is included in USEPA Process Design Manual for Nitrogen Control (USEPA 1993). Temperature correction for the saturation constant is not normally reported due to its assumed consistency over a practical range of temperatures; however, the modified Arrhenius temperature correction coefficient, θ, derived from Equation 16 was found to be 1.12.
In addition, in aerobic systems, heterotrophic KS increased as temperature
19
increased, whereas, in anaerobic systems, heterotrophic KS decreased with an increase in temperature (Mines 1999). Endogenous decay coefficient, b The endogenous decay coefficient for nitrification, bN, was found to vary with temperature, approximately doubling with a 10o C increase in temperature (Mines and Sherrard, 1999). Also as indicated by some researchers (Argaman, 1995; Benefield and Randall, 1980), the endogenous decay coefficient for nitrification varied with temperature according to a modified Arrhenius equation over the temperature range 15 to 25o C. The heterotrophic endogenous decay coefficient, bH, was also seen to vary with temperature. Argaman (1995) presented a modified-Arrhenius equation for modeling the effect of temperature on bH for single-sludge activated sludge model. Collins and Grady (1978) cited literature (Muck and Grady, 1974; Mennet and Nakayama, 1971; Topiwala and Sinclair, 1971) presented a similar increase in heterotrophic endogenous decay with increasing temperature.
A graph of microbial decay versus temperature for literature
cited by Collins and Grady (1978) illustrated a 1.5, 1.6 and 3.3 fold increase in the decay rate for a 10o C increase in temperature. The temperature response depicted by the graph was linear. Yield Coefficient, Y Since observed yields are related to the true growth yield by a function containing the decay rate and SRT the observed and subsequently the true growth yield will display a maximum value with respect to temperature.
20
Benefield and Randall (1980) presented data that showed the yield coefficient for nitrification is generally independent of temperature over the temperature range from 15 to 25o C. Collins and Grady (1978) compared four sets of data from literature pertaining to the temperature dependency of heterotrophic growth yield, YH. The data suggest that there is a maximum in growth yield near 20o C.
Due to the discontinuous nature of
growth yield over a practical temperature range (< 30o C) makes temperature correction using the Arrhenius equation impractical.
Mines and Sherrard (1999) cited a literature
review performed by Characklis and Gujer (1979) who reviewed heterotrophic yields from several literature sources.
Randall et al. (1992) determined from bench-scale fully
aerobic activated sludge systems that the yield coefficient, 0.41-mg VSS/ mg COD, was relatively constant over a temperature range of 10 – 20o C.
This literature review
indicated that the biomass yield is constant over a relatively wide range for many microorganisms and substrate.
2.5
Cold Temperature and Nitrification in Biological Wastewater Treatment Nitrifying bacteria are known to be sensitive to temperature (Barnes and Bliss,
1983). Since the rate of nitrification (which is strongly temperature dependent) typically governs design and operation of an activated sludge WWTP, and SRT which prevents nitrifier washout is required. This identifies the SRT as the main dimensioning parameter for treatment plants, and the cold and changeable winter temperatures at the plants constitute the most serious operational problem encountered (Jansen et. al., 1992). Jansen (1992) published observations on activated sludge nitrification at four Danish municipal wastewater treatment plants, documenting typical winter temperatures 21
of 5-10o C with values as low as 2o C and up to 9o C during the same winter. Additional temperature variations occurred from year to year.
Jansen (1992) also notes that
temperature variations are more likely to be explained by variations in the structure of the sewer system and catchment area, and the construction of the treatment plant. Ilies and Mavinic (2001) studied the effect decreased ambient temperature on biological nitrification of high ammonia landfill leachate using a 4-stage Bardenpho process.
They observed no effect on nitrification performance as the temperature was
lowered from 20o C to 14o C incrementally. However, stable nitrification was lost when the temperature was lowered to 10o C resulting in nitrification efficiencies between 10 and 30% (Ilies and Mavinic, 2001). low operating temperature.
Nitrification inhibition was attributed primarily to the Ilies and Mavinic (2001) also suggest that longer
acclimatization periods for the nitrifying biomass coupled with smaller step decreases in temperature may be helpful in determining critical points for nitrification and suggest methods to prevent process failure. Rostron, Stuckey and Young (2001) also observed a small decrease (10%) in nitrification when process temperature was lowered from 25 to 16o C in a comparative study of immobilisation media to enhance nitrification of high strength ammonia wastewater. Biological
nitrogen
removal
at
low
temperatures
was
considered
highly
questionable, some sources reported that below 5o C the process of nitrification ceases, both in suspended growth (Anon, 1974) and in attached growth (Pano and Middlebrooks, 1983) systems. However Tendaj et al. (1992) reported that when temperature remains constant at a low level over a long period of time, nitrification gradually increases. These researchers, monitoring Swedish activated sludge systems, documented a sudden process 22
temperature drop from 14 to 12 o C.
Due to the sudden drop in temperature the
nitrification rate subsequently fell to 2.0 g N/kg VSS.h. During the two months following this drop in temperature, temperature remained constant at 12o C and the rate of nitrification rose to 2.7 g N/kg.VSS.h. This 30% rate increase was due to the ability of the bacteria to adapt to a lower temperature (Tendaj et.al., 1992).
The rate after
adjustment to 12o C was the same rate as that observed at 16o C. Hoilijoki et al. (2000) studied the effect of low temperatures on nitrification for anaerobically pretreated landfill leachate using the activated sludge process.
This study
was designed to evaluate the use of carrier plastic as a means of ensuring process stability.
The laboratory experiment without carrier plastic revealed at a loading rate of
0.027 g NH4 +-N MLVSS-1 d-1 and a HRT of 3 days, complete nitrification was observed at 10o C. At 7o C and a loading rate of 0.023 g NH4 +-N MLVSS-1 d-1 ammonia removal was only 93%. At 5o C and a loading rate of 0.011 g NH4 +-N MLVSS-1 d-1 only 61% ammonia removal was observed, while the activated sludge reactor with carrier plastic achieved complete ammonia removal. Oleszkiewicz
(1988)
studied
the
effect
of
low
nitrification/denitrification using sequencing batch reactors (SBRs).
temperatures
on
This study revealed
that the response to the decrease in temperature was discontinuous. Oleszkiewicz (1988) reported a more pronounced effect of temperature on nitrification from 2 – 7o C; due to this fact, a modified Arrhenius equation was used to describe both portions of the temperature curve.
The temperature correction factors calculated on either side of the
discontinuity (@ 7o C) were θN = 1.02 (15 to 7 o C) and θN = 1.40 (7 to 2 o C). However, Oleszkiewicz (1988) did document the feasibility of nitrification down to 2o C for SBRs 23
although steady 90% nitrification efficiency at 2o C could only be accomplished at SRT beyond 30 days accompanied by a significant decrease in the F: M load. Hoilijoki and coworkers (1999) performed a bench-scale study observing effects of low temperature on nitrification in activated sludge (with and without carrier plastic) treating anaerobically pretreated municipal landfill leachate.
The temperature regime
consisted of 149 days at 10o C then 21 days at 7o C and finally 16 days at 5o C. At 10o C, complete ammonium removal was obtained in both reactors with volumetric loading rate of 0.05 g NH4 +-N l-1 d-1 , ammonium loading rate up to 0.02 g NH4 +-N g MLVSS-1 d-1 and HRT down to 2.7 days. The decrease of temperature to 7o C was accompanied by a slight increase in effluent NH4 +-N concentration. However, over 93% ammonium removal was obtained at 7o C with similar loading rates and HRT as at 10o C. Ammonium removal in the activated sludge reactor was only partial at 5o C with a removal rate of 61% (effluent NH4 -N concentration 10–35 mg l-1 ). Hoilijoki suggested that this was due to change in sludge quality at the end of the study period, a conclusion arrived at through visual observation.
2.6
pH and Alkalinity Biological processes are effected by the pH of the surrounding environment.
In
wastewater treatment, biological mediated processes are subject to a wide range of pH fluctuation.
Reactor pH conditions have been found to have a significant effect on the
rate of nitrification (USEPA, 1993).
Early work by Downing et al. (1964) measured
nitrifying activity (as opposed to growth rate) in activated sludge as a function of pH. Those researchers showed that activity was fairly flat topped between pH values 7.5 – 8.5 with little or no activity below pH 6.5 and above pH 10. Painter and Loveless (1983) 24
reported pH optimum between 7.5 – 8.0, although in one experiment at 16o C, the highest growth rate was achieved at pH 8.5. Also at pH 6.5 the growth rate constant was between one third and two thirds of the maximum with no nitrification occurring below pH 6.0. Groeneweg et al. (1994) reported similar pH effects on ammonia oxidation at ammonia concentrations near Ks. Maximum rate of ammonia oxidation was obtained between pH 7.5 – 8.0 with the rate being fairly consistent between pH of 6.7 and 9.0. Between pH 6.0 – 6.7 the activity dropped sharply while some activity was recorded at pH 11.0. Groenweg et al. (1994) noted similar results to previous research by Prakasam and Loehr (1972) who showed that ammonia oxidation is possible up to pH 11.2.
The USEPA
(1993) cites research by Poduska and Andrews (1975) who show a significant deterioration of nitrification from a sudden pH shift from 7.2 to 5.8.
Poduska and
Andrews (1975) observed rapid improvement in ammonia oxidation when pH was returned to 7.2, resulting in the conclusion that the effect of pH is only inhibitory and non-toxic.
Watson et al. (1989) reported pH range for growth of pure cultures of
ammonia oxidizers is 5.8 to 8.5 also noting that nitrification was inhibited below pH 5.8 from preliminary experiments performed with an enriched culture of nitrifiers obtained from wastewater. Princic et al. (1998) cites work from DeBoer et al. (1989) and Walker and Wickramasinghe (1979) who show that in natural environments, such as soil, nitrification has been observed at pH below 4.0. This is supported by other studies that show where wastewater treatment systems have acclimated to low pH producing successfully nitrified effluent (Hoilijoki, 2000). Even though the growth rate for nitrifying systems is effected by pH, research on the effect of pH on the saturation constant, KS, showed relatively consistent values over a 25
typical pH range for wastewater treatment.
Neufeld et al. (1980), referenced by
Groeneweg et al. (1994), obtained a constant KS for free NH3 of 0.152 mg/L NH3 over a pH range from 7 to 9. Jones and Morita (1985) also demonstrated the consistency of KS over a practical range of pH. Jones and Morita (1985) grew a marine Nitrosomonas sp. at 5o C at varying pH values reporting a KS for free NH3 decreased slightly from 0.014 mg/L NH3 -N at pH 7.8 to 0.011 mg/L NH3 -N at pH 6.8. Conversely previous work by Drozd (1976) reported a decrease of KS for free NH3 from 0.22 mg/L NH3 at pH 9 to 0.07 mg/L as NH3 at pH 6 for a batch culture of N. europaea. Laudelout et al. (1976) reported a similar trend where KS for NH3 was 1.15 mg/L NH3 -N at pH 8 and 0.04 mg/L NH3 -N at pH 6. When discussing nitrification and pH, alkalinity is an important factor to consider. Nitrification is carried out by chemoautotrophic bacteria, which utilize inorganic carbon for growth. The majority of inorganic carbon in water exists as dissolved carbon dioxide, H2 CO3 (carbonic acid), and the subsequent deprotinated species, HCO3 - (bicarbonate) and CO3 2- (carbonate). The sums of these carbonate species that can accept a proton (HCO3 and CO3 2-) are defined as alkalinity.
Alkalinity is a typical measure of the buffering
capacity of water measured in mg/L of CaCO3 (calcium carbonate). It can be shown that over a pH range of approximately 5 to 8 in an aqueous biological reactor, the equilibrium pH of the reactor will be dictated by the amount of alkalinity and CO2 present in the system (USEPA, 1993).
Recall from Equation 8 that stoichiometrically the theoretical
alkalinity consumption is 7.1 mg (as CaCO3 ) per mg of ammonia-nitrogen oxidized. The majority of alkalinity consumed is due to acidification caused by oxidation of ammonia to nitrate.
There is also uptake of aqueous carbon dioxide for autotrophic biomass 26
synthesis; however the amount of alkalinity consumed is relatively small due to slow nitrifier growth rates. Alkalinity can also be ol st through stripping in aerated systems and should be accounted for in full-scale system design (USEPA, 1993).
2.7
Dissolved Oxygen It has been shown previously that the total oxygen requirements in a biological
system are related to the oxygen consumed to supply energy for synthesis and the oxygen consumed for endogenous respiration (Eckenfelder, 1970).
This assumes that oxygen
must be supplied to the system in order to satisfy the following demands: (1) biological organic removal, (2) endogenous respiration where cells lyse and release soluble oxidizable organic compounds, (3), chemical oxidation as measure by the immediate oxygen demand, and (4) ammonia which is oxidized to nitrate (Adams, 1978). Based on stoichiometry (Equation 10), the theoretical oxygen utilization for ammonia oxidation is 4.57 mg O2 required per mg ammonia-nitrogen oxidized (USEPA, 1993).
However,
these observations have been questioned (Sharma, 1976; Churchwell, 1980), on the basis that a small amount of oxygen is produced in the process of protoplasm synthesis. Investigation by Wezernak and Gannon (1967) based on 120 bottle BOD studies, concluded that 3.22 mg O2 is required per mg NH3 -N oxidized to NO2 --N, and that 1.11 mg O2 is required per mg NO2--N oxidized to NO3 --N.
Based on this study, the total
observed oxygen demand for oxidation of NH3 -N to NO3 --N is 4.33 mg O2 per mg NH3 N.
The concentration of DO has a significant effect on the rates of nitrifier growth and
nitrification in biological waste treatment systems (USEPA, 1993).
Using the Monod
equation to model growth of Nitrosomonas with DO as the growth limiting substrate concentration, values for the half-saturation coefficient have been reported as 0.15 – 2.0 27
mg/L O2 (USEPA, 1993). Stenstrom and Song (1991) studied oxygen limitation on the nitrification process in activated sludge concluding that the values of DO at which nitrification is limited can be between 0.5 to 2.5 mg/L in either suspended or attached growth systems under steady state conditions.
Also a high solids retention time was
suggested to ensure nitrification at low DO levels.
Furthermore Stenstrom and Song
(1991) reported that under transient conditions of organic shock loading, diffusional resistance and heterotrophic/nitrifier competition can increase the limiting DO value significantly.
Hanaki et al. (1990) also reported similar findings.
As suggested by
Ekama et al. (1984), the wide range of values for the saturation coefficient with respect to DO probably has arisen because the concentration of DO in the bulk liquid is not necessarily the same as inside the biological flow where the oxygen consumption takes place.
Consequently the value will depend on the size of floc, mixing intensity and
oxygen diffusion rate into the floc. For these reasons it is not really possible to establish a generally applicable minimum oxygen value (Ekama et al., 1984). Temperature, SRT, pH and DO are important parameters in optimizing the activated sludge process.
This
study will investigate temperature and SRT effects on bench-scale operation using municipal wastewater from the community in an attempt to simulate treatment performance at the local full-scale WWTP.
28
Chapter 3.0 Materials and Methods 3.1
System Specifications The treatment system used during this bench-scale study was modeled after the
Kuwahee wastewater treatment activated sludge system.
This facility incorporates six
nitrification activated sludge reactors, with a total volume of 31040 cubic meters, in the treatment process.
Following aeration, the mixed-liquor flows by gravity into five 41.2
meter diameter circular final clarifiers.
The settled nitrifying sludge is returned to the
aeration tanks via a biosolids wet well.
The bench-scale treatment system has been
designed to simulate overall operation in the aeration basins and secondary clarifiers of the full-scale facility.
3.2
Reactor Vessel Figure
3
depicts
the
laboratory
scale
activated
sludge
system.
reactor/clarifier combination was one of four systems used during the study. utilization of four reactors allowed for simultaneous operation at differing SRTs.
The The Figure
4 shows all four reactors which comprise the entire treatment system. Each reactor vessel was constructed from 25.4 cm (10”) diameter acrylic tubing with 0.635 cm (¼”) thick sidewalls for the mid-section and 1.27 cm (½“) acrylic plating for the top and bottom. The bottom plate was routed so the cylindrical midsection fit snugly to ensure proper adhesion of the two pieces and also to prevent leakage of the reactor contents. The bonding of the midsection to the bottom plate was accomplished using an acrylic adhesive and a proper seal was insured through the application of silicone caulk on the 29
Figure 3. Schematic landscape illustration of lab scale unit.
Figure 4. clarifiers.
A picture of the entire treatment system consisting of the reactors and
30
interior of the vessel at the seam between the midsection and the bottom plate. The top plate was also routed to provide a proper fit and was secured to the reactor vessel by four kurneled posts and wing nuts running from the bottom to the top plate. The top plate was ported to allow the insertion of various probes and to prevent pressurization of the interior headspace due to aeration. The reactor was ported for gravity overflow of the contents to the external clarifier.
The elevation along the cylindrical sidewall of the
reactor vessel for the gravity overflow port was chosen to provide a 10-liter operational volume for the vessel. A clear polypropylene fitting with 1.27 cm (½”) NPT tread and 1.27 cm (½”) hose barb was installed into the treaded port. To monitor clogging of the exit port, a clear fitting was used for ease in visual inspection of solids build-up. The gravity overflow allowed the mixed-liquor to flow into a 1.27 cm (½”) T-connector, providing atmospheric pressure equalization, before exiting the system via 1.27 cm (½”) clear tubing vertically downward to the external clarifier.
3.3
Mixing System The activated sludge process is a suspended-growth culture of microorganisms
existing within a continuous flow regime.
The mixing of the 10-L reactor vessel was
achieved using a magnetic stir plate. The use of a mechanical means to mix the reactor contents was deemed necessary due to the insufficient amount of mixing provided through aeration at low air flow regimes.
A 38.1 cm (15”) square Thermolyne
magnetic stirrer was used to provide adequate mixing and a stable base to support the reactor. A 7.6 cm (3 in.) long, 1.27 cm (½”) diameter Teflon-coated stir bar was used as the impeller.
The mixing intensity was gauged visually through the movement and
distribution of the flocs within the reactor. The dial, which controls the speed of the stir 31
bar, was set at approximately ½ speed. The stir plates were typically set to approximately one-half their maximum setting of 1000rpm, which corresponds to a power output of 15 watts.
Parker (2002) presented a calculation which showed that the reactors utilized
during this study were completely mixed.
3.4
External Clarifier with Scraper Arm The external clarifier was a necessary part of the bench-scale treatment system in
order to simulate biosolids recycle at the full-scale municipal WWTP.
The full-scale
facility utilizes five final clarifiers with dimensions of 41.2 meters in diameter and 3.7 meter water depth, which operate in parallel. With an average daily flow of 151416 m3 /d, the HRT for each full-scale final clarifier is approximately 3.85 hours. However, for the bench-scale system, a fixed flow rate of 19 mL/min was used in order to meet the hydraulic parameters for the reactor vessel. At this fixed flow rate, the required volume of the final clarifier for the bench-scale system would be 4.6 L to meet the 3.85-hour retention time at the full-scale plant.
To keep the clarifier volume reasonable, a lower
HRT (2.2 hr) was chosen. This HRT was thought to be sufficient to provide adequate time for biomass settling. The flow rate and HRT established the working capacity of the clarifier at 2.5 liters. Lab Glass, a commercial glass blowing company, constructed each external clarifier per the following design. The upper cylindrical midsection was 15.2 cm (6 in.) in diameter with a 0.952 cm (3 /8 in.) O.D. port to provide gravity overflow of the clarified effluent. The placement of this port fixed the operational volume of the clarifier at 2.5 L The conical midsection was specified to be 53o in pitch to the horizontal. The final cylindrical section was to be 3.8 cm (1 ½ in.) long and 0.952 cm (3 /8 in.) O.D. to adapt to the tubing which would recycle the settled biosolids back to the reactor. 32
The other component of the clarifier was a scraper arm which was used to facilitate settling of the MLSS and to prevent adhesion and growth of bacteria on the sidewalls of the clarifier. This scraper arm assembly consisted of several parts; a scraper arm, a small motor and an acrylic housing for these components. The scraper arm was composed of a stainless steel wire approximately 3 mm (0.118 in.) in diameter fitted with a Triple-Edge wiper blade. The wiper blade had a hollow annular space permitting the wire to be inserted. The wiper blade was necessary to provide good contact between the scraper arm and the interior of the glass clarifier.
This scraper arm was attached to a
fitting using a small setscrew and fixed to the drive shaft of a 3-rpm electric motor. The motor was mounted to 0.635 cm (¼ in.) thick acrylic plate which measured 17.8 cm (7 in.) square with a routed circular groove to provide a secure fit to the top of the clarifier. A 15.2 cm (6 in.) cylindrical acrylic upper portion was bonded to the motor mount plate. This provided partial protection from any electrical hazards and protected the cooling fan on the motor from any contact that might cause damage. After this design was employed, several changes (including the use of a slower motor and a timer) were made to the clarifier assembly.
The 3-rpm motor operating
continuously provided excess mixing in the clarifier, thus hindering MLSS settling. Therefore, a 1-rpm motor was chosen to reduce the speed of the scraper arm as it swept the clarifier walls. In order to impart as little mixing in the clarifier as possible, a timer was installed and set to turn the motor on for 30 seconds at 5 minute intervals. These changes were sufficient to prevent adhesion of solids to the walls of the clarifier.
The
other changes made to the clarifier were in the alteration of the constructed glass vessel. The conical midsection of the clarifier was drawn down from 53o to approximately 70o 33
pitch to the horizontal. This provided a greater slope to the clarifier bottom that aided in the collection of solids needed to provide efficient recycle.
The 0.952 cm (3 /8 in.)
cylindrical section following the conical section was replaced with a 7.6 cm (3 in) long and 3.18 cm (1 ¼ in.) diameter cylindrical section of glass tubing. This piece was welded onto the newly drawn conical midsection creating a reservoir for the collection of the solids from the reactor overflow. The addition of this piece and the newly drawn conical section increased the clarifier volume from approximately 2.5 L to 2.7 L which subsequently increased the HRT of the clarifier from 2.2 hours to 2.4 hours. All changes described were applied to each individual bench-scale system before any treatment performance data were collected.
3.5
Influent Feed/Recycle System Influent wastewater was collected after primary clarification from the Kuwahee
WWTP and stored in a 378.5 L (100 gal.) reservoir. Wastewater was drawn from the reservoir tank using a common 0.952 cm (3 /8 in.) i.d. Tygon tube feed line connected to a digitally controlled Cole-Parmer peristaltic pump. The pump had four peristaltic pump heads attached to the main drive. The common feed-line was split into four separate feed lines (one for each reactor). These individual feed lines were also 0.952 cm (3 /8 in.) i.d.. Tygon tubing similar to the common feed line. The split flow resulted in a flow rate of 19 mL/min into each reactor vessel.
Each individual feed line was attached to a 90o
elbow fitting screwed into the upper portion of the posterior side of the reactor vessel. This wastewater feed then passed through an identical fitting on the interior of the reactor which allowed for the wastewater feed to drip into the reactor. Without this second 90o elbow, the wastewater feed would run down the interior sidewall into the reactor. To 34
prevent hydraulic short-circuiting, it was necessary to introduce the feed more toward the center of the reactor. The recycle flow regime was similar to the influent feed system. The recycle line leading from the bottom of the clarifier passed through a peristaltic pump identical to that described for the influent feed system.
However, each individual recycle line passed
through a peristaltic pump head and was directly connected to the reactor feeding that specific clarifier. Therefore, solids collected from each bench-scale system were pumped directly back into that system. The recycle flow rate was set at 19 mL/min providing a recycle ratio of 1.
3.6
Aeration System Since the activated sludge process is aerobic, the supply of air is an integral
component of the system. During this work, four activated sludge reactors were operated at an excess level of dissolved oxygen with respect to nitrification (D.O. ≥ 2.0 mg/L). Therefore, an efficient and constant supply of oxygen to the treatment system was needed.
A compressed air supply, available at the research facility, was used as the
oxygen source. Since the pressure provided in the house air line is approximately 70 psi, a section of reinforced tubing was needed to connect the house air to a regulator to step down the pressure.
After passing through a pressure regulator, the house air was then
humidified before being fed into the reactors.
Air humidification was accomplished by
using a 20 L polypropylene carboy containing approximately 5 L of water with the air supply directed through a stainless steel tube that was submerged in the water.
After
passing through the water column in the carboy, the air exited through the top of the carboy. The assembly at the top of the carboy consisted of an air-tight rubber stopper 35
which fit inside of a screw cap with an opening for two stainless steel tubes; one submerged in the water column (inlet) and one that was not submerged (outlet). After the air exited the humidification chamber, it was directed through a flow manifold with a common inlet and four separate outlets.
The common inlet fed the air through four
separate flow tubes, each of which was dedicated to an individual reactor. Each flow tube gave a direct readout of the airflow passing through each individual tube (in cm3 /min).
This corresponded to the flow of air entering the reactors.
Small aluminum
valve cartridges provided adjustment of the air flow rate and a spherical glass float in the flow tubes provided a direct read measurement of the quantity of air entering the reactors. A dead leg was also installed before the air entered the flow manifold to collect any moisture that would condense on the inside of the tubing that supplied the air to the flow manifold. The dead leg was clamped during normal operation; however, the clamp was released daily to blow out any moisture that collected during that days operation. After the air had been regulated, humidified, and flow controlled, it was split and fed into each reactor via two air lines coupled to 15.2 cm (6 in) long cylindrical aquarium style air diffusers. These air diffusers were chosen for the fine bubbles they produced; however, the nominal pore size was not defined by the vendor for these tubes making it difficult to determine mass transfer levels.
However, the flow manifold in combination with the air
diffusers allowed for the coarse control of the dissolved oxygen concentration in the reactors.
This level of control was sufficient to maintain excess levels of dissolved
oxygen (≥ 2.0 mg/L) in the mixed-liquor.
36
3.7
Light Attenuation The attenuation of light was important so as not to facilitate the proliferation of
phototropic organisms present in the activated sludge, such as algae. The reactors were operated in a windowless darkroom although fluorescent lighting was available.
These
lights remained off except for periods of sampling or reactor maintenance.
3.8
System Start Up
3.8.1
Reactor Seeding The activated sludge added to the aerated, continuous flow, reactors was collected
from the Kuwahee Municipal WWTP. A modified version of the Monod equation was used to estimate start-up MLSS concentrations.
Using “typical” values for municipal
wastewater treatment, the calculated MLSS concentrations for the 20, 10, 5 and 2 day SRT reactors were 2328, 1552, 931 and 423 mg/L. An ample amount of mixed-liquor was collected from the waste activated sludge feed to the final clarifier at the Kuwahee Municipal WWTP.
All reactors required the dilution of the collected mixed-liquor
except for the 20-day SRT reactor which required concentrating the mixed-liquor to achieve the appropriate concentration.
Concentration the mixed-liquor was achieved by
allowing the collected sludge was allowed to settle before a specific volume of clear water was decanted from the vessel.
Supernatant removal resulted in a higher
concentration of MLSS. The four reactors were seeded on September 28, 1999.
37
3.9
System Operation
3.9.1
SRT Control Four bench-scale systems were operated in parallel at a different SRTs (20, 10, 5
and 2-days) over the duration of this study. The upper end of this range (20 and 10 day SRT) was more representative of the SRT used at the full-scale WWTP, whereas the 2and 5-day SRTs were included to stress nitrification performance. Solids retention time relates the quantity of microbial solids in an activated sludge process to the rate of biomass lost in the effluent and withdrawn in the waste sludge (Viessman and Hammer 1993). The equation used to calculate SRT is presented here as Equation 18.
θc =
VX Q w X + (Q − Q w ) X e
(18)
Various methods of controlling the SRT in each of the reactors had been considered. Due to the small volumes utilized in the bench-scale system, a pump could not be employed to remove MLSS at a specified wastage rate as traditionally done in many full-scale facilities. Instead, MLSS were wasted directly from the aeration tank on a daily basis. Various wastage methods were tested to control SRT including wasting an average amount from the reactors daily, wasting a volume of the reactor contents based on the previous days solids analysis, and daily wastage from all four reactors based on a solids analysis for that day.
The method that provided the highest level of control was
daily wastage from all four reactors based on the solids analysis for that day.
Solids
analysis is discussed in further detail later in this chapter. Having determined MLSS and 38
effluent suspended solids (ESS) for that day, the wastage flow rate, Qw was determined. The 2-day reactor required wastage volumes almost equal to one half of the total volume of the reactor.
To minimize the probability of removing the microorganisms at a rate
faster than they can reproduce, half of the wastage volume was removed during the morning and the other half removed during the afternoon for the 2-day reactor. 3.9.2
Temperature Control Since temperature was a key variable in this work, proper temperature control was
important. The reactors were operated at 3 different temperatures during this study, 22, 12 and 7o C. To provide appropriate temperature control, the reactors were operated in a constant temperature room with a digitally controlled HVAC unit to maintain a set temperature within the room. 3.9.3
Dissolved Oxygen Control The dissolved oxygen concentration was controlled using an air flow meter.
As
discussed in the section describing the aeration system, the air introduced into the reactors was controlled by individual air flow meters which provided a direct readout of the air flow rate into the reactors.
A DO probe was used to periodically check the
dissolved oxygen levels in the reactors and, if necessary, adjustments in the air flow rate were made to maintain an adequate DO concentration in the reactors.
The DO
concentration was maintained above 2.0 mg/L to minimize adverse effects on nitrification.
39
3.9.4
Waste Collection/Preservation Influent municipal wastewater was collected from the Kuwahee WWTP
approximately every four days.
Two 208.2 liter (55 gallon) drums were filled with
wastewater (after primary clarification) using a ½ horsepower sump pump. were then transported to the laboratory and stored at 5o C.
The drums
In order to maintain the
continuity and homogeneity of the wastewater, the contents of the drums were pumped into a 378.5 liter (100 gallon) HDPE closed dome tank and mixed. Initially mixing of the wastewater was accomplished using periodic operation of a 1/3 horsepower mixer with a shaft driven impeller. This mixer was mounted on a custom made cap fitted with a 5.1 cm (2”) NPT bung hole. The cap was attached at the top of the tank so that the shaft of the mixer would extend vertically downward into the contents of the 378.5 liter tank. However, the mixing intensity using this mixer was too great to provide moderate recirculation of the wastewater during storage. The mixing was so intense that headspace oxygen was imparted to the wastewater and some degradation of BOD occurred during storage.
In order to homogenize the tank contents without aerating, a small electric re-
circulation pump was used. However, the pump had a horizontal intake that directed the wastewater vertically upward causing problems when the volume of influent wastewater in the holding tank was low.
Therefore, the re-circulation pump was fitted with a T-
connector on the outlet so the flow leaving the pump would not breach the surface of the wastewater in the tank.
This eliminated the possibility of aeration of the wastewater
before being fed to the reactors, and also adequately blended the holding tank contents.
40
3.9.5
Sample Collection Sample collection was performed every one to two days. The types of analysis
performed to record reactor performance are presented in the following sections of this chapter.
In general, the performance of the bench-scale system during operation was
contingent on several variables.
The documented data for each reactor include solids,
nitrogen, alkalinity, and chemical oxygen demand analysis.
There was a limit to the
number and frequency of tests performed due to costs and available resources. there are some diagnostic parameters which were not analyzed.
Thus,
However, an adequate
amount of data was recorded to present a fairly comprehensive study on temperature effects on nitrification in activated sludge.
3.10 Sampling and Analysis Procedures 3.10.1 Solids Analysis
Mixed Liquor Suspended Solids (MLSS) Daily analysis of the MLSS concentration was required for the maintenance of SRTs for each of the four systems.
The MLSS samples were analyzed according to
Standard Method 2540-D (Total Suspended Solids Dried at 103-105o C) (APHA, 1998). The procedure for the collection of samples was specific for the bench-scale system constructed for this research.
Initially, the effluent drainage port on the reactors was
plugged while the influent pump was turned off.
The recycle pump flow rate was
increased until all the solids from the secondary clarifiers were pumped into the reactors. This step was performed to ensure that all the solids present in the entire system were in the reactor vessels during sampling.
The recycle pump, aeration system, and stir plates 41
were then turned off and the solids in the reactor vessel were allowed to settle somewhat. After the solids settled, the reactors were unplugged and the clear supernatant was allowed to decant into the clarifiers. The aeration and stir plates were turned back on to resuspend the solids in each reactor; however, both the feed and recycle pumps remained off. Once the solids were resuspended, the mixed-liquor sample was then collected. A predetermined sample volume of mixed-liquor was removed from each reactor to provide an accurate measurement of MLSS concentrations. Mixed Liquor Volatile Suspended Solids (MLVSS) In an effort to better quantify the microbial fraction of the MLSS in each reactor, Standard Method 2540-E (Fixed and Volatile Solids Ignited at 550o C) was conducted daily (APHA, 1998). Special filters preprepared for the determination of VSS were used during the determination of MLSS. Filters containing dried suspended solids were placed in a small muffle furnace and ignited (550o C) for a minimum of 15 minutes. Effluent Suspended Solids (ESS) The effluent suspended solids, unlike the MLSS, were determined through the use of a 24-hour composite sample.
Effluent obtained over 24 hours of operation was
collected in a 20 L polypropylene carboy.
The carboy containers were stirred to
homogenize the composite sample before pumping approximately 300 to 400 mL of effluent into an Erlenmeyer flask.
Samples were then filtered through 0.45-micron pre-
weighed filters. Care was taken to wash any solids that may have adhered to the filtration flask onto the filter. These samples were analyzed according to Standard Method 2540-D (Total and Suspended Solids Dried at 103-105o C). 42
3.10.2 Nitrogen Analysis The speciation dynamics of nitrogen during operation of the bench-scale treatment systems was integral in the evaluation of environmental changes on nitrification treatment performance.
For this reason, several species of nitrogen were
analyzed over the course of this study. Ammonia (NH4 +) Ammonia, the substrate compound for ammonia oxidizing bacteria, was measured on a daily basis for each reactor system. Ammonia samples were taken from the effluent ports on the external clarifiers for each treatment system.
The influent ammonia sample
was drawn directly from the 378.5 L holding tank. A 100 mL sample was collected in an small 150-mL Erlenmeyer flask, which also served as the container in which the analysis was performed. These flasks were stoppered and allowed to come to room temperature (approximately 30 minutes) before analysis using an ion selective electrode (Orion Model # 95-12).
Before each analysis the probe was calibrated to a set of freshly prepared
standards (50, 5, 0.5, and 0.1 ppm NH4 + as N). Additionally, a quality control sample was prepared. Calibration for the ammonia probe was a point to point fit to minimize any error due to the non-linearity of the response over the range of ammonia concentrations used during the calibration. sheet.
The probe readings were documented on a data analysis
The analysis for ammonia in water and wastewater is referenced as Standard
Method 4500D, Ammonia Selective Electrode Method (APHA, 1998).
43
Anion Sampling and Analysis The biological transformation of ammonia produces distinct nitrogen compounds. The first is nitrite (NO2 -) which is an intermediate compound before the second transformation to the nitrate (NO3 -) end product. Measurement of nitrite and nitrate was determined using ion chromatography. The grab sample taken in the 150 mL Erlenmeyer flask was used to draw 5 mL of sample into a sterile 10-mL lure-lok syringe. A small Acro-disk 0.45 µm syringe filter was then attached to the syringe and the sample filtered into labeled 5-mL vials, fitted with special caps, for processing using the autosampler on the ion chromatograph. Processing the anion samples falls within certain EPA guidelines for preservation, if the samples are not to be run shortly after collection.
For nitrite and nitrate the
preservation technique is to simply cool the aqueous sample to 4o C and store for no longer than 48 hours before analysis. This protocol was followed during operation of the ion chromatograph (IC).
However, technical difficulties were experienced with the IC
during this study. During this down time samples were stored at 4o C, but for periods up to 28 days. After the instrument was repaired, a few anion samples were analyzed both immediately after collection and at storage times up to 28 days. Little change in sample concentration was measured over time. The anions NO2 - and NO3 - were analyzed using ion chromatography. Standards were prepared within a range encompassing the expected concentration commensurate for each analyate. These ranges consisted of 0.1 mg/L to 40 mg/L as N for nitrate and 0.1 mg/L to 20 mg/L as N for nitrite.
44
Standard Method 4110.B references the method of analysis of these anions, Ion Chromatography with Chemical Suppression of Eluent Conductivity (APHA, 1998). The analysis was performed using a Dionex DX500 Ion Chromatogram with an AS40 Dionex Auto-sampler. The minimum detectable concentration of an anion is a function of sample size and conductivity scale used.
According to Standard Method 4110 B,
minimum detectable concentrations are near 0.1 mg/L for NO3 - and NO2 - with a 100 µL sample loop and a 10 µS/cm setting on the conductivity detector. The output data from the IC was in the form of area for individual peaks, which represent the change in conductivity during the elution of the specific anion. The area for the analyate was used to determine concentration through calibration of the IC. 3.10.3 Sludge Volume Index (SVI) SVI typically is used to monitor settling characteristics of activated sludge and other biological suspensions. The SVI was determined using Standard Method 2710 D, Sludge Volume Index (APHA, 1998). One liter of MLSS was pumped, using a peristaltic pump, from a reactor into a 1 L graduated cylinder.
The contents of the graduated
cylinder were completely mixed to ensure an initially homogeneous mixture. volume of biosolids was assessed after 30 minutes.
The settled
Using the settled volume and the
MLSS concentration, the SVI was obtained. 3.10.4 Chemical Oxygen Demand (COD T) Chemical Oxygen Demand is the oxygen demand exerted on a wastewater by oxidizable organic matter.
The CODT test employed during this research measured the
total amount of oxidizable organic matter in a sample. The quantification of treatment 45
efficiency with respect to CODT removal was performed by analysis of common influent grab samples and composite effluent from each of the four reactor systems. The influent and effluent samples collected did not undergo filtration to remove suspended colloidal or inert solids, thus the subscript ‘T’ in CODT is used for this reason. The samples were preserved in concentrated sulfuric acid (H2 SO4 ) at a ratio of 2-mL H2 SO4 per 100-mL sample.
This preservation technique is accepted by the USEPA and suggested by
Standard Methods (APHA, 1998).
The samples were collected in sterile 15 mL
centrifuge tubes and preserved with 30 µL of sulfuric acid.
After acidification, the
samples were stored at 4o C until analysis ( 150 mL/g, respectively (Grady et al., 1999). SVI data for this study are presented in Figure 8. During start-up operation (22o C), SVI values for each SRT were excellent (below 80 mL/g). However, after one week, SVI values increased dramatically for the 10-, 5and 2- day SRTs, however, SVI values for the 20-day SRT remained in the moderate range. During the initial period of operation, before the perturbation event, the 5- and 2day SRT system SVIs followed similar trends of increase reaching maximum values of 1212 mL/g (day 15) and 1468 mL/g (day 17), respectively. The 10-day SRT system also experienced a similar increase in SVI (maximum 715 mL/g on day 21).
The 20-day
reactor reached a maximum SVI of 135 on day 17 during initial operation, which proved to be good compared to the other maximum SVI values observed during initial operation. Settling improved in all reactors during the period of high strength wastewater feed (day 23 to day 36).
By day 40 of operation, SVI values for the 10-, 5- and 2-day SRT
achieved minimum values of 43, 150 and 133 mL/g, respectively. These minimum SVI values occurred approximately 17 days after the introduction of high strength wastewater.
64
Figure 8. Effect of temperature (22o C to 7o C) on settling performance throughout the treatability study.
65
However, improved settling characteristics were not maintained once the wastewater feed returned to normal strength.
There may be a relationship between increasing SRT and
improved settling of mixed-liquor during reactor start-up (i.e. biosolids acclimation). The increase in wastewater strength was a major factor, which impacted recorded SVI values. This impact was observed to increase with decreasing SRT. This increase in wastewater strength can be translated into an increase in organic loading or F/M ratio.
The F/M
ratios for each SRT were determined to identify if this may have influenced biosolids settling. The F/M ratio maintained in the aeration tank can be used to define the operation of an activated sludge system (Viessman and Hammer, 1993; Krishna and Loosdrecht, 1999). As discussed previously, low SRTs, where microorganisms are in the exponential growth phase, the F/M ratio is high. This creates an environment which favors dispersed growth and poor biomass settling.
Higher organic loading can also lead to higher ESS
concentrations through the bulking phenomena (Churchwell et al, 1980). However, when the F/M ratio is low (high SRTs), metabolic activity is considered to be in the endogenous phase of growth.
Although the rate of metabolism is low, degradation of
organic substrate is nearly complete during this stage and microorganisms flocculate rapidly and settle out of solution by gravity. Thus, SRT can be an indicator for proper biosolids settling.
During 22o C operation, the F/M ratio (based on solids steady state
periods) increased for the 20 and 10-day SRTs from 0.247 and 0.438 mg CODT /mg MLVSS/day to values of 0.470 and 0.690 mg CODT /mg MLVSS/day during the high strength wastewater perturbation. While the 5 and 2-day SRTs had lower F/M ratios (0.895 and 1.689 mg CODT /mg MLVSS
.
day) during the perturbation as compared to 66
steady state operation (0.901 and 2.02 mg CODT /mg MLVSS
.
day) at 22o C.
This
suggests that the low SRTs were already experiencing high organic loading which contributed to poor biosolids settling.
The F/M values for steady state and the
perturbation for the 5-day SRT are relatively close, which does not explain the improvement in settling between these two periods.
Churchwell et al (1980) prevented
sludge bulking and associated settling problems by controlling organic loading at an approximate level of 0.2 kg COD applied per day per 0.5 kg MLVSS (0.4 mg CODT /mg MLVSS . day). Since settling efficiency can vary with SRT, a two-sample t-test analysis was conducted to assess the impact of SRT on biosolids settling.
With the 20-day SRT
achieving the best settling characteristics out of all SRTs studied, the 20-day SRT was compared to the 10, 5 and 2-day SRTs at 12o C. 12o C was chosen due to the efficient settling observed at all SRTs and therefore eliminating possible disturbances, which may provide inaccurate results. The average SVI values for the 20 and 5-day SRT reactors for the 12o C steady state time periods were found to be statistically similar for a confidence interval of 95%. No statistical similarity was found between the 20-day SRT steady state SVI values and the 10- and 2-day data during 12o C. However, the SVI values between the 10- and 5-day SRT systems were found not statistically different for a confidence interval of 95% by the two-sample t-test assuming unequal variances.
These findings
indicate that longer SRTs (low F/M ratios) promote more efficient settling.
Similar
results were found by Parker (2001) when conducting a bench-scale experiment on DO and SRT effects on activated sludge performance.
67
The change in temperature from 22o C to 7o C was accompanied by a dramatic decrease in the SVI values for the 2-day SRT (Table 6). The SVI values before the temperature decrease were poor for the 2- and 10-day SRT reactors. Whereas after the temperature decrease, the 10-day SRT reactor SVI values remained poor but the 2-day SRT reactor SVI values improved. The 5-day SRT reactor SVI values increased to poor levels within a week after the temperature change.
During reactor operation at 7o C, a
mixing pump was installed in the influent reservoir in order to homogenize the wastewater, denoted by a dotted line (day 79). From inspection of Figure 7, both the 10 and 5-day SRTs improved dramatically after installation of the influent mixing pump. For the remainder of 7o C operation, one more fluctuation in SVI was observed in the 20, 10 and 5 day SRTs, with the 10-day SRT being the most pronounced. SVIs for all SRTs were excellent after the change in temperature from 7o C to 12o C.
Good settling
continued for the duration of the study. SVI values for each SRT and F/M ratios are plotted over time to illustrate the effect of F/M ratio on sludge settlability (Figures 9 through 12). The SVI and F/M ratios measured for the 20-day SRT were constantly low during the entire course of this study. Table 6. Average SVI values during defined steady state operation. Reactor
22o C Operation SVI, ml/g
20-day θc 10-day θc 5-day θc 2-day θc
81.6 349.0 521.0 857.0
Std. Dev., ml/g 26.6 243.0 438.7 457.6
7o C Operation SVI, ml/g 94.0 371.0 144.9 102.0
Std. Dev., ml/g 45.8 111.6 86.1 150.7
12o C Operation SVI, ml/g 51.1 54.8 52.0 68.8
Std. Dev., ml/g 9.3 8.8 14.1 21.0
68
Also, the F/M ratios measured for the 10-, 5- and 2-day SRT were expectedly higher than the 20-day SRT since the magnitude of the F/M ratio is SRT dependent as can be observed in Figures 9 through 12. The SVIs for the 10-, 5- and 2-day SRTs were poor during start-up (22oC operation) and temperature considerations during 7o C may have contributed, in part, to the continuation of poor settling at these SRTs. However, SVIs in the 10-, 5- and 2-day SRTs achieved levels denoting excellent settling. This was in spite of drastically different F/M ratios measured during the latter part of operation.
The
excellent settling in combination with low F/M ratios observed in the 20-day SRT supported settling theory identified in literature and also reinforced observed trends in SVI as improving with increasing SRT (lower F/M ratio).
However, SVIs at all SRT
during the final stage of operation were excellent, denoting that reactor acclimation, apart from F/M ratios, was also an important factor in achieving a proper settling sludge. Since the literature indicated that settling performance is a function of temperature, a two-sample t- test was performed on all SRTs for each temperature studied during this research. The 20-day SRT average SVI values for 22o C and 7o C operation were not statistically different at a confidence interval of 95% where average SVI values for 22o C and 12o C were statistically different at a 95% confidence interval. Also, using the two-sample t-test, the 20-day SRT system steady state SVI values collected at 7o C and 12o C were not statistically different for a 95% confidence interval. This correspondence was also identified for the 10-, 5- and 2-day SRT reactors.
Also,
independently the 10- and 5-day SRT reactor steady state SVI values were not statistically different for a 95% confidence interval for data collected at 22o C and 12o C. The 10-day SRT system average steady state SVI values were not statistically different at 69
Figure 9. A comparison of SVI and F/M ratios for the 20-day SRT during this study.
Figure 10. A comparison of SVI and F/M ratios for the 10-day SRT during this study. 70
Figure 11. A comparison of SVI and F/M ratios for the 5-day SRT during this study.
Figure 12. A comparison of SVI and F/M ratios for the 2-day SRT during this study. 71
a confidence interval of 95% between 22 and 7o C operation. The 5-day SRT reactor did not show statistical similarity for average SVI values when temperature regimes were compared.
However, the 2-day SRT average steady state SVI values for 7o C and 12o C
were not to be statistically different at a confidence interval of 95%, where a comparison of SVIs between 22 and 7o C and between 22 and 12o C were determined to be statistically different at a confidence interval of 95%. Krishna and Loosdrecht (1999) determined that temperature effected SVI in a sequencing batch reactor treatment system.
At a temperature of 15o C, an SVI of 110
ml/g was measured whereas at a temperature of 25o C, an SVI of 200 ml/g was noted. The researchers concluded that solids settlability, expressed as SVI, strongly decreased with increasing temperature, and that biosolids settleablity in systems with a low SRT was significantly influenced by temperature, with an increased SVI at higher temperature. The determined statistical similarity of average SVI values did not follow an identifiable trend with respect to SRT or temperature. However, the consistent improvement of SVI during the course of this study indicate that biomass acclimation, not temperature or SRT, is the determining factor for low SVIs.
4.4
Effluent Suspended Solids In the activated sludge process, it is necessary to separate the treated wastewater
from the biomass, thereby producing a clear effluent (Fuchs and Staudinger, 1999). The effluent suspended solids (ESS) values reflect external clarifier performance as well as settling characteristics of the biosolids. The ESS data show that overall external clarifier performance of the final design model was satisfactory (Figure 13).
After initial testing
72
Figure 13. Effluent suspended solids (ESS) concentration throughout the treatability study.
73
of the custom external clarifier, several design changes were made to improve performance.
The major changes included an increased diameter underflow collection
area to prevent bridging of collected solids and improve sludge thickening.
Also, the
addition of a mechanical scraper arm proved useful in preventing attached growth on the inner vertical walls and in facilitating the movement of settable solids to the biosolids underflow port.
The design changes were made before start-up and operation of
treatment systems used in this study. useful and successful.
Based on the ESS data, the changes did prove
The increased underflow port provided more room for solids
compaction which seemed to aid in return sludge flow. The scraper arm did prevent large amounts of solids from adhering to the clarifier wall; however, minor adjustments in the shape and angle of the scraper arm were made to ensure proper contact between the clarifier wall and the scraper arm.
Quiescent conditions within the clarifier were
maintained during scraper arm operation; however, periodical manual cleaning was necessary to remove solids attached to the scraper arm assembly itself.
Proper clarifier
performance was integral in stable operation of the bench-scale treatment system. During this study, ESS data display several high discharge events that correlated with changes in operational conditions (Figure 13). These events were characterized by an increase in ESS for all reactor systems. However, for the majority of operation the ESS was below 45 mg/L, the maximum daily discharge limit for KUB’s Kuwahee WWTP.
During initial operation at 22o C, ESS values for all SRTs were excellent;
however, concentrations increased during the high strength wastewater event for the entire system. During this perturbation, the peak ESS values for the 20-, 10-, 5- and 2day systems were 55.4, 113.1, 96.7 and 158.9 mg/L, respectively.
These high ESS 74
concentrations were attributed to the explosion of biological growth that accompanied the high-strength wastewater. ESS values dropped well below the 45 mg/L target after the perturbation (day 40) with occasional exceptions during 22o C operation. The temperature shift from 22o C to 7o C was accompanied by an increase in ESS within 3 to 4 days after the temperature shift for all SRTs. The 20-, 10-, 5- and 2-day SRT systems reached ESS concentrations of 77, 57, 56 and 62 mg/L, respectively, after the temperature change. Whereas, the ESS values the day of the temperature shift were 11.5, 21.5, 24.5 and 21.2 mg/L for the 20-, 10-, 5- and 2-day systems, respectively. ESS concentrations returned to values below 30 mg/L within a day or two after the event and remained within EPA guidelines (< 30 mg/L on average) throughout the remainder of 7o C operation. However, there was a second increase in ESS during 7o C operation which corresponded with the installation of the influent feed recirculation pump on day 79. Although ESS levels fluctuated during 7o C operation, steady state values remained near or below the 30 mg/L effluent discharge level for each SRT (Table 7). Effluent SS levels were also impacted by the second temperature shift (7o C to 12o C) on January 13, 2000 (day 108).
ESS concentrations increased to maximum levels within approximately 3 to 4
days of the temperature change but quickly dropped to low levels. This temporal trend was similar for each ESS event identified.
75
Table 7. Average ESS concentrations during defined steady state operation. Reactor
20-day θc 10-day θc 5-day θc 2-day θc
22o C Operation ESS, mg/L 14.6 34.1 30.5 16.6
Std. Dev., mg/L 10.5 44.3 19.4 5.7
7o C Operation ESS, mg/L 30.6 19.9 16.0 24.8
4.5
Nitrification Performance Data
4.5.1
Ammonia removal performance
Std. Dev., mg/L 25.1 13.3 13.6 12.0
12o C Operation ESS, mg/L 20.1 13.5 18.7 12.6
Std. Dev., mg/L 17.9 5.3 12.1 6.4
Ammonia removal was quantified as the difference between influent and effluent ammonia (mg/L NH4 +−N) concentrations.
Complete ammonia removal was achieved
when the effluent ammonia concentration was less than 0.1 mg/L, a restriction that represented the detection limit of the ammonium ion selective electrode.
Operational
influent and effluent ammonia data are presented here in Figure 14. The average influent ammonia concentration, neglecting the perturbation, was 23.3 ± 1.3 mg/L as N (± represents standard deviation at 95% confidence interval about the mean for the following discussion) at 22o C. Complete ammonia removal was observed at 20-, 10- and 5-day SRT systems directly after initial startup. The 2-day SRT reactor, however, did not achieve complete ammonia removal until after the perturbation (day 39). During the perturbation, the average ammonia concentration was 41.6 ± 3.6 mg/L as N.
This constitutes approximately a two-fold increase in the influent ammonia
concentration.
76
Figure 14. Ammonia removal as a function of temperature over the course of the treatability study.
77
During this time period, the effluent ammonia concentrations were 2.1 ± 3.1, 5.8 ± 5.8, 7.7 ± 6.2 and 18.1 ± 7.2 mg/L as N for the 20-, 10-, 5- and 2-day SRT systems. This increase in wastewater strength was accompanied by a loss in ammonia treatment efficiency, which varied according to SRT.
The corresponding ammonia removal
efficiencies during the perturbation were 95.7 ± 6.4, 87.8 ± 12.2, 83.9 ± 12.9, and 59.2 ± 13.8 percent, for the 20-, 10-, 5- and 2-day SRTs, respectively. Stable operation for the 20-day SRT system was reestablished within four days after the event had occurred. Both the 10- and 5-day SRTs regained efficient ammonia removal within five days after the perturbation, whereas the 2-day SRT reactor required an additional 10 days before stable operation was reestablished.
All SRTs achieved
stable operation (complete ammonia removal (< 0.1 mg/L as N)) at 22o C from day 39 to day 60, constituting 22 days of stable ammonia removal at 22o C. The influent ammonia concentration during this time frame was 27.7 ± 2 mg/L as N. The first temperature shift (to 7o C) occurred on day 62. Within twelve hours after the temperature adjustment, the reactor contents were at 7o C.
The decrease in
temperature was accompanied by a loss in ammonia removal efficiency. A reduction in ammonia treatment occurred rapidly and within 3 days of the temperature shift, near influent ammonia concentrations were measured in the effluent at each SRT.
The
average influent ammonia concentration during 7o C operation was 19.8 ± 1.8 mg/L-N. Corresponding average effluent ammonia levels were 16.0 mg/L as N (20-day), 14.9 mg/L as N (10-day), 17.3 mg/L as N (5-day) and 17.7 mg/L as N (2-day). Resulting
78
average ammonia removal efficiencies for the 20-, 10-, 5- and 2-day SRTs at 7o C were 18, 23, 11 and 9 percent, respectively. Although nitrate data was not available during the entire study, effluent nitrate data available during 7o C operation (day 86 to day 102) revealed that some nitrification was occurring.
Average nitrate levels were 7.83 mg/L (20-day), 7.25 mg/L (10-day),
6.28 mg/L (5-day) and 7.25 mg/L (2-day) on day 86.
By day 102, nitrate levels
decreased to below detection levels. The decline in nitrate was accompanied by a similar decline in influent ammonia concentration.
During 7o C operation, dilute wastewater was
collected from the Kuwahee WWTP on day 101 for use as the influent feed for the bench-scale system.
This low strength wastewater seemed to exacerbate the poor
removal efficiencies already observed.
Negative ammonia removal efficiencies were
recorded during the dilute wastewater feed period at all SRTs.
This phenomenon was
ascribed to the process of ammoniafication which occurs when organically bound nitrogen is converted to ammonia during heterotrophic carbon utilization.
The
accumulation of ammonia in the effluent in excess of the influent ammonia concentration was reflected by negative ammonia removal efficiencies. The temperature shift from 7o C to 12o C occurred on day 107.
After this increase
in temperature, ammonia removal improved for all SRTs; however, the speed of recovery varied according to SRT.
The average influent ammonia concentration during 12o C
operation was 18.2 ± 1.3 mg/L-N.
Complete ammonia removal was achieved in the 20-,
10-, and 5-day SRT reactors on day 121, day 129 and day 142, respectively. The 2-day SRT did not achieve consistent effluent ammonia concentrations below 0.1 mg/L-N before system shutdown (day 213); however, from day 182 until system shutdown the 279
day SRT averaged 90 ± 3 % ammonia removal efficiency. This time frame constituted the most efficient removal for the 2-day SRT during 12o C operation. Complete ammonia oxidation was not anticipated in the 2-day reactor, since this SRT approaches the minimum value required for complete ammonia oxidation. A number of studies have indicated that temperature can have a major impact on ammonia removal during activated sludge treatment. There is a pronounced decrease in nitrification at temperatures below 18o C with little autotrophic growth occurring below 5o C (Ford, 1980). McClintock et al. (1992) showed partial ammonia removal at an SRT of 1.5 days at 20o C and 5 days at 10o C. High degrees of nitrogen removal (60-70%) were achieved at 20o C for all SRTs of 2.7 days or more. Greater removals were achieved at a 15-day SRT than at a 5-day SRT for all temperatures (McClintock et al., 1992).
Since it
has been documented that little or no nitrification occurs at or below 5o C, it was anticipated that effective ammonia removal would not occur at the low temperature (7o C) portion of this study.
However, Tendaj et al. (1992) reported that when temperature
remains constant at a low level over a long period of time, nitrification gradually increases.
Hoilijoki et al. (2000) studied the effect of low temperatures on nitrification
for anaerobically pretreated landfill leachate using the activated sludge process and found that at a loading rate of 0.027 g NH4 +-N/MLVSS/day and an HRT of 3 days, complete nitrification was possible at 10o C. The researchers found that at 7o C and a loading rate of 0.023 g NH4 +-N/MLVSS/day, ammonia removal was only 93%, and that at 5o C and a loading rate of 0.011 g NH4 +-N/MLVSS/day, only 61% ammonia removal was observed. Oleszkiewicz (1988) studied the effect of low temperatures on nitrification/denitrification using sequencing batch reactors (SBRs) and found that the response to a decrease in 80
temperature was discontinuous. A more pronounced effect of temperature on nitrification was reported for the temperature range between 2–7o C. The author did document the feasibility of nitrification down to 2o C for SBRs although steady 90% nitrification efficiency at 2o C could only be accomplished at an SRT above 30 days accompanied by a significant decrease in the F/M load. 4.5.2
Examination of steady state for nitrification Steady state operation with respect to nitrification was indirectly determined
through a measured reduction in influent ammonia concentration.
As discussed in the
previous section, nitrogen data were not complete during the entire duration of this study. However, certain operational time frames were identified where complete ammonia removal was determined. Figure 15 presents the nitrogen speciation plot for the 20-day SRT over the entire duration of this study. During 22o C operation, influent NH4 +-N and effluent NO3 --N concentrations were quite similar. The average nitrate concentration for the 20-day SRT system was 26.4 ± 4.5 mg/L as N. For the time period during which nitrate data was available (day 1 to day 28), the corresponding average ammonia concentration was 25.8 ± 4.2 mg/L as N. Average nitrate concentrations were located within the 95% confidence interval for average ammonia concentration suggesting that complete nitrification did occur.
On
several occasions, the average nitrate level was greater than the average ammonia concentration.
As discussed previously, this phenomenon was attributed to the
conversion of organic nitrogen (which is not measured by the ion selective probe) to nitrate after nitrification. Neglecting the perturbation in wastewater strength, steady state 81
Figure 15. Nitrogen speciation plot for the 20-day SRT indicating the occurance of complete nitrification.
82
operation with respect to nitrification for the 20-day SRT reactor was marked from day 1 to day 22 and from day 39 to day 60. During 7o C operation, ammonia removal was consistently poor over the entire length of operation.
Data collected during the latter part of low temperature operation
showed that a moderate amount of nitrate was present (day 86 to day 95) indicating partial nitrification.
Nitrate levels subsequently decreased and negative removal
efficiencies were recorded during the period of low strength wastewater feed (day 104 to day 109).
The build up of ammonia in the effluent to concentrations greater than those
measured in the influent was attributed to ammoniafication. No steady state was reached during operation at 7o C. Complete ammonia removal was reestablished at 12o C within 3 days after the temperature was increased (day 111). With the exception of day 119, effluent ammonia levels were below the detection limit (0.1 mg/L-N) during 12o C operation. Nitrate data provided additional evidence that complete nitrification was reestablished by day 129. Effluent nitrate-N and influent ammonia-N were in close proximity after this date indicating steady state operation from day 129 to day 207. Figure 16 presents the nitrogen speciation plot for the 10-day SRT system. The average nitrate concentration during 22o C operation was 23.0 ± 3.7 mg/L as N whereas the average ammonia concentration was 27.4 ± 2.6 mg/L as N. Initial operation showed that complete nitrification had occurred based on low effluent ammonia (0.1 mg/L NH4 +N) and effluent nitrate concentrations which were similar to influent ammonia nitrogen. Nitrite was detected in small amounts during the perturbation event; however, effluent nitrate-N and influent ammonia-N levels were also in similitude after the perturbation 83
Figure 16. Nitrogen speciation plot for the 10-day SRT indicating the occurance of complete nitrification.
84
(beginning on day 23).
Based on the period of complete nitrification before the
perturbation and the period of complete ammonia removal after, the 10-day SRT system steady state operation was set from day 1 to day 20 and from day 37 to day 60 during 22o C operation. Much like the 20-day SRT system, nitrification performance decreased drastically after the temperature was lowered to 7o C.
The average ammonia removal
efficiency during 7o C operation was 23.4% (based on ammonia-N removal) indicating poor ammonia-N removal. No steady state was reached at this operational temperature. Operation at 12o C proved to be successful. The period of acclimation was similar to that of the 20-day SRT reactor. Effluent nitrate concentrations steadily climbed to levels similar to those measured for influent ammonia.
Effluent ammonia concentrations
returned to levels below detection shortly after the temperature increase.
Nitrate data
suggests that steady state was not reached until day 133. During the period of nitrifier recovery, nitrite was detected in the effluent (day 129 and day 136). Based on this data, steady state was set between the days of 137 and 207. Figure 17 presents the nitrogen speciation plot for the 5-day SRT. The average effluent nitrate concentration during the first three weeks of 22o C operation was 21.0 ± 3.1 mg/L-N while the average ammonia concentration was 27.4 ± 2.6 mg/L-N. Nitrite was detected at levels of approximately 1 mg/L as N from day 5 to day 9, days 14 and 15 and days 18 through 21. During the third week, effluent nitrate-N and influent ammoniaN levels were essentially the same indicating complete nitrification.
After the
perturbation on day 23, effluent ammonia data (below detection limit) suggest that complete nitrification was reestablished. Based on the data available, steady state was set from day 37 to day 60. 85
Figure 17. Nitrogen speciation plot for the 5-day SRT indicating the occurance of complete nitrification.
86
Nitrification was very poor during operation at 7o C for the 5-day SRT reactor.
The
average effluent ammonia concentration was 17.3 ± 1.7 mg/L-N while the average influent ammonia concentration was 19.8 ± 1.8 mg/L-N. This level of ammonia removal (≈ 2.5 mg/L-N) could be attributed to cellular synthesis and reproduction.
However,
based on the nitrate data collected from day 86 to day 102, it appears that a minimal level of nitrification did occur. Nitrate levels dropped below detection levels during the latter part of 7o C operation indicating that nitrification ultimately ceased at this temperature. Operation at 12o C for the 5-day SRT reactor showed a slower recovery of nitrification than the 10- and 20-day SRT reactors.
From day 109 to day 141, the
ammonia-N level decreased to below the detection limit (0.1 mg/L-N). During this same time period, effluent nitrate concentrations rose steadily reaching values in close proximity to influent ammonia concentrations.
This one month acclimation period
illustrated the slow reactivation or reintroduction of nitrifiers under these conditions. Oleszkiewicz and Berquist (1988) also encountered a gradual population shift in biomass during temperature changes.
Gaudy and Gaudy (1980) showed that prolonged
low temperature causes both psycrophilic and psycrotrophic organisms to reach an optimum population mix; however, the role of these type of bacteria are not well understood. In this research, complete nitrification was reestablished in the 5-day SRT reactor and steady state for 12o C operation was designated from day 143 to day 203. Figure 18 presents the nitrogen speciation plot for the 2-day SRT reactor over time. During the initial 22-day operational period at 22o C, the average effluent ammonia concentration in the 2-day SRT reactor was 3.6 ± 1.3 mg/L-N while the average influent
87
Figure 18. Nitrogen speciation plot for the 2-day SRT indicating the occurance of complete nitrification.
88
ammonia concentration was 20.8 ± 1.1 mg/L-N. efficiency of 83.8 ± 5.6 percent.
This represents an average removal
The average effluent nitrate concentration during the
initial 22-day period was 8.1 ± 2.0 mg/L-N; however, the nitrate level decreased during the latter part of this period. same time.
The effluent ammonia concentration increased during the
Both of these events were preceded by a steady increase of nitrite in the
effluent. Nitrite levels increased to 14 mg/L-N in 2 days, then steadily decreased even after the perturbation event had begun.
The average nitrite concentration during initial
operation was 5.9 ± 2.3 mg/L as N.
During the perturbation, the effluent ammonia
concentration increased with increasing influent ammonia. effluent
ammonia
concentration.
concentration
coincided
with
an
A subsequent decrease in increased
effluent
nitrate
Minor vacillation in the effluent ammonia concentration occurred after the
perturbation, therefore steady state for the 2-day SRT system was set from day 41 to day 60 for operation at 22o C. Operational data at 7o C show that nitrification was poor at this temperature and SRT.
The average effluent ammonia concentration was 17.7 ± 1.8 mg/L-N while the
average influent ammonia concentration was 19.8 ± 1.8 mg/L-N.
Resulting ammonia
removal efficiency during 7o C operation was 8.6 ± 6.8 percent.
Negative ammonia
removal efficiencies were calculated for seven non-consecutive days during 7o C operation. No steady state for nitrification was achieved during 7o C operation. Operation at 12o C for the 2-day SRT reactor was highly unstable for the majority of time at this temperature.
Poor nitrification efficiency persisted until day 154 when
effluent ammonia levels dropped below detection limits.
However, a large sustained
elevation in the effluent ammonia concentration was measured after this date.
On day 89
190, the effluent ammonia concentration returned to levels below the detection limit although an effluent ammonia concentration less than 0.1 mg/L-N was not sustained over time. From day 190 to day 207, a stable effluent ammonia concentration of 1.1 mg/L-N was (on average) measured and this time period was chosen to represent steady state operation. 4.5.3
Alkalinity Observations During this bench-scale study, periodic measurements of influent and effluent
alkalinity (as CaCO3 ) were made (Figure 19) to ensure adequate buffering capacity. As indicated in Equation 1, free hydrogen ions are produced during ammonia oxidation, the first step of nitrification.
The potential for pH depression due to acidification from
ammonia oxidation poses an operational problem for both treatment of carbonaceous and nitrogenous compounds as it effects both heterotrophic and autotrophic bacterial growth rates (Grady et al, 1980). Reactor pH conditions have been found to have a significant effect on nitrification rates (USEPA, 1993). Theoretical alkalinity consumption during ammonia oxidation can be calculated as 7.14 mg CaCO3 / mg NH4 + oxidized. This ratio neglects bacterial synthesis. The average ratio of alkalinity destroyed per ammonia oxidized for each test system is summarized in Table 8.
The large variance is due, in part, to the small number of
samples taken during the periods of operation. There is a trend of increasing average alkalinity consumption with increasing SRT during 22o C operation; however, differences are not statistically significant at the 95% confidence level. In general, alkalinity consumption was lower than predicted in reactors that achieved high levels of nitrification. 90
Figure 19.
Fluctuations in effluent alkalinity as a result of decreasing temperature throughout this treatability study.
91
Table 8.
Average ratio of alkalinity destroyed per ammonia oxidized expressed as mg CaCO3 / mg NH4 +-N.
Reactor
22o C Operation
7o C Operation
12o C Operation
mg CaCO3 consumed/ mg NH4 +-N oxidized
Std. Dev., mg/L
mg CaCO3 consumed/ mg NH4 +-N oxidized
Std. Dev., mg/L
mg CaCO3 consumed/ mg NH4 +-N oxidized
Std. Dev., mg/L
20-day θc
6.73
0.40
9.85
1.79
6.97
0.43
10-day θc
6.64
0.36
8.57
1.64
6.77
0.40
5-day θc
6.58
0.42
8.36
6.15
7.22
1.01
2-day θc
6.35
0.54
7.21
5.03
8.58
2.29
Conversely, alkalinity consumption was higher than predicted in reactors that achieved little nitrification (12oC – 2-day SRT and all SRTs at 7oC). During the entire operation of the reactors, the average influent alkalinity concentration was 248 ± 10 mg/L as CaCO3. The average effluent alkalinity for the 20-, 10-, 5- and 2-day SRT reactors was 104 ± 15, 109 ± 14, 118 ± 15 and 154 ± 15 mg/L as CaCO3, respectively. As indicated by these values, sufficient alkalinity was maintained during operation.
However, during
the perturbation event, an alkalinity value of 30 mg/L (as CaCO3) was measured in the 20-day SRT reactor. This depression was due to the increase in ammonia loading on the system, and it was noted that the corresponding reactor pH was 6.62. Low pH values were recorded during this time period; however, these levels did not persist after wastewater strength returned to normal.
92
4.6
Examination of Full Scale Simulation Using the Bench Scale Reactor / Clarifier System A unique feature of this study was that actual settled municipal wastewater was
used in order to more accurately simulate the local full scale activated sludge process. The reactor / clarifier system was also seeded with biomass collected from the local full scale WWTP activated sludge reactor. An analysis of treatment performance between the two systems was required to identify areas in which the bench scale system sufficiently simulated the full scale system. Inherent differences between the bench and full scale facilities did exist.
For
instance, the hydraulic retention time (HRT) for the full scale facility was approximately 3.4 hours whereas an HRT of the bench scale system was approximately 8.6 hours. Hydraulic and mixing characteristics between the two systems were theoretically different and a discussion of similitude was not approached for this study. However, a comparison of carbon treatment, sludge settlability, and ammonia removal between the two systems was made to identify successful treatment simulation. Figure 20 shows the operational SRT for the full scale system during this study. The average SRT for the full scale activated sludge system was approximately 3 days. For comparative purposes, the 5-day SRT treatment data was chosen to represent the bench scale system.
Figure 21 illustrates the change in operational temperature for the
full scale facility during this bench scale study.
Full scale temperature steadily declined
from an initial temperature of approximately 23o C to temperatures as low as 4o C. Since
93
Figure 20. A plot of operational SRT for KUBs Kuwahee WWTP during this study.
Figure 21. A plot of influent temperature for KUBs Kuwahee WWTP during this study.
94
this study was performed between the dates of September 28,1999 to April 27, 2000, the temperature drop in Figure 21 encompassed wintertime conditions. Figures 22 and Figure 23 show the carbon treatment data for both the full and bench scale (5-day SRT) systems. measurement between BOD5 unexpectedly.
and
Due, in part, to the inherent differences in CODT , influent values were quite scattered,
The increase in wastewater strength observed during the initial
perturbation in the bench scale system was not as pronounced in the full scale data. This could be attributed to a volume effect where a greater amount of equalization of the high strength wastewater occurred in the full scale system.
As can be seen in Figure 22,
influent BOD5 for the full scale system was, at times, much greater than values observed during the perturbation.
In addition, other periods of high strength influent wastewater
measured at the full scale facility were not observed in the bench scale system.
Since
wastewater was collected every 3-4 days, many influent high strength events were not captured in the bench scale operation. Figure 23 shows that effluent CODT values were much greater in the bench scale system than the full scale effluent BOD5 values. This was, in part, attributed to the suspended solids which were included in the effluent CODT measurements.
As can be seen in Figure 23, the full scale facility produced an effluent
with very low biochemical oxygen demand. Residual oxygen demand is of main concern for WWTP operation, due to detrimental effects of chlorination when oxidizable organic matter is present as well as effects of high residual oxygen demand wastewater on receiving streams. Despite periods of clear, well treated effluent, the bench scale system was more sensitive to process changes causing higher, more variable effluent CODT values. 95
Figure 22. A comparison of full and bench scale (5-day SRT) influent carbon data during this study.
Figure 23. A comparison of full and bench scale (5-day SRT) effluent carbon data during this study. 96
Overall, it was difficult to compare full and bench scale carbon treatment data based on differences in carbon measurement, differences in flow, variation in wastewater strength, and differing operational (SRT) and environmental (temperature) parameters between the two systems. Figure 24 represents the MLSS concentration maintained in both the full and bench scale (5-day SRT) systems during this study.
A large difference in MLSS
concentration between the two systems was observed for the entire duration of this study. Average MLSS concentrations for the full scale system for the defined temperature intervals of 22, 12 and 7o C were 3858, 3100 and 2950 mg/L, respectively. The average MLSS values for the bench scale system during the established temperature intervals of 22, 12 and 7o C were 1624, 775, 1269 mg/L, respectively. The average MLSS values were markedly different between the two systems.
Although an MLSS peak during
operation between days 20 through 40 was noted in both systems. Figure 25 illustrates changes in SVI for both the full and bench scale (5-day SRT) systems during this study. Several major vacillations in SVI were measured in the bench scale system during the first 2 months of operation; however, SVI values ultimately stabilized at levels comparable to the full scale facility. Biomass acclimation and operational temperature were identified as playing a role in the achievement of excellent SVIs in the bench scale system by the end of this study. Figure 26 shows the F/M ratios for both the full and bench scale (5-day SRT) systems during this study. F/M ratio for each system was based on the means by which carbon substrate was measured. 97
Figure 24. A comparison of Mixed Liquor Suspended Solids for both the full and bench scale systems during this study.
Figure 25. A plot of SVI for the full and bench scale (5-day SRT) systems during this study. 98
Figure 26. A plot of F/M ratios for the full and bench scale (5-day SRT) systems during this study.
It was difficult to compare F/M ratios between the two systems, as was the case for carbon treatment data, due to the differences in methods used to asses influent carbon concentrations.
Although F/M ratios for the bench and full scale systems do coincide
over certain time frames, there is little general agreement in values over the entire time course of the study. Figures 27 and 28 show the influent and effluent ammonia data, respectively, for both the full and bench scale (5-day SRT) systems over the duration of this study. The full and bench scale systems had somewhat similar influent ammonia concentrations; however, the bench scale system ammonia concentration was consistently higher.
A
comparison of average values for the temperature regimes of 22, 12 and 7o C for the full 99
Figure 27. A plot of ammonia treatment data for both the full and bench scale (5-day SRT) systems for this study.
Figure 28. A plot of ammonia treatment data for both the full and bench scale (5-day SRT) systems for this study. 100
and bench scale systems were 19.9 and 27.4, 16.6 and 18.2, and 12.8 and 19.8 mg/L, respectively.
Conversion of organic nitrogen to ammonia through the process of
ammoniafication and time of day at which the settled municipal wastewater was collected were thought to have been the main reasons for this consistent difference in influent ammonia concentrations between the two systems. ammonia concentrations for both systems.
Figure 28 shows the effluent
The substantial residual ammonia in the full
scale effluent could have been due to the low operational SRT (approximately 3 days on average) maintained for the full scale facility. Operationally, a small amount of ammonia is acceptable for full scale operation bawsed on permitted effluent discharges. In comparison,
the
bench
scale
system
produced
concentrations than the full scale facility.
effluent
with
lower
ammonia
The discrepancy in ammonia treatment
performance could have been due to a higher operating SRT for the bench scale system or a higher concentration of ammonia oxidizing bacteria within the reactor. Overall, from the data presented in this section, the bench scale reactor / clarifier system had difficulty in simulating the local full scale WWTP.
Similarities did exist
between the two systems; however, differences in system operation, waste collection, measurement
of
carbon
substrate,
bench
scale
biomass
acclimation
and
other
environmental parameters were thought to have played a role in lack of a successful comparison between the two systems. The previous graphs comparing full and bench scale (5 day SRT) systems provided collation of operating data for the time frame of this study.
To assess the
performance of both systems based on the major environmental parameter, temperature, periods of similar operational temperature were compared.
The average full scale 101
process temperature from day 1 to day 37 was found to be 21.5o C; whereas, the average full scale process temperature from day 111 to day 143 was found to be 14.3o C and finally from day 145 to day 181 the average full scale process temperature was determined to be 8.6o C.
These periods were chosen to approximate the temperatures
imposed (22, 12 and 7o C) on the bench scale system. Average treatment data for the full and bench scale systems during these periods of similar temperature are presented here as Table 9. For the full scale system, the average values for carbon treatment data presented in Table 9 showed little variation in treatment performance with respect to temperature. For the 22, 12 and 7o C full scale temperature approximations, the average effluent BOD5 with accompanying standard deviations at a 95% confidence interval in milligrams per liter were 4.4 ± 2.9, 3.7 ± 2.0, and 4.8 ± 2.6, respectively. Average effluent BOD5 values for different temperature periods did not vary significantly.
The most efficient carbon
treatment occurred at 14.3o C (98.56%) followed by 21.6o C (98.6%) with treatment at 8.6o C (98.0%) exhibiting the lowest BOD5 removal. Despite a decline in average influent BOD5 with respect to temperature, effluent BOD5 values remained low and subsequent treatment performance continued to be relatively constant independent of temperature. Due to different means of measuring carbon substrate, bench scale system did not successfully simulate the full scale system with respect to carbon treatment performance; even though, a similar lack of temperature response to carbon treatment was observed in both systems.
However, it was believed that a more accurate analysis of simulation of
full scale carbon treatment could have been possible if BOD5 data was measured in the bench scale study. 102
Table 9. Average carbon and nitrogen values for the full scale and bench scale systems during periods of similar operating temperature. Average Average Average Average System, Days of Influent Effluent Influent Effluent + Avg. Temp. Operation COD/BOD5 COD/BOD5 NH4 NH4 + Full Scale, 21.5o C 37 304.5 ± 91.4 4.4 ± 2.9 19.9 ± 6.5 1.9 ± 1.5 o Bench Scale, 22 C 61 323.3 ± 169.9 67.8 ± 26.9 27.4 ± 9.4 1.9 ± 6.1 Full Scale, 14.3o C Bench Scale, 12o C
33 105
261.1 ± 110.3 3.7 ± 2.0 226.1 ± 113.3 64.9 ± 31.6
16.6 ± 4.1 18.2 ± 5.2
2.5 ± 2.4 3.1 ± 4.7
Full Scale, 8.6o C Bench Scale, 7o C
37 47
239.8 ± 83.5 4.8 ± 2.6 257.4 ± 140.1 75.1 ± 20.8
12.8 ± 4.6 19.8 ± 5.2
2.9 ± 3.3 17.3 ± 5.1
A comparison of ammonia treatment data between bench and full scale systems at similar temperatures revealed a more distinct effect of temperature on system performance. For temperatures of 22, 12 and 7o C, the full scale system average effluent ammonia concentrations with corresponding standard deviations at a 95% confidence interval in milligrams nitrogen per liter were 1.9 ± 1.5, 2.5 ± 2.4 and 2.9 ± 3.3, respectively. Despite the close proximity of average effluent ammonia concentrations, an increase in effluent ammonia was observed with decreasing temperature.
This direct
relationship was expected based on a review of literature (Section 2.4) and was also observed in the bench scale system. At 7o C for the bench scale system, a dramatic loss of ammonia removal attributed to low temperature was evidenced by the elevated average effluent ammonia concentration of 17.3 ± 5.1 mg/L compared to that of 2.9 ± 3.3 mg/L for the full scale system. The bench scale system underwent an almost total loss of ammonia removal at 7o C whereas the full scale system only experienced a slight reduction in ammonia removal during the average temperature period of 8.6o C.
103
The difference in operational temperature between the two systems (7o C versus 8.6o C) could have, in part, caused some difference in operation between the two systems. Also, the SRT observed for the bench scale system was fixed (5 days) while the SRT for the full scale system was elevated during colder temperatures.
This elevation of full scale
SRT began during the period considered for 12o C operation. For 22o C, the average effluent ammonia concentrations with standard deviations at a 95% confidence interval for the full and bench scale systems were 1.9 ± 1.5 and 1.9 ± 6.1 mg/L, respectively.
For 12o C the average effluent ammonia concentration with
standard deviation at a 95% confidence interval were 2.5 ± 2.4 and 3.1 ± 4.7 mg/L, At 22 and 12o C the bench scale system had higher ammonia removal
respectively.
efficiencies than the full scale system while experiencing higher, more variable ammonia loading. There was, however, a indirect relationship between decreasing temperature and increasing
average
effluent
ammonia
concentration.
This
temperature
dependant
relationship was observed in both the full and bench scale systems to varying degrees. Full scale treatment performance for ammonia removal was not effected by temperature as the bench scale system.
Even though the same indirect relationship between
temperature and effluent ammonia concentration was observed in both reactors, this effect was found to occur at varying degrees.
Temperature inhibition in the full scale
system was less dramatic; whereas, the same effect was quite dramatic in the bench scale system.
The bench scale system consistently produced an effluent with lower ammonia
concentrations.
Overall, the bench scale simulation of full scale ammonia oxidation was
quite good despite a multitude of different operational and environmental variables.
104
Chapter 5.0 Summary and Conclusions 5.1
Evaluation of Bench Scale Reactor Design and Operation This bench-scale, recycle system was sufficient in meeting expectations during
the period of operation. solids.
Tight control of SRT was achieved through daily wastage of
The external clarifier performed well after several modifications, achieving
effluent suspended solids levels below 30 mg/L on a consistent basis. This attribute was due, in part, to the scraper arm portion of the external clarifier which faciltated solids movement and concentration, allowing for proper solids recycle.
Average effluent
suspended solids concentrations during the entire length of operation were 24.5 ± 2.8, 21.6 ± 3.2, 22.7 ± 2.4, 20.4 ± 2.7 mg/L for the 20-, 10-, 5- and 2-day SRT reactors, respectively at a 95 % confidence interval.
SVI values were poor initially; however,
settling improved upon temperature change to 12o C. During 12o C operation, average SVI values were 57, 65, 55 and 69 L/mg, indicating conditioned, well settling biosolids. Reactor temperature was maintained through set point controls for the constant temperature room where the bench-scale system was operated. Periodic checks of the reactor temperature confirmed consistent reactor temperature, however the temperature did maintain approximately 1.5o C above the set point for all temperatures studied. Kuwahee wastewater used during this experiment had sufficient alkalinity to buffer pH in the mixed liquor. Concentrations of > 80 mg/L were typically measured in the effluent except during periods of high-strength influent wastewater.
Alkalinity is
105
important in system pH, which can effect the growth of bacteria.
Fortunately sufficient
alkalinity was present and pH control was not required.
5.2
Evaluation of Carbon Treatment Performance An objective of this treatability study was to assess the impact of temperature and
SRT on carbon removal efficiency. At 22o C operation, the average effluent COD increased with increasing SRT.
Statistical analysis indicated that treatment performance
was a function of SRT at this temperature.
However, no distinct relationship between
SRT and COD removal was noted within the 7o C or 12o C operational temperatures. However, statistical analysis showed a significant difference in the average effluent COD values between the 22o C and 7o C operational temperatures. These findings indicate that effective carbon treatment can be accomplished at temperatures above 12o C.
5.3
Examination of Nitrification Performance An additional objective of this study was to determine the effects of temperature
and SRT on nitrification.
Nitrification was successfully achieved for this bench-scale
system at temperatures as low as 12o C and at an SRT of 5 days or greater. The 20, 10 and 5-day SRT reactors successfully achieved complete ammonia removal, however the 2-day SRT was not sufficient to consistently achieve complete nitrification at any temperature studied.
Therefore a minimum SRT of 5 days is deemed necessary for
effective nitrification.
106
5.4
Evaluation of Bench Scale Simulation of Full Scale System An objective of this study was to evaluate the efficacy of the bench scale system
in simulating of the local full scale WWTP. A comparison of the carbon data revealed a consistent level of treatment for both systems. However, effluent BOD5 for the full scale system was very low compared to effluent CODT values obtained from the bench scale system.
The bench scale system was found not to successfully simulate the full scale
system due, in part, to differences in carbon analysis.
A comparison of nitrogen
treatment data for both systems bared similar results despite different operational characteristics, such as temperature, variations in wastewater flow and operational SRT. Nitrogen treatment in the bench scale system was more efficient than in the full scale system. This was thought to be due to difference in system operation and other factors (SRT, temperature, waste collection and storage) inherent in both systems.
An analysis
of the settling characteristics for both systems showed that once the biomass had acclimated in the bench scale system, settling characteristics for both systems were very similar.
F/M ratios were highly variable in the two treatment systems. From this
comparison of the two systems, the bench scale system designed and fabricated for this study did not simulate the full scale facility as well as expected, in spite of some operational similarities.
107
5.5
Conclusions The following conclusions can be drawn from this investigation.
1. The bench scale reactor / clarifier system proved to operate sufficiently allowing for tight control of SRT, producing clear, well-treated effluent by the end of the study (12o C operation with an average influent CODT of 213 mg/L). 2. Statistical analysis indicated that treatment performance was a function of SRT at 22o C operation supported by the fact that the average effluent CODT decreased with increasing SRT. Also, no distinct relationship between SRT and CODT removal was derived due to lack of conclusive data gathered at 7o C and the indistinct relationship between SRT and CODT treatment performance at 12o C. 3. The bench scale reactor / clarifier system successfully simulated nitrification (above a temperature of 12o C) as well as settling characteristics for the local full scale WWTP activated sludge reactor after appropriate acclimation of the bench scale system; however, carbon treatment was not observed to sucsessfully simulate the local full scale WWTP system due to inherent differences in variations in wastewater strength and means of measuring carbon substrate (BOD5 v CODT ). 4. Nitrification was consistently and successfully achieved for this bench-scale system at temperatures as low as 12o C and at a SRT of 5 days or greater. 5. Based on the data presented in this study, a SRT of 5 days and a process temperature of 12o C are observed to achieve effective carbon treatment, biosolids settling, and nitrification.
108
References
109
Anon (1974) Process design Techniques for Industrial Waste Treatment, pp. 215-232. Aware, Inc., Enviro. Press Nashville, Tenn. APHA (1998) Standard Methods for the Examination of Water and Wastewater, 20th ed. United Book Press, Inc., Baltimore, Maryland. Arrhenius S. (1889). “Uber die Reaktionsgeschwindigkeit bei der Inversion von Rohrzuder durch Sauren,” Zeitschrift Fur Physikalische Chemic, 4, 226-248. ASCE Manual and Report on Engineering Practice No. 76. (1992) Design of Municipal Wastewater Treatment Plants Volume I: Chapters 1-12. WEF Manual of Practice No. 8. Aziz J.A. and Tebbutt T.H.Y. (1979) Significance of COD, BOD and TOC correlations in kinetic models of biological oxidation. Water Research 14, p319-324. Barnes D. and Bliss P.J. (1983) Biological Control of Nitrogen in Wastewater Treatment. University Press, Cambridge. Barritt N.W. (1933) The nitrification process in soils and biological filters. Ann. Appl. Biol. 20, 165-184. Bock E., Koops H.P. (1992). The genus Nitrobacter and related genera. The prokaryotes 2nd ed. Springer-Verlag, New York, N.Y. 2302-2309. Deppe K. & Engel H. (1960) Untersuchungen uber die Temperatureabhangigkeit der Nitritbildung durch Nitrobacter winogradskyi Buch. Bei ungehemmtem und gehemmtem Wachstum. Zentralbl. Baketeriol. Parasitenkd. Infek. Hyg. Abt. II 113, 561-568. Downing A.L., and Knowles G. (1966) Population dynamics in biological treatment plants. Presented at the 3rd Conference of the IAWPR, Munich.
110
Downing A.L., and Hopwood A.P. (1964) Some observations on the kinetics of nitrifying activated sludge plants. Schewiz. Zeitsch f Hydrol., 26, 2, p 271. Department of Scientific and Industrial Research (1964) Water Pollution Research, 1963. HMSO, London. Eckenfelder W.W., Grau P.D. (1998) Activated Sludge Process Design and Control: Theory and Practice, Water Quality Management Library Vol 1. 2nd ed. Technomic Publishing Co. Inc. Ekama G. A., and Marais G.v.R. (1984) Nitrification. Theory, Design and Operation of Nutrient Removal Activated Sludge Processes. Water Research Commission, Chap. 5. El-Rehaili A. (1994) Implications of activated sludge kinetics based on total or soluble BOD, COD and TOC. Environmental Technology 15, p1131-1172. Ford D.L. (1980) Comprehensive analysis of nitrification of chemical processing wastewaters. Journal WPCF, 52, 11 p 2726-2746. Fuchs A., Staudinger G. (1999) Characterising the clarification of the supernatant of activated sludges. Water Res. 33, 11 p2527-2534. Gaudy A.F. and Kincannon D.F. (1977) Comparing design models for activated sludge. Water Sew. Works, 123, 66. Grady C.P.L., Lim H.C. (1980) Biological Wastewater Treatment: Theory and Applications. Marcel Dekker, Inc. Grady C.P.L., Smets B.F., Barbeau D.S. (1996) Varablity in kinetic parameter estimates: a review of possible causes and a proposed terminology. Water Res. 30, 742.
111
Gromiec M., Valve M. and Liponkoski M. (1982) Nutrients removal from wastewaters by the single sludge systems. Technical Research Centre of Finland, Research Reports 126p. Gujer W. and Jenkins D. (1974) The contact stabilization process-oxygen and nitrogen mass balances. University of California, Sanitary Engineering Research Lab, SERL Report 74-2. Haug T.T. and McCarty P.L. (1971) Nitrification with the submerged filter. Report prepared by the Department of Civil Engineering, Stanford University for the Environmental Protection Agency, Research Grant No. 17010 EPM. Henze, M., Harremoes P., LaCour Jansen J., and Arvin E. (1995) Wastewater Treatment: Biological and Chemical Processes. Springer, Heidelberg. IAWPRC Task Group on Mathematical Modeling for Design and Operation of Biological Wastewater Treatment, “Final report: Activated sludge model.” IAWPRC Sci. Tech. Rep. No. 1. Jones R.D., Morita R., Koops H.P., and Watson S. (1998). A new marine ammonium-oxidixing bacterium, Nitrosomonas cryotolerans sp. Nov. Can. J. Microbiol. 3, 1122-1128. Jones J.B. and Dugan R.E. (1996) Engineering Thermodynamics. Prentice Hall, Inc. Juretschko S., Timmermann G., Schmid M., Schileifer K.H., Pommerening-Roser A., Koops H.P., and Wagner M. (1998) Combined molecular and conventional analyses of nitrifying bacterium diversity in activated sludge: Nitrosococcus mobilis and Nitrospiralike bacteria as dominant populations. App. Environ. Microbiol. 64, 3042-3051.
112
Knowles G., Downing A.L., and Barrett M.J. (1965) Determination of kinetic constants for nitrifiying bacteria in mixed culture, with the aid of an electronic computer. J. Gen. Microbiology, 38, 263. Koch G., Kuhni M., Gujer W., and Siegrist H. (2000) Calibration and validation of activated sludge model no. 3 for Swiss municipal wastewater. Wat. Res. 34, 14, 35803590. Krishna C., Van Loosdrecht M.C.M. (1999) Effect of temperature on storage of polymers and settleability of activated sludge. Water Res. 33, 10, p2374-2382. Laudelout H. (1978) Mathematical modeling of biological ammonium oxidation. In Microbiology – 1978 (Edited by Schlessinger D.) Am. Soc. Microbiol., Washington D.C. Laudelout H., Lambert R., Fripiat L. L. & Pham M. L. (1974) Effet de la temperature sur la vitesse d’oxydation de l’ammonium en ntirate par des cultures mixtes de nitrifiants. Ann. Microbiol. (Inst. Pasteur) 127A, 367-382. Lawrence A.W. and M cCarty P.L. (1970) Unified basis for biological treatment design and operation. J. Sanitary Eng. Div. ASCE 757-779. Liebeskind M., Schapers D., Bornemann C., Brands E., Freund M., and Rolfs T. (1996) Parameter determination and model fitting – two approaches for modeling process in wastewater treatment plants. Water Sci. Technol. 34, 5-6, 27. Mauret M., Paul E., Costes C.P., Maurette M.T., and Baptiste P. (1996) Application of experimental research methodology to the study of nitrification in mixed culture. Water Sci. Technol. 34, 245. Mines R.O. Jr. and Sherrard J. H. (1999) Temperature Interactions In The Activated Sludge Process J. Environ. Sci. Health, A34, 2, 329-340. 113
Mobarry B.K., Wagner M., Urbain V., Rittmann B., and Stahl D.A. (1996) Phylogenetic probes for analyzing abundance and spatial organization of nitrifying bacteria. App. Environ. Microbiol. 62, 2156-2162. Monod J. (1942) Researches sur la croissance des cultures. Hermann and Cie, Paris. Monod J. (1949) The growth of bacterial cultures. The Annual Review of Microbiology, 3, 371-394. Moore A.M. (1986) Temperature and moisture dependence of decomposition rates of hardwood and coniferous leaf litter. Soil Biol. Biochem. 18, 427-435. O’Kelley J.C. (1970) Characterization of the particulate nitrite oxidase and its component activities from the chemoautotroph Nitrobacter agilis. Biochem. Biophus. Aeta., 205, 409. Pano A. and Middlebrooks E.J. (1983) Kinetics of carbon and ammonia nitrogen removal in RBCs. J. Wat. Pollut. Control Fed. 55, 959-965. Painter H.A. (1970) A Review of literature on inorganic nitrogen metabolism in microorganisms. Water Research, 4, 6, 393-450. Painter H.A. and Loveless J.E. (1983) Effect of temperature and pH value on the growth-rate constants of nitrifying bacteria in the activated sludge process. Water Research, 17, 3, 237-248. Phelps E.B. (1944) Stream Sanitation, John Wiley and Sons, Inc., New York, N.Y., 7175. Poduska R.A. and Andrews J.F. (1974) Dynamics of Nitrification in the Activated Sludge Process. Presented at the 29th Industrial Waste Conference, Purdue University, Lafayette, Indiana. 114
Pommerening-Roser A., Rath G., and Koops G.P. (1996) Phylogenetic diversity within the genus Nitrosomonas. Syst. Appl. Microbiol. 1, 344-351. Prosser J.L. (1989) Autotrophic nitrification in bacteria. Adv. Microb. Physiol. 30, 125181. Quinlan A. V. (1980) The thermal sensitivity of nitrification as a function of the concentration of nitrogen substrate. Water Research 14, 1501-1507. Quirk T.P. and Eckenfelder W.W. (1986) Active mass in activated sludge analysis and design. J. WPCF 58, 932-936. Randall C.W. (1998) Activated sludge: latest developments and a look into the future. J.CIWEM 12, p375-383. Silyn-Roberts G. and Lewis G. (2001) In situ analysis of Nitrosomonas spp. In wastewater treatment wetland biofilms. Water Research 35, 2731-2739. Sharma, B. & Ahlert, R.C. (1976) Nitrification and nitrogen removal. Wat. Res. 11, 897-925. Shieh W. K. & LaMotta E. J. (1979) Effect of initial substrate concnetration on the rate of nitrification in a batch experiment. Biotech. Bioeng. 21, 201-211. Sozen S., Orhon D., San H.A. (1996) A new approach for the evaluation of the maximum specific growth rate in nitrification. Wat. Res. 30, 7, 1661-1669. Shuler M.L. and Kargi F. (1992) Bioprocesess engineering: basic concepts PrenticeHall, Inc. Suzuki I. (1974) Ammonia or ammonium ions as substrate for oxidation by Nitrosomonas europaea cells and extracts. Journal of Bacteriology, 120, 556.
115
Tchobanoglous G. and Schroeder, E.D. (1985) “Water Quality: Characteristics, Modeling and Modification.” Addison-Wesley Publishing; Reading, MA. Tendaj M., Reinius L.G., Hultgren J. (1992) Some observations on nitrfication and denitrfication following full-scale trials at Henriksdal and Bromma sewage treatment plants in Stockholm. Wat. Sci. Tech. 25, 4-5, 195-202. U.S. Environmental Protection Agency (1993) Process design manual for nitrogen control. Prepared for the Office of Technology Transfer of the USEPA, Brown and Caldwell, Walnut Creek, California. Viessman and Hammer, Water Supply and Pollution Control, 5th ed., Harper Collins College Publishers. Wagner M., Amann R., Lemmer H., and Schleifer K.H. (1993) Probing activated sludge with Proteobactreia-specfic oligonucleotides: inadequacy of culture-dependent methods for describing microbial community structure. Appl. Environ. Microbiol. 59, 1520-1525. Wight J.R., Skiles J.W. (1987) SPUR; Simulation of production and utilization of rangelands. Documentation and user guide. USDA-ARS pub. No. 63. Woese C.R., Weisburg W.G., Paster B.J., Hahn C.M., Tanner R.S., Kreig N.R., Koops H.P., Harms H., and E. Stackebrandt. (1984) The phylogeny of purple bacteria, the beta subdivision. Syst. Appl. Microbiol. 5, 327-336. Wong Chong G. M., and Loehr R.C. (1975) The kinetics of microbial nitrification. Water Res. 9, 1099. Yantarasri T., Garcia A. III, and Brune D. (1992) Thermodynamic model of nitrification kinetics. J. of Env. Eng. 118, 4. 116
Appendices
117
Appendix A. Full Scale Plant Data Time
SRT
MLSS
Inf. BOD
Eff. BOD
Inf. NH4+
Eff. NH4+
SVI
1 2 3 4 5 6 7 8 9 10 11 12 13 14 15 16 17 18 19 20 21 22 23 24 25 26 27 28 29 30 31 32 33 34 35 36 37
11.6 20.7 16.4 2.9
2180 2350 2340 2860 3140 2950 2610 3270 3100 3160 3110 3530 2830 2970 4360 2020 2540 3060 3240 8860 3150 4530 5480 6110 2230 3810 6295 2670 3060 3900 4930 4330 4840 5850 5100 5310 7660
426 461 376 528 317 376 301 202 465 282 328 230 200 337 241 252 191 304 234 176 414 514 322 218 234 247 250 388 286 330 309 291 206 216 301 269 247
11 6 8 3 4 12 4 2 5 6 6 3 4 4 2 4 4 2 5 3 2 1 3 3 5 4 4 3 3 2 2 15 4 3 2 6 2
15.6 17.2 23.6 21.4 16.8 13.3 16.7 17 17.9 19.4 23.9 21.4 8.8 19.8 25.5 24.5 24 23.5 19.6 13.9 35 32.3 26.4 23.3 24.9 20.3 16 0 24.8 29.8 19.9 22.1 19.9 13.6 14.2 12.3 17.3
1.1 1.9 1 0.7 0.6 0.4 0.7 0.5 1.5 3.9 2.2 0.9 0.2 2.1 3.1 3.8 6.1 1.6 1.9 0.2 0.9 4 3.8 3.1 2.9 2.1 0.2 0 2.5 4.8 4 2.1 2.6 0.7 0.2 0.9 1
45.9 42.6 64.1 49.0 47.8 54.2 61.3 61.2 48.4 50.6 61.1 56.7 45.9 57.2 27.5 74.3 59.1 49.0 49.4 9.0 60.3 28.7 23.7 19.6 31.4 39.4 34.9 52.4 39.2 38.5 32.5 34.6 43.4 46.2 51.0 13.2 9.1
F/M BOD5/MLSS/ HRT 1.367 1.372 1.124 1.291 0.706 0.891 0.806 0.432 1.049 0.624 0.738 0.456 0.494 0.793 0.387 0.872 0.526 0.695 0.505 0.139 0.919 0.793 0.411 0.250 0.734 0.453 0.278 1.016 0.654 0.592 0.438 0.470 0.298 0.258 0.413 0.354 0.225
4630 3460 3930 2930 4460 3790 3120 3220 2010 3240 3270 3180 3270 3100
268 264 215 234 313 203 575 636 392 260 287 228 227 453
15 3 4 6 2 5 6 2 4 2 2 4 4 4
17.5 18.9 36 13.2 18.3 13.6 18.2 17.3 23.7 14.1 14.6 19.2 18.7 19
1.5 1.5 1.1 3 0.3 0.7 0.9 0.7 1.8 0.2 0.2 0.2 0.2 0.2
56.2 46.2 50.9 54.6 29.1 79.2 48.1 87.0 99.5 86.4 76.5 94.3 116.2 112.9
0.405 0.534 0.383 0.558 0.491 0.375 1.289 1.381 1.364 0.561 0.614 0.501 0.485 1.022
38 39 40 41 42 43 44 45 46 47 48 49 50 51
1.8 2.3 2.0 2.7 2.8
2.8 3.5 1.2 2.0 2.9
2.7 3.1 3.4 2.7 1.0
1.7 1.6 2.0 2.2 1.7
5.1 56.9 2.2 2.0 1.4
2.0
118
52 53 54 55 56 57 58 59 60 61
2.5 2.3 1.8 2.1
62 63 64 65 66 67 68 69 70 71 72 73 74 75 76 77 78 79 80 81 82 83 84 85 86 87 88 89 90 91 92 93 94 95 96 97 98 99 100 101 102 103 104 105 106 107
2.8
2.4 3.0 1.6 2.1
2.3 3.0 2.9 2.1
1.9 5.1 2.6 1.7 2.9
1.9 1.5 2.4 2.2 2.2
2.3 3.1 2.3 2.6
3.8 2.5 2.4
6.9 3.1 3.3 6.3 2.7
2.3 3.1 3.6
3480 3480 3040 3040 3370 3150 3070 3470 2460 2920
194 253 456 497 285 246 233 230 523 304
2 2 4 3 4 3 4 2 2 4
18.5 16.8 20.4 23.4 17.2 13.9 20.3 16.7 18.5 20.2
1.1 1.5 1.7 1.3 0.4 0.2 0.2 0.9 0.2 1
63.2 57.5 55.9 69.1 74.2 66.7 81.4 69.2 97.6 85.6
0.390 0.508 1.049 1.143 0.591 0.546 0.531 0.464 1.487 0.728
3460 3540 3040 3690 3870 3220 4200 3850 2190 6360 2990 2200 4080 3070 3130 2770 1920 3310 2420 2650 3180 3480 2470 3600 2950 3440 2180 3080 2680 2860 3340 2720 2310 3600 3560 2550 6250 3330 3620 3000 3420 3440 2710 2710 3750 4350
552 292 450 424 352 418 351 299 692 6200 2810 2610 2890 2730 2850 3940 3970 299 371 366 212 250 353 710 578 701 362 213 271 679 552 583 363 311 366 401 620 509 381 359 302 203 447 269 482 519
4 4 5 3 5 2 4 6 2 2 5 4 3 5 6 4 3 4 6 4 3 3 3 5 4 2 2 5 4 4 3 1 5 5 5 1 3 4 4 4 3 4 20 23 2 4
20.9 19.2 21.7 20 20.2 22.3 21.3 13.7 18.9 17.7 15 15.8 20.5 24.2 16.1 23 16.4 17 22.1 21.8 19 11.6 25 21.4 17.7 24.1 18.2 16.8 19.8 21.7 18.4 21.1 25.9 14.7 15.1 12.8 16.5 11 13.5 16.6 15.5 15.5 6.4 6.7 8 14.9
0.6 0.8 0.8 0.7 3.1 3.7 2.7 0.2 0.5 0.9 2 3.3 0.9 2.7 1 2 0.5 0.9 2.6 3.4 1.5 0.6 1.4 5.9 5 1.2 0.2 0.2 0.2 1.5 1.6 1.1 3.2 1.4 0.2 0.2 0.8 0.4 0.3 0.7 0.2 0.6 2.1 2.1 0.5 1
106.9 87.6 115.1 130.1 113.7 102.5 107.1 90.9 255.7 26.7 90.3 90.9 39.2 42.3 63.9 65.0 83.3 69.5 74.4 75.5 66.0 57.5 68.8 69.4 57.6 66.9 64.2 64.9 56.0 66.4 80.8 80.9 60.6 75.0 75.8 82.4 25.6 87.1 82.9 86.7 78.9 78.5 92.3 88.6 130.7 50.6
1.116 0.577 1.035 0.804 0.636 0.908 0.584 0.543 2.210 6.817 6.572 8.296 4.953 6.219 6.367 9.947 14.459 0.632 1.072 0.966 0.466 0.502 0.999 1.379 1.370 1.425 1.161 0.484 0.707 1.660 1.156 1.499 1.099 0.604 0.719 1.100 0.694 1.069 0.736 0.837 0.618 0.413 1.153 0.694 0.899 0.834
119
108
1.9
3120
167
6
10.2
1.6
83.3
0.374
109 110
2.2
3000 3420
269 167
6 4
12 11.2
1.8 0.2
83.3 73.1
0.627 0.341
5.5 4.7 4.0 3.9
2580 2970 4120 2850 2620 3070 3800 3110 2500 3240 2990 2730 3460 3310 2660 3840 2950 2800 3380 3810 3550 2880 3110 2470 2870 3110 2540 3130 2610 2980 4410 2930 2920
231 237 210 257 259 209 219 221 210 184 284 251 196 220 223 239 282 209 259 288 221 208 301 803 373 232 439 261 207 197 221 274 192
7 4 3 6 3 4 3 2 3 3 3 4 4 4 4 1 3 5 1 1 5 5 11 3 1 3 5 4 4 5 5 0 2
10.9 10.3 14 18.1 15.8 15.2 16.2 14.4 17.2 22.7 21.1 17.4 27 15.2 12.8 17.2 15.3 18 19.4 18.7 15.2 12.1 20.5 22 19 19.2 24.8 12.3 9.2 10.9 13.8 16.3 16.6
0.2 0.5 1.7 3.3 2.1 1.5 1.5 0.6 1.9 2.2 1 5.4 7.5 0.9 0.3 0.4 3.6 2.6 1.5 0.5 2.4 0.3 3.3 2.1 1.7 7.2 8.7 0.7 0.2 0.3 5.1 7 3.4
89.1 87.5 65.5 73.7 80.2 91.2 68.4 74.0 76.0 92.6 73.6 73.3 86.7 129.9 94.0 65.1 74.6 67.9 88.8 81.4 87.3 86.8 96.5 85.0 90.6 90.0 94.5 86.3 80.5 97.3 36.3 68.3 75.3
0.626 0.558 0.356 0.631 0.691 0.476 0.403 0.497 0.587 0.397 0.664 0.643 0.396 0.465 0.586 0.435 0.668 0.522 0.536 0.529 0.435 0.505 0.677 2.273 0.909 0.522 1.209 0.583 0.555 0.462 0.350 0.654 0.460
3.7
3220
261
3
9
1.2
80.7
0.567
3640 3640 2960 2280 2530 3940 3340 2890 2680 3030 2580 3140 2760 2770 3300 3330 2460 1840 2870
157 181 228 253 258 231 244 210 214 187 416 242 217 256 207 196 233 339 244
4 12 4 4 2 4 5 13 4 6 9 3 2 6 5 6 6 5 3
5 5 12.1 13.1 14.1 15.2 19.5 14.9 7.8 15 21.6 16 18.4 19.9 12.8 10.6 20.2 13.6 15.7
0.2 0.2 3.7 1 1.1 5.3 6.2 2.5 0.3 2 4.5 8.8 1.4 0.2 2.1 0.7 2.6 11.1 6.4
57.7 82.4 81.1 65.8 63.2 78.7 80.8 69.2 85.8 92.4 89.1 60.5 87.0 75.8 60.6 63.1 89.4 65.2 76.7
0.302 0.348 0.539 0.776 0.713 0.410 0.511 0.508 0.558 0.432 1.128 0.539 0.550 0.646 0.439 0.412 0.662 1.288 0.595
111 112 113 114 115 116 117 118 119 120 121 122 123 124 125 126 127 128 129 130 131 132 133 134 135 136 137 138 139 140 141 142 143 144 145 146 147 148 149 150 151 152 153 154 155 156 157 158 159 160 161 162 163
3.7 2.1 2.0 2.5
2.4 2.8 2.5 2.7 3.4
3.0 8.9 6.9 6.1 5.3
4.0 3.2 4.0 4.5 3.4
5.1 3.7 4.3 4.7 4.0
4.4 3.5 5.1
3.1 2.5 4.9
120
164 165 166 167 168 169 170 171 172 173 174 175 176 177 178 179 180 181
3.6 3.7
182 183 184 185 186 187 188 189 190 191 192 193 194 195 196 197 198 199 200 201 202 203 204 205 206 207 208 209 210 211 212 213
4.2 4.4 2.8 3.6 4.7
3.9 2.4 2.6 1.8 3.4
2.1 3.5 3.5 3.1 3.9
2.2 2.2 1.3 1.6 2.4
2.3 2.2 2.2 1.9 2.4
2.2 2.2 2.5 2.7
1.9 2.3 2.2
3320 3050 2310 2320 2490 2590 2920 1700 2850 3390 4780 2330 3020 3030 2480 3340 3650 3630
423 228 216 136 193 180 200 259 195 221 192 120 296 208 154 320 557 260
6 4 4 3 4 6 4 4 2 3 7 10 2 2 4 2 3 3
16.4 18.1 5.8 8.5 10.6 11.1 14.1 13.2 10.5 15.8 9.9 4 11.2 5.1 9.6 16.4 12.2 9.5
11.8 10 0.2 0.2 1.9 4.1 3.7 2.7 0.9 0.4 0.4 1.1 0.2 0.2 1.8 6.8 0.2 0.2
57.2 72.1 64.9 77.6 68.3 65.6 71.9 70.6 70.2 76.7 43.9 77.3 66.2 66.0 76.6 65.9 68.5 66.1
0.891 0.523 0.654 0.410 0.542 0.486 0.479 1.065 0.478 0.456 0.281 0.360 0.685 0.480 0.434 0.670 1.067 0.501
3200 3810 2700 2690 2990 3180 3500 3220 2410 2420 2420 3180 2830 2800 2630 3090 2610 2620 3040 2530 2320 2650 2840 3080 3750 4200 3270 2780 3130 2610 2790 2610
228 516 708 691 282 263 212 135 148 163 99 303 167 162 517 204 287 208 133 119 129 185 118 539 284 177 323 202 360 85 335 262
6 2 5 1 5 4 4 31 12 7 8 5 4 4 3 2 8 4 2 4 3 4 5 3 6 2 2 3 4 9 11 2
8.4 13.6 13.4 9 12.8 14.7 6.8 4.2 3 5 3.8 12.4 6.5 9.1 11.3 10.2 10.9 5.8 10.8 9.5 7.1 11.5 11.6 13.8 13.6 15 6.3 12.6 8.8 7 11.5 13.7
0.2 2.3 2.3 0.9 1.4 2 0.9 3.8 0.7 0.3 1.5 1.2 0.2 1.2 0.6 2.3 3 0.9 0.7 1.1 0.2 0.8 5 7.3 7.6 4.5 2 0.2 0.2 2.9 2.7 0.4
53.1 34.1 70.4 63.2 80.3 78.6 57.1 65.2 83.0 62.0 78.5 72.3 70.7 60.7 76.0 80.9 76.6 76.3 88.8 75.1 90.5 94.3 88.0 94.2 88.0 107.1 100.9 107.9 92.7 92.0 100.4 76.6
0.498 0.947 1.834 1.796 0.660 0.578 0.424 0.293 0.429 0.471 0.286 0.666 0.413 0.405 1.375 0.462 0.769 0.555 0.306 0.329 0.389 0.488 0.291 1.224 0.530 0.295 0.691 0.508 0.804 0.228 0.840 0.702
121
Appendix B. Bench Scale Data Time
5-Day MLSS
1 2 3 4 5 6 7 8 9 10 11 12 13 14 15 16 17 18 19 20 21 22 23 24 25 26 27 28 29 30 31 32 33 34 35 36 37
880 1300 1440 1390 1170 1220 1110 980 980 950 930 850 840 870 730 810 870 860 970 1010 840 1070 1230 1780 1970 2270 2340 2760 3000 2980 2960 2940 2740 3060 3346 2960 3120
38 39 40 41 42 43 44 45 46 47 48 49 50 51
2840 2460 2340 2380 2240 1920 1740 1520 1540 1580 1340 1240 1340 1290
Inf. COD
116.3 204 181.1 155.3 155.3 275.7 243.2 252.9 246.4 272.4 217.1 249.7 477.4 483.9 236.6 366.8 623.8 636 867.8 649.9 496.9 155.3 383.1 321 285.4 539.3
274.6
Eff. COD
Inf. NH4+
Eff. NH4+
62.1
24 15.7 16.1 15.8 19.2 19.2 21.9 22.1 22.2 19.7 20.2 19 19.4 21.1 20.1 22.2 21.5 24 23.6 24.4 23.3 23.9 48.8 49.2
0.1 0.1 0.1 0.1 0.12 0.12 0.1 0.1 0.1 0.1 0.1 0.1 0.1 0.1 0.1 0.1 0.1 0.1 0.1 0.1 0.1 0.1 17.7 31.6
45.4 54.3 40 39.5 33.8 34
22.6 13.3 0.2 0.1 0.1 0.1
35.5 40 39.6 39 27.9
5.81 0.1 0.1 0.1 0.1
41.7 76 30 43 42 22 38.3 37.4
72
82
144.3 69.1
118.4 104.3 78 65.7 85.4 65.2 79 105 111.7 60
173.1 170
51.7 29.4
23.6 22.8
0.1 0.1
190.6 220 573.1 246.9 157 607.6 279.5
38.2 57.3
23.5 24.7 24.4 24 23.3
0.1 0.1 0.1 0.1 0.1
25.4 34.2 30.2
0.1 0.1 0.1
282.2
61.0209
71.8464
SVI
61.5 59.0 61.2 64.1 61.5 73.9 83.7 173.5 578.9 946.2 1141.2 1188.1 1092.0 1212.3 1123.5 1023.0 970.9 835.1 752.5 1071.4 831.8 512.2 387.6 355.3 383.3 363.2 322.1 278.3 310.4 250.0 265.3 226.3 178.1 257.0 206.1 169.9 162.0 170.7 149.6 175.6 200.9 234.4 252.9 289.5 344.2 489.2 649.3 564.5 522.4 465.1
F/M mg COD/mg MLSS.day
0.272 0.458 0.447 0.434 0.434 0.795 0.716 0.815 0.804 0.858 0.815 0.786 1.521 1.367 0.772 0.939 1.389 0.979 1.047 0.761 0.493 0.142 0.352 0.297 0.285 0.483
0.241 0.193 0.199
0.902 0.445 0.279 1.054
0.599
122
52 53 54 55 56 57 58 59 60 61
1340 1290 1380 1250 1160 1090 1010
288.7 265.9
73.57848 82.6719
31.9 29.7
0.1 0.1
226.9 311.5 233.4
73.57848 63.61902 78.3417
29.3 18.8
0.1 0.1
860 780
308
60.58788
20
0.12
62 63 64 65 66 67 68 69 70 71 72 73 74 75 76 77 78 79 80 81 82 83 84 85 86 87 88 89 90 91 92 93 94 95 96 97 98 99 100 101 102 103 104 105 106 107 108
930 1050 1050 1220 1180 1240 1050 1300 1270 1330 1220 1080 1010 1030 970 880 950 970 1740 2130 2200 2000 1870 1620 1740 1480
662 228 265 222 210 754 163 376.2 213 222 222
52.2 55.3 75 137 108.3 84 84.9 52.6 94.2 63 69.5
19.5 20.7 19.8 20.5
0.1 11.3 15.5 16.4
21.6 22.2 22.3 24.4 23.1
17 17.9 19.3 20.6 21.3
397 126
63 70.5
22.7 19.8
21.1 19.2
213 163
85.5 91.6
17.7
16.4
19.9 19.1
17.6 18.5
1320 1460 1640 1480 1320 1200 1240 1400 1500 1360 1320 1040 960 820 760 620 640
330
71.9
19.1
17.3
243 166.9 185 256.1
75.2 70.5 82.2 93
20.1 20 21.8 23.9
18.3 19.2 18.7 20.1
298 275.3 242 210 189.5
105 66.8 79.2 47.8 42.25
23 21.9 20.3 22.6 26.7
20.5 20.8 21.1 21.7 21.6
203.8 259.6
70.6 86.1
28.6 27.3 26.3 15.1 14 10.5 9.9 10 9.7
23.5 24.6 23.5 16.4 15.3 11.9 10.2 10.2 12.7
8.2
7.4
220.2 105.2
52.4
101.9
49.5
425.4 347.3 202.9 80.0 38.8 36.7 29.7
0.590 0.565
34.9
0.981
26.9 28.6 28.6 32.8 40.7 96.8 85.7 96.2 133.9 169.2 192.6 277.8 267.3
1.950 0.595 0.691 0.499 0.488 1.666 0.425 0.793 0.459 0.457 0.499
360.8 272.7 368.4 345.4 136.8 79.8 70.5 65.0 53.5 49.4
0.497 0.736 0.587
1.077 0.335 0.663 0.460
0.411 0.356 0.282
75.8 68.5 57.9 64.2 64.4 100.0 141.1 178.6 133.3 216.9 185.6 177.9 130.2 103.7 98.7 72.6 62.5
0.372 0.523 0.580 0.351
0.436
123
109 110
620 560
121.6
33.3
111 112 113 114 115 116 117 118 119 120 121 122 123 124 125 126 127 128 129 130 131 132 133 134 135 136 137 138 139 140 141 142 143
400 410 510 530 540 640 680 720 770 770 960 1040 1140 1320 1280 1440 1420 1480 1440 1420 1320 1240 1200 1240 1060 1020 1040 860 940 850 700 540 550
170.9 213.6 177.5 630.9 371.3
64.9 58.2 57.4 35.6 48.6
167.6 272.7
52 52.4
144
640
39.1
145 146 147 148 149 150 151 152 153 154 155 156 157 158 159 160 161 162 163 164
370 500 500 570 570 690 530 690 720 650 680 710 850 850 870 790 900 960 1040
67.6 50.0 50.0 49.1 49.1 40.6 47.2 43.5 34.7 38.5 41.2 39.4 49.4 47.1 46.0 50.6 50.0 57.3 56.7
305.6 420.6 368.2 408.7 368
368 343 305
285 174.2 49.3
9.1
7.5
61.3 53.6
12.3 14 15.7 14.8 15.8 15.6 16.1 17 15.9
6.3 8.9 11.1 11.7 9.7 9.5 8.8 8.8 8.6
50
19.8 20.7 21.5
7.1 9.1 9.5
77.3 76.1 81.5 74.9 55.3
26.1 25 34.1 28.2 28.5
8.9 7.6 23.7 8.1 4.27
47 60.4
23.1 22.5 22.4 24.2 23.5
0.11 0.54 0.1 2.47 5
22.4 22.5 11.6 11.7
4.21 1.58 0.1 0.1
62.5 61.0 49.0 56.6 46.3 46.9 55.9 55.6 58.4 51.9 60.4 65.4 61.4 64.4 66.4 69.4 70.4 74.3 79.9 83.1 90.9 88.7 79.2 76.6 75.5 73.5 67.3 58.1 62.8 58.8 54.3 55.6 54.5
105 100.5
93.2 58.7
75.6 105.2 141.3
21 28 35
16.1 15.3
0.1 0.1
135.2
41.4
16.1 14.1
0.198 0.1
140.6 172.8
50.5 68.8
16.1 16.1
0.1 0.1
197.2
132.8
19.8 20.2
0.1 0.1
180.8 134.5 190.6 182.4 177.5
122.3 35.4 28.6 44.6
20.1 19.8
0.1 0.1
18.9 17.5
0.1 0.1
0.537
1.142 1.147 0.918 3.201 1.589 0.675 1.038
0.581 0.811
0.951 0.803
0.250
0.414 0.506 0.679
0.064
0.627 0.409 0.544
124
165 166 167 168 169 170 171 172 173 174 175 176 177 178 179 180 181
940 1030 900 900 860 900 860 900 810 690 660 840 898 780 670 610 560
154.5 161
164.1 72.1
151
74.3
182 183 184 185 186 187 188 189 190 191 192 193 194 195 196 197 198 199 200 201 202 203 204 205 206 207 208 209 210 211 212 213
520 480 470 450 450 440 470 430 640 720 630 520 390 470 520 650 870 840 820 900
216.9
720 740 630 630 610 640 670 800 780 640
197.2
21.4 21.4
0.1 0.1
20.8
0.1
20.6 19
0.1 0.1
26.2
0.1
26.1
0.1
19.5
0.1
21.1
0.12
16.9
0.1
18
0.11
13.4
0.1
36.4
190.6
97.7
58.3 66.7 77.8 80.2 66.7 69.8 66.7 80.2 72.5 68.2 77.4 75.6 102.6 59.7 49.2 53.6 53.8 52.1 53.2 44.4 44.4
210.3 197.2 210.3
0.450 0.428 0.460 0.600
0.757
1.143
1.309 12.8 12.6 12.5
0.2 0.15 0.1
12.9
0.16
13.5 13.1 13.2
0.1 0.1 0.1
12.9
0.1
11.5
0.1
9.1
1.85
53.2 58.1 46.9 48.6 47.6 57.7 64.1 53.2 48.1 38.5 34.5 35.7 34.1 33.3
1.256 0.900
34.7 33.8 39.7 31.7 32.8 39.1 37.3 37.5 38.5 0.0
125
Vita Jack McClendon Carley was born in Knoxville, Tennessee on September 19, 1974. He attended the public system of schools in Knox County, where he graduated from Bearden High School in May 1992. He entered the University of Tennessee-Knoxville in August 1992, receiving a Bachelor of Agriculture in Plant and Soil Science in December 1996. Mr. Carley entered the Master’s program in Environmental Engineering as a full time student in August of 1998.
Working as a graduate research assistant, he officially
received his Master of Science Degree in Environmental Engineering in April 2003.
126