Jan 23, 1996 - Tungsten Inert Gas (TIG).I© 1997 British ... In gas shielded arc welding, ozone itself is formed by the interaction of oxygen and ultra-violet (u.v.) ...
Ann. iiccup. Hyg., Vol. 41, No. I, pp. 95-104, 1997 Copyright © 1997 British Occupational Hygiene Society Published by Elscvier Science Ltd. Printed in Great Britain 0003-4878/97 SI7.00 + 0.00
PH: S0003-^878(96)00023-3
THE EFFECTS OF WELDING PARAMETERS ON ULTRAVIOLET LIGHT EMISSIONS, OZONE AND CrYl FORMATION IN MIG WELDING * John H. Dennis, Seyed B. Mortazavi, Mike J. French, Peter J. Hewitt and Chris R. Redding [Department of Environmental Science, University of BradfordTteradford BD7 1DP,(U.K!A (Received 23 January 1996) Abstract—'•This paper describes the relationships between ultra-violet emission, ozone generation and Cr VI production in MIG welding which were measured as a function of shield gas flow rate, welding voltage, electrode stick-out and shield gas composition using an automatic welding rig that permitted MIG welding under reproducible conditions. The experimental results are interpreted in terms of the physico-chemical processes occurring in the micro- and macro-environments of the arc as part of research into process modification to reduce occupational exposure to ozone and Cr VI production rates in MIG welding. We believe the techniques described here, and in particular the use of what we have termed u.v.-ozone measurements, will prove useful in further study of ozone generation and Cr v l formation and may be applied in the investigation of engineering control of occupational exposure in MIG and other welding process such as Manual Metal Arc (MMA) and Tungsten Inert Gas (TIG).I© 1997 British Occupational Hygiene Society.
INTRODUCTION
The adverse health effects of occupational exposure to welding fumes continue to be of concern to the welding industry (Hewitt, 1994; Moulin et ah, 1993). In particular, hexavalent chromium (CrVI) has been implicated as a suspected carcinogen (Moulin et al., 1990; Langard and Stern, 1984; Stern, 1983), and so CrVI, one component of welding fume, is a major concern to occupational health. The research described in this paper is part of an investigation into the mechanisms of CrVI formation in welding operations. The purpose of this research is to gain a greater understanding of the fundamental physico-chemical principles of CrVI formation in weld fume with a view to providing direction on suitable engineering controls to reduce or eliminate this particularly toxic species. CrVI is formed from Cr m and from metallic Cr by oxidation, primarily by ozone. In gas shielded arc welding, ozone itself is formed by the interaction of oxygen and ultra-violet (u.v.) radiation emitted from the arc. In this paper, the relationship between u.v. emission from the arc, ozone generation and CrVI formation is investigated through a series of experiments for which we have developed new and robust techniques of measurement. These techniques are used to investigate the effects of shield gas flow rate, welding voltage, electrode stick-out, and shield gas composition on the relative levels of u.v., ozone and CrVI. 95
96
J. H. Dennis el al. METHODOLOGY
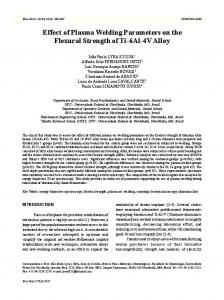
Measurement of ozone concentrations Measurements of ozone concentrations were made at a fixed sampling position relative to the welding gun at 60° from the arc and 75 mm horizontal distance from weld as shown in Fig. 1. The probe was fixed on to the welding gun and was attached via 2 m PTFE tubing to a pre-calibrated chemiluminescent ozone analyser (AID model 650, Analytical Instrument Development Inc.) capable of measuring ozone concentrations in the range 1 ppb to 100 ppm. For measurements close to the arc, the glass probe shown in Fig. 1 was replaced by a stainless steel tipped probe to ensure the sampling point was not damaged by proximity to the welding arc. Two 37 mm diameter, 0.2 um PTFE filters were inserted in the connecting line to prevent weld aerosols from entering the ozone analyser. Of these, the first filter (nearest the sampling tip) was renewed after every test: the second was renewed after a series of nine tests. Before undertaking any measurements on welding emissions, the sampling probe, PTFE tubing and filters were conditioned, to prevent subsequent absorption of ozone, by passage of 10 ppm of ozone from a Pennwalt ozone generator (Wallace and Tiernan) for 10 min. A reproducible MIG welding operation was then initiated using the standard equipment and conditions developed within our laboratory (Hewitt and Hirst, 1993). A stainless steel solid wire, 1.2 mm Bostrand 309L (ESAB) was employed and the feed rate, stick out, voltage and amperage were controlled as required. Welding was undertaken on mild steel plates (300 mm square by 10 mm thick) rotating at lOrevh" 1 on a motorized turntable (equivalent to a base plate movement of 12.6 cm min~'). This technique produces a consistent, circular weld bead (Fig. 1).
(d)
(c)
(b)
(a)
Fig. 1. Schematic diagram of MIG welding fume chamber, (a) A sampling point for O3 is attached to the welding gun in a fixed position, (b) U.v. is measured 1 m from arc using a diode array detector, (c) U.v.Oj is measured through a quartz window, (d) Total fume and CrVI are collected on GF/A niters for subsequent analysis.
Ultra-violet emission, ozone and Cr v i in welding
97
Ozone concentration measurements were averaged over a 60 s period, after first welding for 60 s to allow for equilibration of temperature within the welding chamber. All experiments were performed in triplicate. Measurement of the relative intensity and spectral distribution ofu.v. radiation The intensity and the spectral distribution of the u.v. radiation generated by the arc were measured using a scanning diode array spectrometer (Tracor Northern TN 1710). The radiation emitted by the arc was analysed by a crossed Czerny-Turner spectrograph placed at an angle of 45° above and 1.0 m from the welding arc. Spectra were recorded using a scanned diode array and the output from the array was transferred via a multi-channel analyser to an Elonex 486 PC. Using in-house software, the data from the diode array were processed to give the arc emission spectrum over a 70 nm interval. The central wavelength of the spectrum was determined by the setting of the spectrograph. Welding was initiated as described above and readings of the relative intensity of u.v. were taken 90 s after initiation of the welding operation. A 1 s exposure of the diode array was used for each reading. The sum of the intensities in the central seven channels (approximately 1 nm centred on 275 nm) was taken as a measure of the average u.v. emission intensity from the arc. Indirect measurement ofu.v. intensity In our investigations, we have found it useful to employ an indirect method of measurement of the u.v. intensity which we term 'u.v.-ozone'. The ozone-generating potential of the u.v. light emitted from MIG welding is measured using a quartz windowed, glass cell (Jenkins et ai, 1981), as shown in Fig. 1. The quartz window of the cell directly faced the weld arc at a distance of 500 mm and at a vertical angle of 30°: this allowed the u.v. radiation emitted by the arc to enter the cell in a consistent and reproducible way. During measurements, clean dry air was drawn through the cell at a constant flow rate of 0.9 1. min" 1 and the ozone concentration generated in the cell measured by the chemiluminescent analyser as described above. Weld spatter was directed away from the quartz window by an external jet of compressed air to prevent damage to the window. The quartz window was periodically inspected for damage and replaced when necessary. Measurement of Cry/ in welding fume The fume emitted during the welding operation was collected on a filter paper (Whatman 42) at the top of the exposure chamber (Fig. 1). The fume was removed from the filter paper by gentle scraping and brought into solution in 2% NaOH-3% Na2CO3. The resultant CrVI was analysed by AAS (Perkin-Elmer 1100) at 359.7 nm. Experiments undertaken Using the methods described above, the ozone concentrations, the intensity and spectral distribution of the u.v. radiation generated, the u.v.-ozone and the CrVI formation rate were measured in a series of experiments to determine the effect of: (a) shield gas flow rate, (b) welding voltage,
J. H. Dennis el al.
98
(c) electrode stick-out, and (d) shield gas composition.
RESULTS AND DISCUSSION
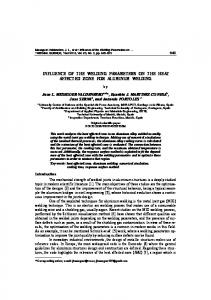
Effect of shield gas flow rate MIG welding was undertaken using the standard techniques described above. The shield gas was Ar5 (BOC Ltd) with a composition of 93% argon, 5% CO 2 and 2% O 2 . The shield gas flow rate was varied in the range 5, 10, 15, 20 and 27.5 1. min~'. After allowing 60s for the stabilization of weld conditions, measurements of the ozone concentration, the relative u.v. intensity, the u.v.ozone and the Cr v l formation rate were made using the methods described above. For each flow rate, measurements of each parameter were made in triplicate. The mean results of this series of experiments are shown in Fig. 2. When no shield gas is employed the relative intensities of u.v. and the u.v.-ozone are both low (Fig. 2). When shield gas is added, even at the low flow rate of 5 1. min" 1 , a sharp increase in the relative intensity of u.v. and of the u.v.-ozone is observed. We suggest this may be due to both the contribution of the shield gas to u.v. formation as well as the decrease in fume formation rate (defined as the rate at which fume is evolved from the weld—usually expressed in units of mg min~') which is known to accompany the introduction of shield gas (Stenback, 1989). We were unable to detect any ozone when welding without shield gas (Fig. 2). When the shield gas was added, even at 5 1. min" 1 , an increase in ozone concentration was observed. We ascribe our inability to observe ozone generation in the absence of a shield gas to the low intensity of the u.v. radiation emitted in this situation coupled with ozone decomposition through the following mechanisms: (a) thermal decomposition of the ozone at the high arc temperatures, (b) chemical depletion of the ozone by oxides of nitrogen, specifically NO, which form at high concentrations in the vicinity of the weld, and
10 20 Shield gas flow rate (1/min) Fig. 2. The effect of shield gas flow rate on relative magnitude of u.v., u.v.-O,, O 3 , Cr v l and fume formation rate (FFR) under standard weld conditions. In order to facilitate comparison, measures of each parameter are normalized as relative magnitude where relative magnitude is defined as a proportion of the highest recorded value of each parameter.
Ultra-violet emission, ozone and Cr v l in welding
99
(c) catalytic reduction of ozone by the substantial concentrations of particulate metal fume formed in the vicinity of the arc. The addition of a shield gas reduces the impact of these three mechanisms and allows the observed increase in ozone generation to occur. Although the intensity of u.v. radiation increases only slowly above a shield gas flow rate of 10 1. min~' (probably as a result of a slow reduction in the fume formation rate), the ozone concentration increases significantly. This may be due to the expansion of the boundary of the micro- and macro-environments, that is, the boundary between shield gas and surrounding atmosphere of the arc. This would result in the temperature of air adjacent to the arc being lowered, leading, in turn to lower NO concentrations and hence to less thermal and chemical depletion of the ozone. There is a modest rise in the CrVI formation rate as the shield gas flow rate increases (see Fig. 2). In the absence of a shield gas, ozone formation occurs in the center of the arc with oxygen as the dominant oxidizer. As shield gas is introduced it encourages the slow spreading of an inert shield, like an expanding bubble around the arc (Hewitt and Madden, 1989) thus establishing a stable and reproducible micro environment. This restricts the access of oxygen and ozone to the arc and thus the site of oxidation moves to the macro-environment with ozone as the dominant oxidizing species. As the shield gas flow rate is further increased, the increasing Cr vl formation rates closely parallel the increasing ozone concentrations noted. Effect of welding voltage
Measurements of ozone concentration, relative u.v. intensity, u.v.-ozone and CrVI formation rates were made as the welding voltage was varied from 15 to 35 V in 2 V intervals under the standard welding conditions described above; the results of these experiments are summarized in Fig. 3. Both the u.v. intensity and the u.v.-ozone might be expected to increase when the energy input to the arc increases as the applied voltage increases. The results shown in Fig. 3, however, indicate that the relative intensities of the u.v. radiation and the u.v.-ozone only increase with increasing voltage to around 27 V, after which they decrease until approximately 31 V, before increasing again sharply. We suggest that both the u.v. intensity and the u.v.-ozone mirror the change in the mode of metal transfer in the arc. At low welding voltages (less than 17 V and 100 A) the dip mode predominates corresponding to low intensity u.v. and low u.v.-ozone. The change to globular mode (18-27 V, 120-230 A) is characterized by an increase in both the u.v. intensity and u.v.-ozone. Twenty-seven volts and 270 A is considered the boundary region between the globular mode and spray modes where the arc is unstable and characterized by a decrease in both the u.v. intensity and u.v.-ozone. When the more stable spray mode dominates (greater than 31 V), the u.v. intensity and u.v.-ozone increase sharply. This pattern of behaviour for the u.v. emission and ozone generation from the arc parallels the observations made by Gray et al. (1982) for fume formation in MIG welding. The ozone concentration might be expected to increase as the u.v. intensity increases, since u.v. radiation is generally thought to be the primary mechanism by which ozone is formed in welding operations (Lunau, 1967), but our results indicate
100
J. H. Dennis el al.
15
20
25 30 Welding voltage (V)
35
Fig. 3. The effect of welding voltage on relative magnitude of u.v., u.v.-O 3) O 3 , Cr v l and FFR under standard weld conditions. Measures of each parameter are normalised as relative magnitude defined as a proportion of the highest recorded value.
that the relationship between ozone concentrations and u.v. intensity is not so simple. Ozone concentrations rise up to 17 V, after which they decrease with increasing voltage (Fig. 3). It appears probable that at voltages below 17 V, conditions may favour ozone formation over ozone depletion by thermal decomposition, by reaction with NO and by catalytic decomposition by welding fume aerosols. When the welding voltage increases above 17 V, conditions near the arc may favour accelerated ozone decomposition and this factor over-rides the effect of increased rate of ozone production associated with increasing u.v. intensity. This results in a drop in the measured ozone concentration above 17 V (Fig. 3). It is of interest to note that at this point (17 V), the welding mode changes from dip to globular mode. The data in Fig. 3 show that the CrVI formation rate rises steadily with welding voltage in the range 15-21 V, before gradually falling to continuously to 35 V, the highest voltage studied. In the 15-21 V range, the globular mode of metal transfer is becoming established. As a consequence, the arc becomes more continuous and its length increases. This allows sufficient time for evaporation of metal from the surface of the droplets and hence an increase in surface area and reactivity of the metal droplets. This, coupled with an increase in spatter and in ozone concentration, leads to the observed increase in CrVI formation rate. In the voltage range 22-31 V, the observed decrease in CrVI formation rate may be ascribed to: (a) the decrease in ozone concentration observed (Fig. 3). As the arc temperature increases, a greater proportion of the ozone formed will undergo thermal decomposition, (b) the reduction in fume formation rate decreases the metal fume surface area available for oxidation, and (c) the increased energy input into the arc increases the concentration of less volatile metals, such as Fe and Ni, stripped from the surface of the electrode and contributing to the weld pool, thus reducing the relative Cr concentration in the weld pool. The decrease in CrVI formation rate in the range 31-35 V corresponds to the onset of the spray mode of metal transfer. In this mode the thermal decomposition of ozone is enhanced by high arc temperatures. Spatter is also reduced in the spray
Ultra-violet emission, ozone and Cr v l in welding
101
mode which inhibits fractionation of the fume, leading to a relative increase in less volatile metals being present in the fume and a concomitant decrease in relative fraction of Cr present for oxidation. Elevated temperatures close to the also promote oxidation of Cr to spinel oxides, reducing the availability of Cr oxidation in the macro-environment.
the the arc for
Effect of 'stick-out' Measurements of ozone concentration, relative u.v. intensity, u.v.-ozone and CrVI formation rate were made during MIG welding under the standard welding conditions described above as the stick-out was altered from 15 to 30 mm by 5 mm intervals. The results (Fig. 4) indicate that the relative intensity of u.v. and the u.v.ozone decrease as stick-out increases. We suggest this is due to a significant increase in arc resistance and concomitant decrease in welding current (of approximately 30 A) as stick-out increases from 15 to 30 mm. Although this increase in resistance could be offset by increasing other weld conditions (wire feed rate, for example), this would negate the use of standard welding conditions. We suggest that the significant increase in ozone concentration observed as the stick-out is due to: (a) a decrease in the rate of ozone decomposition as a consequence of the decrease in the fume formation rate, temperature and NO concentration drop which, in turn, may be attributed to the decrease in arc current, and/or (b) the increase in the stick-out increases the surface area of the boundary zone between the micro- and macro-environments. Since the majority of the ozone formation occurs at this interface the ozone concentration is increased proportionately. We suggest that the expected increase in CrVI as a result of increased O3 generation is offset by a corresponding decrease in CrVI formation as a consequence of the decrease in welding current as electrode stick out is increased (Fig. 4). Effect of shield gas composition
It is well known that the composition of shield gas is an important factor controlling the emissions in MIG welding. The ozone concentration, the relative
20
25
30
Stick out (mm) Fig. 4. The effect of electrode stick-out on relative magnitude of u.v., u.v.-O 3 , O 3 , Cr VI and FFR under standard weld conditions. Measures of each are normalized as relative magnitude defined as a proportion of the highest recorded value.
102
J. H. Dennis el al.
intensity of emitted u.v. radiation, u.v.-ozone and Cr VI formation rate were monitored under standard welding conditions for a series of shield gases of different compositions. The specific shield gases examined were: pure Ar, Ar with 5% CO 2 , Ar with 20% CO 2 , pure CO 2 , Ar with 300 ppm NO (commercial MISON, AGA), Ar with 300 ppm ethene, Ar with 300 ppm dichlorodifluoromethane (CF2CI2), Ar with 85% He and 2% CO 2 (commercial HI, BOC), and Ar with 38% He and 2% CO 2 (commercial H101, BOC). The results of these experiments (Fig. 5) demonstrate that the relative intensity of u.v. radiation emitted, the u.v.-ozone and ozone concentration all decrease as the percentage of CO 2 in the argon shield gas increases. We suggest this may be due to: (a) increased absorption of emitted u.v. by CO 2 in the micro-environment, (b) the thermal conductivity of CO 2 is greater than that of Ar. Consequently heat transfer is more efficient in the presence of CO 2 (Dahlberg, 1971) and the temperature of the CO 2 shielded arc is lower. This in turn reduces the u.v. intensity emitted by the CO 2 shielded arc, or (c) the addition of CO 2 results in an increase in the mass of fume produced (Gray et al., 1982) which in turn physically obstructs the amount of u.v. emitted from the arc. It is also apparent from Fig. 5 that the rate of Cr VI production also decreases as the percentage of CO 2 in the shield gas increases above 5%. We believe that this results from the decrease in ozone generation as well as increased generation of oxygen through thermal decomposition of CO 2 . Oxygen reacts with freshly formed metal fume particles in the micro-environment of the shield gas zone leading to the formation of metal oxides. These Cr 1 " oxides in the cooler macro-environment are resistant to oxidation to Cr VI .
'
a
B
a A
A
e
0