M. Carroll, J. R. Fry, E. Gabathuler, R. Gamet, M. George, M. Kay, S. McMahon, T. R. McMahon,. D. J. Payne, C. .... 6.1 Track Finding and Kalman Filtering . ..... well with Monte Carlo predictions for the resolution with perfect alignment.
arXiv:hep-ex/0012042v1 18 Dec 2000
BABAR-CONF-00/17 SLAC-PUB-8539
The first year of the BABAR experiment at PEP-II
The BABAR Collaboration February 7, 2008
Abstract The BABAR detector, situated at the SLAC PEP-II asymmetric e+ e− collider, has been recording data at energies on and around the Υ (4S) resonance since May 1999. In this paper, we briefly describe the PEP-II B Factory and the BABAR detector. The performance presently achieved by the experiment in the areas of tracking, vertexing, calorimetry and particle identification is reviewed. Analysis concepts that are used in the various papers submitted to this conference are also discussed.
Submitted to the XXXth International Conference on High Energy Physics, Osaka, Japan
The BABAR Collaboration B. Aubert, A. Boucham, D. Boutigny, I. De Bonis, J. Favier, J.-M. Gaillard, F. Galeazzi, A. Jeremie, Y. Karyotakis, J. P. Lees, P. Robbe, V. Tisserand, K. Zachariadou Lab de Phys. des Particules, F-74941 Annecy-le-Vieux, CEDEX, France A. Palano Universit` a di Bari, Dipartimento di Fisica and INFN, I-70126 Bari, Italy G. P. Chen, J. C. Chen, N. D. Qi, G. Rong, P. Wang, Y. S. Zhu Institute of High Energy Physics, Beijing 100039, China G. Eigen, P. L. Reinertsen, B. Stugu University of Bergen, Inst. of Physics, N-5007 Bergen, Norway B. Abbott, G. S. Abrams, A. W. Borgland, A. B. Breon, D. N. Brown, J. Button-Shafer, R. N. Cahn, A. R. Clark, Q. Fan, M. S. Gill, S. J. Gowdy, Y. Groysman, R. G. Jacobsen, R. W. Kadel, J. Kadyk, L. T. Kerth, S. Kluth, J. F. Kral, C. Leclerc, M. E. Levi, T. Liu, G. Lynch, A. B. Meyer, M. Momayezi, P. J. Oddone, A. Perazzo, M. Pripstein, N. A. Roe, A. Romosan, M. T. Ronan, V. G. Shelkov, P. Strother, A. V. Telnov, W. A. Wenzel Lawrence Berkeley National Lab, Berkeley, CA 94720, USA P. G. Bright-Thomas, T. J. Champion, C. M. Hawkes, A. Kirk, S. W. O’Neale, A. T. Watson, N. K. Watson University of Birmingham, Birmingham, B15 2TT, UK T. Deppermann, H. Koch, J. Krug, M. Kunze, B. Lewandowski, K. Peters, H. Schmuecker, M. Steinke Ruhr Universit¨ at Bochum, Inst. f. Experimentalphysik 1, D-44780 Bochum, Germany J. C. Andress, N. Chevalier, P. J. Clark, N. Cottingham, N. De Groot, N. Dyce, B. Foster, A. Mass, J. D. McFall, D. Wallom, F. F. Wilson University of Bristol, Bristol BS8 lTL, UK K. Abe, C. Hearty, T. S. Mattison, J. A. McKenna, D. Thiessen University of British Columbia, Vancouver, BC, Canada V6T 1Z1 B. Camanzi, A. K. McKemey, J. Tinslay Brunel University, Uxbridge, Middlesex UB8 3PH, UK V. E. Blinov, A. D. Bukin, D. A. Bukin, A. R. Buzykaev, M. S. Dubrovin, V. B. Golubev, V. N. Ivanchenko, A. A. Korol, E. A. Kravchenko, A. P. Onuchin, A. A. Salnikov, S. I. Serednyakov, Yu. I. Skovpen, A. N. Yushkov Budker Institute of Nuclear Physics, Siberian Branch of Russian Academy of Science, Novosibirsk 630090, Russia A. J. Lankford, M. Mandelkern, D. P. Stoker University of California at Irvine, Irvine, CA 92697, USA A. Ahsan, K. Arisaka, C. Buchanan, S. Chun University of California at Los Angeles, Los Angeles, CA 90024, USA
2
J. G. Branson, R. Faccini,1 D. B. MacFarlane, Sh. Rahatlou, G. Raven, V. Sharma University of California at San Diego, La Jolla, CA 92093, USA C. Campagnari, B. Dahmes, P. A. Hart, N. Kuznetsova, S. L. Levy, O. Long, A. Lu, J. D. Richman, W. Verkerke, M. Witherell, S. Yellin University of California at Santa Barbara, Santa Barbara, CA 93106, USA J. Beringer, D. E. Dorfan, A. Eisner, A. Frey, A. A. Grillo, M. Grothe, C. A. Heusch, R. P. Johnson, W. Kroeger, W. S. Lockman, T. Pulliam, H. Sadrozinski, T. Schalk, R. E. Schmitz, B. A. Schumm, A. Seiden, M. Turri, D. C. Williams University of California at Santa Cruz, Institute for Particle Physics, Santa Cruz, CA 95064, USA E. Chen, G. P. Dubois-Felsmann, A. Dvoretskii, D. G. Hitlin, Yu. G. Kolomensky, S. Metzler, J. Oyang, F. C. Porter, A. Ryd, A. Samuel, M. Weaver, S. Yang, R. Y. Zhu California Institute of Technology, Pasadena, CA 91125, USA R. Aleksan, G. De Domenico, A. de Lesquen, S. Emery, A. Gaidot, S. F. Ganzhur, G. Hamel de Monchenault, W. Kozanecki, M. Langer, G. W. London, B. Mayer, B. Serfass, G. Vasseur, C. Yeche, M. Zito Centre d’Etudes Nucl´eaires, Saclay, F-91191 Gif-sur-Yvette, France S. Devmal, T. L. Geld, S. Jayatilleke, S. M. Jayatilleke, G. Mancinelli, B. T. Meadows, M. D. Sokoloff University of Cincinnati, Cincinnati, OH 45221, USA J. Blouw, J. L. Harton, M. Krishnamurthy, A. Soffer, W. H. Toki, R. J. Wilson, J. Zhang Colorado State University, Fort Collins, CO 80523, USA S. Fahey, W. T. Ford, F. Gaede, D. R. Johnson, A. K. Michael, U. Nauenberg, A. Olivas, H. Park, P. Rankin, J. Roy, S. Sen, J. G. Smith, D. L. Wagner University of Colorado, Boulder, CO 80309, USA T. Brandt, J. Brose, G. Dahlinger, M. Dickopp, R. S. Dubitzky, M. L. Kocian, R. M¨ uller-Pfefferkorn, K. R. Schubert, R. Schwierz, B. Spaan, L. Wilden Technische Universit¨ at Dresden, Inst. f. Kern- u. Teilchenphysik, D-01062 Dresden, Germany L. Behr, D. Bernard, G. R. Bonneaud, F. Brochard, J. Cohen-Tanugi, S. Ferrag, E. Roussot, C. Thiebaux, G. Vasileiadis, M. Verderi Ecole Polytechnique, Lab de Physique Nucl´eaire H. E., F-91128 Palaiseau, France A. Anjomshoaa, R. Bernet, F. Di Lodovico, F. Muheim, S. Playfer, J. E. Swain University of Edinburgh, Edinburgh EH9 3JZ, UK C. Bozzi, S. Dittongo, M. Folegani, L. Piemontese Universit` a di Ferrara, Dipartimento di Fisica and INFN, I-44100 Ferrara, Italy E. Treadwell Florida A&M University, Tallahassee, FL 32307, USA 1
Jointly appointed with Universit` a di Roma La Sapienza, Dipartimento di Fisica and INFN, I-00185 Roma, Italy
3
R. Baldini-Ferroli, A. Calcaterra, R. de Sangro, D. Falciai, G. Finocchiaro, P. Patteri, I. M. Peruzzi,2 M. Piccolo, A. Zallo Laboratori Nazionali di Frascati dell’INFN, I-00044 Frascati, Italy S. Bagnasco, A. Buzzo, R. Contri, G. Crosetti, P. Fabbricatore, S. Farinon, M. Lo Vetere, M. Macri, M. R. Monge, R. Musenich, R. Parodi, S. Passaggio, F. C. Pastore, C. Patrignani, M. G. Pia, C. Priano, E. Robutti, A. Santroni Universit` a di Genova, Dipartimento di Fisica and INFN, I-16146 Genova, Italy J. Cochran, H. B. Crawley, P.-A. Fischer, J. Lamsa, W. T. Meyer, E. I. Rosenberg Iowa State University, Ames, IA 50011-3160, USA R. Bartoldus, T. Dignan, R. Hamilton, U. Mallik University of Iowa, Iowa City, IA 52242, USA C. Angelini, G. Batignani, S. Bettarini, M. Bondioli, M. Carpinelli, F. Forti, M. A. Giorgi, A. Lusiani, M. Morganti, E. Paoloni, M. Rama, G. Rizzo, F. Sandrelli, G. Simi, G. Triggiani Universit` a di Pisa, Scuola Normale Superiore, and INFN, I-56010 Pisa, Italy M. Benkebil, G. Grosdidier, C. Hast, A. Hoecker, V. LePeltier, A. M. Lutz, S. Plaszczynski, M. H. Schune, S. Trincaz-Duvoid, A. Valassi, G. Wormser LAL, F-91898 ORSAY Cedex, France R. M. Bionta, V. Brigljevi´c, O. Fackler, D. Fujino, D. J. Lange, M. Mugge, X. Shi, T. J. Wenaus, D. M. Wright, C. R. Wuest Lawrence Livermore National Laboratory, Livermore, CA 94550, USA M. Carroll, J. R. Fry, E. Gabathuler, R. Gamet, M. George, M. Kay, S. McMahon, T. R. McMahon, D. J. Payne, C. Touramanis University of Liverpool, Liverpool L69 3BX, UK M. L. Aspinwall, P. D. Dauncey, I. Eschrich, N. J. W. Gunawardane, R. Martin, J. A. Nash, P. Sanders, D. Smith University of London, Imperial College, London, SW7 2BW, UK D. E. Azzopardi, J. J. Back, P. Dixon, P. F. Harrison, P. B. Vidal, M. I. Williams University of London, Queen Mary and Westfield College, London, E1 4NS, UK G. Cowan, M. G. Green, A. Kurup, P. McGrath, I. Scott University of London, Royal Holloway and Bedford New College, Egham, Surrey TW20 0EX, UK D. Brown, C. L. Davis, Y. Li, J. Pavlovich, A. Trunov University of Louisville, Louisville, KY 40292, USA J. Allison, R. J. Barlow, J. T. Boyd, J. Fullwood, A. Khan, G. D. Lafferty, N. Savvas, E. T. Simopoulos, R. J. Thompson, J. H. Weatherall University of Manchester, Manchester M13 9PL, UK 2
Jointly appointed with Univ. di Perugia, I-06100 Perugia, Italy
4
C. Dallapiccola, A. Farbin, A. Jawahery, V. Lillard, J. Olsen, D. A. Roberts University of Maryland, College Park, MD 20742, USA B. Brau, R. Cowan, F. Taylor, R. K. Yamamoto Massachusetts Institute of Technology, Lab for Nuclear Science, Cambridge, MA 02139, USA G. Blaylock, K. T. Flood, S. S. Hertzbach, R. Kofler, C. S. Lin, S. Willocq, J. Wittlin University of Massachusetts, Amherst, MA 01003, USA P. Bloom, D. I. Britton, M. Milek, P. M. Patel, J. Trischuk McGill University, Montreal, PQ, Canada H3A 2T8 F. Lanni, F. Palombo Universit` a di Milano, Dipartimento di Fisica and INFN, I-20133 Milano, Italy J. M. Bauer, M. Booke, L. Cremaldi, R. Kroeger, J. Reidy, D. Sanders, D. J. Summers University of Mississippi, University, MS 38677, USA J. F. Arguin, J. P. Martin, J. Y. Nief, R. Seitz, P. Taras, A. Woch, V. Zacek Universit´e de Montreal, Lab. Rene J. A. Levesque, Montreal, QC, Canada, H3C 3J7 H. Nicholson, C. S. Sutton Mount Holyoke College, South Hadley, MA 01075, USA N. Cavallo, G. De Nardo, F. Fabozzi, C. Gatto, L. Lista, D. Piccolo, C. Sciacca Universit` a di Napoli Federico II, Dipartimento di Scienze Fisiche and INFN, I-80126 Napoli, Italy M. Falbo Northern Kentucky University, Highland Heights, KY 41076, USA J. M. LoSecco University of Notre Dame, Notre Dame, IN 46556, USA J. R. G. Alsmiller, T. A. Gabriel, T. Handler Oak Ridge National Laboratory, Oak Ridge, TN 37831, USA F. Colecchia, F. Dal Corso, G. Michelon, M. Morandin, M. Posocco, R. Stroili, E. Torassa, C. Voci Universit` a di Padova, Dipartimento di Fisica and INFN, I-35131 Padova, Italy M. Benayoun, H. Briand, J. Chauveau, P. David, C. De la Vaissi`ere, L. Del Buono, O. Hamon, F. Le Diberder, Ph. Leruste, J. Lory, F. Martinez-Vidal, L. Roos, J. Stark, S. Versill´e Universit´es Paris VI et VII, Lab de Physique Nucl´eaire H. E., F-75252 Paris, Cedex 05, France P. F. Manfredi, V. Re, V. Speziali Universit` a di Pavia, Dipartimento di Elettronica and INFN, I-27100 Pavia, Italy E. D. Frank, L. Gladney, Q. H. Guo, J. H. Panetta University of Pennsylvania, Philadelphia, PA 19104, USA M. Haire, D. Judd, K. Paick, L. Turnbull, D. E. Wagoner Prairie View A&M University, Prairie View, TX 77446, USA
5
J. Albert, C. Bula, M. H. Kelsey, C. Lu, K. T. McDonald, V. Miftakov, S. F. Schaffner, A. J. S. Smith, A. Tumanov, E. W. Varnes Princeton University, Princeton, NJ 08544, USA G. Cavoto, F. Ferrarotto, F. Ferroni, K. Fratini, E. Lamanna, E. Leonardi, M. A. Mazzoni, S. Morganti, G. Piredda, F. Safai Tehrani, M. Serra Universit` a di Roma La Sapienza, Dipartimento di Fisica and INFN, I-00185 Roma, Italy R. Waldi Universit¨ at Rostock, D-18051 Rostock, Germany P. F. Jacques, M. Kalelkar, R. J. Plano Rutgers University, New Brunswick, NJ 08903, USA T. Adye, U. Egede, B. Franek, N. I. Geddes, G. P. Gopal Rutherford Appleton Laboratory, Chilton, Didcot, Oxon., OX11 0QX, UK N. Copty, M. V. Purohit, F. X. Yumiceva University of South Carolina, Columbia, SC 29208, USA I. Adam, P. L. Anthony, F. Anulli, D. Aston, K. Baird, E. Bloom, A. M. Boyarski, F. Bulos, G. Calderini, M. R. Convery, D. P. Coupal, D. H. Coward, J. Dorfan, M. Doser, W. Dunwoodie, T. Glanzman, G. L. Godfrey, P. Grosso, J. L. Hewett, T. Himel, M. E. Huffer, W. R. Innes, C. P. Jessop, P. Kim, U. Langenegger, D. W. G. S. Leith, S. Luitz, V. Luth, H. L. Lynch, G. Manzin, H. Marsiske, S. Menke, R. Messner, K. C. Moffeit, M. Morii, R. Mount, D. R. Muller, C. P. O’Grady, P. Paolucci, S. Petrak, H. Quinn, B. N. Ratcliff, S. H. Robertson, L. S. Rochester, A. Roodman, T. Schietinger, R. H. Schindler, J. Schwiening, G. Sciolla, V. V. Serbo, A. Snyder, A. Soha, S. M. Spanier, A. Stahl, D. Su, M. K. Sullivan, M. Talby, H. A. Tanaka, J. Va’vra, S. R. Wagner, A. J. R. Weinstein, W. J. Wisniewski, C. C. Young Stanford Linear Accelerator Center, Stanford, CA 94309, USA P. R. Burchat, C. H. Cheng, D. Kirkby, T. I. Meyer, C. Roat Stanford University, Stanford, CA 94305-4060, USA A. De Silva, R. Henderson TRIUMF, Vancouver, BC, Canada V6T 2A3 W. Bugg, H. Cohn, E. Hart, A. W. Weidemann University of Tennessee, Knoxville, TN 37996, USA T. Benninger, J. M. Izen, I. Kitayama, X. C. Lou, M. Turcotte University of Texas at Dallas, Richardson, TX 75083, USA F. Bianchi, M. Bona, B. Di Girolamo, D. Gamba, A. Smol, D. Zanin Universit` a di Torino, Dipartimento di Fisica Sperimentale and INFN, I-10125 Torino, Italy L. Bosisio, G. Della Ricca, L. Lanceri, A. Pompili, P. Poropat, M. Prest, E. Vallazza, G. Vuagnin Universit` a di Trieste, Dipartimento di Fisica and INFN, I-34127 Trieste, Italy R. S. Panvini Vanderbilt University, Nashville, TN 37235, USA
6
C. M. Brown, P. D. Jackson, R. Kowalewski, J. M. Roney University of Victoria, Victoria, BC, Canada V8W 3P6 H. R. Band, E. Charles, S. Dasu, P. Elmer, J. R. Johnson, J. Nielsen, W. Orejudos, Y. Pan, R. Prepost, I. J. Scott, J. Walsh, S. L. Wu, Z. Yu, H. Zobernig University of Wisconsin, Madison, WI 53706, USA
7
Contents 1 Introduction
10
2 The PEP-II B Factory 10 2.1 Machine Backgrounds . . . . . . . . . . . . . . . . . . . . . . . . . . . . . . . . . . . 12 3 The 3.1 3.2 3.3 3.4 3.5 3.6
. . . . . . . . . . .
13 14 17 19 20 22 23 23 23 24 25 25
4 Data Sample 4.1 Delivered and Recorded Integrated Luminosity . . . . . . . . . . . . . . . . . . . . . 4.2 Off-Resonance Running . . . . . . . . . . . . . . . . . . . . . . . . . . . . . . . . . . 4.3 Data Quality . . . . . . . . . . . . . . . . . . . . . . . . . . . . . . . . . . . . . . . .
26 26 26 27
3.7 3.8 3.9
BABAR Detector Silicon Vertex Tracker . . . . . . . . Drift Chamber . . . . . . . . . . . . Particle Identification System . . . . Electromagnetic Calorimeter . . . . Instrumented Flux Return . . . . . . Trigger . . . . . . . . . . . . . . . . . 3.6.1 Level-1 Trigger . . . . . . . . 3.6.2 Level-3 Trigger . . . . . . . . Data Acquisition and Online System Online Prompt Reconstruction . . . Computing System . . . . . . . . . .
. . . . . . . . . . .
. . . . . . . . . . .
. . . . . . . . . . .
. . . . . . . . . . .
. . . . . . . . . . .
. . . . . . . . . . .
. . . . . . . . . . .
. . . . . . . . . . .
. . . . . . . . . . .
. . . . . . . . . . .
. . . . . . . . . . .
. . . . . . . . . . .
. . . . . . . . . . .
. . . . . . . . . . .
. . . . . . . . . . .
. . . . . . . . . . .
. . . . . . . . . . .
. . . . . . . . . . .
. . . . . . . . . . .
. . . . . . . . . . .
. . . . . . . . . . .
. . . . . . . . . . .
. . . . . . . . . . .
. . . . . . . . . . .
. . . . . . . . . . .
. . . . . . . . . . .
5 Simulation 27 5.1 Event Generators . . . . . . . . . . . . . . . . . . . . . . . . . . . . . . . . . . . . . . 27 5.2 The GEANT3 Model . . . . . . . . . . . . . . . . . . . . . . . . . . . . . . . . . . . . 28 5.3 The Detector Response Simulation . . . . . . . . . . . . . . . . . . . . . . . . . . . . 28 6 Tracking and Vertexing 6.1 Track Finding and Kalman Filtering . . . . . . . . . 6.2 Tracking Efficiency . . . . . . . . . . . . . . . . . . . 6.3 Slow Pion Reconstruction . . . . . . . . . . . . . . . 6.4 Vertex and Kinematic Fitting . . . . . . . . . . . . . 6.4.1 Beam spot and primary vertex determination 6.4.2 Reconstruction of the tagging-B vertex . . . 7 Particle Identification 7.1 Charged Particle Identification 7.1.1 Electrons . . . . . . . . 7.1.2 Muons . . . . . . . . . . 7.1.3 Charged hadrons . . . . 7.2 Neutral Particle Identification . 7.2.1 Photons . . . . . . . . . 7.2.2 π 0 and η Reconstruction 7.2.3 Neutral Hadrons . . . .
. . . . . . . .
. . . . . . . .
. . . . . . . .
. . . . . . . .
. . . . . . . .
8
. . . . . . . .
. . . . . . . .
. . . . . . . .
. . . . . . . .
. . . . . . . .
. . . . . . . .
. . . . . . . .
. . . . . . . . . . . . . .
. . . . . . . . . . . . . .
. . . . . . . . . . . . . .
. . . . . . . . . . . . . .
. . . . . . . . . . . . . .
. . . . . . . . . . . . . .
. . . . . . . . . . . . . .
. . . . . . . . . . . . . .
. . . . . . . . . . . . . .
. . . . . . . . . . . . . .
. . . . . . . . . . . . . .
. . . . . . . . . . . . . .
. . . . . . . . . . . . . .
. . . . . . . . . . . . . .
. . . . . . . . . . . . . .
. . . . . . . . . . . . . .
. . . . . . . . . . . . . .
. . . . . .
29 29 29 30 31 32 32
. . . . . . . .
33 33 33 33 35 35 35 37 38
8 Common Analysis Issues 8.1 Centre of Mass Energy and Boost . . . 8.2 Continuum Rejection Variables . . . . 8.3 Event Selection and B Counting . . . 8.3.1 Fiducial regions . . . . . . . . . 8.3.2 Multi-Hadron selection . . . . . 8.3.3 Muon pair selection . . . . . . 8.4 Offline Luminosity Determination . . . 8.5 B Counting . . . . . . . . . . . . . . . 8.6 Exclusive B Reconstruction Variables 8.6.1 Kinematic variables . . . . . . 8.6.2 Background parametrisation .
. . . . . . . . . . .
. . . . . . . . . . .
. . . . . . . . . . .
. . . . . . . . . . .
. . . . . . . . . . .
. . . . . . . . . . .
. . . . . . . . . . .
. . . . . . . . . . .
. . . . . . . . . . .
. . . . . . . . . . .
. . . . . . . . . . .
. . . . . . . . . . .
. . . . . . . . . . .
. . . . . . . . . . .
. . . . . . . . . . .
. . . . . . . . . . .
. . . . . . . . . . .
. . . . . . . . . . .
. . . . . . . . . . .
. . . . . . . . . . .
. . . . . . . . . . .
. . . . . . . . . . .
. . . . . . . . . . .
. . . . . . . . . . .
. . . . . . . . . . .
. . . . . . . . . . .
40 40 40 41 41 41 41 42 42 42 42 43
9 Conclusions and Prospects
44
10 Acknowledgments
44
9
1
Introduction
The principal goal of an asymmetric B Factory running at energies on and around the Υ (4S) resonance is the comprehensive study of CP violation in B meson systems. The asymmetry in beam energies makes possible the measurement of time-dependent CP violating asymmetries in the decay of neutral B mesons. CP asymmetries in the B meson system are expected to be large, so that relatively small samples of events are needed to provide accurate measurements. Unfortunately, the B meson decay channels of interest for the study of CP violation have extremely small branching fractions, of order of 10−4 or below. In order to measure asymmetries with errors at the 10% level or better, samples of several tens of million neutral B meson pairs are needed. The new generation of B factories must therefore have unprecedented luminosities, in the range 1033 to 1034 cm−2 s−1 .
2
The PEP-II B Factory
The PEP-II B Factory is an e+ e− colliding beam storage ring complex designed to produce a luminosity of at least 3 × 1033 cm−2 s−1 at ECM = 10.58 GeV, the mass of the Υ (4S) resonance. PEP-II has been constructed by a collaboration of SLAC, LBNL and LLNL [1] on the SLAC site. The machine is asymmetric with energies of 9.0 GeV for the electron beam and 3.1 GeV for the positron beam. The unequal beam energies require a two-ring configuration: electrons in a High Energy Ring (HER) colliding with positrons in the Low Energy Ring (LER). Some accelerator parameters and achievements of the High Energy Ring are listed in Table 1, those of the Low Energy Ring in Table 2. The electrons and positrons are produced by the SLAC Linac, whose high intensity makes it optimal to recharge the beams in “top-off” mode whenever the luminosity drops to about 90% of its peak value. Table 1: PEP-II High Energy Ring Performance Results. Parameter Energy Number of Bunches Total Beam Current Beam Lifetime
units GeV A
Design 9.0 1658 0.75 (1.0) 4hrs @ 1A
Best Achieved 9.0, ramp to 9.1 & back 1658 0.92 11hrs @ 0.9A
Typical in-run 9.0, ramp 8.84-9.04 553-829 0.70 9hrs @ 0.70A
Table 2: PEP-II Low Energy Ring Performance Results. Parameter Energy Number of Bunches Total Beam Current Beam Lifetime
units GeV A
Design 3.1 1658 2.14 4hrs @ 2A
Best Achieved 3.1 1658 1.72 3.3hrs @ 1.4A
Typical in-run 3.1 553-829 1.10 3hrs @ 1.1A
The rings are housed in the 2.2 km former PEP tunnel but with distinct vacuum and accelerating 10
structures. The High Energy Ring (HER) reuses the magnets of the old PEP machine whereas the Low Energy Ring (LER) is new and is put in place on top of the HER. The PEP-II design has 1658 bunches, each containing 2.1 × 10¹⁰ electrons (HER) and 5.9 × 10¹⁰ positrons (LER), spaced at 4.2 ns. The RF system provides a total power of 5.1 MW from seven klystron stations driving 24 conventional copper 476 MHz RF cavities. Bunches are brought into a common vacuum chamber and septum at a few nTorr and into head-on collisions in an interaction region within a 2.5 cm-radius beryllium beam-pipe, around which BABAR is located. Asymmetric collisions produce a center of mass energy of 10.58 GeV with a boost of βγ = 0.56 in the lab frame, thereby allowing a measurement of time dependent CP violating asymmetries. Such a boost produces an average separation of βγcτ = 250 µm between the two B vertices, which is crucial for studying the cleanest and most promising CP violating modes. The PEP-II e+ e− collider became operational in July 1998 with the completion of the LER. The first collisions were seen shortly thereafter. Fall and winter 1998 PEP-II runs concentrated on raising the beam currents and increasing the luminosity. In February 1999, the peak luminosity reached 5.2 × 1032 cm−2 s−1 . In a two month spring down time, the BABAR detector was installed. PEP-II turned on May 10th and BABAR saw its first hadronic event on May 26th 1999. In August 1999, PEP-II passed the world record for luminosity, achieving 8.1 × 1032 cm−2 s−1 . The present luminosity in PEP-II is 2.17× 1033 cm−2 s−1 , or about 72% of the design goal. In June 2000, PEP-II delivered an integrated luminosity of 150 pb−1 in one day, above the design goal for daily integrated luminosity of 135 pb−1 . Through July 6, PEP-II has delivered over 13.8 fb−1 to BABAR, of which 12.7 fb−1 have been logged by the detector. Beam parameters and luminosity performance results are shown in Table 3. The present plan is to collide until the end of October 2000 followed by a three month installation period. A detailed status report of the current PEP-II performance can be found in Ref. [2]. Table 3: PEP-II Luminosity Performance. Parameter Peak Luminosity Specific Luminosity
units cm−2 s−1 cm−2 s−1 /bunch
IP Hor. Spot Size ΣX IP Ver. Spot Size ΣY
µm µm
Top-off Time Fill Time
minutes minutes
Integrated Luminosity
pb−1 /8 hours pb−1 /day fb−1 /week fb−1 /month fb−1
Total Integrated Luminosity (thru 7/20/2000)
Design 3 × 1033 3.1 × 1030
Best Achieved 2.2 × 1033 2.9 × 1030
220 6.7
190 6.0
3 6
2 8
135
11
54 154 0.8 2.7 15.4
Typical in- run 2.0 × 1033 1.8 × 1030
3 10
1000
background ratio [%]
Number of L1 Passthrough Tracks
Single Beam Background - HER 600
500
400
900 800 700 600 500
300
400 200
300 200
100
100 0 -100
-50
0
50
0
100
Longitudinal Position in Beam Direction (cm)
0
10 20 30 40 50 60 70 80 90 100 day of year 2000
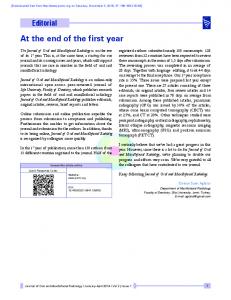
Figure 1: Left: z0 distribution of L1 pass-through tracks at their point of closest approach to the beam line. Right: Time-history of the DCH current, normalized to that expected, at the same beam currents and luminosity, from background measurements performed in July 2000. The exponential decrease during the first two months of operation reflects the scrubbing, by synchrotron-radiation photons, of residual gas molecules off the vacuum-pipe wall.
2.1
Machine Backgrounds
Operationally, the acceptable level of backgrounds is determined primarily by the radiation hardness of the Silicon Vertex Tracker (SVT) and Electromagnetic Calorimeter (EMC) detectors, and by requiring a tolerable Drift Chamber (DCH) current. The Level-1 (L1) trigger rate and the occupancy in the other detector systems also constitute occasional limitations. Careful measurement, analysis and simulation of the background sources and their impact have led to a detailed understanding and an effective remediation of their effects. The primary causes of steady-state backgrounds in PEP-II are, in order of increasing importance: • Synchrotron radiation generated in the bending magnets and final focusing quadrupoles in the incoming HER and LER beam lines. Careful layout of the interaction-region area and a conservative synchrotron radiation masking scheme have proven very effective against these sources. • The interaction of beam particles with residual gas around the rings (beam-gas), which constitutes the primary source of radiation damage and has had, averaged over this first run, the largest impact on operational efficiency. • Collision-related electromagnetic shower debris, dominated by energy- degraded e± from radiative-Bhabha scattering which strike vacuum components within a few meters of the interaction point (IP). This background, directly proportional to the instantaneous luminosity, was barely detectable in early running; it now noticeably affects all detectors except the SVT. 12
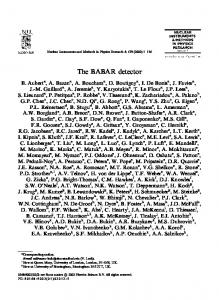
While instantaneous background conditions vary because of interaction point orbit drifts and sensitivity of beam tails to small tune adjustments, reproducible patterns have emerged. The relative importance of the single-beam and luminosity contributions varies from one detector system to the next. The HER beam-gas contribution significantly impacts all detectors except the particle identification system (DIRC): the combination of a 40 m long straight section, almost devoid of magnetic bending upstream of the final doublet, and of the magnetic beam- separation scheme, result in abundant bremsstrahlung-induced electromagnetic debris being directed onto the IP vacuum pipe. The same process occurs in the LER, but to a lesser extent (for a given beam current) because of a shorter drift section and lower primary energy. Most detectors, therefore, exhibit occupancy peaks at φ = 0 and 180◦ , reflecting the fact that the separation dipoles bend energydegraded particles in opposite directions. Such local beam-gas interactions contribute noticeably to the DCH current; they dominate the SVT instantaneous dose rate in the horizontal plane, the EMC crystal occupancy above the cluster-seeding threshold (10 MeV), and the L1 trigger rate. Analysis of pass-through events from the charged L1 trigger shows that the beam-pipe wall and several aperture restrictions within 100 cm of the interaction point are the primary impact points for lost particles, as illustrated for the HER in Figure 1 (left)). To minimize this background it is vital to maintain a low pressure in the region from 4 m to 60 m upstream of the interaction point in the incoming HER and LER beam lines. Scrubbing, which has reduced the average dynamic pressure in both rings to levels close to or below the design value, also proved effective (Figure 1 (right)). Under typical running conditions, the DIRC and the DCH receive comparable contributions from beam-gas Coulomb scatters around the entire LER, and from luminosity backgrounds. In addition, these two detectors proved particularly vulnerable to tails generated by beam-beam or electron-cloud induced blowup of the low-energy beam. Even though partially eliminated by a set of betatron collimators in the last arc, such tails - which are very sensitive to accelerator conditions and tuning procedures - tend to scrape near the highest-β point of the final LER doublet, located inside the DIRC’s standoff-box (SOB). The resulting background fluctuations occasionally cause the DCH high-voltage protection system to trip, or the counting rate in the DIRC photomultipliers to exceed 200 kHz. The problem could be only partially alleviated by local lead shielding; additional collimation will be installed during the fall 2000 shutdown. While trigger-rate and occupancy considerations define acceptable dynamic running conditions, it is the total integrated radiation dose that determines the lifetime of the detector systems. Despite a significant investment in radiation-hard technology, the innermost silicon layers of the SVT and its front-end electronics remain the most susceptible to radiation damage. The accumulated dose has been maintained below budget, as shown in Figure 2, through a strict program of hardware interlocks, administrative controls, and real-time monitoring. As of this conference, the worst irradiated spot of the SVT has been exposed to approximately 300 kRad, 20 to 30% of which is contributed by injection periods.
3
The BABAR Detector
The new magnetic spectrometer BABAR (Figure 3) has been constructed at SLAC, by a collaboration √ of nine countries, to precisely measure e+ e− annihilations at center of mass energy s ∼10 GeV produced with the new PEP-II Asymmetric Storage Rings. Construction of this detector was approved in November 1995 and its commissioning followed in the Fall of 1998. First data with PEP-II colliding beams was collected in May 1999. 13
Silicon Vertex Tracker: Radiation Monitoring using most sensitive PIN diodes near the IP
Dose Integral / kRad
400
Dose Budget HER-sensitive diode LER-sensitive diode
300
200
100
BABAR
0 -200
-100 0 100 Day of Run 2000
200
Figure 2: projected History plot of accumulated radiation dose in the SVT using PIN diodes near the interaction point in the horizontal plane (the black line represents the allotted budget, rationing out a 2 MRad dose over the detector’s planned life span). The BABAR superconducting solenoid, which produces a 1.5T axial magnetic field, contains a set of nested detectors: a five-layer silicon-strip vertex detector (SVT), a central Drift Chamber (DCH) for charged particle detection and momentum measurement, a quartz-bar Cherenkov radiation detector (DIRC) for particle identification, and a CsI crystal Electromagnetic Calorimeter (EMC) for detecting photons and separating electrons from charged pions. The calorimeter has a barrel section, and an endcap which extends it asymmetrically into the forward direction (e− beam direction), where many of the collision products emerge. (There is no calorimeter coverage in the backward direction.) Two layers of cylindrical resistive plate chambers (RPCs) are located between the barrel calorimeter and the magnet cryostat. All the detectors located inside the magnet have full acceptance in azimuth. The Instrumented Flux Return (IFR) outside the cryostat is composed of 18 layers of steel, which increase in thickness outward, and contains 19 layers of planar RPCs in the barrel and 18 in the endcaps. The RPCs allow the separation of muons and charged hadrons, and also detect penetrating neutral hadrons (mainly KL ). The following sections provide more details on the subsystems of the detector together with current performance results.
3.1
Silicon Vertex Tracker
The Silicon Vertex Tracker (SVT) provides the required vertex resolution for the measurement of CP violation at PEP-II. In addition, it is capable of independent charged particle tracking, of particular importance for low transverse momentum particles (pT < 120 MeV/c) that cannot be measured by the central tracking chamber. The detector design is optimized to take into account the physical constraints imposed by the PEP-II geometry at the interaction region: the presence of 14
Figure 3: The BABAR Detector. 1. Silicon Vertex Tracker (SVT), 2. Drift Chamber (DCH), 3. Particle Identification Subsystem (DIRC–Detector of Internally Reflected Cherenkov Light, 4. Electromagnetic Calorimeter (EMC), 5. Magnet, 6. Instrumented Flux Return (IFR). the B1 permanent magnets at ±20 cm from the interaction point, which separate the beams after head-on collisions. The acceptance in polar angle θ is limited by the gap between beamline elements to −0.87 < cos θlab < 0.96 (−0.95 < cos θcm < 0.87). As the innermost BABAR subdetector, two important considerations in optimizing the design were low mass, to minimize multiple scattering, and radiation hardness of its components. A detailed description of the SVT and its components can be found in Ref. [4]. The SVT contains 52 modules built out of AC-coupled double-sided silicon sensors (strips othogonal on the two sides). These are read out by a full-custom low-noise radiation-hard integrated circuit, known as the AtoM chip (mounted on a passive hybrid circuit that is attached to a water cooling channel). The detector modules are organized in five radial layers, each divided azimuthally into 6, 6, 6, 16 and 18 staves respectively (see Table 4). The three inner layers are crucial for vertex and tracking resolution, while the outer two layers are needed to provide additional measurements for stand alone tracking independent of drift chamber information. These outer two layers each contain two different types of modules, an inner (labelled a in the Table 4) and an outer (labelled b) layer, occupying slightly different radial positions. The modules are assembled on carbon fiber support cones, which in turn are positioned around the beam pipe and the B1 magnets. The SVT and some beamline elements are housed inside a strong support tube, with its load transferred at the ends to the PEP-II beamline support “rafts.” 15
(µm)
SVT Hit Resolution vs. Incident Track Angle 60 40
BABAR
Layer 1 - Z View Data - Run 7925 Monte Carlo - SP2
20 0
(µm)
-50
60 40
0
Layer 1 - φ View
50
(deg)
BABAR
Data - Run 7925 Monte Carlo - SP2
20 0 -50
0
50
(deg)
Figure 4: SVT single point resolution as a function of the incident track angle for the innermost layer. Table 4: Layer Structure of the SVT. Layer 1 2 3 4a 4b 5a 5b
Radius (mm) 32 40 54 124 127 140 144
Modules /Layer 6 6 6 8 8 9 9
Si Wafers /Module 4 4 6 7 7 8 8
φ pitch (µm) 50 or 100 55 or 110 55 or 110 100 100 100 100
z pitch (µm) 100 100 100 210 210 210 210
A system consisting of 12 PIN photodiode sensors is placed close to the first silicon layer to monitor continuously the radiation exposure of the SVT and manage its radiation dose budget. During the first year of data taking, all major design goals for the detector were already achieved. The average hit reconstruction efficiency is above 98% in both views. The hit resolution presently observed, following an initial accurate alignment procedure, is shown in Figure 4. This compares well with Monte Carlo predictions for the resolution with perfect alignment. The impact parameter resolution, dominated by the SVT’s precision for measuring high transverse momentum tracks, is 16
σZ(cm)
σd0(cm)
shown in Figure 5. Two-track vertices, such as J/ψ → µ+ µ− are reconstructed with a typical resolution of 50 µm; the resolution on the z separation between the two B decay vertices is typically 110 µm, in good agreement with the design goals.
BABAR
0.04
0.04
BABAR 0.03
0.03
σZ
0.02
σd0
0.02
0.01
0.01 µ+µ0
0 1
2
3
1
2
3
pt(GeV)
pt(GeV)
Figure 5: Impact parameter resolution in the r − φ (σd0 in the left plot) and in the √ z-view (σz in the right plot) as measured on data. The horizontal line in the left-hand plot is 1/ 2 times the transverse miss distance for muon pair events.
3.2
Drift Chamber
The Drift Chamber (DCH) is the main tracking device for charged particles with transverse momenta pT above about 120 MeV/c, providing a precision measurement of pT from the curvature of charged particle trajectories in the 1.5 T magnetic field. Prompt single-cell hit information from the chamber is also a basic component of the Level-1 trigger (see Section 3.6.1). The DCH is a 280 cm-long cylinder, with a inner radius of 23.6 cm and and outer radius of 80.9 cm. It is mounted in cantilever from the rear endplate to the DIRC central support tube, within the volume inside the DIRC and outside the PEP-II support tube. The center of the chamber is displaced forward by 36.7 cm to improve the forward track length, given the asymmetric boost for the Υ (4S) events. The beryllium inner wall (0.28% radiation lengths), the thin outer half of the forward endplate (15 cm aluminum), and the carbon-fiber outer cylinder are all designed to minimize material in front of the calorimeter. The drift system consists of 7104 hexagonal cells, approximately 1.8 cm wide by 1.2 cm high, arranged in 40 concentric layers between a radius of 25.3 and 79.0 cm. The active volume provides charged particle tracking over the polar angle range −0.92 < cos θlab < 0.96. The forty layers are grouped into ten superlayers of four layers each, organized with the same orientation for sense and field wires within a given superlayer. The superlayer structure facilitates fast local segment finding as the first step in pattern recognition. This arrangement is particularly important for Level-1 trigger decisions. Superlayers alternate in orientation: first axial (A), then a small positive stereo
17
angle (U), followed by a small negative stereo angle (V). All superlayers participate in the Level-1 trigger track finding; only the axial superlayers participate in the Level-1 trigger pT determination. Table 5: Layer arrangement for the DCH Superlayer 1 2 3 4 5 6 7 8 9 10
Inner Radius [cm] 26.04 31.85 37.05 42.27 48.08 53.32 58.54 64.30 69.52 74.72
Cells/ Layer 96 112 128 144 176 192 208 224 240 256
Stereo Angle [mr] 0 +[44.9–50.0] −[52.3–57.4] 0 +[55.6–59.7] −[62.8–66.9] 0 +[65.0–68.5] −[72.1–75.8] 0
The individual hexagonal cells each consist of a 20 µm rhenium-tungsten sense wire operating nominally in the range 1900–1960 V, surrounded by 6 cathode wires, approximately half of which are shared with neighboring cells. For the inner cells in a superlayer, the cathode wires are 120 µm aluminum, grounded to the rear endplate. For outer cells one of the cathode wires is 80 µm aluminum, held at about 350 V. All sense and cathode wires are gold plated. Table 5 summarizes the main geometric features of the design. The counting gas, chosen to have low mass, is an 80%:20% mixture of He:Isobutane, with a small amount (3000 ppm) of water vapor to prolong the lifetime of the chamber in a high rate environment. The combination of low-mass gas and minimization of material in the field cage itself is designed to reduce the contribution of multiple scattering to the pT resolution for the typically soft tracks produced in Υ (4S) events. The DCH readout electronics, including front-end amplifier, timing and pulse height digitization, event readout and high voltage distribution, are all mounted on the rear endplate (opposite the boost direction) to keep the additional material outside the detector fiducial volume. The instrumentation includes two custom integrated circuits: a low-noise bipolar amplifier IC and a CMOS digitizer IC that incorporates 8 channels of TDC, Flash-ADC, pipelined data-storage, multiple event buffers and prompt trigger output. Data readout is multiplexed on four fiber-optic links to BABAR-standard VME readout modules (ROM); trigger data is transported on 24 fiber-optic links. The ROMs extract the integrated charge from the digitized waveform before passing the data on to next level in the data acquisition system. High voltage is supplied by a CAEN SY527 mainframe and is distributed through circuit boards that plug directly on the DCH endplate feedthroughs. Temperature and humidity sensors monitor the chamber environment, and radiation monitors track the accumulated dose. The nominal design for the chamber calls for an average 140 µm single point resolution. The space-time relation (STR) for the non-saturated counting gas has been modeled with a separate 6th -order Chebychev polynomial for the left and right parts of the cell. The STR has proven to be very stable over time. There is a small residual dependence on gas density, not yet corrected in production. The single cell resolution function obtained from the ensemble of charged tracks in the 18
normal event stream is shown in Figure 6 for operation at 1960 V. This shows a weighted average resolution of 125 µm. In addition to recording timing information for hits, the Flash-ADC is used to measure the time development of pulse height in the cell. Signal processing (feature extraction) in the ROM converts this into a measurement of deposited energy. Real-time overall gain corrections are calculated and applied during the reconstruction step. Saturation, path length, polar angle, individual wire and layer gain corrections are applied as well, although these corrections are stable over long periods of time. The resulting distribution of the truncated mean dE/dx observed for Bhabha electrons is shown in Figure 6. The observed resolution is found to be 7.5%. We expect to achieve the predicted resolution of 7% after additional corrections, including the effect of varying entrance angles. Resolution (cm)
dE/dx resolution for Bhabhas 0.025
350
B A B AR
BABAR
300
0.02
250
Tracks
0.015
σ = 7.5 %
200 150
0.01
100 0.005
50 0
0 -1
-0.75
-0.5
-0.25
0
0.25
0.5
0.75
1
Signed distance from wire (cm)
-0.6
-0.4
-0.2
0
0.2
0.4
0.6
(dE/dxmeas.- dE/dxexp.) / dE/dxexp.
Figure 6: DCH single cell resolution (left) and dE/dx resolution for Bhabha electrons (right).
3.3
Particle Identification System
Standalone identification of charged particles is based on a specialized subdetector system that uses the Detection of Internally Reflected Cherenkov light (DIRC). Charged particles exiting the barrel region of the DCH transit an array of 144 fused silica quartz bars, each approximately 17 mm thick (δr), 35 mm wide (δ(rφ)) and 4.9 m long (δz). Particles above Cherenkov threshold radiate photons in the quartz media. The angles of the Cherenkov photons with respect to particle direction are measured with an array of 10,752 photomultiplier tubes located outside the return yoke, in a special low magnetic field volume. The polar angle coverage is −0.84 < cos θlab < 0.90. The 144 quartz bars of the DIRC are arranged in 12 modules, or “bar-boxes”, that penetrate through the magnetic end plug. Cherenkov photons trapped in a quartz bar exit the bar through a wedge and a quartz window into a water tank, which optically couples the quartz bars to the photomultiplier array. The photomultiplier tubes are arranged in 12 sectors corresponding to the 12 barboxes, on the surface of a half torus, with a major radius of about 3 m and a minor radius of 1.2 m. By knowing the particle direction from the tracking system, and the location of the 19
photomultiplier tube that observes a Cherenkov photon, the angle that a Cherenkov photon makes with respect to the track direction can be deduced. Due to internal reflections within the bars, there are several solutions for a hit-to-track association. The angular resolution for a single photon is about 10.2 mr (see Figure 7(a)) and, with an average of 30 photons per track, the “per track” Cherenkov resolution is about 2.8 mr, rms. This corresponds to a separation of approximately three standard deviations between charged K’s and π’s at 3 GeV/c. An additional observable is the time of a photomultiplier hit, measured to a precision of 1.7 ns (see Figure 7(b)). By comparison of the measured hit time with the propagation time of a photon solution, it is possible to effectively suppress background photons and invalid photon solutions.
(a)
entries per 0.2nsec
entries per mrad
80000 60000 40000 20000
0 -100
0
∆ θC,γ (mrad)
80000
BABAR
60000 40000 20000 0 -8
100
(b)
0
∆ tγ (nsec)
8
Figure 7: Resolution of the reconstructed Cherenkov angle for single photons (a) and of the difference between measured and expected arrival time (b).
3.4
Electromagnetic Calorimeter
The Electromagnetic Calorimeter (EMC) contains 6580 CsI crystals doped with thallium iodide at about 1000 ppm. Each crystal is a truncated trapezoidal pyramid and ranges from 16 to 17.5 radiation lengths in thickness. The front faces are typically ∼5 cm in each dimension. The crystals are arranged quasi-projectively in a barrel structure of 48 polar (θ) rows by 120 crystals in azimuth (φ), with an inner radius of 90 cm. The forward end is closed by a separable endcap capable of holding nine additional rows. At present, eight are filled with crystals and the innermost with shielding absorber. The polar angle coverage of the calorimeter is −0.78 < cos θlab < 0.96. Beamline elements occlude cos θlab > 0.94. Each crystal is wrapped with a diffuse reflective material (TYVEK) and housed in a thin eggcrate-like carbon fiber composite mechanical structure. There are 280 such modules in the barrel (7 types, 40 of each type) and 20 identical endcap modules. Crystals are read out with two independent 2 cm2 large area PIN photodiodes epoxied to their rear faces. Dual-range ASIC preamplifiers reside directly behind the photodiodes in a shielded housing that also provides a thermal path for heat removal. Shielded ribbon cables carry analog signals to the end flanges of the barrel and the back plate of the endcap, where additional amplification
20
σ (E) / E
and digitizing electronics provide for a total of four overlapping linear ranges. The system handles signals from ∼50 keV to ∼13 GeV, corresponding to 18 bit dynamic range. A short shaping time of ∼ 400 ns is used in the preamplifiers to reduce the impact of soft ( 120 MeV/c if they reach superlayer five in the DCH. The EMT generates trigger primitives passing various energy thresholds. The lowest threshold is 100 MeV, in order to be fully efficient for minimum ionizing particles. All the L1 trigger system components appear to the data acquisition system as standard detector subsystems, in addition to their role in providing the trigger signals. The data read out from them provides details on the operation of the trigger for each acquired event, facilitating diagnostics and the determination of the L1 trigger efficiency. The L1 trigger system is designed to be able to trigger independently from pure DCT and pure EMT triggers with high efficiency for most physics sources, in order to allow cross-calibration of efficiencies. In particular, BB events are triggered at > 99% efficiency from either DCT or EMT and the combined efficiency is > 99.9%. Only τ and two-photon events do not have a fully efficient pure EMT trigger and rely mainly on DCT triggers. The total L1 trigger rate for a typical run with HER (LER) currents at 700 mA (1100 mA) and a luminosity of 2.0×1033 cm−2 s−1 is ∼700 Hz. This is typically stable to within 10% for the same machine currents but can be 50% higher after a major shutdown when the vacuum is relatively poor. The joint trigger/data acquisition system rate capability is comfortably beyond the design rate of 2 kHz. This avoids significant deadtime, and leaves room for the expected increase in luminosity. Within the typical L1 trigger rate of 700 Hz at 2×1033 cm−2 s−1 , Bhabha events and other e+ e− interactions amount to around 120 Hz, and cosmic ray interactions to 130 Hz. The dominant source of background causing the remaining triggers is the interaction of lost particles with the beam line components. The L1 background rate coming from the HER beam is ∼3 times higher than that from the LER beam for the typical operating currents. 3.6.2
Level-3 Trigger
The Level-3 (L3) trigger is the first component of the trigger system to see complete events. It is embedded in the Online Event Processing (OEP) framework running in parallel on 32 event filter farm nodes. The L3 trigger processes data from the DCH track trigger and from the EMC using
23
two independent algorithms that form track and cluster objects. These are fed into a set of filter algorithms that operate on either one or both. The L3 DCH algorithm performs fast lookup-table based track finding and three-dimensional track fitting, efficient for tracks with pT > 250 MeV/c. The event t0 is determined from DCH trigger track segments and hit data to better than 5 ns. The L3 EMC algorithm uses calorimeter crystal data in a fast two-dimensional clustering algorithm implemented using a lookup table. To reduce noise, the crystal energy threshold is set to 30 MeV. L3 clusters are accepted for energies > 100 MeV. The L3 logging decision is based on generic track/cluster topologies rather than on the identification of individual physics processes. An exception is made for Bhabha events, which have to be vetoed to reduce their rate (∼ 100 Hz at 2 × 1033 cm−2 s−1 luminosity). The physics trigger is a logical OR of two orthogonal filters. The track filter requires either one track with pT > 800 MeV/c coming from the interaction point, or two tracks with pT > 250 MeV/c and slightly looser vertex cuts. The cluster filter accepts events with a high multiplicity or with a large total energy in the EMC and a high invariant (pseudo) mass. The efficiency of the track filter for BB events is 99%, while the efficiency of the cluster filter is 94%. Both filters are subject to a veto algorithm that identifies Bhabha events based on clean signatures in the DCH and the EMC. The veto has no impact on hadronic events, and only has noticeable effect on very few types of events such as τ τ → eννeνν. A prescaled sample of Bhabha events, flattened in θ, is preserved for calibration purposes. In addition, L3 logs various other samples for calibration and monitoring, such as radiative Bhabha events, cosmics, and random triggers. The luminosity is measured online by L3 using a track-based algorithm with a scale calibration precision of 0.6 GeV/c for the DIRC. The minimum requirements for a track to be considered in the individual subdetectors are 2 and 10 dE/dx samples for the SVT and DCH respectively, and track extrapolation within the DIRC acceptance (number of expected photons greater than zero). Finally, the value of likelihood ratio r was dependent on the momentum of the tracks to be identified. In the tight mode, the intervals and ratio requirements were: 0.5 - 0.7 GeV/c 0.7 - 2.7 GeV/c > 2.7 GeV/c
r = 15 r=1 r = 80
The performance of the various selections has been measured with data using control samples of kaons and pions from the kinematically identified decays: KS0 → π + π − and D∗+ → D 0 (→ K − π + )π + . To select the KS0 sample, very tight cuts are used (e.g. on the angle between the KS0 candidate vertex direction and the vertex momentum direction, on the decay distance from the interaction point, on the reconstructed KS0 candidate mass). The plot of the invariant mass of the π + π − pairs is shown in Figure 12(left); the purity of the resulting pion sample is > 99%. The D ∗+ sample, obtained with a tight cut on the difference between the Kππ and Kπ masses (0.1445 < ∆M < 0.1465 MeV/c2 ) shown in Figure 12(right), has a combinatorial background of around ∼ 13% (for a kaon sample purity of ∼ 90%, with the purity higher at higher momenta). In determining particle identification performance, a correction for the background contribution has been made in each momentum bin using sideband subtraction. The measured kaon efficiency and pion misidentification rates are shown in Figure 13 for the tight selection based the D ∗+ sample. The efficiency is found to be 90%, while misidentification rate is 2.5%, averaged over the full momentum range. Note that these results are highly dependent on the momentum spectrum of the kaons and pions in the particular samples used in an analysis.
7.2 7.2.1
Neutral Particle Identification Photons
Photons are detected in the EMC where adjacent crystals with energy deposits exceeding 1 MeV are grouped in clusters. Channels marked as noisy by online or offline monitoring are excluded. Clusters with more than one local energy maximum are then split into “bumps” and the energy of each crystal is partially assigned to each bump by a simultaneous iterative adjustment of the centers and energies of the bumps, asuming electromagnetic shower shapes. In the next stage all 35
Events
x 10 2
BABAR
3000
3000
2000
2000
1000
1000
0
0 0.45
0.475
0.5
0.525
0.14
0.55
0.145
0.15
0.155
MKππ - MKπ
Mass(π+π-)
0.16 2
(GeV/c )
Pion misidentification
Kaon efficiency
Figure 12: Mass distribution (left) of KS0 candidates used to select a pion control sample. Distribution (right) of the difference of the D ∗ and D 0 candidate masses, used to select control samples of kaons and pions.
1
0.8
0.6
BABAR
0.4
0.2
0 0
1
2
3
4
p lab (GeV/c)
Figure 13: Kaon efficiency (filled points) and pion misidentification (open points) for a tight kaon selection, measured with a D ⋆ decay control sample. charged tracks reconstructed in the tracking volume are extrapolated to the EMC entrance and a track–bump matching probability is calculated for each pair. All bumps with a small matching probability are treated as photon candidates. A small number of these candidates, where the bump shape is incompatible with that expected of an electromagnetic shower, are rejected. In the majority of physics analyses, photon candidates lying anywhere within the instrumented EMC
36
volume are used if their energy is above 30 MeV. 7.2.2
π 0 and η Reconstruction
Neutral pion and η candidates are formed from pairs of photon candidates assumed to originate from the interaction point. The invariant mass spectrum of all such pairs is shown in Figure 14 for (Eγ >30 MeV, Eγγ >300 MeV) and (Eγ >100 MeV, Eγγ >1 GeV), where clear π 0 and η peaks can be seen. The π 0 mass resolution in multihadron events is 6.9 MeV/c2 , while in low occupancy τ τ events it is 6.5 MeV/c2 for π 0 energies below about 1 GeV/c. Improved resolution is also observed in hadronic events where only isolated photons are considered. The η mass resolution is 16 MeV/c2 . The π 0 and η mass peaks from inclusive multihadron events are also shown in Figure 14. The signalto-background ratio for the η can be improved by vetoing photons participating in candidates in the π 0 signal region. Combinatorial background in hadronic events is supressed by a factor of 5 by this veto requirement, with a signal loss of only 25%.
BA BA R
BA BA R
Figure 14: Invariant mass of γγ pairs from hadronic events. Upper pair of plots are for Eγ >30 MeV and Eγγ >300 MeV, with enlargement of the π 0 mass region on the right; lower pair of plots are for Eγ >100 MeV and Eγγ >1 GeV, with enlargement of the η mass region on the right. The detector segmentation and achieved spatial resolution allow the reconstruction of π 0 ’s with photon separation in the electromagnetic calorimeter as small as 5 cm, although with some deterioration of the resolution. The small fraction of high energy π 0 whose photons cannot be resolved into individual photon bumps (≈10% in the 4–6 GeV region) can be separated from single photons using the cluster shape (the second moment of the energy distribution around the cluster centroid). Large samples of inclusive and exclusive data have been used for simulation comparison studies. The π 0 mass value, resolution, and efficiency, and their (weak) energy dependence were found to be in very good agreement. Furthermore, the π 0 mass, width, and yield, are monitored in real time during data collection and reconstruction. Limits on the possible discrepancies between the data and the simulation for the photon energy scale, resolution, and reconstruction efficiency, have been 37
conservatively set to be 0.75%, 1.5% and 2.5% respectively. 7.2.3
Neutral Hadrons
• KS0 → π + π −
To reconstruct KS0 candidates, we consider any pair of oppositely-charged tracks combined in a common vertex. No cut is made on the probability of χ2 , but the vertex fit must converge. The recontructed momentum of the KS0 candidate is required to be aligned with the direction between the interaction point and the reconstructed vertex. Finally, a minimum transverse momentum of the daughters with respect to the flight direction is required in order to eliminate combinatorial and Λ contamination. For Figure 15, a tighter selection is applied on a small data sample; the χ2 probability is required to be greater than 0.01, the angle between the direction of flight and the direction from the interaction point to the reconstructed vertex is required to be greater than 45 mr, the transverse momentum of the daughters with respect to the KS0 flight direction is required to be between 0.11 and 0.22 GeV/c. N(π+π-) candidates/1.7 MeV
300
BABAR
200
100
0 0.45
0.475
0.5
0.525
0.55
M(π+π-) (GeV)
Figure 15: KS0 mass resolution (tight selection). The fit is performed with a double Gaussian, the central Gaussian contains 70% of the events and has a width of 2.82 ± 0.19 MeV/c2 . • KS0 → π 0 π 0
Non-overlapping π 0 candidates are combined to construct KS0 → π 0 π 0 candidates. For each candidate with an energy above 800 MeV and a mass between 300 and 700 MeV/c2 , we determine the most probable decay vertex along the path defined by its momentum vector and the primary vertex. The point where the product of the probabilities from the two π 0 mass constraint fits is a maximum is chosen as the KS0 decay vertex. We demand that this point lie in a region between −10 and +40 cm from the primary vertex and that the KS0 mass at that point is in the range 470–536 MeV/c2 . This method [18] improves significantly the mass scale and resolution. A vertex resolution of 5 cm along the flight direction is predicted by the simulation. The inclusive KS0 mass peak from real data, exhibiting a resolution better than 10 MeV/c2 , is shown in Figure 16.
38
BA BA R
Figure 16: π 0 π 0 mass spectrum and KS0 signal from hadronic events • KL0
The EMC and IFR detectors are both used for the detection of KL mesons, which are reconstructed as neutral clusters that cannot be associated with any charged track in the event. In the EMC, the background consists primarily of photons and high energy π 0 s. We are able to distinguish KL clusters from these backgrounds by using a shower shape analysis, performed by expanding the shape into a series of Zernike moments. For clusters with an energy greater than 500 MeV, a single Zernike moment (2,0) is sufficient to discriminate KL mesons and photons. Between 200 and 500 MeV, a two-dimensional cut ((2,0) and (4,2)) is used. Below 200 MeV, we are unable to sufficiently discriminate between photons and KL mesons. IFR clusters are defined and selected as hits in two or more resistive plate chamber layers. The background is dominantly charged particles and detector noise. Some splitoffs from charged hadronic showers are missed by the tracking association, due to the irregular structure of these showers. We suppress these clusters by rejecting KL candidate clusters close to any track in the event. The performance of the KL identification is demonstrated in Figure 17a, using events from e+ e− → γ(φ → KS KL ). In these events, the position and energy of the KL can be constrained from the measured photon and KS kinematics. Figures 17b and 17c illustrate the performance of the KL selection. We observe good agreement between Monte Carlo simulations and the data. The efficiency for KL reconstruction agrees to within the current statistical error, which is approximately 10% for both IFR and EMC selections.
39
Entries / 2.4 MeV
BABAR
(a)
80
BABAR
(b)
80
60
BABAR
(c)
60
60
40
40
40
20
20
20
0
0 0.425
0.45
0.475
0.5
0.525
0 0
0.2
0.4
Missing mass [ GeV ]
0.6
0.8
1
Zernike 20
0
5
10
15
20
Nr IFR layers
Figure 17: The missing mass distribution (p2KL ) of candidate φγ events is shown in (a). We find 594 ± 40 e+ e− → γ(φ → KS KL ) events. Using these events, (b) shows the comparison of the Zernike moment (2,0) distribution for clusters from KL mesons (points) and photons (histogram). A comparison between data (points) and Monte Carlo (histogram) is shown in (c) for the number of hit layers in the Instrumented Flux Detector (plot (c) is absolutely normalized).
8
Common Analysis Issues
8.1
Centre of Mass Energy and Boost
The beam energies provided by PEP-II are obtained with an algorithm capable of tracking variations to within about 1 MeV, and are used to determine the time-dependence of the centre of mass energy. The absolute energy scale is determined from a sample of fully-reconstructed B candidates (a recent measurement of the B mass by CLEO [13] is used). We define two main coordinate systems: • A BABAR coordinate system (LAB), linked to the BABAR detector. The z axis is along the DCH axial wires, the y axis is vertical (upward) and the x axis points towards the exterior of the PEP-II rings. The BABAR z axis and the PEP-II electron beam are not exactly aligned. The former is tilted in the horizontal plane by 19 mrad with respect to the beam axis. • A centre-of-mass coordinate system (CMS), a frame where the two beams have equal energy √ Eb∗ = s/2 (where Eb∗ is the centre-of-mass beam energy). The z axis of the CMS lies along the electron beam direction (this is the relevant choice for most physics quantities). The Lorentz transformation from LAB into CMS quantities is the product of a rotation that aligns the z ′ axis of the rotated frame with the boost direction, and a Lorentz boost along the new z ′ into the CMS frame. The rotation angles are determined on a run-by-run basis from the opening angle and flight direction of µ+ µ− and e+ e− events, and are verified against the orientation of the collision spot for the beams. The magnitude of the boost is obtained from the PEP-II energies.
8.2
Continuum Rejection Variables
We use common shape variables, computed with charged tracks in the centre of mass frame, to preferenctially reject continuum events. The most important of these variables are thrust, sphericity and R2, the ratio of 2nd to 0th Fox-Wolfram moments. 40
• Thrust: The thrust axis, Tˆ, of an event is defined to be the direction that maximizes the sum of the longitudinal momenta of the particles. The value of the thrust T must lie in the range 0.5 to 1, where T ∼ 1 corresponds to a highly directional event and T ∼ 0.5 to an isotropic event. • Sphericity: Sphericity is a measure of the sum of squares of transverse momenta for each track with respect to the event axis. Highly directional events have low sphericity whereas isotropic events tend to have sphericities close to one. • Fox-Wolfram moments: The ℓth Fox-Wolfram moment is momentum-weighted sum of Legendre polyomial of the ℓth order computed from the cosine of the angle between all pairs of tracks. The ratio R2 of Fox-Wolfram 2nd to 0th moments is the variable which provides the best separation between BB signal and continuum. Jet-like continuum events tend to have higher values of R2 than the more spherical BB events.
8.3 8.3.1
Event Selection and B Counting Fiducial regions
The acceptance region in polar angle for charged tracks, corresponding to full SVT coverage, ranges from a minimum of 410 mr with respect to the z axis in the forward direction to 602 mr in the backward direction (0.41 < θ < 2.54). For neutral clusters, the fiducial region is reduced to an angle 732 mr with respect to the z axis in the backward direction (0.41 < θ < 2.41) to account for the more limited EMC coverage in the backward region. 8.3.2
Multi-Hadron selection
Multi-hadron event selection is designed to have a very high efficiency for BB events while keeping the systematic uncertainties on the determination of that efficiency as low as possible. The contribution of continuum and τ pair events in the sample is reduced by a cut on R2. Using only tracks and clusters in fiducial volume described above, the selection criteria are as follows: • Four or more charged tracks, at least three of which must have associated DCH information • Primary vertex within 5 mm in x and y of the nominal beam spot position, • R2 less than 0.7, • Total energy greater than 5 GeV. The efficiency for BB events is 96%, while the contamination due to beam gas, two-photon and tau pair events is approximately 2%. 8.3.3
Muon pair selection
In the centre of mass frame, events containing two charged tracks with momenta larger than 2 GeV/c and 4 GeV/c, respectively, and with angle with respect to the beam axis greater than 725 mr are selected. The two tracks must have an acolinearity smaller than 10◦ . The mass of the pair must be larger than 7.5 GeV/c2 . The total energy deposited in the calorimeter by the two particles must be smaller than 1 GeV. The event is rejected if neither track has an associated energy measurement. 41
8.4
Offline Luminosity Determination
The integrated luminosity recorded by BABAR is determined offline using Bhabha, muon pair, and gamma-gamma events. The measurement precision is limited by systematic errors in all cases to the several percent level, although this clearly can be improved to 0.5% or better. The systematic uncertainty for the Bhabha measurement is dominated by the efficiency corrections for the Bhabha veto by the Level 3 trigger, and by theoretical uncertainties on the differential Bhabha cross section. Likewise, we are still in the process of comparing and understanding Monte Carlo generators for muon pair events, including proper treatment of radiative events. A better understanding of the impact of occasional hot towers in the EMC will improve the systematic error on the gamma-gamma luminosity. The luminosity determinations are consistent at the several percent level, but are much better than this for tracking relative luminosity and the variation with beam conditions.
8.5
B Counting
We estimate the number of BB pairs NBB from the total number of events passing the hadronic event selection NM H and the total number of events passing the muon pair selection Nµµ : on off NBB = NM H − κ × NM H ×
on Nµµ off Nµµ
,
(5)
where the superscript on refers to on-resonance data and off to off-resonance. κ is a factor close to 1 that corrects for changes in efficiency and cross section with center of mass energy. It is estimated by Monte Carlo to be 0.9962. The systematic error on NBB is 1.7%, dominated by the variation of f of f between running periods of the ratio NM H /Nµ+ µ− . Branching fraction measurements frequently use the number of produced BB pairs. The efficiency for BB events to pass the selection criteria is determined by Monte Carlo to be 96.0%. The total systematic error on the number of produced BB pairs is 3.6%.
8.6 8.6.1
Exclusive B Reconstruction Variables Kinematic variables
A number of kinematic quantities could be used to characterize the reaction e+ e− → BB where one of the B mesons is fully reconstructed. However, our goal is to select a pair of such kinematic variables, having little correlation between them, that make use of the maximum available information for optimal background rejection. At the Υ (4S) resonance the B mesons are produced with very small Q values. As a result their center-of-mass energy E ∗ and momentum p∗ are very sensitive to fluctuations of the center-of-mass √ beam energy Eb∗ = s/2. In contrast, the variable ∆E defined as: ∆E = E ∗ − Eb∗ ,
(6)
is relatively insensitive to Eb∗ fluctuations. The distribution of ∆E is peaked at zero for e+ e− → BB events, and its width is governed in 2 . It is not necessary to boost the B candidate most cases by the beam energy measurement error σE to the center-of-mass frame to compute ∆E, as can be seen by writing ∆E in an explicitely Lorentz invariant form: 2 Pe .Pei − s √ ∆E = , (7) 2 s 42
where Pe and Pei are the Lorentz vectors representing the B candidate four momentum and the initial-state four momentum respectively. The ∆E variable is used in conjunction with either one of the following two mass variables: • Beam-energy substituted mass mES , defined as: mES
v u u =t
1 2s
→ → +− p .− pi Ei
!2
− p2
,
(8)
→ where Ei and − p i are the total energy and the three momentum of the initial state in the → laboratory frame, and − p is the three momentum of the B candidate in the same frame. At − → → a symmetric machine (where − p i = 0 ) this variable is obtained simply by substituting the ∗ beam energy Eb from the measured B candidate energy E ∗ : mES =
q
Eb∗2 − p∗2
.
(9)
This is the definition of the variable used in ARGUS and CLEO publications under the name “beam-constrained” mass. The advantage of using definition of Eq. 8 at an asymmetric machine, where one needs to assign masses to candidates in order to boost to the center of mass frame, is that mES is computed in the laboratory frame without any prior commitment to the identification of particles among the B daughters. • Beam-energy constrained mass mEC , defined as: mEC =
q
b 2 − pb 2 E
,
(10)
b and pb are center-of-mass frame quantities obtained by performing a kinematic fit where E with the E ∗ = Eb constraint.
The two choices (∆E, mES ) and (∆E, mEC ) are almost equivalent. For certain analyses, it may be helpful to exploit the property that mES does not require daughter mass assignments, while the kinematical fit performed for mEC makes optimal use of the information collected by the detector. in addition, the pair (∆E, mEC ) has the smallest correlation. 8.6.2
Background parametrisation
To describe the background shape in beam-energy constrained mass plots, we use the ARGUS distribution [14] given by: A( m | m0 , c ) =
q h i θ(m < m0 ) , × m 1 − (m/m0 )2 × exp c (1 − m/m0 )2 N
(11)
where m0 represents the kinematic upper limit and is generally held fixed at the center-of-mass beam energy Eb∗ .
43
9
Conclusions and Prospects
Since the start of running at PEP-II in May 1999, the BABAR experiment has accumulated over 12.7 fb−1 of data. Many of the detector sub-systems have reached their design goals and significant progress has been made towards understanding the performance of the detector. Several preliminary measurements with the BABAR detector are to be presented at this conference. We anticipate having a data set equivalent to a significantly larger integrated luminosity by the end of this year. Thus, the results presented here are just the beginning of an exciting program of physics with BABAR at PEP-II. In future years, we expect to be able to undertake detailed studies of CP violation in the B meson system.
10
Acknowledgments
We are grateful for the contributions of our PEP-II colleagues in achieving the excellent luminosity and machine conditions that have made this work possible. We acknowledge support from the Natural Sciences and Engineering Research Council (Canada), Institute of High Energy Physics (China), Commissariat ` a l’Energie Atomique and Institut National de Physique Nucl´eaire et de Physique des Particules (France), Bundesministerium f¨ ur Bildung und Forschung (Germany), Istituto Nazionale di Fisica Nucleare (Italy), The Research Council of Norway, Ministry of Science and Technology of the Russian Federation, Particle Physics and Astronomy Research Council (United Kingdom), the Department of Energy (US), and the National Science Foundation (US). In addition, individual support has been received from the Swiss National Foundation, the A. P. Sloan Foundation, the Research Corporation, and the Alexander von Humboldt Foundation. The visiting groups wish to thank SLAC for the support and kind hospitality extended to them.
References [1] An Asymmetric B Factory Based on PEP, The Conceptual Design Report for PEP-II LBNL Pub 5303, SLAC-372 (1991). [2] Status Report on PEP-II Performance, J. Seeman et al., to appear in the Proceedings of the VIIth European Part. Acc. Conf. - EPAC 2000, Vienna, Austria, (June 2000). [3] BABAR Technical Design Report, BABAR Collaboration, SLAC-REP-372 (1995). [4] The BABAR Silicon Vertex Tracker, C. Bozzi et al., Nucl. Instr. and Methods A435 (1999) 25. [5] R. Santonico and R. Cardarelli, Nucl. Instr. and Methods A187 (1981) 377. [6] A. Ryd et al. EvtGen User Guide: http://www.slac.stanford.edu/BFROOT/doc/LIGHT/6.7.5/src/EvtGen/guide/ [7] “GEANT, Detector Description and Simulation Tool”, CERN Program Library Long Writeup W5013, (1994). [8] H. C. Fesefeldt, Technical Report PITHA 85-02, III, Physikalisches Institut, RWTH Aachen Physikzentrum, 5100 Aachen, Germany, (1985).
44
[9] P. A. Aarnio et al., FLUKA86 User’s Guide, CERN Technical Report TIS-RP-168, (1986); P. A. Aarnio et al., Enhancements to the FLUKA86 Program (FLUKA87), CERN Technical Report TIS-RP-190, (1987). [10] C. Zeitnitz and T. A. Gabriel, “The Geant-Calor Interface User’s Guide”: http://dipmza.physik.uni-mainz.de/~ www aleph/zeitnitz c/gcalor manual.ps, (1996). [11] David N. Brown, Eric A. Charles, and Douglas A. Roberts, The BABAR Track Fitting Algorithm, Proceedings of CHEP 2000, (M. Mazzucato, ed.), Padova, Italy (Feb. 2000). [12] The BABAR Physics Book, P.F. Harrison and H.R. Quinn editors, SLAC-REP-504 (1998). [13] S.E. Csorna et al. (CLEO Collaboration), Phys. Rev. D61 (2000) 111101. [14] H. Albrecht et al. (ARGUS Collaboration), Phys. Lett. B185 (1987) 218. [15] Statistical and Computational Methods in Data Analysis, Siegmund Brandt, North Holland Publishing. [16] A. Drescher et al., Nucl. Instr. and Methods A237 (1985) 464. [17] R. Sinkus and T. Voss, Nucl. Instr. and Methods A391 (1990) 360. [18] R.Adler et al. (CPLEAR Collaboration), Z. Phys. C70 (1996) 211.
45