THE FUTURE OF THE WORLD SUGAR MARKET – A SPATIAL PRICE EQUILIBRIUM ANALYSIS Stephan Nolte Department of Agricultural Economics, University of Ghent, Belgium
[email protected]
Paper prepared for presentation at the 107th EAAE Seminar "Modelling of Agricultural and Rural Development Policies". Sevilla, Spain, January 29th -February 1st, 2008
Copyright 2007 by Stephan Nolte. All rights reserved. Readers may make verbatim copies of this document for non-commercial purposes by any means, provided that this copyright notice appears on all such copies.
Abstract A spatial price equilibrium (SPE) model of the world sugar market is programmed. The model covers more than hundred regions and contains sugar in as a sole product. It has a detailed coverage of policies and bilateral trade agreements. It is programmed as a mixed complementarity problem (MCP) in GAMS and uses the PATH solver. The SPE framework offers considerable advantages over other model approaches applied to the sugar market before. Four scenarios are simulated: A baseline scenario until 2015/16, accounting for implementation of the EU reform and market access commitments already decided upon. The liberalization scenarios include an implementation of the Falconer proposal for the current round of WTO negotiations, a full liberalization by the EU and a liberalization of all sugar policies world-wide. In the latter the world market price increases by around 30%. Results are discussed and related to special properties of the SPE approach. Strengths and weaknesses are identified and an outlook on the further refinement of the analysis is given. Key words: Sugar, Partial Equilibrium Model, Spatial Price Equilibrium Model, MCP.
1. Introduction Sugar is one of the most highly protected agricultural products world-wide. Many industrial as well as many developing countries have high trade barriers and domestic market regulations in place (Mitchell, 2004). The Uruguay Round (UR) of the World Trade Organization (WTO) brought little changes to that situation. Trade barriers basically remained prohibitive where they had been so before, and domestic price levels were affected only slightly if at all. Policy changes which did have a major impact were introduced unilaterally, most important the Everything But Arms (EBA) initiative of the European Union (EU) and the reform of its common market organization for sugar (CMO). Recently, the EU announced that the sugar protocol with the ACP (Africa, Caribbean and Pacific) countries was cancelled and is to be replaced by a regulation similar to EBA for all ACP member states. In addition, the current round of WTO negotiations has the potential to impact the sugar market significantly. If the July proposal of Chairman Falconer is taken as a benchmark for a possible agreement (AgraEurope Weekly, 2007), the envisaged tariff cuts would bring an end to the prohibitive effect of the Most Favoured Nation (MFN) tariffs in all major distorting industrialized countries. Many of these policy changes have been analyzed with equilibrium models in recent years. These equilibrium models can be broadly divided in two categories, net-trade models and gross-trade models, the latter of which is able to account for bilateral trade flows endogenously. Bilateral trade relationships are prevalent and important in the sugar market. On the one hand, they are present as preferential tariff reductions as a form of development assistance, and in fact account for the bulk of the value of all agricultural trade preferences (Grethe, 2005). On the other hand, sugar is included in various regional trade arrangements which do not primarily serve development objectives. Net trade models analyzing the sugar market cannot explicitly take these trade relationships into account. The gross trade models applied to the sugar market in the past, however, all rely on the Armington (1969) assumption of heterogeneity with regard to origin. For the sugar, however, which “is a true homogeneous commodity” (Elobeid and Beghin, 2005), this assumption is unrealistic. It furthermore
leads to the well known small shares problem (see e.g. Kuiper and Van Tongeren, 2006). In this paper a Spatial Price Equilibrium Model (SPE, Takayama and Judge, 1971) is applied, which allows for the combination of the strengths of both approaches: the depiction of bilateral trade flows and the retention of the homogeneous goods assumption. The model has a broad country and policy coverage, including a multitude of preferential and regional trade arrangements. It is formulated as a mixed complementarity problem (MCP) in GAMS and solved with the PATH solver. Chapter 2 describes the SPE model. In chapter 3, a baseline scenario and three liberalization scenarios are simulated and a sensitivity analysis with respect to crucial parameters is carried out. In chapter 4, results are discussed and related to special properties of the SPE approach. Strengths and weaknesses of the approach are identified and an outlook on the further refinement of the analysis is made.1
2.
Description of the model
The model used is this study is a SPE (Takayama and Judge, 1971). This model type in its original form is a normative model solved by maximizing a net-social-payoff function as suggested by Samuelson (1952). There are, however, situations which cannot be depicted properly in a SPE solved as a maximization problem, such as discriminatory ad valorem tariffs, which are present in most models including the one here. In such cases the SPE can be formulated as a MCP (Rutherford, 1995).2 The MCP formulation of the model used here is:
Di ≤ ∑∑ X sch, j ,i
┴ PDi ≥ 0
(1)
S j ≥ ∑∑ X sch,i , j
┴ PSj ≥ 0
(2)
S j ≤ quota j
┴ PSHj ≥ 0
(3)
X sch, j ,i ≤ trqsch, j ,i
┴ PQsch,j,i ≥ 0
(4)
┴ Xsch,j,i ≥ 0
(5)
sch
sch
j
i
( PS j + PSH j + PQsch, j ,i + exw _ fas j + loading j + freight j ,i + tc sch − ex _ sub j ,i ) * (1 + tar _ av sch, j ,i ) + tar _ sp sch, j ,i + unloading i + inld _ transporti ≥ PDi
with i being the set of consuming regions, j the set of producing regions, Di demand in county i, Xsch,j,i trade flows from country j to i (including domestic sales) under scheme sch, PDi the consumer price, Sj supply in j, PSj the producer price, quotaj the production quota in j, PSHj the rental price for production quota, trqsch,j,i the TRQ for exports from j to i under scheme sch and PQsch,j,i the rental price for the TRQ. The parameters (written in lower case letters) in equation (5) are transportation costs from factory to the port, loading and unloading costs for ocean vessels, ocean freight rates, transaction costs, ad valorem and specific tariffs, export subsidies and transportation costs from the port or the factory to the wholesale market.
1
This paper is based in large parts on a Dissertation (Nolte, forthcoming) written at the Humboldt-University of Berlin under the supervision of Harald Grethe whose guidance is gratefully acknowledged. 2 The explanation of this is rather complicated. It can be found in Rutherford (1995) or Bishop et al. (2001).
Most of the national supply curves (as well as all demand curves) used in the model are isoelastic functions such as (6): S j = β * PS j
ε
(6)
with ε being the own price elasticity of supply and β a calibrated intercept. To allow for the depiction of an end of production in certain countries, a different functional form (Nolte and Grethe, 2007) shown in (7) is applied for some countries, in which a (negative) parameter α is added to the function:
{ (
S j = MAX 0 , α + β * PS
γ j
)}
(7)
Stemming from a normative approach, the SPE model is unable to reproduce any arbitrary set of base data unless it constitutes an optimum. Thus, starting from the EU fob price (European Commission, 2007), all other cif and fob prices as well as bilateral trade flows in the model are determined endogenously in a calibration run holding demand and supply constant. The outcome of this calibration run reproduces in most cases satisfactorily, though not perfectly, the trade patterns which can be observed in reality. The model covers 104 regions of production and 90 regions of consumption. These include the EU-25 and accession candidates, the USA and all sugar producing countries which have and will have preferential market access to those countries under the various existing schemes. It furthermore contains Norway, Canada, Switzerland and all regions covered by the FAPRI/CARD International Sugar Model (Elobeid and Beghin, 2005). All sugar is modelled as white sugar equivalents (WSE). The production of sugar is modelled as a one-stage process and demand for sugar crops except for the production of sugar is not explicitly accounted for. The model covers all sugar policies listed by Elobeid and Beghin (2005) plus others extracted from various sources. As a spatial model, it is able to analyze the effect of bilateral trade policies. Thus, various preferential import schemes of the EU and the USA as well as regional trade arrangements such as CARICOM (Caribbean Community and Common Market), SADC (Southern African Development Community) and COMESA (Common Market for Eastern and Southern Africa) are modelled. Ocean freight rates are estimated econometrically for all routes from data published by the International Sugar Organization (ISO, 2007). 3
3.
Simulation results
3.1. Scenario description The model described in the last chapter is used to simulate four scenarios for the projection year 2015/16. These are: 1. BASELINE SCENARIO: A benchmark scenario, which accounts for the implementation of all policy changes already decided. These are basically the phasing in of various preferential market access commitments by the EU (Accession of Bulgaria and Romania, EBA, duty and quota free access for ACP countries) and the USA (NAFTA, CAFTA). Shifters of technical 3
For a comprehensive overview over sources for base data and parameters and a more detailed description of the calibration process refer to Nolte (forthcoming).
progress and demand are adjusted such as to meet quantity and world market price projections by FAPRI (2006).4 2. WTO AGREEMENT: Simulation of tariff reductions according to the Falconer proposal of July 2007 as shown in table 1. Table 1: Proposed Formula for Agricultural Tariff Cuts Industrialized countries Current tariff in ad Tariff reduction valorem equivalents 0-20% 48-50% 20-50% 55-60% 50-75% 62-65% > 75% 66-73% Source: Agra-Europe Weekly (2007).
Developing Countries Current tariff in ad valorem equivalents 0-30% 30-80% 80-130% > 130%
Tariff reduction 32-33% 37-40% 41-43% 44-49%
3. EU LIBERALIZATION: Complete liberalization of all EU sugar policies. All policy measures such as production quotas, tariffs, TRQs and export subsidies are abolished. The only policy measure which is retained is the decoupled direct payments.5 4. FULL LIBERALIZATION: Full liberalization of all sugar market and domestic polices by all countries in the model. 3.2. Results Table 2 shows the model results for prices (rows 1-14), production (rows 15-28) and consumption (rows 29-42) in major countries under different scenarios. As a world market price for white sugar the Near East cif price is chosen. Commonly the world market price for white sugar is stated as London fob. In a few years, there will, however, be no exports of sugar anymore from Europe. A European fob price is, thus, meaningless.6 In the baseline scenario this price is simulated to increase by 12% to € 254 per ton. Prices in those countries which operate at world market conditions change by about the same percentage. Prices in the US, South Africa and Japan, which have administered prices in place, sink by 20% due to inflation. The price in the EU decreases by even 44% due to the implementation of the 2006 reform and the access for Least Developed countries (LDC) and ACP countries to the EU sugar market. The volume of the global sugar market (production equals consumption, stock changes are ignored) increases to 151 million tons. Production in single countries in table 2 increases by 10% -
4
The abolishment of the EU ACP sugar protocol was decided upon only after publication of the FAPRI data. The shifters were thus adjusted to meet the FAPRI projections under the assumed continuation of the protocol. 5 The assumed allocation effectiveness of these direct payments, which is adopted from the ESIM model (BANSE ET AL., 2007), is 20%, which makes their effect on production rather unimportant. 6 Another possibility would have been to take the Caribbean fob price as world market price, which is commonly used for raw sugar. Due to the complex economics of white and raw sugar production and shipping as well as refining (explained in detail in Nolte, forthcoming), this price would be much lower than the actual Caribbean price for white sugar (if it were traded) would be.
33% except for the US, Japan and of course the EU, where the produced quantity even decreases due to the reform.7
7
Marketing allotments in the US are fixed according to FAPRI projections of US production. Japanese policy is assumed to keep the nominal internal price level constant. The reform in the EU is modeled by letting the least efficient producers subsequently reduce their production until a balanced market is achieved. This is somewhat in contrast to the most recent developments in the EU restructuring process.
Table 2: Model results under different scenarios in 2015/16 (in MT WSE and real 2004/05 € per MT). Base*
Baseline
WTO Agreement
EU Liberalization
Full Liberalization
Prices (1) (2) (3) (4) (5) (6) (7) (8) (9) (10) (11) (12) (13) (14)
World† EU-27 USA Brazil Australia Thailand Guatemala Cuba Colombia South Africa Russia China India Japan
228 712 518 174 190 221 174 176 173 456 358 292 396 984
254 396 414 198 215 240 199 201 196 365 362 323 427 787
(12%)‡ (-44%) (-20%) (14%) (13%) (8%) (15%) (15%) (14%) (-20%) (1%) (11%) (8%) (-20%)
273 380 349 217 235 240 220 222 218 365 381 347 427 426
(7%)# (-4%) (-16%) (10%) (9%) (0%) (11%) (10%) (11%) (0%) (5%) (7%) (0%) (-46%)
302 307 414 246 256 258 244 246 243 366 409 370 427 789
(19%)# (-22%) (0%) (24%) (19%) (7%) (22%) (22%) (24%) (0%) (13%) (15%) (0%) (0%)
333 339 337 277 289 292 279 282 278 286 349 347 354 342
(31%)# (-14%) (-19%) (40%) (34%) (22%) (40%) (40%) (42%) (-22%) (-3%) (8%) (-17%) (-57%)
132.4 19.1 6.9 25.4 4.9 4.9 1.8 1.5 2.3 2.1 2.2 8.9 17.6 0.8
151.1 15.7 7.1 31.7 5.9 6.6 2.0 1.7 3.0 2.5 2.4 10.0 22.0 0.8
(14%) (-18%) (3%) (25%) (21%) (33%) (11%) (13%) (28%) (21%) (13%) (12%) (25%) (-1%)
151.1 15.3 5.1 34.1 6.3 6.8 2.0 1.8 3.1 2.6 2.5 10.2 22.0 0.0
(-0%) (-3%) (-27%) (7%) (6%) (3%) (4%) (2%) (4%) (3%) (4%) (2%) (0%) (-100%)
150.3 5.3 7.1 37.5 6.6 6.9 2.1 1.8 3.2 2.7 2.6 10.4 22.0 0.8
(-1%) (-66%) (0%) (18%) (12%) (6%) (7%) (4%) (8%) (7%) (9%) (5%) (0%) (1%)
151.3 9.6 4.6 41.1 7.2 7.2 2.2 1.6 3.3 2.8 2.4 10.2 20.7 0.0
(0%) (-39%) (-34%) (29%) (21%) (10%) (12%) (-9%) (13%) (12%) (-2%) (2%) (-6%) (-100%)
Production (15) (16) (17) (18) (19) (20) (21) (22) (23) (24) (25) (26) (27) (28)
World EU-27 USA Brazil Australia Thailand Guatemala Cuba Colombia South Africa Russia China India Japan
Demand (29) World 132.4 151.1 (14%) 151.1 (0%) 150.3 (-1%) 151.3 (0%) (30) EU-27 18.0 19.6 (9%) 19.7 (0%) 20.1 (2%) 19.9 (1%) (31) USA 8.5 8.8 (3%) 8.9 (1%) 8.8 (0%) 8.9 (1%) (32) Brazil 9.8 11.3 (16%) 11.2 (-1%) 11.1 (-2%) 11.0 (-3%) (33) Australia 1.1 1.2 (11%) 1.2 (-1%) 1.2 (-2%) 1.2 (-4%) (34) Thailand 2.1 2.5 (20%) 2.5 (0%) 2.4 (-1%) 2.4 (-2%) (35) Guatemala 0.6 0.7 (25%) 0.7 (-1%) 0.7 (-2%) 0.7 (-3%) (36) Cuba 0.6 0.7 (7%) 0.7 (-1%) 0.7 (-2%) 0.7 (-3%) (37) Colombia 1.4 1.8 (23%) 1.7 (-1%) 1.7 (-2%) 1.7 (-3%) (38) South Africa 1.4 1.6 (14%) 1.6 (0%) 1.6 (-0%) 1.7 (2%) (39) Russia 5.9 6.1 (3%) 6.1 (-0%) 6.0 (-1%) 6.1 (0%) (40) China 10.5 11.9 (13%) 11.8 (-1%) 11.8 (-1%) 11.8 (-1%) (41) India 18.2 22.0 (21%) 22.0 (0%) 22.0 (0%) 22.4 (2%) (42) Japan 2.2 2.2 (3%) 2.4 (5%) 2.2 (-0%) 2.4 (7%) Sources: F.O. Licht (2007a), European Commission (2007), Nolte (forthcoming); own simulations. * Base period is 2004/05. † Near East cif landed. ‡ Changes relative to the base period. # Changes relative to the baseline scenario
After the implementation of a possible WTO agreement the world market price is supposed to increase by 7% to € 273. Production in countries with a formerly high degree of producer support decreases. The EU is only affected slightly due to the 2006 reform which anticipated many of the liberalizations which would otherwise have become due after the ratification of the WTO agreement. In the US, production decreases by 27% to 5.1 million tons. Both countries become significant importers of sugar on a MFN base. Production in Japan comes to a complete end.8 Production in countries currently operating at world market conditions increase by 3% - 9%, the strongest increase taking place in Brazil. In case of a unilateral abolishment of all sugar policies on the part of the EU, the world market price increases by 19% to € 302. Interestingly, this is more than the 7% which a partial liberalization by all WTO members would have brought about.9 This leads to according price increases in countries with an open sugar market, and to production increases are usually twice as high as those under the WTO scenario. The production in the EU on the other hand, where prices fall to world market level, decreases by more than two thirds to 5 million tons. Countries with an administered sugar price face no price change and thus no production increase.10 The full liberalization of all sugar policies leads to a world market price increase of 31% to € 333. Results for single countries point in many cases in the same direction as those of the WTO scenario, but are more pronounced. For India and Russia, however, the results show the opposite trend. This is because their policies were not affected by the WTO scenario, since India’s bindings are high enough to sustain its current import policy after a WTO agreement and Russia is not a member of WTO. In case of full liberalization, their import policies are, however, affected as are those of all other countries.11 Table 3 shows the sugar production of EU 27 member states under different scenarios. In the baseline scenario which provides for the implementation of the 2006 reform of the CMO, production falls to 15.7 million tons. At an internal price of € 396, which is significantly above the new reference price level of € 323 (2004/05 real Euro), a balanced market is achieved with a consumption of 19.6 million tons and imports of 3.9 million tons. Despite still being allowed, subsidized exports do not take place anymore. Slovenia, Latvia and Ireland cease sugar production. Of those member states which continue to produce, all southern member states do not manage to fill their quota while all northern member states except for Finland as well as those which acceded in 2004 fill their quota.
8
Japan’s import regime is currently much more restrictive than indicated by its bound tariff and actually not in line with WTO rules. The WTO scenario simulates however, that only notified tariffs are further applied and of course reduced. 9 It makes little sense to compare the world market price increases in a sense of the 19% resulting from EU liberalization being roughly 2.5 times the 7% resulting from a WTO agreement, because this strongly depends on the place of measurement. Measuring the world market price increases in the Caribbean as is usually done for raw sugar, the increases under both scenarios would have been 12% (WTO) and 22% (EU Liberalization) respectively. 10 The exemption is South Africa, where domestic prices are administered, but the sugar sector operates basically at world market conditions. 11 The decrease of production in Cuba is due to the abolishment of state control which is assumed to take place under liberalization.
In the WTO scenario, the EU’s bound tariff for white sugar is cut by almost 70% which is assumed to be the final applied level. The tariff loses its prohibitive effect and MFN imports into the EU take place probably for the first time in the history of the CMO on a large scale. The internal EU price is dependent on the world market price and decreases by 4% to € 380. Total supply decreases by 3% to 15.3 million tons. Demand is almost unaffected. No further member state ceases production. Eleven of them, however, reduce production among them two which used to fill their quota in the baseline scenario.
Table 3: Sugar production in EU 27 member states in 2015/16 (thousand MT WSE). Base Baseline WTO Agreement EU Liberalization Austria 425.7 (-9%) (0%) 134.3 (-65%) 387.3† 387.3 BLEU 911.6 (-10%) (0%) 213.7 (-74%) 819.8 819.8 Bulgaria 2.4 2.6 (8%) 2.4 (-8%) 1.6 (-38%) Czech Rep. 523.7 (-13%) (0%) 254.1 (-44%) 454.9 454.9 Denmark 487.6 (-14%) 352.3 (-16%) 16.7 (-96%) 420.7 Spain 1,001.9 581.9 (-42%) 479.2 (-18%) - (-100%) Finland 146.9 89.7 (-39%) 78.6 (-12%) 25.2 (-72%) France 4,187.0 (-4%) (0%) 1,381.4 (-66%) 4,032.5 4,032.5 Germany 3,920.5 (-7%) (0%) 1,157.9 (-68%) 3,655.5 3,655.5 Greece 309.0 88.2 (-71%) 53.4 (-39%) - (-100%) Hungary 466.6 (-14%) 400.9 (-0%) 182.9 (-54%) 401.7 Ireland 209.3 - (-100%) Italy 1,505.5 487.0 (-68%) 344.6 (-29%) - (-100%) Lithuania 122.9 91.4 (-26%) 79.9 (-13%) 24.2 (-74%) Latvia 66.9 - (-100%) Netherlands 865.3 (-0%) (0%) 294.0 (-66%) 864.6 864.6 Poland 1,890.9 (-12%) (0%) 597.0 (-64%) 1,671.9 1,671.9 Portugal 72.4 27.6 (-62%) 20.1 (-27%) - (-100%) Romania 40.7 38.2 (-6%) 35.1 (-8%) 20.9 (-45%) Slovenia 43.0 - (-100%) Slovakia 224.4 153.4 (-32%) 134.6 (-12%) 43.6 (-72%) Sweden 399.1 (-18%) (0%) 266.4 (-18%) 325.7 325.7 UK 1,287.3 (-12%) (0%) 697.5 (-39%) 1,138.6 1,138.6 Total 19,110.6 15,733.2 (-18%) 15,331.9 (-3%) 5,311.4 (-66%) Demand 18,025.6 19,647.6 (9%) 19,722.3 (0%) 20,088.2 (2%) Imports 2,588.90 3,914.6 (51%) 4,390.1 (12%) 15,029 (284%) Exports 3,673.9 - (-100%) 251.9 Sources: F.O. Licht (2007a), European Commission (2007), Nolte (forthcoming); own numbers indicate that the member state fills its production quota.
Full Liberalization 247.7 (-36%) 480.1 (-41%) 1.9 (-27%) 344.5 (-24%) 150.2 (-64%) 195.2 (-66%) 44.8 (-50%) 2,531.5 (-37%) 2,285.2 (-37%) - (-100%) 275.2 (-31%) - (-100%) 48.3 (-47%) 513.0 (-41%) 1,131.6 (-32%) - (-100%) 26.2 (-31%) 82.4 (-46%) 335.7 (3%) 947.5 (-17%) 9,641.0 (-39%) 19,917.1 (1%) 10,779.6 (175%) 503.3 simulations. † Bold
In case of full unilateral liberalization by the EU, the price sinks to the world market level of € 307. All southern member states cease production. None of the remainder fills its quota entirely anymore. Total production sinks by 66% to 5.3 million tons. Demand increases by 2% to 20.1 million tons. Interestingly, the EU becomes an exporter at world market conditions in this scenario. It exports roughly 250,000 tons to Switzerland where it has a large freight cost advantage over competing producers.
In the full liberalization scenario, the EU price also falls to world market level, which is due to the dismantling of sugar policies of other countries with € 339 considerably higher than in the unilateral liberalization scenario. Demand increases compared to the baseline by 1%, supply falls by 39% to 9.6 million tons. In the southern member states except for Spain production comes to an end. As in the unilateral liberalization scenario, no member state manages to fill its quota anymore, but reduction rates are of course much lower. The exports to Switzerland extend to the entire consumption level, since production there is ceased as well. Table 4 shows the results for imports of the EU under the different model scenarios. In the base period, Bulgaria and Romania are no members of the EU yet. They import about 700,000 tons of sugar on a MFN base from Brazil. Imports from ACP countries under the sugar protocol amount to 1.3 million tons, under quotas for individual Balkans countries to 230,000 tons, under CXL quotas to 89,000 tons under EBA to 104,000 tons and under SPS to 140,000 tons. In the baseline scenario, the internal EU price is projected to fall to € 396. Access for LDC and ACP is quota and duty free. CXL quotas for Brazil are extended considerably after accession of Romania and Bulgaria. Total imports increase from 2.6 to 3.9 million tons, all of which preferential. Especially the abolishment of the quantitative restrictions for LDC and ACP leads to high increases of imports. Especially Swaziland, the Dominican Republic, Guyana and Ethiopia expand their exports to the EU considerably. Other countries such as Sudan and Zambia which were expected to highly benefit from EBA market access increase their exports only moderately or even abandon them since their domestic and regional preferential markets offer higher revenues than exporting to the EU does. While all countries under CXL still fill their quotas, Serbia stops to deliver its quota of 225,000 tons due to the decreased price in the EU. For the same reason some ACP and LDC decrease their exports notwithstanding the increasing overall quantity of imports under these two schemes. Under the WTO scenario the EU wholesale price sinks to € 380. Whereas imports under CXL and the Balkans quotas remain unchanged, many ACP and LDC, e.g. Tanzania, Zambia or Madagascar, decrease their levels of exports or stop them. Others such as Guyana and Mozambique increase their imports despite the lower price level on the EU market due to erosion of preferences in other markets. Overall preferential imports decrease to 3.6 million tons. However, as already mentioned, the EU becomes an importer of sugar under MFN conditions. With roughly 800,000 coming in from Brazil, the entire quantity of imports increases to 4.4 million tons. Under the unilateral EU liberalization scenario no preferential imports take place anymore. Since production falls tremendously at an internal market price of € 307, the overall amount of imports increases to about 15 million tons. The largest part of these comes from Brazil with 12.7 million tons, the remainder coming from other Latin American countries and Eastern Europe (REU). One interesting result of that scenario which is, however, not displayed in table 4 is that the effect of preference erosion is rather moderate. Compared to the baseline scenario, no country reduces its production by more than 10%. The countries most affected are Swaziland, Barbados, Belize St. Kitts and Nevis and Guyana with a reduction of 9-10% each. Compared to the base period 2004/05, only five ACP and LDC countries (Mauritius, Barbados, Jamaica, St. Kitts and Nevis and Trinidad and Tobago) decrease their production at all, however, some of them by larger percentages (2 – 20%). Under full liberalization of all countries, the price and thus production decrease in the EU is less pronounced. Total imports, all of which are of course MFN imports amount to about 10.8 million tons. Brazil is again the major supplier and some 140,000 tons come from Eastern Europe.
Table 4: Model results for imports of the EU 27 under different scenarios in 2015/16 (thousand MT WSE). Base Costa Rica Cuba Nicaragua Brazil Colombia REU RCA MFN total Congo, R. Côte d'Ivoire Kenya Madagascar† Malawi Mauritius Mozambique Swaziland Tanzania Zambia Zimbabwe RAF Barbados Belize Dominican Rep. Jamaica St. Kitts & Nevis Trinidad & Tobago Guyana India Fiji Papua New Guinea ACP total Albania Serbia REU Balkans total
MFN
ACP
Balkans
EU Wholesale Price World Market Price (Near East)
724.6 724.6 10.2 10.2 10.0 10.8 20.8 491.0 12.0 118.2 10.1 14.4 23.4 32.3 39.9 118.6 15.6 29.7 155.0 9.9 167.7 1,299.8 1.3 225.0 5.3 231.6
Baseline 131.5 398.6 580.3 85.9 543.2 10.1 86.7 252.0 6.1 280.9 202.8 12.2 2,590.3 1.3 5.3 6.6
Doha 835.4 835.4 390.1 589.2 70.3 533.0 9.5 105.1 167.9 12.4 297.8 210.0 17.7 2,403.0 1.3 5.3 6.6
EU Lib'n 131.4 376.4 42.9 12,731.5 1,104.1 597.7 45.0 15,029.0 -
€ 712 € 228
€ 396 € 254
€ 380 € 273
€ 307 € 302
Full Lib'n 10,639.2 140.4 10,779.6 € 339 € 333
Cuba Brazil CXL Australia Other CXL total Benin Burkina Faso Congo, D.R. Ethiopia Guinea Madagascar Malawi Mozambique EBA Senegal Sierra Leone Sudan Tanzania Zambia Bangladesh Nepal EBA total Congo, R. Côte d'Ivoire Kenya Madagascar Malawi Mauritius Swaziland SPS Tanzania Zambia Zimbabwe Belize Jamaica Guyana Fiji SPS total Total Imports of EU of which preferential
Base 54.3 22.0 9.1 3.7 89.1 3.8 8.0 11.7 13.8 2.6 27.6 16.4 1.7 9.2 0.3 9.0 104.1 1.7 10.0 10.5 1.7 10.0 13.8 30.0 1.7 11.9 25.0 2.0 6.4 8.0 7.0 139.7 2,589 1,864
Baseline 54.3 508.1 9.1 3.7 575.2 343.4 26.7 18.3 76.4 87.5 93.8 5.9 90.5 742.5 3,915 3,915
Doha 54.3 508.1 9.1 3.7 575.2 337.1 74.6 106.0 52.2 569.9 4,390 3,555
EU Lib'n 15,029 -
Full Lib'n 10,780 -
Sources: F.O. Licht (2007a), European Commission (2007), Nolte (forthcoming); own simulations. † ACP countries in bold letters are also LDCs. Their exports under the various scenarios are shown in the table under EBA.
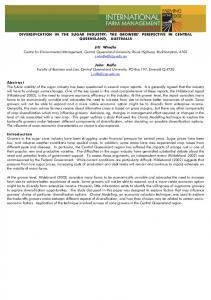
3.3. Sensitivity analysis The results of all equilibrium model studies depend crucially on assumptions and parameters for which the empirical foundation is often rather weak. The study at hand is no exemption from this rule. To investigate the extend to which results of policy changes might be over- or underestimated as a consequence of misspecification of parameters and assumptions, a series of sensitivity analysis is performed. The parameters which are regarded crucial are the supply elasticities of sugar and the ocean freight rates of sugar. Ocean freight rates have been estimated in by Nolte (forthcoming) as a function of among others the Baltic Dry Index which is calculated from freight rates on representative routes for bulk cargo. In the past years as well as in the base period of the model, the average BDI was about 4,000. This has also been assumed for the simulation performed in this chapter. In fall 2007, however, the BDI (which has always been rather volatile) increased to more than 10,000.12 In the same time the freight costs for one ton of (raw) sugar from Brazil to the Baltic Sea have increased to US$ 93, whereas in the beginning of 2007 they had been US$ 45 (ISO, 2007). To investigate the influence of increased freight rates as well as changed elasticity values, the baseline scenario and the full liberalization scenario are calculated again under the assumption of 1. a halving of all supply elasticities 2. a doubling of all supply elasticities13 3. a permanent increase of the BDI to 10,000.
60%
40% 20%
0% -20%
-40% -60%
-80% WORLD
EU-27
US A
BRA
Standard
AUS
THA
ε*½
GUA
ε*2
CUB
COL
S AF
RUS
CHN
IND
JAP
BDI 10,000
Figure 1: Sensitivity analysis of the effect of full liberalization on wholesale prices for sugar compared to the baseline scenario with respect to various parameters. Source: Own simulations.
12 13
The upward trend has, however, stopped meanwhile, and the BDI is decreasing again since November 2007. Only the elasticities of isoelastic functions are altered in this sensitivity analysis.
80% 60% 40% 20% 0% -20% -40% -60% -80% -100% WORLD
EU-27
US A
BRA
Standard
AUS
THA
ε*½
GUA
CUB
ε*2
COL
S AF
RUS
CHN
IND
JAP
BDI 10,000
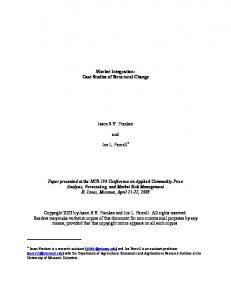
Figure 2: Sensitivity analysis of the effect of full liberalization on sugar production compared to the baseline scenario with respect to various parameters. Source: Own simulations. In figures 1 and 2 the effect of the sensitivity analyses on the effects of full liberalization on prices and production in different regions compared to the baseline scenario are shown graphically. Halving all supply elasticities, full liberalization leads to a slightly stronger increase of the world market price. Thus, the prices in all regions surveyed in figure 1, all of which are in a liberalized world cif or fob based world market prices are somewhat higher. The effects on production are stronger. The increases and decreases projected with the halved elasticity set are usually less than half of those simulated with the standard elasticity set. The effects of doubling the supply elasticities are as can be expected exactly the opposite. The world market price increase is less pronounced than under the standard elasticity set, and thus all prices in the model are lower. Production changes as a result of liberalization are stronger pronounced than in the standard version. The effect of increasing the ocean freight rates on the results of liberalization is small compared to the changes of elasticity levels. Price and supply changes deviate barely from what is observed under the assumption of average ocean freight rates of the base period prevailing also in 2015/16. One must, however, have in mind that what is compared in figures 1 and 2 are relative changes, not absolute changes or absolute or relative levels of these variables. These are much stronger affected.14 In summary, the results are more sensitive to changes of supply elasticities than to changes of freight rates. In no case, however, the sensitivity analyses lead to the direction of changes as a result of liberalization being turned.
14
See Nolte (forthcoming) for a more detailed sensitivity analysis.
4. Conclusions and outlook The simulations carried out in this study provided a high number of interesting results. This applies to overall variables such as production, consumption and prices, as well as to particular results such as bilateral trade flows. Unfortunately, the scope of a conference paper does not allow for the discussion of all the numerous results which are produced by a model analysis with high country coverage and a gross trade formulation. Therefore, the focus of discussing results is put on the EU-27 market and the basic variables of the big players on the sugar market. Already the baseline scenario yielded interesting results for the medium term future of the world sugar market and the EU market in particular. The latter is projected to be in balance in 2015/16 with a production level of 15.7 million tons and imports of 3.9 million tons and at an internal price level which is well above the reference price of € 323 (real 2004/05). This is in contrast to the assumptions of the European Commission which regards it necessary to reduce the sugar quota from its current (2007/08) level of 16.6 million tons by 3.8 million tons to finally 12.8 million tons in order to achieve a balanced market. The preferential imports, especially from LDC are simulated to remain lower than expected.15 The most interesting insight yielded by the WTO scenario is, that it is the level of the tariff which determines the future EU price level and thus production, rather than internal policies, i.e. the reference price. The EU starts to import some 800,000 tons under MFN conditions from Brazil. The overall amount of preferential imports decreases somewhat, with some suppliers decreasing, others increasing their supplies to the EU market. In the EU, prices, production and consumption are only affected marginally. A unilateral liberalization of the EU has, as can be expected the strongest consequences for the EU market and also impacts most other markets stronger than a WTO Agreement is simulated to do. The effect of erosion of trade preferences for sugar could be shown to have only moderate consequences, since many of the beneficiaries of preferences have access to other preferential markets or are even competitive exporters at world market price level. In case of full liberalization the model projects a world market price increase of 31%. This seems rather high. A comparable scenario simulated with the FAPRI/CARD International Sugar Model by Elobeid and Beghin (2005) leads, however, to an increase of 47% which is even higher, and the authors state that their result moves “within the ballpark of previous estimates obtained with partial equilibrium models”. One must, however, have in mind that the world market price Elobeid and Beghin refer to is a Caribbean fob price, whereas the world market price referred to here is a Near East cif price. The increase of the Caribbean fob price in this model would be 41% instead of 31% and is thus much closer to the simulation results of Elobeid and Beghin. Mitchell (2004) surveys various model-based studies which have been published a few years earlier than the ones reviewed here, and their projections of world market price effects of liberalization move around 40% as well. All these studies suffer, however, in comparability due to the fact that their reference scenario does not account for the implementation of the 2006 CMO reform by the EU. The effects of full liberalization of all sugar policies globally mitigate the effects of liberalization by the EU alone. Production decreases considerably less. The beneficiaries of liberalization in terms of market shares are as expected the currently competitive exporters Brazil, Australia, Guatemala, Colombia and South Africa. 15
The latter have been estimated by different model-based and not model-based sources to grow to about 2-3 million tons (see Bureau et al., 2007; Nolte, forthcoming).
The special ability of the model is the precise and realistic depiction of the development of bilateral trade flows in a changing political environment. In particular it is able to investigate how countries that have different opportunities for market access choose among these, which in turn influences the choice of other countries. Comparing the approach with the previously mentioned approaches of Nettrade, homogeneous goods models on the one hand and gross-trade Armington-based models, the approach can clearly be seen as a progress towards a more realistic description of reality. In comparison to the Armington approach it suffers, however, one severe drawback, which is its inability, to reproduce any matrix of bilateral trade flows which is observed in the base period. This inability comes from the models quasi-normative nature. By using such a normative model, one implicitly assumes, that firstly, all constraints of all agents in the model are known and implemented correctly by the modeller and second, that all agents in the model possess all information, full rationality and their behave so as to optimise their utility. Both assumptions are wrong. One attempt to solve this problem for agricultural supply models was the development of Positive Mathematical Programming (PMP) by Howitt (1995) and others. A similar procedure could also be applied to calibrate a SPE to an observed matrix of trade flows. The approach, however, while solving one problem leaves open other questions such as how to treat trade flows which are zero in the base. It remains, thus, a challenge to find a solution for that problem. A normative or quasi-normative approach such as an SPE suffers particularly from a misspecification of real world constraints and relationships, since the worse they are represented, the further the model will deviate from the observed data, which is not the case for positive models. One characteristic of the sugar market which is currently accounted for on a simplified level in the SPE used in this study and which has a particular potential to improve the reproduction of the observed data is the distinction between raw and white sugar and to link both products by a refining industry. First of all, there is a number of countries which imports raw sugar to refine and re-export it on a large scale and these trade flows cannot be explained by the model in its current form. Furthermore, transportation costs and comparative advantages in the production are systematically different between raw and white sugar, which leads to trade flows not being explainable and prices for white sugar (since the model works with white sugar equivalents) being calculated wrong in some regions. A further possibility to refine the analysis does not relate to the SPE approach, but to the comparativestatic formulation of the model. Expectations about exports of certain LDC to the EU under EBA could not be met in the baseline scenario. For instance, Sudan and Ethiopia have ambitious plans for an expansion of their sugar sectors in order to benefit from EBA market access (F.O. Licht, 2007b). To account endogenously for the investments that are being made in these countries in expectation of future marketing possibilities, the model would need a dynamic formulation of supply curves.
5. References Agra-Europe Weekly (2007). New Doha Draft Text Sets Out Tariff Cut Challenges for EU. 20 July. Armington, P. (1969). A Theory of Demand for Products Distinguished by Place of Production. In: IMF Staff Papers, 16, 159-178. Bishop, P. M., C. F. Nicholson, J. E. Pratt, Novakovi, A.M. (2001). Tariff Rate Quotas: Difficult to Model or Plain Simple? Contributed paper presented at the 2001 Annual Conference of the New Zealand Agricultural and Resource Economics Society, Blenheim, New Zealand, 6-7 July.
Elobeid, A., Beghin, J. (2005). Multilateral Trade and Agricultural Policy Reforms in Sugar Markets. CARD Working Paper 04-WP 356, Ames, Iowa. September. European Commission (2007). Agriculture in the European Union - Statistical and Economic Information 2006. Brussels, February. FAPRI (2006). U.S. and World Agricultural Outlook. Staff Report 1-06. Food and Agricultural Policy Research Institute. Iowa State University. University of Missouri-Columbia. Ames, Iowa. F.O. Licht (2007a). F.O. Licht’s International Sugar and Sweetener Report. World Sugar Balances 1997/98 – 2006/07. Ratzeburg, Germany. F.O. Licht (2007b). International Sugar and Sweetener Report. 139(34). Grethe (2005). The Perspective of Agriculture Trade Preferences Granted by the EU to Developing Countries. Contributed paper at the IATRC Annual Meeting 2005, "Pressures for Agricultural Policy Reform: WTO Panels and the Doha Round Negotiations", 19-21 June, Seville, Spain. Howitt (1995). Positive Mathematical Programming. American Journal of Agricultural Economics , 77(2): 329 342. ISO (2007). Sugaronline Bulk Freight Matrix. Weekly report. Kuiper, M., Van Tongeren, F. (2006). Using gravity to move Armington: An empirical approach to the small initial trade share problem in general equilibrium models. Paper prepared for the Ninth Annual Conference on Global Economic Analysis, June 15-17, in Addis Ababa, Ethiopia. Mitchell, D. (2004). Sugar policies: opportunity for change. World Bank Policy Research Working Paper 3222. Washington D.C., February. Nolte, S., Grethe, H. (2007). Improving the ESIM Model for Ex-Post and Ex-Ante Market Analysis (ExtendESIM) Fourth interim deliverable: Better Representation of the new CMO for Sugar in ESIM. February, Institute for Agricultural Economics and Social Sciences, Humboldt-University of Berlin. Nolte, S. (forthcoming). The Future Development of the World Sugar Market: A Spatial Price Equilibrium Analysis. Dissertation. Humboldt-University of Berlin Rutherford (1995). Extensions of GAMS for Complementarity Problems Arising in Applied Economic Analysis. Journal of Economic Dynamics and Control, 19(8): 1299- 1324. Samuelson (1952). Spatial Price Equilibrium and Linear Programming. The American Economic Review, 42(3): 283-303. Takayama, T., Judge, G.G. (1971). Spatial and Temporal Price and Allocation Models. Amsterdam: NorthHolland.