Mar 29, 1976 - proximately 40% CSA and 60% CSB and that CSC appears to be a ..... (eappoxiate 1 g) was Api was washedwimh10om mo 0.1 MiCand ...
The Glycosaminoglycans of the Human Artery and their Changes in Atherosclerosis R. L. STEVENS, M. COLOMBO, J. J. GONZALES, W. HOLLANDER, and K. ScHmn From the Departments of Biochemistry and Medicine, Boston University School of Medicine, Boston University Medical Center, Boston, Massachusetts 02118
A B S T R A C T The changes in levels of glycosaminoglycans (GAGs) of the intima and media of the human artery in atherosclerosis were determined by a recently introduced two-dimensional electrophoresis technique that permits direct measurements of each of these macromolecules. To identify the arterial GAGs, they were fractionated by chromatography on a DEAESephadex A-25 column, and the resulting three fractions (hyaluronic acid [HA], heparan sulfate [HS], and the partially separated chondroitin sulfates B [CSB] and C [CSC]) were analyzed for their electrophoretic mobilities by this electrophoretic method, for their digestability by highly specific hydrolases (leech hyaluronidase, heparinase, and chondroitinases ABC and AC) and for their iduronic acid content. From these studies we concluded that normal and atherosclerotic human aortas contain CSB, CSC, HA, and HS. Further, we demonstrated that CSB is a hybrid consisting of approximately 40% CSA and 60% CSB and that CSC appears to be a polymer consisting essentially of glucuronic acid and N-acetylgalactosamine-6-sulfate. Classical CSA as well as chondroitin (CH) were not present in detectable amounts. In the relatively normal intima, the mean concentrations of the GAGs were found to be 4.7, 20.9, 1.3, and 5.1 mg/g of dry, defatted, decalcified tissue for CSB, CSC, HA, and HS, respectively. With the progression of atherosclerosis, there was a pronounced decrease in the total GAG content (from 32 to 18 mg) associated with a decrease in the CSC and HS levels but without a change in the HA concentration. Of particular interest, however, was the increase in ithe CSB level. In the media whose total GAG content averaged approximately 20 mg, no significant changes in these GAG levels were noted with the progression of Received for publication 27 October 1975 and in revised form 29 March 1976.
470
the disease except for that of CSC. These findings may be important in explaining the increased lipoprotein and collagen deposition in the diseased aorta.
INTRODUCTION Many investigators have studied the glycosaminoglycans (GAGs) 1,2 of normal and atherosclerotic arteries and have reported conflicting findings (1-17). Kaplan and Meyer (2) found insignificant differences in the total GAG contents of the normal and atherosclerotic aortas but demonstrated significant changes in the GAG composition of these vessels. With increasing severity of atherosclerosis, the concentration of chondroitin sulfate C (CSC) and hyaluronic acid (HA) appeared to decrease, while the content of chondroitin sulfate B (CSB) and heparan sulfate (HS) increased. Chondroitin sulfate (CSA), heparin (HP), and keratan sulfate (KS) were not detectable in either the normal or the diseased aorta. On the other hand, Bertelsen and Marcker (3) reported a decrease in the GAG concentration in the atherosclerotic aorta, while Schmidt and Dmochowski (4) reported an increase of these polysaccharides in the diseased artery. In recent studies in which the concentrations and compositions of the arterial GAGs were correlated with the severity of atherosclerosis, Kumar (5) and Dalferes (8) and their coworkers found that the fatty streak lesions contained 1 Since the nomenclature of the mucopolysaccharidases includes the terms chondroitinases ABC and AC, the original nomenclature for the glycosaminoglycans (18) or acid mucopolysaccharides was used for chondroitin sulfates A, B, and C. aAbbreviations used in this paper: CH, chondroitin; CSA, B, C, chondroitin sulfate A, B, and C; ADi-4S, ADi-6S, disaccharide with the sulfate at C4 and C6; GAG, glycosaminoglycan; HA, hyaluronic acid; HP, heparin; HS, heparan sulfate; KS, keratan sulfate.
The Journal of Clinical Investigation Volume 58 August 1976* 470-481
an increased content of GAGs due to increased levels of CSA, CSB, and CSC. In advanced atherosclerosis, with fibrous plaque formation, these workers reported a decrease in the total GAG content in association with a decrease in the sulfated GAGs. A noteworthy finding was the near absence of CSB in the fibrous plaque lesion. In addition to these contradictory results on the quantitative changes of the GAGs, the question as to the presence of CSA and/or CSB in the atherosclerotic intima also remained unanswered (4, 5, 9, 15, 19). A number of factors might account for the qualitative and quantitative differences in the reported GAG values of the normal and atherosclerotic arteries. These factors include differences in the fractionation procedures (16, 17) and in the methods used for the quantitative determination of the GAGs (20). Most of the methods previously utilized to study GAGs are time-consuming and lack a high degree of sensitivity for a specific acid mucopolysaccharide. Recently, a relatively simple and rapid technique for measuring GAGs has been developed by Hata and Nagai (21, 22) that permits separation of the GAGs by two-dimensional electrophoresis. This method is very sensitive, circumvents the losses due to extraction and fractionation of these macromolecules, and yields highly reproducible results. An equally important development in the area of identification of GAGs is the introduction of new enzymes that cleave these macromolecules specifically (19, 23). In the present paper both the two-dimensional electrophoretic method and the enzymatic techniques were used to identify more precisely the arterial acid mucopolysaccharides and to study the changes in the levels of these GAGs with the progression of atherosclerosis.
TABLE I
Age Distribution of Patients Whose Arteries were Analyzed for GAG Composition Intima Atherosclerotic involvement
Number of specimens*
Mean
grade
I II III IV
Media
age of
Number of
Mean age of
patients$
specimens§
patientst
8 9 13 6
39±14.8 47416.9 58±13.2 61 ±7.6
yr
12 24 19 29
39±19.4 53±12.9 64±40.2 68±12.3
yr
* Of these 84 intimas 39 were derived from women, 75 from Caucasian, and 9 from Negroid patients. 49 were from descending thoracic and 35 from abdominal aortas. t Expressed as means with standard deviation. § Of these 36 medias, 14 were derived from women, 33 from Caucasian, and 3 from Negroid patients. 19 were from descending thoracic and 17 from abdominal aortas.
plaques complicated by ulceration, necrosis, or thrombosis, with or without calcification. After contaminating blood was removed from the aortas by gentle cleaning with a moist saline gauze, they were stripped of their adventitia and then separated into an intimal and a medial layer. Microscopic examination of the intimal layer revealed that it was composed of the entire intima with a small portion of adherent media (less than 10%), whereas the medial layer was free of intima and adventia. In some atherosclerotic aortas the plaque and the adjacent, relatively normal area were excised and analyzed separately. All specimens were stored at - 200C and then minced and delipidated with chloroform-methanol (3: 1). The defatted tissue was then dried under vacuum and in the presence of P205 at 560C in an Abderhalden drying apparatus (model 9-202, Fisher Scientific Co., Pittsburgh, Pa.) until constant weight was obtained.
Proteolytic digestion
METHODS
Approximately 100 mg of dry, defatted intima or media was suspended in 3 ml of pH 7.6 buffer (5 mM NaCN, 10 mM cysteine- HCl, and 10 mM EDTA) and digested at 60°C with 3 mg (48 U) of papain (P-L Biochemicals, Inc.,
Classification and delipidation of the arterial specimens 84 human aortas (Table I) were obtained at autopsy within 24 h after death. The extent and severity of atherosclerosis was assessed by gross visual examination of the aortic intimal surface. The severity of the disease was further evaluated by microscopic examination of the lesions. The operational definitions of the different types of atherosclerotic lesions were similar to those used by the International Atherosclerosis Project (24). The aortic samples were graded as follows: Grade I, the intimal surface appeared relatively normal, with less than 10% of the surface covered with fatty streaks. Grade II, approximately 15-25% of the intimal surface was covered by lesions, mostly "fatty streak" in type. Grade III, about 30-65% of the intimal surface was covered by lesions. More than 75% of the lesions were uncomplicated fibrous plaques. (Most of the remaining lesions were fatty streaks.) Grade IV, approximately 65-90%o of the intimal surface was covered by lesions. The vast majority of these lesions were fibrous
Milwaukee, Wis.) while being gently stirred. After 20 h, the pH of the solution was adjusted to 8.0 with 0.1 N NaOH, and 5 mg of Pronase E (70,000 p.u.k/g) (Kaken Biochemical Co., Tokyo, Japan) and 10 mg of Ca(Ac)2 were added. The second proteolytic digestion was carried out at 45°C for 20 h. The digest was then centrifuged at 12,000 rpm and 4°C for 20 min and the residue was washed with 5 ml of distilled water (to recover any GAGs occluded in the insoluble material), centrifuged, dried, and weighed. The supernatant and wash solutions were pooled and lyophilized. Portions (1-20 gl) of the resulting freezedried hydrolyzate, redissolved in 2 ml of water, were employed for the two-dimensional electrophoretic analyses. The results were corrected for the volume of the digest itself.
Identification of the arterial GAGs Electrophoretic analysis. The two-dimensional electrophoretic technique of Hata and Nagai (21, 22) was em-
The Arterial Glycosaminoglycans in Atherosclerosis
471
csc CSA
KS
`SB HP
j CSB
HA
HS
CS(
HP
x
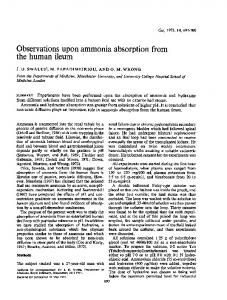
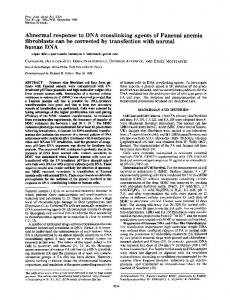
FIGURE 1 Two-dimensional electrophoresis of seven standard GAGs on cellulose acetate. A solution containing CSA, CSB, CSC, HA, HP, HS, and KS was applied at the point indicated by the x. The position of the positive electrode is indicated by the plus. On the first guide strip HA, CSB, and HP (horizontal, at the top of the plate) and on the second two guide strips CSC, CSB, and HP were each applied (vertical, on both sides of the plate). The seven separated glycosaminoglycans are indicated by their abbreviations.
ployed for the partial identification of the acid mucopolysaccharides of the human intima and media. The following is a brief description of this method. A cellulose acetate sheet' (15 X 15 cm, Sepraphore III, Gelman Instrument Co., Ann Arbor, Mich.) was first wetted in 30%o methanol for 24 h and then equilibrated overnight in 0.1 M pyridine containing 0.46 M formic acid (pH 3.1). Subsequently, the sheet was placed on a glass plate (20 X 20 cm) and lightly blotted with Whatman no. 1 filter paper to remove excess buffer. The sheet was never allowed to dry completely. A portion of the proteolytic digest was next applied to the origin (a point 1 cm from the cathode side and 2 cm from the bottom of the sheet) with a 10-Al Hamilton syringe (model 701, Hamilton Co., Reno, Nev.). Indigo carmine (5 Al of a 0.1 % aqueous solution) used as a tracking dye and 3 ,ul of the first standard GAG solution (1 jg of each of CSB, HA, and HP/2 ul of water) were applied at a point 1 cm from the cathode side and 1 cm from the top of the sheet (Fig. 1). After attachment of two electrical bridges, which consisted of triple-folded Whatman no. 1 paper (17 x 17 cm), previously soaked in the mentioned pyridine-formate buffer, the electrophoresis was performed at 185 V for 80 min (electrophoresis cabinet 20, Arthur H. Thomas Co., Philadelphia, Pa.). The cellulose acetate sheet was then removed from the electrophoresis cabinet and allowed to dry partially in the open air at room temperature for 5 min to remove all pyridine. The strip that contained the separated standard GAGs was cut from the sheet, stained 'This size was chosen so that relatively large volumes (20 ul) of the hydrolyzate could be applied without affecting the separation of the GAGs.
472
in alcian blue, and later used for the identification of the arterial GAGs resolved in the first direction of the electrophoresis. The remaining portion of the cellulose acetate sheet was next wetted with the second solvent, 0.1 M Ba(Ac)2, by a wick, and after application of the second standard GAG solution (1 ,tg of each of CSB, CSC, and HP/2 Al of water) to the point of origin, the electrophoresis in the direction perpendicular to the first one was performed at 100 V for 6 h (Fig. 1). The cellulose acetate sheet was then stained for GAGs with alcian blue (20 min), destained with 0.1% acetic acid (20 min), and further washed with water. To ensure complete staining of the GAGs present in relatively high concentrations, 1% alcian blue in 0.1% acetic acid was employed routinely. The tentative identification of the aortic GAGs was made by comparing their electrophoretic mobilities with those of the standards. Chromatographic analysis. For the partial purification of the intimal GAGs, a Pronase-papain digest (1 g) of several pooled grades III and IV atherosclerotic intimas was dialyzed at 5°C for 5 days against water to remove the bulk of the formed amino acids, peptides, glycopetides, and salt, and then chromatographed on a DEAE-Sephadex A-25 (Pharmacia Fine Chemicals Inc., Piscataway, N. J.) column previously equilibrated to pH 7.0. Each fraction (8 ml) was dialyzed against water for 5 days, freeze-dried, redissolved in 0.5 ml of water, and analyzed by the twodimensional electrophoresis technique.
Enzymatic analysis Chondroitinases ABC and AC. The further identification of intimal chondroitin sulfates was made according to the method of Saito et al. (23), employing chondroitinases ABC and AC. Fractions from the mentioned DEAE-Sephadex column that contained chondroitin sulfates (50-100 ,tg) were dissolved in 40 jul of water and, after the addition of 5 ul, pH 8.0, stock Tris buffer (3 mg of Tris, 2.4 g of NaAc, and 50 mg of bovine serum albumin in 100 ml of 0.13 N HCl), incubated at 37'C for 4 h with either 0.1 U chondroitinase ABC or 0.3 U chondroitinase AC. Paper chromatography (17 h, n-butanol: acetic acid: 1 N ammonia, 2: 3: 1) was used for the identification of the digestion products. Two-dimensional electrophoretic analysis of the chondroitinase hydrolyzate was employed for the quantitation of any undigested GAGs. Heparinase. A crude heparinase preparation known to hydrolyze HP and HS was used for the identification of arterial HS. HS (150 Ag) isolated by the DEAE-Sephadex clhromatography was incubated with 50 ,ul of this enzyme in 12 ,l of pH 6.0, 1.0 M NaAc and 38 ul of water at 37°C for 48 h. The hydrolyzate was then analyzed by the twodimensional electrophoresis. Leech hyaluronidase. For the complete identification of arterial HA, 200 ug of the fraction from the DEAESephadex chromatography that contained this GAG was dissolved in 0.1 ml of pH 7.2 buffer (8 g NaCl, 0.2 g KCI, 1.15 g Na2HPO4, and 0.2 g KH2PO4/liter) and incubated at 37'C for 5 h with 8 pg of leech hyaluronidase. The hydrolyzate was then analyzed by the two-dimensional electrophoresis. Bovine testicular hyaluronidase. For the additional identification of CSB in both the relatively normal (grade I) and the complicated fibrous plaque (grade IV) intima, bovine testicular hyaluronidase (H-2251, Sigma Chemical Co., St. Louis, Mo.) was employed. These two intimal specimens (approximately 100 mg dry, defatted tissue) were hydrolyzed with papain and Pronase as described above.
R. L. Stevens, M. Colombo, J. J. Gonzales, W. Hollander, and K. Schmid
The resulting digests (2.0 ml each), of which small samples were first analyzed by two-dimensional electrophoresis, were adjusted to pH 5.2 with 1 Al of glacial acetic acid, and 0.5 ml of each of the hydrolyzates was then incubated with 0.2 mg of bovine testicular hyaluronidase (GAG:enzyme ratio of 2: 1) at 37°C for 48 h. The hyaluronidase digests were analyzed by two-dimensional electrophoresis, and the amounts and types of the undigested GAGs were determined to assess the extent of the digestion of CSB, CSC, and HA by bovine hyaluronidase.
Quantitation of the GAGs. The arterial GAGs were quantitated by the two-dimensional electrophoresis technique of Hata and Nagai (22). After separation of the GAGs and staining of the cellulose acetate sheet as mentioned above, each spot was cut from the sheet (along with a blank of the same size) and the bound dye was eluted by soaking overnight in 1 ml of a 5%o solution of cetylpyridinium chloride (J. T. Baker Chemical Co., Phillipsburg, N. J.). To extract the dye bound to arterial HA completely, 5%o
cetylpyridinium chloride in 10 mN HCI (pH 1.8) and sub-
sequent incubation in a boiling water bath for 15 min were found necessary. The amounts of each GAG were found by measuring the absorbances of the resulting solutions at 615 nm and comparing them with the appropriate standard curves. For the standard curves, highly purified GAGs' were used. Each standard GAG (1 mg) was dissolved in 4.0 ml of water, and portions (2-20 4l) were applied to the cellulose strip. After the two-dimensional electrophoresis, the stained areas were cut out, the dye was eluted and the absorbance was measured at 615 nm. The resulting absorbances were then plotted against the amount of the
applied GAG. The content of each GAG was expressed in milligrams GAG per gram of dry, defatted, decalcified tissue. The residues obtained after proteolytic digestion of the aortic tissues, whose ash contents consisted primarily of calcium phosphate (25), were subtracted from the initial dry, defatted weight of the tissues to obtain the decalcified dry weights. These insoluble residues averaged 5, 10, 25, and 40%o of the dry, defatted weight of the intimas of grade I, II, III, and IV, respectively. After their decalcification with EDTA (16, 26), these residues contained less than 3% of the total GAG content of the tissue.
Recovery of standard GAGs The recovery of each GAG was determined as follows. A standard GAG (0.1 mg) was added directly to a dry, defatted intima and hydrolyzed with papain and Pronase as described above. After analysis by two-dimensional electrophoresis, the recovery of this standard was calculated from the difference between the total and the original content of the particular GAG of the sample analyzed. As a control, the standard GAGs were also incubated with papain and Pronase (enzyme: substrate ratio 1: 4, 600C, 4 h), and the uronic acid content of the dialyzable fraction was measured to determine the effect of these two enzymes
'The standard GAGs provided by Dr. M. B. Mathews were isolated from the following starting materials: CSC and HA from human umbilical cord, CSA from notochord of the rock sturgeon, CSB and HP from hog mucosa, HS from beef lung, and KS from bovine cornea. The analytical constants of each standard GAG were provided by Dr. Mathews. Desulfated CSA, used as CH, was also obtained
from Dr. Mathews.
on the GAGs. Moreover, to assess the reproducibility of the technique, the following series of analyses were carried out in duplicate. Two separate samples of the same intima or media (Table II) were coded differently by the individual who prepared these specimens and then given to another person who subsequently analyzed these tissues for their GAGs.
Carbohydrate analysis Portions of the three GAG fractions, prepared by DEAESephadex chromatography, were purified by the method of Schiller et al. (27). They were then hydrolyzed in sealed evacuated tubes with 4 N HCl for 6 h, dried with a rotary evaporator, and redissolved in 1.0 ml of water. The hexosamine content was determined with the aid of an autoanalyzer (JEOL Analytical Instruments, Cranford, N. J., model 6AH) with pH 4.25, 0.2 M sodium citrate buffer, or by gas-liquid chromatography (Hewlett-Packard Co., Palo Alto, Calif., model 402) after reduction and acetylation (28). Uronic acids were determined by the procedure of Roden and co-workers (29). The partially separated GAG fractions were hydrolyzed with 2 M trifluoroacetic acid at 100°C for 4 h. The hydrolyzates were then analyzed by paper chromatography with ethylacetate-acetic acid-water (3: 1: 1).
RESULTS
The two-dimensional electrophoretic separation of standard GAGs The seven standard GAGs (CSA, CSB, CSC, HA, HP, HS, and KS) resolved into seven spots on cellulose acetate by two-dimensional electrophoresis (Fig. 1). This separation was similar to that described by Hata and Nagai (21). The three GAGs of each of the two standard mixtures (HA, CSB, and HP; CSB, CSC, and HP) used as references in the two electrophoretic directions were well resolved from each other.
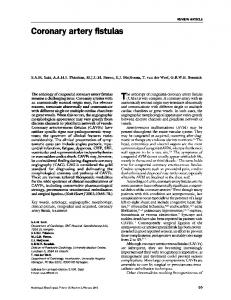
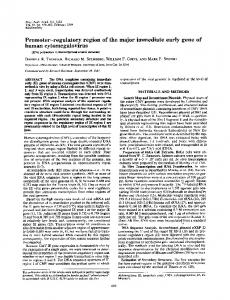
Identification of arterial GAGs Electrophoretic analysis. The two-dimensional electrophoresis of a proteolytic digest of a grade I intima revealed the presence of four GAGs that had mobilities essentially identical to those of HA or chondroitin, CSB, CSC, and HS (Fig. 2A). The predominant GAG was CSC. Because of the limitations of this technique, minute amounts of the other GAGs, such as CH (5) and HP(30) could not be detected. The amino acids, peptides, and glycopeptides present in the proteolytic digest, detectable with ninhydrin if the cellulose acetate plate was not washed, migrated in both electrophoretic directions but at much lower rates than the GAGs and thus did not interfere with the electrophoretic separation of the latter. Moreover, it should be noted that no alcian blue-staining material remained at the point of application. The identities of these GAGs were further substantiated by the addition of standard GAGs (CSA, CSB, CSC, CH, HA, HP, HS, and KS) to the proteolytic digest, followed by electrophoretic analysis.
The Arterial Glycosaminoglycans in Atherosclerosis
473
When standard CSB, CSC, and HA were added, the amount of bound dye on the cellulose acetate plate containing the intimal CSB, CSC, and HA, respectively, increased corresponding to the amount of standard GAG added. The addition of standard HS derived from beef lung resulted in a relatively broad HS spot because of i,ts slightly higher electrophoretic mobility in the first direction. This difference in mobility was expected because of the known lower sulfate content of the aortic HS as compared with that of lung HS (31). Standard CSA resulted in a spot located between CSB and CSC, while KS and HP each resulted in spots where no intimal GAG was observed. Hyaluronic acid and CH could not be distinguished from each other. The electrophoretic analysis of the GAGs of a grade IV intima (Fig. 2B) also revealed four components; however, CSB was now equally as noticeable as CSC. In two specimens the level of HS was so low in concentration that it could not be detected. The GAGs of grade II and III intimas afforded patterns intermediate between those of grades I and IV intimas. The GAGs of grade I, II, III, and IV medias gave patterns with four spots each, which appeared very similar to each other and to that of a grade I intima (for quantitative differences, see below. Additional experiments pertaining to the identification of the arterial GAGs were carried out with bovine testicular hyaluronidase to obtain further evidence
for the presence of CSB in the atherosclerotic intima and media both of grades I and IV. As expected, HA and CSC were completely hydrolyzed, whereas CSB was only partially digested, to the extent of approximately 40%, as judged by the amount of alcian bluestaining material observed on two-dimensional electrophoretic analysis of the enzymatic digest. The only GAG found to be completely resistant to this enzyme was HS. The obtained data represent additional evidence for the presence in the intima and media of CSB, CSC, HA, and HS (for analyses with more specific enzymes, see below).
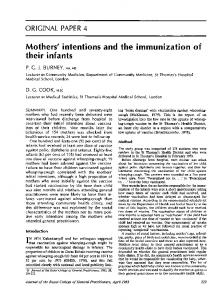
Chromatographic, enzymatic, and chemical analyses. Chromatography of the GAGs of a proteolytic digest of pooled grades III and IV intimas on a DEAESephadex column yielded three fractions (Fig. 3), whose weights were 0.3, 3.5, and 27.4 mg. As judged by two-dimensional electrophoretic analyses, the first fraction contained HA, and any CH, the second HS, and the third both CSB and CSC. This separation agrees with that reported by Schmidt (32). However, a partial separation between CSB and CSC was noted, a finding essential for the final identification of CSB. Fraction 1 (0.3 mg) was completely digested with bovine testicular hyaluronidase, and more important, because of its high specificity for HA, with leech hyaluronidase (33). From the lack of a spot in the CH-HA area on two-dimensional electrophoretic analysis of the
TABLE II
Duplicate GAG Analyses of Human Arterial Intimas and Medias Specimen and atherosclerotic involvement
GAGlycan4 Age of patient
Analysis*
HA
a b a b a b a b a b
1.3 1.5 0.8 0.9 0.9 0.9
76
Intima 2, grade II
49
Intima 3, grade II
35
Intima 4, grade III
87
Intima 5, grade IV
65
Media 1, grade II
49
Media 2, grade II
49
CSB
C6S
Total
19.2 18.5 12.7 13.3 16.2 15.3 12.2 11.7
29.6 29.1 25.2 25.5 28.3 27.1 20.9 20.3
8.7
17.3 16.3 18.0 28.2 27.4 24.8 24.7
mgfg dry, defatted tissue
yr
Intima 1, grade II
HS
1.5 1.4
c
1.4 1.2 1.2
a b a b
1.9 1.9 1.5 1.6
4.1 4.3 4.7
5.0 4.8
5.1 5.1 5.0 2.6 2.5 1.3 1.5 1.2 6.9 6.7 5.9 5.5
6.2 6.1 5.9 4.6 4.7 5.9 4.7 5.4 4.5 4.4 3.6 3.7
7.0
8.9 10.2 14.9 14.4
13.8 13.9
* The analyses designated a and b (and c) were carried out on separate portions of the same intima or media. All portions were coded by the person who prepared the tissue, and the analyses were performed at different times. I These analyses deviated from the mean of the value by an average of 3%.
474
R. L. Stevens, M. Colombo, J. J. Gonzales, W. Hollander, and K. Schmid
GRADE IV
GRADE I
HA CSB
HA CSB HP
it
HP
*4
2 nd.
_d
_c5
_0:
C SC
_~csc
0
*
CSB
t4
*
Ba(Ac)2
csc CSB HP
(pH 8.0)
X
x
1
St.
Pyridine Formate (pH 3.2)
B
A
FIGuRE 2 A two-dimensional electrophoretic pattern of the GAGs derived from a grade I or relatively normal intima (A) and that derived from a grade IV atherosclerotic intima (B). The GAGs identified were HA, HS, CSB, and CSC. For further details see Fig. 1 and text.
resulting digests, it could also be concluded that CH is not present in detectable amounts in the artery. This
conclusion is further supported by the finding that fraction 1 contained almost entirely glucosamine (96%) and was found to be resistant to chondroitinase ABC. These data together with those presented above clearly demonstrate that the GAG of fraction 1 is HA and not CH. Fraction 2 (3.1 mg), found to be completely resistant to bovine testicular hyaluronidase and chondroitinase ABC, was hydrolyzed by heparinase. After 17 h of incubation, 80% of this fraction was digested, and after 48 h of incubation, no HS spot could be observed by two-dimensional electrophoresis. On hexosamine analysis fraction 2 was shown to contain only glucosamine. These results demonstrate that the GAG of this fraction is HS. Heparin, which would also be digested with heparinase, was not detected on two-dimensional electrophoretic analysis of the untreated intimal GAG mixture. Fraction 3 was not homogeneous and was shown to consist of two partially overlapping subfractions, namely fractions 3B and 3C, as demonstrated by electrophoretic
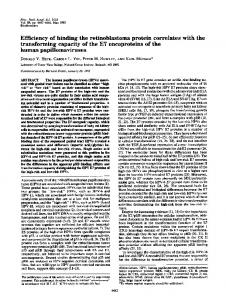
analysis of the GAGs present in the aliquots of the effluent of fraction 3 (Fig. 3). Fractions 3B (5.3 mg) and 3C (8.5 mg), which were free of glucosamine, contained both CSB and CSC but in different ratios, as indicated below. Fraction 3B, which contained approximately 80% CSB and 20% CSC, judging from the mentioned electrophoretic analysis, and which was completely digested with chondroitinase ABC, was hydrolyzed with chondroitinase AC on prolonged incubation, to the extent of approximately 40%, again as determined by the above-described electrophoretic technique. The predominant disaccharide formed was ADi-4S (78%). From chemical analysis the iduronic-to-glucuronic acid ratio of 1.6:1.0 (Fig. 4) was further evidence of a high content of CSB in this fraction. Fraction 3C, which by cellulose acetate electrophoresis was shown to consist of 80% CSC and 20% CSB, was hydrolyzed by chondroitinases ABC and AC to an extent of 100 and 88%, respectively. The predominant disaccharide formed was ADi-6S (79%), the remainder being ADi-4S. The uronic acid of this fraction was found to be primarily
The Arterial Glycosaminoglycans in Atherosclerosis
475
that these GAG values varied on the average 3%, from the mean (Table II) in this series of analyses. The necessity for multiple analyses. The two-dimenII sional * ~~~~~~~~~~~~~~~~~~4.01electrophoretic pattern of the GAGs of a grade I intima (Fig. 2A) revealed considerable differences in ( 1.0g the concentrations of the four GAGs. In the relatively intima, the level of HA is low and that of normal 0 ferring Z A ratio IfCC CSB is almost equal to that of HS and, as indicated 2 cellulose aetate in 0. M 2.0s above, the predominant acid mucopolysaccharide was found to be CSC. The average relative percentage of Frcinto fteitmlgyoaiolcn FIUR 3C each GAG proved to be 4, 17, 16, and 65% for HA, HS, CSB, and CSC, respectively. Because of these differences, and to obtain valid measurements, each speciee eovdit men was analyzed at five different concentrations. Thus, 0.1NHl.Th3lcsmn.0cn 5, 8, 10, 15, and 20 ,A of the intimal or medial hydrolyzate previously dissolved in 2.0 ml of water were acetate plate and analyzed. The gradent700 l of0.1 M al 1n000m f20MNC applied to a cellulose two smaller samples were found to be advantageous 1 g) was ftenia was washed mh10om for the determination of the amounts of CSB and priApi glycosaminoglycans (eappoxiate N Hrc).theain FInG0.0 wr wi eovdit marily CSC. The largest amount was needed especially 0.1pEE-eakseA2. d l wit and subsuen asln MiC mo 3B thre of CSB patacsprtolun The CSCti ,00m 85000 frm) te fflen vlums00o andes 3disainiaed fractio ncude dottooed lineims,e for the quantitation of HA. However, at the latter bypthebrokaen concentration, CSC was overloaded and could not be FIGURE intialidycsarmainonglycns CSB rsetieyThe byswsedlectrohoresismo 3o Fratinaio of, was esabplised, (pratiomfaSCtol cluoseaeaei M aC 0.1 Thvloedsufration sand NaadsbaAcuntl quantitated. ppi-rns pooled b a intimase whic dialyzed digest o fr aetoe Bincluded meslve ando NHITheefluetcolumesnfomg850ato 1,000
co
1,150n to 1,25 ml
S:C
Thepetdsrmingn Srespectively. )ad 3,
3C
the menti-oned dialyzed digest were eluted as indicated by the absorbance at 280 nm. GAGs were measured as micromoles hexosamine in alcian blue, at 615 nm.
glucuronic acid (Fig. 4). It should be noted further that no appreciable amounts (< 5%) of unsulfated or disulfated disaccharides were noticed on paper chromatography.
"1 A
Quantitative analysis of the arterial GAGs
_
^
_
_
*F *vP-
w w
_,
The standard curves. The standard curve of each GAG is characterized by a linear relationship between the concentration and the dye-binding capacity of the macromolecule within the range of 0.5-4.5 Ag of GAG
(Fig. 5). The recovery of the arterial GAGs and duplicate analyses. The average recoveries of the GAGs from the arterial tissue, as described in Methods for CSA, CSB, CSC, HA, and HS, were 95±6%, 88+3%, 95+ 7%, 95±5%, and 90±8%, respectively. The effect of the two used proteolytic enzymes upon the GAGs was determined in independent experiments with the standard GAGs. Papain and Pronase did not hydrolyze CSA, CSB, CSC, HS, HP, or KS, but appeared to have cleaved a small amount (approximately 5%) of HA. Duplicate analyses, as described in Methods, indicated
476
FIGUREI
4 Paper chromatographic analysis of the hydrolysate of the partially separated human arterial CSB (3B) and CSC (3C). The positions of glucuronic and iduronic acids and their lactones are labeled I, II, III, and IV, respectively. As controls, hog mucosal CSB and human umbilical cord CSC hydrolyzed under the same conditions were chromatographed simultaneously.
R. L. Stevens, M. Colombo, J. J. Gonzales, W. Hollander, and K. Schmid
The GAG content of the intimas from patients with progressive atherosclerosis. The analyses of 84 intimas with atherosclerotic involvement of grades I to IV by the two-dimensional electrophoretic technique revealed distinct changes in the concentrations of the intimal GAGs with progression of the disease (Fig. 6). The GAG composition of the relatively normal tissue (grade I) was discussed above. Wi,th increasing severity of atherosclerosis, there was a progressive decrease in the total GAG content. This decrease was associated with decreases in the levels of CSC and HS by 50 and 67%, respectively. HA showed no significant changes during the progression of atherosclerosis. *However, the CSB levels were significantly higher in the grades II, III, and IV intimas than in the corresponding grade I tissue. This GAG showed a striking increase in its relative level by 35% (P < 0.001) from grade I to grade II. With the progression of the disease this value remained essentially constant, so that the levels of CSB and CSC in a grade IV intima were very similar, and thus appeared as two major GAGs on the cellulose acetate plate. It should be noted that, in contrast to earlier reports, all specimens contained significant amounts of CSB. The total GAG content of 32 mg/g of dry, defatted, decalcified tissue (dT) essentially paralleled the course of CSC and decreased at an almost constant rate to approximately half (18 mg) of its original value with increasing involvement of the disease. Because the intimas contained on the average 5% medial tissue, the level of each GAG was recalculated, and the medial contribution was found to account at most for 4%. For example, in grade I (Fig. 6), the total GAG content decreased from 32.2 to 31.4 mg/g dT, the CSC content from 20.7 to 20.1 mg/g dT, and CSB from 5.1 to 4.9 mg/g dT, while the content of HA and HS remained essentially unchanged. The GAG contents of the relatively normal and the adjacent plaque areas of the same intima. While the ages of the arterial specimens rose from grades I to IV (Table I), these GAG changes appear to be due to atherosclerosis. To exclude factors other than atherosclerosis, such as age, which might influence the GAG levels, the following experiments were carried out. Eight intimas (Table III), with their relatively normal areas, separated from the adjacent abnormal areas, were analyzed separately for their GAG compositions. The atherosclerotic involvement of the less severely involved areas corresponded to grades I-II, averaging a grade value of 1.6, and that of the adjacent, more severely involved areas corresponded to grades III-IV, averaging a value of 3.6. As compared to the GAG values of the relatively normal areas, the control for this experiment, the concentrations of the total GAGs, HS, and
0.20H
E
0.15 H
c
40
-: uLJ UJ
z
0.10k
of 0 I,,
0.05 H
1.0
2.0
3.0
4.0
GLYCOSAMINOGLYCAN
50
(,4g)
FIGURE 5 The standard curves (dye-binding capacity) of GAGs. Appropriate aliquots of a solution of each standard glycosaminoglycan were applied to the cellulose acetate plate and, after two-dimensional electrophoresis, the alcian blue-stained GAG spots were eluted, and their absorbance at 615 nm was read.
CSC of the adjacent, diseased tissue were reduced on the average by 22, 56, and 29%, respectively, while the content of CSB increased by 9% (Fig. 7). Hence, these findings agree well with those of the larger series of intimas with different atherosclerotic involvements (Fig. 6) when allowances were made for the aboveindicated intermediate grades of atherosclerosis of the small series of samples (Table III), and suggest that the changes in the GAG levels are primarily due to progression of atherosclerosis and are little affected by age of these specimens. The levels of the GAGs of the media. Quantitative analysis of the medial GAGs (Fig. 6) indicated that the compositions of these macromolecules were similar to that of the relatively normal intima. No significant changes in their composition and concentration with increasing severity of atherosclerosis were observed, with the exception of CSC. The content of CSC showed a significant increase (P < 0.01) from grade I to grade II atherosclerosis, followed by a decrease in the level of this GAG as the severity of the disease increased to grade III (P