68
Australasian Journal of Regional Studies, Vol. 20, No. 1, 2014
THE IMPACT OF MINING EXPENDITURE ON REMOTE COMMUNITIES IN AUSTRALIA: THE RANGER URANIUM MINE AND THE TANAMI GOLD MINE IN THE NORTHERN TERRITORY Boyd Dirk Blackwell CRC for Remote Economic Participation, UNE Business School, University of New England, Armidale, NSW, 2351, Australia. Email:
[email protected]
Brian Dollery UNE Business School and UNE Centre for Local Government, University of New England, Armidale, NSW, 2351, Australia. Email:
[email protected] ABSTRACT: While the recent mining boom has been widely addressed in the literature, to date little effort has been devoted to assessing how the returns from mining spatially affect local and remote communities. Given the paucity of adequate data at the local and remote levels, in this article we adopt a factor share approach and find that mining companies in the Northern Territory provide benefits to local communities through their employment of land, labour and capital which translate into expenditure and essential services for the local economy. Moreover, mining companies assist remote communities to develop a social network with external parties which can assist in building enduring value. KEY WORDS: Mining, revenue, expenditure, remote communities. ACKNOWLEDGEMENTS: This work was supported by the CRC for Remote Economic Participation (CRC REP) and the University of New England; the views expressed herein do not necessarily represent the views of the CRC REP, its participants or the University of New England. The authors are grateful to Fiona Haslam-McKenzie and Murray McGregor for their helpful comments on earlier drafts of this article.
The Impact of Mining Expenditure on Remote Communities in Australia: the Ranger Uranium Mine and the Tanami Gold Mine in the Northern Territory
69
1. INTRODUCTION The recent boom in mining activity in Australia has attracted widespread attention (see, for instance, Langton, 2010; Tonts, 2010; Laurie et al., 2011; Richardson and Denniss, 2011; Sawyer and Gomez, 2012). Some commentators, like Kearns and Lowe (2011), have argued that the mining boom is a ‘good problem’, especially in a time of uncertain international economic growth. Others have focused on the difficulties, such as the Dutch disease and the ‘resource curse’, which the boom has posed for the domestic economy (e.g. Langton, 2010; Tonts, 2010; Corden, 2012). While various commentators have contributed to this debate, an important question revolving around the impact of mining expenditure at the local level - hitherto largely neglected – still requires much greater attention. In a preliminary effort aimed at exploring this problem, this article investigates the following question: How is income derived from mining distributed at the regional and local levels, especially in remote locations? Put differently, we consider whether enduring community value from mining exists for remote communities, and if community value of this kind is indeed present, then how does it manifest itself. Some useful empirical work has already explored this question. For instance, Ivanova and Rolfe (2011) used an input-output model, adjusted for non-resident work forces, to investigate the problem on a sectoral basis in terms of employment as well as direct and indirect income flows. However, Ivanova and Rolfe (2011) focused on regional and local economies and did not consider remote Australia. A significant problem in a remote context flows from data difficulties. For example, data are collected as part of the five-yearly census on the various characteristics of Australian society. However, for the purposes of this article, the data are too aggregated and do not provide sufficient detail at the local level, nor do the data shed sufficient light on remote communities. For instance, the Australian Bureau of Statistics (ABS, 2003) prepared a review of characteristics of urban centres and localities in the Northern Territory (NT) and mining was not specified as a separate statistical category. Moreover, where data may be available at the local level, it is often subject to significant statistical error which renders it too unreliable. For example, the
70
Blackwell and Dollery
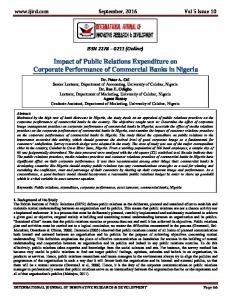
2011 Census carried the following caveat: “[m]edian and average values may be affected by confidentiality in small areas” (ABS, 2012a, p. 1). Consequently primary data collection and case studies, drawing on alternative secondary data sources, represent essential research tools for investigating mine operations in remote Australia. Against this background, the present article uses two case studies from the NT in an attempt to distil the nature of the relationship between mines and remote communities, and it employs factor share analysis to explore the characteristics of mining expenditure. Factor share analysis, which can shed light on the identification of the percentage return of mining income attributable to factors of production (such as land labour and capital), in combination with the case study analysis, can be helpful in determining the spatial spread of returns from mining. The article is divided into three main parts. Section 2 outlines the two cases studies of mines and associated settlements. Section 3 sets out the results of the factor share analysis undertaken for the two case studies. The article ends with some brief concluding remarks in section 4. 2. CASE STUDIES Both case studies are taken from the NT. The first case study site is the Tanami gold mine in central Australia which is owned by Newmont Asia Pacific. The second case study is Energy Resources Australia’s uranium Ranger mine in the northeast of the territory. Both sites are shown in Figure 1.
The Impact of Mining Expenditure on Remote Communities in Australia: the Ranger Uranium Mine and the Tanami Gold Mine in the Northern Territory
ERA Ranger Mine and Jabiru
Newmont Tanami Mine Yuendumu
Figure 1. Location of Tanami and Ranger Mines and Associated Communities, Northern Territory, Australia. Sources: Adaption of Northern Territory Government, 2012a, p. 118 and , accessed 12 December 2012.
71
72
Blackwell and Dollery
Newmont’s Tanami Gold Mine Newmont owns the Tanami gold mine which includes the mining operations of the Granites treatment plant, located about 550 kilometres along the Tanami Highway northwest of Alice Springs, and the Dead Bullock Soak mining operations, about 40 kilometres west of the Granites (Newmont, 2012a). Most mining occurs at the Callie underground mine at Dead Bullock Soak. The Tanami operations produced 221 000 ounces of gold in 2011 and as at 31 December 2011 it had an estimated 2.5 million ounces of gold reserves (Newmont, 2012a, p. 29). In comparison Newmont’s larger (but lower grade ore) reserves at Kalgoorlie (50% Newmont-owned) and Boddington in Western Australia hold 3.1 million and 19.5 million ounces respectively (Newmont, 2012a, p. 36). At this extraction rate and level of reserves ceteris paribus, the economic life of the Tanami operation is estimated to last until 2023. In July 2011, the Board of Directors approved the construction of a shaft to raise extraction rates and “support underground expansion at the Callie and Auron ore bodies” which will “enhance productivity and facilitate possible additional mine expansion” (Newmont, 2012a, p. 29). The capital cost of the project was $450 million (Newmont, 2012b), with gold production expected to increase by 60 000 to 90 000 ounces per year from 2015 until 2020 (Newmont, 2012a, p. 29), equating to an estimated gross margin of between $90 and $360 million (AUD). Royalties, Taxes and Fee Arrangements The Tanami mining operation is on Aboriginal Freehold Land (Newmont, 2012c; Northern Territory Government, 2009) held by the Warlpiri people. A consolidated agreement between the two parties provides for conditions on the use of the land and a royalty payment through the Central Land Council (CLC) from Newmont directly to an Aboriginal corporation (Dodson et al., 2008). CLC royalties are 2.5 percent of sales revenue (K Eglington, 2012, Pers. Comm., 24 August and 5 September). The payments are held in the Warlpiri Education and Training Trust (WETT) and exceed $1.2m annually, ‘but vary by production’ levels ‘and price’ (Dodson et al., 2008, p. 119). In addition, royalties are paid indirectly to Aboriginal people:
The Impact of Mining Expenditure on Remote Communities in Australia: the Ranger Uranium Mine and the Tanami Gold Mine in the Northern Territory
73
“When a mining lease is granted over Aboriginal land, the mining company pays royalties on... ...the minerals extracted from the land to the Northern Territory Government and/or the Australian Government. The Australian Government then pays an amount of money equivalent to these royalties from consolidated revenue into the Aboriginal Benefits Account [ABA]. This money is called ‘mining royalty equivalents’.” (Dodson et al., 2008, p. 119)
According to Dodson et al. (2008), the ABA disperses these equivalents in three ways. First, 30 percent is paid to traditional owners and other Aboriginal people living in areas affected by mining (i.e. the Warlpiri). Secondly, a payment is made as funding for land councils as determined by the Commonwealth Minister for Families, Housing, Community Services and Indigenous Affairs on a performance basis and in the context of land council budgets. The remaining funds are directed at the discretion of the Minister for the benefit of Aboriginal people in the NT. In addition to royalties paid to the Warlpiri, Newmont is required to pay royalties to the NT Government. Royalties in the NT are levied using an accounting profit-based approach (Guj, 2012) and are levied at approximately 20 percent of “the net value of saleable mineral commodity” over $50 000 (s. 10, Mineral Royalty Act 1982 (NT)). Because of commercial confidentiality laws (s. 50, Mineral Royalty Act 1982 (NT)), the NT Government is unable to report the absolute value of royalties paid by individual companies. However, Blackwell (2012) was able to estimate these indirectly from secondary sources. For commercial confidentiality reasons, NT Government royalties are presented in percentage terms in the present context. Newmont is required to pay the NT Government to maintain an exploration licence over the lands in the Tanami, as set out in the Tanami Exploration Agreement Ratification Act 2004 (NT). Newmont also falls under legislative provisions of the following tax provisions: the minerals resource rent, carbon, and corporation taxes of the Commonwealth, as well as other NT standard taxes, charges and fees, such as payroll tax on salaries and wages, stamp duty on the conveyance of property and insurance, registration fees for vehicles, tenant rental and license fees. Together with royalties, these taxes and fees go
74
Blackwell and Dollery
into consolidated revenue and they are not hypothecated to specific communities (G Parsons, 2012, pers. comm., 9 May). Adjacent Community The largest Warlpiri settlement nearest the Tanami operation is at Yuendumu, as depicted in Figure 1. The population of Yuendumu was estimated to be 686 in 2011 with 86 percent Yapa (local Aboriginal) and 14 percent Kardiya (non-Aboriginal) (ABS, 2012a). Musharbash (2010, p. 25) states that because Yuendumu was established as a government ration station rather than a mission, most of its institutions and organisations are independent of the land council, “meaning that many are more dynamic than their counterparts elsewhere”. By way of example, Yuendumu has one of Australia’s largest Aboriginal art centres (Newmont, 2012d) run by the Warlukurlangu Artists Aboriginal Corporation. It also has a vibrant women’s network (WordPress, 2010) and youth development program (Warlpiri Youth Development Aboriginal Corporation, 2012). It produced a number of Order of Australia medallists, including, Peggy Nampijimpa Brown, Johnny Japangardi Miller, and Andrew Stojanovski (Australian Government, 2012), and leading Australian Football League Players, such as Liam Jurrah. Finally, it has been the subject of well-known films, books and other media attention, such as Bush Mechanics (2001). However, the settlement has not been without its problems. For instance, it has recently been plagued by an interfamily feud. The local people believe the feud has been prolonged by ‘white man’s law’, which have rendered it unable to be quickly resolved through traditional methods of Mala Mala – a spear through the leg for the offending person (Coggan, 2012). Benefits of Tanami Mine The immediate benefits of the mine reside in employment, the construction of much needed local infrastructure, and agreements which provide support for the well-being of Aboriginal and Torres Strait Islander (ATSI) people. In terms of employment, there were 92 ATSI employed in 2008 with Newmont’s Tanami operation (Newmont 2008, p. 31), excluding short term contractors, amongst a total ‘fly-in fly-out’ workforce of 928, including contractors (Newmont, 2008, p. 29). As depicted in Table 1, in 2012,
The Impact of Mining Expenditure on Remote Communities in Australia: the Ranger Uranium Mine and the Tanami Gold Mine in the Northern Territory
75
Newmont Asia Pacific (2012, p. 27) reported 69 ATSI at Newmont’s Tanami mine, a decline in the workforce of around one quarter. The reason for this decline is not known. Included in the recent employment are two Warlpiri employed as rangers to monitor the biodiversity impacts near the mine (Newmont, 2012d). Table 1. ATSI Employment at Newmont’s Tanami Mine and ERA’s Ranger Mine, 2011. Employment type Staff Contractors Apprentices (including school) Total
Total number
ATSI number
ATSI Percentage
Tanami
Ranger
Tanami
Ranger
Tanami
Ranger
547 549 na
582 48 21
92
6%
na
99 12 19
na
17% 25% 90%
1,086
651
92
130
6%
20%
Source and Notes: Manipulation of data from Newmont Asia Pacific, (2012), pp. 18, 27; ERA, (2012), pp. 40. na = not available from reports.
The people of the Tanami and Warlpiri region have also benefited from the mine’s operation through improvements to key infrastructure, either provided directly by the mine or as a result of increased support from the NT Government following increased local economic activity. In 2012, the Newmont-owned Granites airstrip was sealed and upgraded to an all-weather facility enabling jet aircraft to fly directly to the mine from major airports. The upgrade’s capital cost was $5.1 million, financed wholly by Newmont (J Riley, 2012, pers. comm., 24 July). The airstrip is used predominantly by Newmont, its contractors and the Royal Flying Doctor Service, which provides essential emergency services not only to the mine, but also to tourists and surrounding stations and communities (J Riley, 2012, pers. comm., 24 July). On occasion, the strip is used by the CLC (J Riley, 2012, pers. comm., 24 July). The Tanami road, which runs from 20km north of Alice Springs to Halls Creek in Western Australia - a total of 1 050km (Bradtke, 2012) - has also
76
Blackwell and Dollery
been upgraded at various times and it is regularly maintained at a combined cost of several million dollars annually from various levels of government (Department of Infrastructure and Transport, 2010; Main Roads Western Australia, n.d.; NT Government, 2012b; Vivian, 2012). The road traverses a long distance through a great variation of terrain and conditions; in the tropical wet season it is typically impassable. However, road upgrades have improved road transport for Newmont as well as for other road users (Bradtke, 2012). An economic impact study (Cummings Economics, 2009; 2011) prepared for the Shire of Halls Creek makes a case to the Western Australian and Territory Governments for sealing the remaining sections of the ‘track’ from Halls Creek to Yuendumu to a standard... “...suitable for a major inter-regional transport link that will substantially cut costs of living and doing business in the Kimberley Region, provide improved access for Kimberley products to southern markets, and further consolidate Alice Springs’ role as a major transport and servicing hub in the centre of Australia” (Vivian, 2012).
The capital cost of the project is estimated at $304 million with total benefits around $800 million, providing a benefit cost ratio of 2.4 using a discount rate of 4% and a 30 year period (Cummings Economics, 2011, p. 5). Regional and remote communities, such as Yuendumu, would benefit from reduced transport times and risks and improved access to services, markets and people. Newmont is also a signatory to the Tanami Regional Partnership Agreement (RPA), along with the Commonwealth and Territory Governments, the Central Land Council (on behalf of the communities of Yuendumu, and Lajamanu and Kalkarindji to the north), the Central Desert Shire (encapsulating Yuendumu) and Victoria Daly Shire (to the North East in the Territory) (Indigenous Studies Program, 2011). The RPA is designed to “share responsibility for achieving measurable and sustainable improvements for ATSI people, with a particular focus on employment and business development” (Newmont, 2008, p. 73). For example, under the RPA, the Commonwealth and NT Governments have contributed half a million dollars (AUD) (Indigenous Studies Program, 2011), while Newmont invested about $230 000 in cash and $150 000 in-kind (Newmont, 2008, p. 73-75).
The Impact of Mining Expenditure on Remote Communities in Australia: the Ranger Uranium Mine and the Tanami Gold Mine in the Northern Territory
77
ERA’s Ranger Uranium Mine The Ranger mine in the Northern Territory is owned by Energy Resources of Australia Limited (ERA) being “one of the world’s major uranium producers” (ERA, 2012a, p. 4). In 2011, the mine was one of three in the world to have produced - across three decades - in excess of 100 000 tonnes of uranium oxide (ERA, 2012b, p. 3). ERA is almost 70% owned by RioTinto, with the remainder of shares publicly listed on the Australian Stock Exchange (ERA, 2012c). Uranium mining in the tropical NT is susceptible to extreme rainfall which occurred at the Ranger mine in the 2010/2011 wet season, with 2 247 mm falling in 2011 (ERA, 2012b, p. 28), requiring three and a half gigalitres of water to be treated and pumped from the highest grade Pit 3 (ERA, 2012b). As a result, production was halted for almost six months (ERA, 2012d; Fitzgerald, 2012) to ensure that the tailings dam operated within its environmental control limits (ERA, 2012b). The resultant lower production was partially offset by drawing on stockpiles for milling and innovative truck haulage, with ERA incurring a loss of $154 million for 2011 (ERA 2012b). By the end of the second quarter of 2012, production had returned to 632 tonnes of uranium (ERA, 2012d, p. 1). In August 2011, while Pit 3 of the Ranger mine approached the end of its life, ERA approved the construction of a $120 million exploration decline “to conduct close spaced underground exploration drilling and to explore areas adjacent to the Ranger 3 Deeps resource” (ERA, 2012e). The Ranger 3 Deep contains an estimated 34 000 tonnes of uranium oxide, representing one of the world’s most significant recent discoveries of uranium (ERA, 2012e). With this new discovery of resources and given current extraction rates (ERA, 2013, pp. 1, 14-16) ceteris paribus, the life of Ranger and Jabiluka may well last until 2049. In March 2012, ERA announced that construction of the boxcut and decline for the project was won by Macmahon Holdings Ltd (ERA, 2012f) and, in June of 2012, ERA announced a $58 million prefeasibility study into the project (Fitzgerald, 2012).
78
Blackwell and Dollery
Royalties, Taxes and Fees In common with Newmont, ERA is required to pay royalties, taxes and fees to various government agencies. However, the management of royalties on energy is different from royalties on mineral resources. ERA is required to pay four and a quarter percent of net sales to the Commonwealth Government which in turn is paid to Aboriginal organisations, together with a quarter percent to the NT Government (ERA, 2012b, p. 46). The percentage of revenue paid as royalties by ERA is considered in more detail in the third section of this article. Adjacent Community The Ranger Project Area, Jabiluka lease to the adjacent North, and the town of Jabiru are located on Aboriginal land of the Mirarr people. As depicted in Figure 1, Jabiru lies 260 kilometres east of Darwin, and Gunbalanya, the next closest Aboriginal settlement of the Manjoringunjg people, is in West Arnhem Land, 60 km north-east of Jabiru (ERA, 2012a, p. 4). The population of Jabiru was 1 128 in 2011, 19 percent of whom were ATSI (ABS, 2012b). The Mirarr clan is small, consisting of 26 adult people (GAC, 2012a). On their website, run by the Gundjeihmi Aboriginal Corporation (GAC), the Mirarr are explicitly opposed to uranium mining on their land. Indeed, Mirrar leaders extended sympathy to the Japanese victims (GAC, 2012b) of the 2011 Fukushima No. 1 plant nuclear disaster caused by a tsunami. Ongoing concern is eloquently portrayed in the following comments: In 1977, Aboriginal opposition to the Ranger Uranium proposal was overridden with the words “their opposition shall not be allowed to prevail”. Bininj (Aboriginal) people were told that the rest of Australia wanted uranium mining in the Alligator Rivers Region, within what would become Kakadu National Park. Almost three decades later, the voices of Mirarr continue to be ignored or marginalised by the mining industry and all levels of government (GAC, 2012b). “Bininj culture really strong. You have to look after country. For your grandfather country, like mother country, take care.” Yvonne Margarula, Mirarr Senior Traditional Owner (from GAC, 2012b).
The Impact of Mining Expenditure on Remote Communities in Australia: the Ranger Uranium Mine and the Tanami Gold Mine in the Northern Territory
79
Construction of the town of Jabiru commenced in 1978 and was completed in 1982 by the Jabiru Town Development Authority (JTDA) under s. 15(1)(a) of the Jabiru Town Development Act 1978 (NT) to house the community living at Jabiru East near the Ranger mine eight kilometres away (Spiers 2000). ERA and the Commonwealth and Territory Governments committed funds to the authority to build the town (Knight, 2008). Jabiru is owned by the Director of National Parks (2007), which draws a head lease held by the JTDA which subleases it to private businesses, government agencies and ERA under s. 15(1)(b) of the Act. Jabiru houses the head offices of the West Arnhem Shire, being formed as part of the NT local government amalgamations undertaken in 2008 (West Arnhem Shire, 2011). In addition to mining, other industries important to the town are tourism as well as Aboriginal arts and crafts, with the Kakadu National Park being a centrepiece for both (Director of National Parks, 2007). Services in Jabiru include a town plaza with standard facilities consisting of a post office, supermarket, cafe, news agent, bank, medical centre, as well as all three emergency services, government departments, Northern Land Council offices, and Magistrate’s Court (Explore Australia, 2010). The town has a shire library and radio station (West Arnhem Shire, 2011). Jabiru also has its own Olympic-size swimming pool, town lake, barramundi fishing, sports and social club, cricket and Australian Football League ovals (Explore Australia, 2010), the Jabiru Bushratz Rugby Union Football Club (2009), and the nine hole Jabiru Golf Club (2008). This greater range and quality of services relative to what is provided in Yuendumu is reflective of a less remote location and a higher resident mining population, the latter evidenced by comparative census statistics (ABS, 2008a; b; 2012c; 2013). However, in addition to halting uranium mining, the wet season of the Tropics can also damage and even sever the main Arnhem and Kakadu highways for several weeks at a time (DSEWPaC, 2012), cutting-off services that rely on these highways. This is in stark contrast to that of an arid climate in the Tanami dessert where settlements are considerably distant from the mine and access to services is more difficult.
80
Blackwell and Dollery
Benefits of the Mine In common with Newmont’s Tanami mine, the ERA mine offers the benefits of both employment and much needed infrastructure, as well as a broader ‘spend’ in the Northern Territory economy. There are also a series of agreements through which ERA supports ATSI well-being. With respect to employment, shown in Table 1, ERA derives 20 percent of its employees from ATSIs, making ERA a leading ATSI employer in the Territory (ERA, 2012b, p. 40). ERA has strong ATSI representation in its contractors and even more so for its apprentices. The number of ATSI people employed from Jabiru and Gunbalanya is yet to be determined, but according to Scambary (2009, p. 173) it is “low”. In addition to employment benefits, ERA has been instrumental in funding key infrastructure projects in the region. Infrastructure is seen as vital to driving economic activity and enduring value from the resource boom, as highlighted by KPMG (2011) in its report on the state of infrastructure in Australia. Examples of ERA supported infrastructure include 70 percent of the original construction costs of the town of Jabiru (ERA, 2012b, p. 46) and the Ranger diesel power station which - in addition to running the mine powers the town of Jabiru and Parks Australia’s headquarters (ERA, 2012b). ERA also built the Jabiru airport which is located on the Ranger Project Area and is the main air transport service for the mine, tourism, agriculture, business, emergency services and local communities (ERA, 2012b). Security, access, fencing, parking, lighting and a buffer zone were upgraded by ERA in 2011 (ERA, 2012b). ERA Ranger uses the airport for ‘fly-in fly-out’ workers and ‘third parties’, as well as emergency evacuations (ERA, 2012b, p. 15). In addition to direct support through infrastructure projects, ERA also spends money in the local and regional economy, which provides income and jobs for both local and regional people. For example, ACIL Tasman (2009, p. 21) estimated the direct economic impact of ERA’s operations in the Northern Territory in 2008 at $230 million in payments to land, labour and capital. This “gross product at factor cost” represents 1.6 percent of factor payments for the Northern Territory. ACIL Tasman (2009, p. 21) noted that “this is a very large contribution by a single industrial operation...larger than for many entire Northern Territory Industries”, including beef cattle, horticulture, fishing, wholesale trade, cultural and recreational services and electricity, gas and water supply. Including ‘flow-on’, indirect impacts (0.6
The Impact of Mining Expenditure on Remote Communities in Australia: the Ranger Uranium Mine and the Tanami Gold Mine in the Northern Territory
81
percent), through salaries and wage payments and purchases of goods and services, and capital expenditure impacts (0.6 percent), ERA contributed 2.8 percent or $400 million to the NT economy (ACIL Tasman, 2009, p. 22). Along analogous lines to the consolidated agreements of the Warlpiri, ERA, the Northern Land Council and GAC are intending to consolidate their various agreements, as part of an improved and ongoing relationship (GAC, 2012c; ERA, 2012b). In particular, “the Mirarr have been able to invest in very worthwhile projects such as the Djidbidjidbi Residential College and the youth centre with income derived from the mining royalty equivalents” (GAC, 2012c, p. 2). The college is located in Jabiru and provides Aboriginal children from surrounding areas an opportunity to gain an education. ERA has also made a number of strategic operational decisions, such as not proceeding with the Heap Leach Facility, designed to process low grade stock piles of uranium ore, based upon the concerns of the Mirarr (ERA, 2012b). In addition to royalty equivalents, ERA provides support to those communities local to Ranger through partnerships, in-kind support, and donations of equipment and resources (ERA, 2012g). ERA’s partnerships (ERA 2012h) with the local Aboriginal people total $437 000 (ERA, 2012b, p. 44). Six salient examples include: a) The Building Our Local Talent (BOLT) education and training strategy in partnership with the NT Department of Education and Training and West Arnhem College to progress ATSI youth to the workplace with $75 000 provided as college awards (ERA, 2012b, p. 41). b) The Territory Teams Partnership which provides support for professional level football and netball athletes, particularly Aboriginal athletes with one million dollars to support the Territory Thunder Football Team and the Storm Netball Team. c) A $25 000 George Chaloupka Fellowship in conjunction with the NT Museum and Art Gallery to support research and conservation of Aboriginal rock art in the Arnhem Land Plateau region.
82
Blackwell and Dollery
d) Major sponsorship of the Territory Indigenous Music Awards, the National Indigenous Music Awards, the Mahbill Festival in Jabiru, and the Stone Festival in Gunbalayna (Explore Australia, 2010). e) A Community Partnership Fund which develops “meaningful partnerships with local business and communities, demonstrate a value-add to the local community, or enhance sustainable, educational and employment opportunities for the community” (ERA, 2012g). f) Contributions to the Queensland Premier’s Flood Relief Appeal (ERA, 2012b). 3. FACTOR SHARE ANALYSIS Further insights into the benefits of mines can be gleaned from analysing the returns to factors of production such as land, land and capital. Factor share analysis dates back to the work of Kaldor (1956), Kuznets (1959) and even Smith (1904 [1776]). More recently, Blackwell and Dollery (2013) have analysed the factor shares of the two case study locations outlined in the current article, as well as Newmont Consolidated, using company reports, which they compared to industry averages in Australia and abroad. We summarise and reinterpret their results here and in addition draw comparison with data from the United Nations (2011) 2010 National Accounts Statistics: Main Aggregates and Detailed Tables. Comparison is made with the United States using the UN data because we first compare the Tanami operation to the consolidated position of its parent US based company, Newmont. A more detailed discussion of factor share analysis and how it was conducted for the case studies is provided in Blackwell and Dollery (2013). The results of Blackwell and Dollery (2013) for returns to land, labour, capital and finance (‘money’) are summarised in Table 2.
The Impact of Mining Expenditure on Remote Communities in Australia: the Ranger Uranium Mine and the Tanami Gold Mine in the Northern Territory
83
Table 2. Factor Share Analysis Factor Land Labour Capital Money Total b
Newmont Consolidated 2011 7% 36%a 50% 6% 100%
Tanami operation 2011 8% 27% 61% 3% 100%
ERA Ranger 2010 c 6% 37% 46% 11% 100%
Source and Notes: Summary of results from Blackwell and Dollery, (2013). a. Estimated result based on United States and ERA averages. b. Rounding errors exist. c. Ranger is ERA’s only substantial operation.
Comparison of the Tanami operation (column 3 in Table 2) with Newmont (column 2) and ERA’s Ranger mine (column 4) yields interesting findings: (a) Land’s share is a percentage point or two (i.e. up to 25 percent) greater than that of the two comparators. (b) The labour share at 27 percent is considerably smaller than ERA’s 37 percent or the assumed Newmont Consolidated share. (c) Capital takes on a larger proportion (61 percent) with materials and consumables taking the lion’s share (35 percent of capital share). (d) Profits (return on ‘money’ contributed to the business) for the Tanami operation has a lower share than ERA and Newmont Consolidated but this finding may reflect current conditions of production levels, quality of the ore and metal prices. Blackwell and Dollery (2013) further analysed the components of each factor of production. Table 3 provides a summary of the comparison of subfactor shares for land. There are four key findings: (a) Newmont’s consolidated income tax sub-factor share of 93 percent is substantially higher than the other two entities.
84
Blackwell and Dollery
(b) Income tax for the Tanami operation is higher at 39 percent than ERA’s 32 percent. (c) Royalties paid by ERA to Aboriginal organisations are 52 percent and substantially higher than for the Tanami operation, whereas royalties paid to the Northern Territory Government by the Tanami operation are 26 percent, higher than those paid by ERA at 16 percent. These differences reflect the different royalty arrangements for minerals versus energy resources in Australia as outlined in the second section of this article. (d) Finally, the Tanami operation spends around five percent of the total land factor share on community relations, whereas no distinction is made by the other comparators. Examples of these community relations activities were discussed earlier. The observed differences in Tables 3 and 4 may well relate to variations in geographical location (Tanami is more remote), the nature of the mineralisation and richness of ore bodies (both rich but two different types of mineral), and extraction difficulties. The percentages shown may have very little to do with the competence of Newmont’s or ERA’s management. However, employment and royalty through returns on land do provide an implicit indication of the likely impacts, if any, on local ATSI and development.
The Impact of Mining Expenditure on Remote Communities in Australia: the Ranger Uranium Mine and the Tanami Gold Mine in the Northern Territory
85
Table 3. Land Sub Factor Share Analysis Sub factor Mining tax and other Income tax Royalties, ATSI orgs Royalties for NT govt Community relations Total
Newmont Consolidated 2011
Tanami operation 2011
ERA Ranger 2010
39% 30%
32% 52%
26%
16%
7% 93%
5% 100%
100%
100%
Source: Summary of results from Blackwell and Dollery, (2013).
Table 4 provides a comparison of industry employee compensation shares for 2008 and 1992 in Australia and the United States of America (USA) using data from the United Nations (2011) 2010 National Accounts Statistics: Main Aggregates and Detailed Tables. Gollin (2002) has argued that an adjustment should be made to employee compensation shares in Table 4 to include self-employed people. In Australia, the adjustments suggested by Gollin (2002) for 1992 had a mean increment of 37 percent, whereas in the American case, the mean increment was 20 percent, a difference between the two countries of 17 percent. When these are taken into account, employee compensation shares of the total economy are higher in the US in both years, although labour shares in Australia, with the self-employed included, become approximately 10% higher in Australia compared to the American economy. Labour shares for ‘mining and quarrying’, ‘manufacturing’, ‘construction’, ‘transport, storage and communication’, and ‘public administration and defence’ become equivalent or higher in 1992. In 2008, most employee compensation shares are similar except for ‘mining and quarrying’, ‘construction’, ‘transport, storage and communications’ which are higher in the US. However, assuming Gollin’s (2002) adjustments apply also in 2008, these exceptions
86
Blackwell and Dollery
no longer exist and all labour shares in Australia are higher than those in America. Table 4. Employee Compensation Shares, Australia and United States. Industry Agriculture, hunting, forestry; fishing Mining and quarrying Manufacturing Electricity, gas and water supply Construction Wholesale retail trade, repair of motor vehicles, motorcycles, etc.; hotels and restaurants Transport, storage and communications Financial intermediation; real estate, renting and business activities Public administration and defence; compulsory social security Education; health and social work; other community, social and personal services Total Economy
2008 Australia 26% 20% 58% 36% 56% 67%
USA 25% 27% 59% 32% 69% 71%
1992 Australia 25% 29% 57% 40% 52% 66%
USA 26% 42% 70% 33% 69% 72%
43%
58%
48%
62%
46%
43%
43%
40%
81%
84%
79%
86%
83%
82%
82%
83%
54%
61%
55%
63%
Source and Notes: The employee compensation shares were calculated using basic prices data from the United Nations (2011, pp. 129-135) = employee compensation / (employee compensation + operating surplus + consumption of fixed capital).
An additional salient comparison is the change in employee compensation shares between 1992 and 2008 for each country. ‘Mining and quarrying’ in Australia is the notable industry which substantially reduced its absolute share by 9 percent with a relative reduction of 31 percent. Other industries in Australia have remained very similar, in common with the whole economy. A similar finding exists for the US, except for ‘mining and quarrying’ and ‘manufacturing’ which have declined absolutely over the period by 15 percent and 11 percent respectively.
The Impact of Mining Expenditure on Remote Communities in Australia: the Ranger Uranium Mine and the Tanami Gold Mine in the Northern Territory
87
Possible reasons for the differences in percentages between Australia and the US would centre on the structures of these economies, their different labour markets and the evolution of their respective industrial relation regimes. Other factors that would play a part include social, political, and environmental differences. With regard to labour shares, miners work in a highly competitive global market place. Table 4 also provides some key findings for comparison of employee compensation shares between Australian industries in 2008. The share for ‘mining and quarrying’ was 20 percent and slightly higher when accounting for the self-employed through Gollin’s (2002) adjustment. Reservation should be made in interpreting the adjusted labour shares which include the self employed because these resulted in some industries having shares greater than 100 percent. It is important to stress that ‘mining and quarrying’ has the lowest labour share across all industries and it is well below that for the entire Australian economy, reflecting the capital intensive nature of the industry. Furthermore, construction, an industry often tied to mining, has a higher labour share at 56 percent, closer to the Australian median. The combined industries of ‘mining and quarrying’ and ‘construction’ produce a labour share of 38 percent. Table 4 shows that the employee compensation share in 2008 for ‘mining and quarrying’ is amongst the lowest compared to all other Australian industries. For example, ‘education, health, social work’ and related services, 83 percent; ‘public administration, defence and compulsory social security’, 81 percent; ‘wholesale retail trade, repair of motor vehicles, motorcycles, etc. and hotels and restaurants’, 67 percent; and ‘manufacturing’, 58 percent. By contrast, in the US in 2008 mining is only two percent ahead of agriculture in providing a return to employees whereas all other industries have higher shares. At least two caveats apply to the analysis in this article. In the first place, land tenure in the NT is different to all other Australian states. This means inter alia ownership rights are biased more in favour of communities as compared with individuals and business entities (see, for instance, Stanley, 2010). Secondly, our factor share analysis is conducted at the company level. It thus cannot account for the royalty equivalents regime which operates in the NT, unlike other Australian states. Under royalty equivalents, the
88
Blackwell and Dollery
Australian Government pays Aboriginal people an equal and additional royalty to that paid by the company to the NT government (s.64 Aboriginal Land Rights Act 1978 (NT)). 4. CONCLUSIONS Various conclusions can be drawn from this analysis. In the first place, the labour share in mining is different from other industries and higher in the remote case studies considered in this article. This is not surprising. Given the reluctance of urban-based mine workers to take up employment in remote areas, the difference could be explained as a wage ‘premium’ of sufficient magnitude to induce these workers to take up jobs on a ‘fly-in fly-out’ basis by compensating them for the hardship involved. Secondly, labour represents only a single, albeit important element in factor share analysis and in the case of remote Australia other important elements are present, especially land and the rights to mining. Thirdly, it must be stressed that factor share analysis only captures the ‘first round’ impact of the distribution of mining outlays and not the ‘second round’ or multiplier effects. Fourthly, factor share analysis, together with the ongoing remote multiplier impact of mining expenditure, does not embrace numerous other positive attributes of mining in remote communities, such as human capital development on the part of ATSI workers through ‘on-the-job’ training. It thus seems clear from the analysis conducted in this article that significant enduring value to remote communities does flow from mining operations. What are the implications of our preliminary investigation for public policy makers? At least three policy inferences can be drawn. Firstly, at present policy makers at Commonwealth and state levels focus largely on the income from land use through royalties, resource taxes and the like, as well as jobs (especially ATSI employment programs). However, as we have seen from the case studies, mining provides a wide range of enduring value components to remote communities which are mutually beneficial to these communities, including key essential services, such as capital investment in power, transport, communication, and emergency services. Secondly, in our case studies we identified a raft of additional supportive mechanisms, including agreements with remote communities and community outreach activities, which (although small relative to overall mine expenditure), nonetheless help to build lasting networks with remote communities. These benefits can
The Impact of Mining Expenditure on Remote Communities in Australia: the Ranger Uranium Mine and the Tanami Gold Mine in the Northern Territory
89
extend far beyond the life of the particular mining operation in question. Finally, the net revenue accruing to Commonwealth and state governments from mining activity in remote Australia can be fruitfully employed as a readily justifiable tool for spatially redistributing government expenditure away from metropolitan areas towards regional and remote communities. Whereas this type of redistributive fiscal policy is perhaps best exemplified in the Western Australian Royalties for Regions initiative, it could form the basis for further programs along the same lines. A number of questions remain unanswered and are worthy of future research effort. First, how do factor shares and the community benefits provided by mines compare more broadly across other remote locations for mining and other industries in the Northern Territory and Australia as a whole? We have only analysed two case studies in this paper. However, would a larger sample size provide different or similar results? Second, how can factor share methods incorporate the broader interactions between industries? This would provide a more comprehensive analysis of factor contributions and a better tool for analysing policy responses for remote Australia. Third, what measures in addition to economic disbursement are important to measuring the durability of community benefits from mining? We have argued that relationships and networks established through mining’s interaction with communities and other groups can provide enduring value beyond the life of the mine, even where expenditures on developing these are relatively small. However, a need exists for further investigation to determine how the benefits from these relationships can be better valued and incorporated into factor share analysis for the development of remote economies and improved economic participation by remote people. In this regard, the role of entrepreneurship would be a good starting point. Fourthly, factor shares for land incorporate taxes and royalties, but how do these proportions compare for all taxes, fees and charges paid by mining companies and the total revenue collected by government? Research into this important question could yield at least some quantitative measures of the contribution of remote mining to the public purse. Finally, a thorough understanding of the economic impact of mining on remote communities requires accurate and detailed data at the local level in remote communities, which is not presently available. There is thus an urgent need for researchers
90
Blackwell and Dollery
to gather information of this kind through survey data drawn directly from respondents in remote communities.
The Impact of Mining Expenditure on Remote Communities in Australia: the Ranger Uranium Mine and the Tanami Gold Mine in the Northern Territory
91
REFERENCES ACIL Tasman (2009). Economic Impact Study: Economic Impact Study of ERA’s Operations in the Northern Territory, Report prepared for Energy Resources Australia, December, ACIL Tasman, Melbourne. Australian Bureau of Statistics (ABS) (2003). 2001 Census of Population and Housing: Selected Characteristics for Urban Centres and Localities: Northern Territory. Catalogue No. 2016.7, ABS, Canberra. Australian Bureau of Statistics (ABS) (2008a). 2006 Census Community Profile Series: Yuendumu (CGC) (Statistical Local Area), ABS, Canberra. Australian Bureau of Statistics (ABS) (2008b). 2006 Census Community Profile Series, Time Series Profile: Jabiru (T) (Statistical Local Area), Cat No. 2003.0, ABS, Canberra. Australian Bureau of Statistics (ABS) (2012a). 2011 census of population and housing: Yuendumu, SSC (State Statistical Suburb) 70215, ABS, Canberra. Australian Bureau of Statistics (ABS) (2012b). Census of population and housing: Jabiru SSC (State Statistical Suburb) 70091, ABS, Canberra. Australian Bureau of Statistics (ABS) (2012c) 2011 Census of Population and Housing - Community Profile Time Series, West Arnhem (S) Jabiru (710154663). 13.4 sq Kms, Based on Place of Enumeration, Cat No. 2003.0, ABS, Canberra. Australian Bureau of Statistics (ABS). (2013). 2011 Census Community Profiles, Basic Community Profile, Yuendumu (SSC70215), ABS, Canberra. Australian Government (2012). It’s an Honour: Australia Celebrating Australians, Australian Government, Canberra. Blackwell, B. D. (2012). Enduring community value from mining: tracking and mapping the flow of money from mines, Presentation to the UNE Business School and Australian Agricultural and Resource Economics Society, Armidale, NSW. Blackwell, B. D. and Dollery, B. E. (2013). Income factor shares from mining in remote Australia: An analysis of the Ranger uranium mine
92
Blackwell and Dollery
and the Tanami gold mine in the Northern Territory. Australasian Journal of Regional Studies, 19(3), pp. 369-395. Bradtke, B. (2012). The Tanami desert, Australia. Outback Australia Travel Guide, Birgit Bradtke, Kununurra. Bush Mechanics (2001). Motion Picture, Film Australia National Interest Program in association with Warlpiri Media Association Inc. Produced with the assistance of the ABC, distributed by ABC, Sydney. Coggan, M. (2012). Yuendumu violence overshadows AFL pride. 7.30 Report. Australian Broadcasting Commission, Sydney. Corden, W. M. (2012). The Dutch disease in Australia: policy options for a three-speed economy. Melbourne Institute Working Paper, 5/12, pp. 1–27. Cummings Economics (2009). Economic Impact Study – Upgrading the Tanami Road, December, Report Prepared for the Shire of Halls Creek, Cummings Economics, Cairns. Cummings Economics (2011). Economic Impact Study – Upgrading the Tanami Road. October, Update to 2009 Report Prepared for the Shire of Halls Creek, Cummings Economics, Cairns. Department of Infrastructure and Transport (Cth) (2010). NT Community, Beef and Mining Roads Package – Upgrade to the Tanami Road, Australian Government, Canberra. Department of Sustainability, Environment, Water, Population and Communities (DSEWPaC) (2012). Report on Road and Walking Track Conditions, DSEWPaC, Jabiru. Director of National Parks (2007). Kakadu National Park Management Plan 2007–2014, Director of National Parks Canberra. Dodson, M., Allen, D. and Goodwin, T. (2008). The role of the Central Land Council in Aboriginal land dealings. In Australian Agency for International Development (ed.) Making Land Work, Volume II: Reconciling Customary Ownership and Development, Case Study 6, AusAID Canberra, pp. 107–128. Energy Resources Australia (ERA) (2012a). Building Our Local Talent Strategy (BOLT): Securing Stronger School-To-Work PATHWAYS for Students from West Arnhem, ERA, Darwin. Energy Resources Australia (ERA) (2012b). Annual report 2011, RioTinto, Darwin.
The Impact of Mining Expenditure on Remote Communities in Australia: the Ranger Uranium Mine and the Tanami Gold Mine in the Northern Territory
93
Energy Resources Australia (ERA) (2012c). Business overview. RioTinto, Darwin. Online version accessed 12 July 2012, www.energyres.com.au/whoweare/179_business_overview.asp. Energy Resources Australia (ERA) (2012d). ASX announcement: June 2012 quarter operations review (unaudited), RioTinto, Darwin. Online version accessed 12 July 2012, www.energyres.com.au/documents/20120711_June_2012_Quarter_Op erations_Review.pdf. Energy Resources Australia (ERA) (2012e). Projects. RioTinto, Darwin. Online version accessed 12 July 2012, www.energyres.com.au/whatwedo/2324.asp. Energy Resources Australia (ERA) (2012f). ERA awards major contract to build Ranger 3 Deeps exploration decline. RioTinto, Darwin. Online version accessed 12 July 2012, www.energyres.com.au/media/38_media_releases_2807.asp. Energy Resources Australia (ERA) (2012g). Community Partnership Fund. RioTinto, Darwin. Online version accessed 12 July 2012, www.energyres.com.au/ourapproach/2317_community_partnership_fu nd.asp. Energy Resources Australia (ERA) (2012h). Partnerships. RioTinto, Darwin. Online version accessed 12 July 2012, www.energyres.com.au/ourapproach/2317_partnerships_sponsorships_ and_donations.asp. Energy Resources Australia (ERA) (2013). Annual report 2012, RioTinto, Darwin. Explore Australia (2010). Jabiru. Online version accessed 30 July 2012, www.exploreaustralia.net.au/Northern-Territory/Kakadu-and-ArnhemLand/Jabiru#tab=events. Fitzgerald, B. (2012). Ranger production output better in the dry. The Australian, 12 July, p. 20. Gollin, D. (2002). Getting income shares right. Journal of Political Economy, 110(2), pp. 458–474. Guj, P. (2012). Mineral Royalties and Other Specific Taxes, International Mining for Development Centre, Perth.
94
Blackwell and Dollery
Gundjeihmi Aboriginal Corporation (GAC) (2012a). The Mirarr Gundjeihmi clan. GAC, Jabiru. Online version accessed 25 July 2012, www.mirarr.net/mirarr.html. Gundjeihmi Aboriginal Corporation (GAC) (2012b). Welcome to the Mirarr clan. GAC, Jabiru. Online version accessed 25 July 2012, http://www.mirarr.net/index.html. Gundjeihmi Aboriginal Corporation (GAC) (2012c). ERA and the GAC agree on important water initiatives, Media Statement, 1 March. GAC and ERA, Jabiru. Online version accessed 25 July 2012, www.mirarr.net/media/GAC_ERA%20Media%20Release_Water%20I nitiatives-2012-03-01.pdf. Indigenous Studies Program (2011). Tanami Regional Partnership Agreement (RPA), Melbourne University, Melbourne. Ivanova, G. and Rolfe, J. (2011). Using input-output analysis to estimate the impact of a coal industry expansion on regional and local economies. Impact Assessment and Project Appraisal, 29(4), pp. 277–288. Jabiru Bushratz Rugby Union Football Club (2009). The mighty Jabiru Bushratz RUFC. Online version accessed 31 July 2012, http://www.bushratz.com/History.aspx. Jabiru Golf Club (2008). Jabiru Golf Club: located in the World Heritage Kakadu National Park. Online version accessed 31 July 2012, http://www.jabirugolfclub.com.au/. Kaldor, N. (1956). Alternative theories of distribution. Review of Economic Studies, 23 (February), pp. 3–100. Kearns, J. and Lowe, P. (2011). Australia's prosperous 2000s: housing and the mining boom. In H. Gerard and J. Kearns (Eds.) The Australian economy in the 2000s, RBA Conference Proceedings, 15-16 August, RBA, Sydney, pp. 73–100. Knight, D. R. (2008). Jabiru Town Development Amendment Bill 2008, Northern Territory Second Reading Speeches, Darwin. Online version accessed 30 July 2012, www.austlii.edu.au/au/legis/nt/bill_srs/jtdab2008354/srs.html. KPMG (2011). Australia’s Resources Boom: The Infrastructure Ripple Effect, KPMG, Melbourne. Kuznets, S. (1959). Quantitative aspects of the economic growth of nations: iv. distribution of national income by factor shares. Economic Development and Cultural Change, 7(3), pp. 1–100.
The Impact of Mining Expenditure on Remote Communities in Australia: the Ranger Uranium Mine and the Tanami Gold Mine in the Northern Territory
95
Langton, M. (2010). The resource curse: new outback principalities and the paradox of plenty. Griffith Review, 28(Autumn), pp. (47)-63. Lawrie, M., Tonts, M. and Plummer, P. (2011). Boomtowns, resource dependence and socio-economic well-being. Australian Geographer, 42(2), pp. 139–164. Main Roads Western Australia (n.d.) Tanami Road upgrade, Main Roads Western Australia, Perth. Musharbash, Y. (2010). Yuendumu everyday: contemporary life in remote Aboriginal Australia. Aboriginal Studies Press, Canberra. Newmont (Newmont Mining Corporation) (2008). Beyond the Mine Australia and New Zealand, Newmont Mining Corporation, Subiaco. Newmont (Newmont Mining Corporation). (2012a). The Next 90: 2011 Annual Report and Form 10-K, Newmont, Greenwood Village, Colorado. Newmont (Newmont Mining Corporation) (2012b). Asia Pacific operations, Greenwood Village, Colorado. Online version accessed 9 July 2012, www.newmont.com/asia-pacific. Newmont (Newmont Mining Corporation) (2012c). Tanami, Northern Territory, Greenwood Village, Colorado. Online version accessed 9 July 2012, www.newmont.com/asia-pacific/apac-tanami. Newmont (Newmont Mining Corporation) (2012d). Tanami expansion underway, Greenwood Village, Colorado. Online version accessed 9 July 2012, www.newmont.com/asia-pacific/tanami-australia/newsevents/tanami-expansion-underway. Newmont Asia Pacific (2012). Beyond the Mine 2011, Newmont Mining Corporation, Subiaco. Northern Territory Government (2009). Exploration on Aboriginal Freehold Land: Fact Sheet, NT Government, Darwin. Northern Territory Government (2012a). Northern Territory economy mining and manufacturing. In NT Government (Ed.) NT Budget Papers 2012-13, NT Government, Darwin, pp. 113–130. Northern Territory Government (2012b). Regional highlights – Central Australia. In NT Government (Ed.) NT Budget Papers 2012-13, NT Government, Darwin, pp. 5–7.
96
Blackwell and Dollery
Richardson, D. and Denniss, R. (2011). Mining the Truth: The Rhetoric and Reality of the Commodities Boom, The Australia Institute, Canberra. Sawyer, S. and Gomez, E. T. (2012). The Politics of Resource Extraction: Indigenous Peoples, Multinational Corporations, and the State, Palgrave MacMillian and United Nations Research Institute for Social Development, Houndmills, Bassingstoke, UK. Scambary, B. (2009). Mining agreements, development, aspirations, and livelihoods. In J.C. Altman. and D. Martin (Eds.) Power, Culture, Economy: Indigenous Australians and Mining, ANU EPress, Canberra, pp. 171–201. Smith, A. (1904). An Inquiry Into the Nature and Causes of the Wealth of Nations. First published 1776, Methuen and Co. Ltd, London. Spiers, A. G. (2000). Paper 6: history of land use and resultant environmental change in the Alligator Rivers region. In I. Eliot, M. Saynor, M. Eliot and C. M. Finlayson (Ed.) Assessment and monitoring of coastal change in the Alligator Rivers Region, Northern Australia, Supervising Scientist Report 157, Supervising Scientist, Darwin, pp. 91–107. Stanley, O. (2010). Mining and Aboriginal economic development: expectations unfulfilled. In R. Gerritsen (Ed.) North Australian Political Economy: Issues and Agendas, Charles Darwin University Press, Darwin, pp. 130–141. Tonts, M. (2010). Labour market dynamics in resource dependent regions: an examination of the Western Australian Goldfields. Geographical Research, 48(2), pp. 148–165. United Nations (UN) (2011). National Accounts Statistics: Main Aggregates and Detailed Tables, 2010, Part I, United Nations, New York. Vivian, G. (2012). Halls Creek: Tanami Road upgrade study complete. Kimberley Page, Wednesday 8 February, WordPress, Kimberley, WA. Online version accessed 24 July 2012, www.kimberleypage.com.au/2012/02/halls-creek-tanami-upgradestudy-complete/. Warlpiri Youth Development Aboriginal Corporation (WYDAC). (2012). Mount Theo program, WYDAC, Yuendumu. West Arnhem Shire (2011). Welcome to West Arnhem Shire Council. Online version accessed 30 July 2012, www.exploreaustralia.net.au/NorthernTerritory/Kakadu-and-Arnhem-Land/Jabiru#tab=events.
The Impact of Mining Expenditure on Remote Communities in Australia: the Ranger Uranium Mine and the Tanami Gold Mine in the Northern Territory
97
Wordpress (2010). Yuendumu community directory: Yuendumu Women’s Centre. Online version accessed 4 December 2012, http://yuendumuorgs.wordpress.com/2010/10/29/yuendumu-womenscentre/.