(Seria: âAktualnie problemi sportivnogo prava â. Povil. P. (1999), Sportni federacii. Praven ... Zahariev, Z. (2016), Sbornik normativni dokumenti,. Sofia: NSA ...
University of Niš Faculty of Sport and Physical Education
XXI Scientific Conference „FIS COMMUNICATIONS 2018" in physical education, sport and recreation (Niš, Serbia, october 18‐20, 2018)
Book of Proceedings
Niš, 2018.
Fis Communications 2018
XXI Scientific Conference „FIS COMMUNICATIONS 2018" in physical education, sport and recreation Book of Proceedings
Publisher: Faculty of sport and physical education , University of Niš For the publisher: Faculty dean, prof. Milovan Bratić, PhD Editor in chief: prof. Miodrag Kocić, PhD Printed by: Medivest, Niš Computer editor: Predrag Živanović Cover design: Dragan Radojković Circulation: 200 copies ISBN: 978‐86‐87249‐89‐9
2
International Scientific Conference
COMMITTEES for FIS 2018 HONORARY COMMITTEE Chairman
Members
Milovan Bratić, PhD
University of Niš, Faculty of Sport and Physical Education, Serbia
Saša Jakovljević, Ph.D.
University of Belgrade, Faculty of Sport and Physical Education, Serbia
Dejan Madić, Ph.D.
University of Novi Sad, Faculty of Sport and Physical Education, Serbia
Veroljub Stanković, Ph.D.
University of Priština, Faculty for Sport and Physical Education, Serbia
Lenče Aleksovska‐ Veličkovska, Ph.D.
Ss Cyril and Methodius University, Faculty of Physical Education, Sport, and Health, Macedonia
Penčo Gešev, Ph.D.
National Sports Academy „Vassil Levski", Bulgaria
Đurđica Miletić, Ph.D.
University of Split, Faculty of Kinesiology, Croatia
Tomislav Krističević, Ph.D.
University of Zagreb, Faculty of Kinesiology, Croatia
Milan Žvan, Ph.D.
University of Ljubljana, Faculty of Sport, Slovenia
Safet Kapo, Ph.D.
University of Sarajevo, Faculty of Sport and Physical Education, BiH
Borislav Cicović, Ph.D.
University of East Sarajevo, Faculty of Physical Education and Sport, BiH
Boštjan Šimunič, Ph.D.
University of Primorska, Institute for Kinesiology Research, Slovenia
ORGANIZING COMMITTEE Chairman
Milovan Bratić, PhD
University of Niš, Faculty of Sport and Physical Education, Serbia
Secretary
Nenad Stojiljković, PhD
University of Niš, Faculty of Sport and Physical Education, Serbia
Zvezdan Savić, Ph.D.
University of Niš, Faculty of Sport and Physical Education, Serbia
Tomislav Okičić, Ph.D.
University of Niš, Faculty of Sport and Physical Education, Serbia
Nebojša Randjelović, Ph.D.
University of Niš, Faculty of Sport and Physical Education, Serbia
Petar Mitić, Ph.D.
University of Niš, Faculty of Sport and Physical Education, Serbia
Vladimir Antić, Ph.D.
University of Niš, Faculty of Sport and Physical Education, Serbia
Nemanja Stanković, Ph.D.
University of Niš, Faculty of Sport and Physical Education, Serbia
Mladen Živković, Ph.D.
University of Niš, Faculty of Sport and Physical Education, Serbia
Nikola Stojanović, Ph.D.
University of Niš, Faculty of Sport and Physical Education, Serbia
Bojan Jorgić, Ph.D.
University of Niš, Faculty of Sport and Physical Education, Serbia
Aleksandra Aleksić‐Veljković, Ph.D.
University of Niš, Faculty of Sport and Physical Education, Serbia
Tijana Purenović‐Ivanović, Ph.D.
University of Niš, Faculty of Sport and Physical Education, Serbia
Miloš Paunović
University of Niš, Faculty of Sport and Physical Education, Serbia
Danijela Živković
University of Niš, Faculty of Sport and Physical Education, Serbia
Nikola Milošević
University of Niš, Faculty of Sport and Physical Education, Serbia
Marko Djurović
University of Niš, Faculty of Sport and Physical Education, Serbia
Dušan Nikolić
University of Niš, Faculty of Sport and Physical Education, Serbia
Members
3
Fis Communications 2018
SCIENTIFIC COMMITTEE Chairman
Members
Miodrag Kocić, PhD
University of Niš, Faculty of Sport and Physical Education, Serbia
Dragan Radovanović, Ph.D.
University of Niš, Faculty of Sport and Physical Education, Serbia
Slobodan Jarić, Ph.D.
University of Delaware, Dept. of Health, Nutrition and Exercise Sciences, USA
Rado Pišot, Ph.D.
University of Primorska, Institute for Kinesiology Research, Slovenia
Đurđica Miletić, PhD
University of Split, Faculty of Kinesiology, Croatia
Daniel Daly, PhD
KU Leuven, Faculty of Kinesilogy and Rehabilitation Sciences, Belgium
Marko Aleksandrović, Ph.D.
University of Niš, Faculty of Sport and Physical Education, Serbia
Saša Pantelić, Ph.D.
University of Niš, Faculty of Sport and Physical Education, Serbia
Slavoljub Uzunović, Ph.D.
University of Niš, Faculty of Sport and Physical Education, Serbia
Nicolae Ochiană, PhD
University of Bacău, Faculty of Movement, Sports and Health Sciences, Romania
Branislav Dragić, Ph.D.
University of Niš, Faculty of Sport and Physical Education, Serbia
Irena Valantine, Ph.D.
Lithuanian Sports University, Kaunas, Lithuania
Ratko Stanković, Ph.D.
University of Niš, Faculty of Sport and Physical Education, Serbia
Anita Hökelmann, Ph.D.
University of Magdeburg, Germany
Milivoj Dopsaj, PhD
University of Belgrade, Faculty of Sport and Physical Education, Serbia
Milena Mikalački, PhD
University of Novi Sad, Faculty of Sport and Physical Education, Serbia
Milan Čoh, PhD
University of Ljubljana, Faculty of Sport, Slovenia
Dragana Berić, Ph.D.
University of Niš, Faculty of Sport and Physical Education, Serbia
Daniela Dasheva, PhD
National Sports Academy „Vassil Levski", Bulgaria
Dušan Hamar, PhD
Comenius University, Faculty of Physical Education and Sports, Slovakia
Dragan Nejić, PhD
University of Niš, Faculty of Sport and Physical Education, Serbia
Goran Sporiš, Ph.D.
University of Zagreb, Faculty of Kinesiology, Croatia
Saša Veličković, Ph.D.
University of Niš, Faculty of Sport and Physical Education, Serbia
Georgi Georgiev, PhD
Ss. Cyril and Methodius University, Faculty of Physical Education, Sport, and Health, Macedonia
Zoran Milanović, PhD
University of Niš, Faculty of Sport and Physical Education, Serbia
Nic James, PhD
London Sport Institute, Middlesex University, London, England, United Kingdom
Martin Zvonař, Ph.D.
Masaryk University, Faculty of Sports Studies, Czech Republic
Peter Krustrup, Ph.D.
University of Copenhagen, Denmark
4
International Scientific Conference
FOREWORD
Faculty of Sport and Physical Education University of Nis in its 47 years long tradition organizes a scientific conference “FIS COMMUNICATIONS”. This year we are organizing 21st scientific conference “FIS COMMUNICATIONS 2018”. Our profound years long experience in organizing of the conference has contributed to ever increasing high quality of the conference over years. International scientific conference “FIS COMMUNICATIONS 2018” is organized by the Faculty of sport and Physical Education University of Nis under the auspices of the Ministry of Education, Science and Technological Development of the Republic of Serbia. We are proud to announce the key speakers in our plenary sessions as eminent renowned experts in their field of expertise who are coming from the countries taking part in this conference more then once. This conference can boast submission of 70 full text papers. Upon the review process 60 papers were accepted and approved for the publication. Papers are divided into four sessions depending on the topics investigated as follows: Individual and Team Sports, Physical Education, Interdiciplinary and Poster session. Organizers are satisfied with the participation of already renowned researchers and the young, oncoming authors following the thorny path of the scientific investigation, as well. Also a large number of foreign authors and thematic diversity have widen the horizon of the expert and scientific insights, put some new incentive for the cooperation and expression of the new creative efforts. Enclosed you can find the Proceedings of the International scientific conference “FIS COMMUNICATIONS 2018” incorporating all the papers presented at the scientific conference. We would like to express our gratitude to all the participants, especially to the authors of the papers and we expect that all this conference contributes to enhance and further the development of the scientific and expertise thought in the area of sport, physical education and recreation. Chair of the Scientific Committee Miodrag Kocić, PhD, prof.
5
Fis Communications 2018
6
International Scientific Conference
CONTENTS PLENARY SESION ........................................................................................................ 13 HAMSTRING INJURY PREVENTION AND REHABILITATION ......................................................... 15 Eleftherios Kellis
THE POTENTIAL OF TENSIOMYOGRAPHY TO MEASURE MUSCLE ASYMMETRIES ........... 18 Boštjan Šimunič and Rado Pišot
INDIVIDUAL AND TEAM SPORTS .......................................................................... 19 HANDGRIP DIFFERENCES BETWEEN YOUNG KARATE ATHLETES AND NON‐ATHLETES IN RELATION TO GENDER ............................................................................................................................. 21 Vesna Vuković and Nenad Koropanovski
ANTHROPOMETRY, STRENGTH, ENDURANCE AND FLEXIBILITY CHARACTERISTICS OF ELITE MALE ICE CLIMBERS AND IT’S COMPARISON WITH NON CLIMBING ATHLETES . 28 Siniša Vujić, Katarina Manovski , Thomas Kupper, Dragan Mirkov, Slobodan Totic, Aleksandar Djokovic, Marija Andjelkovic and Nenad Dikic
THE INFLUENCE OF ISOMETRIC MUSCLE FORCE CHARACTERISTICS ON SWIMMING RESULTS ................................................................................................................................................................ 34 Marko Đurović, Stefan Popović, Miloš Nikolić, Péter Szájer, Dejan Madić and Tomislav Okičić
SPECIFIC COORDINATION IN FEMALE RHYTHMIC GYMNASTS OF DIFFERENT COMPETITION PROGRAM .............................................................................................................................. 39 Tijana Purenović‐Ivanović, Dušica Bogdanović, Ružena Popović, Slavoljub Uzunović and Mladen Živković
INFLUENCE OF RELATIVE FORCE ON ALL‐AROUND COMPETITION RESULT WITH GYMNASTS ............................................................................................................................................................ 48 Miloš Paunović, Saša Veličković, Marko Đurović, Tomislav Okičić, Nikola Stojanović and Nikola Milošević
LONGITUDINAL AND TRANSVERSAL COMPARISONS OF MORPHOLOGICAL CHARACTERISTICS AND MOTOR ABILITIES OF TWO GENERATIONS OF COMPETITORS IN ALPINE SKIING.............................................................................................................................................. 52 Blaž Lešnik and Ljubomir Pavlović
THE INFLUENCE OF BODY COMPOSITION AND FLEXIBILITY ON SHOT VELOCITY IN GOALBALL – A PILOT STUDY ....................................................................................................................... 59 Nikola Utvić, Damira Vranešić Hadžimehmetović, Goran Kozomara and Marko Aleksandrović
TREND OF THE RESULTS ON PARALYMPIC GAMES AT SWIMMERS WITH INTELLECTUAL IMPAIRMENT ..................................................................................................................... 64 Miodrag Stanković, Aleksandra Projović , Aleksandar Pejčić, Saša Kostić, Ozgur Dogan and Amel Kapo
CRITERIA FOR SPORT SELECTION OF 11‐12‐YEAR‐OLD CYCLISTS ........................................... 69 Ivan Kolev and Ana Buiuklieva
FREQUENCY AND TYPE OF PENALTIES AWARDED IN COMBATS CONDUCTED BY WORLD TOP JUDOKAS..................................................................................................................................... 74 Nemanja Stanković, Nikola Milošević, Mirsad Nurkić, Vladimir Antić, Veselin Jakovljević and Raquel Escobar‐ Molina 7
Fis Communications 2018
DIFFERENCES IN THE EXPLOSIVE STRENGTH OF LOWER LIMBS DURING THE PERFORMANCE OF BASKETBALL JUMP SHOTS .................................................................................. 78 Marko Radenkovic, Ratko Stankovic, Milan Stojic and Milos Paunovic
RELATION OF POWER, SPEED AND AGILITY IN BASKETBALL PLAYERS BY POSITION ... 84 Dušan Stanković and Мария Цанкова‐Калоянова
DIFFERENCES IN SPEED AND AGILITY OF YOUNG FOOTBALL PLAYERS AFTER THE SAQ EXPERIMENTAL TRAINING PROGRAMME ............................................................................................. 89 Ivana Bojić, Marjan Mihajlović, Miroslav Smajić and Vlatko Nedelkovski
DIFFERENCES IN SPEED AND BODY COMPOSITION OF BASKETBALL PLAYERS DEPENDING ON THEIR POSITION IN THE TEAM ............................................................................... 93 Milan Mitić, Miodrag Kocić , Dragana Berić , Dragan Radovanović and Borče Daskalovski
GENERIC MODEL OF OPTIMAL BODY COMPOSITION PREDICTION OF ELITE MALE VOLLEYBALL ....................................................................................................................................................... 98 Milivoj Dopsaj, Zdravko Aničić ,Stefan Marković, Nikola Majstorović and Goran Nešić
DIFFERENCES IN THE LEVEL OF BASIC AND SPECIFIC MOTOR ABILITIES OF BASKETBALL PLAYERS WITH RESPECT TO THEIR POSITION IN THE TEAM .................... 105 Ćeremidžić Dejan, Ćeremidžić Tatjana, Perović Tijana and Bjelica Bojan
DIFFERENCES IN GROSS MOTOR COORDINATION BETWEEN CHILDREN SPECIALIZING IN SOCCER AND THEIR PEERS ................................................................................................................. 110 Slobodan Andrašić, Danilo Radanović, Marko Gušić, Aleksandra Spasić, Slavko Molnar and Nebojša Trajković
EFFECTS OF DIFFERENT TRAINING PROGRAMS ON THROWING VELOCITY IN HANDBALL‐REVIEW ..................................................................................................................................... 113 Saša Marković and Kristina Marković
JUNIORS VS SENIORS SHOOTING‐ PARAMETERS DIFFERENCES IN REGIONAL LEVEL BASKETBALL PLAYERS ................................................................................................................................ 119 Mladen Mikić, Isidora Vasiljević, Igor Vučković and Marko Stojanović
THE DEVELOPMENT OF EXPLOSIVE STRENGTH OF THE LOWER EXTREMITIES IN VOLLEYBALL PLAYERS ................................................................................................................................ 125 Katarina Nejić, Dragan Nejić, Milan Mitić and Miloš Glišić
RELATIONSHIP OF AGILITY WITH TESTS OF SPECIFIC SPEED IN FOOTBALL .................. 131 Darko Božić, Senad Bajrić, Nikola Ilić and Slobodan Goranović
EFFECT OF TARGET SIZE ON SPEED‐ACCURACY TRADEOFF OF INSTEP KICK ................. 137 Vladimir Mrdaković, Bojan Rakojević, Nemanja Pažin, Radun Vulović, Miloš Ubović, Aleksandar Stanković and Duško Ilić
EFFECTS OF DIFFERENT TRAINING PROGRAMS ON AGILITY PERFORMANCE IN BASKETBALL PLAYERS ................................................................................................................................ 143 Ashrif Nouri M. Abohllala, Dragan Popovic, Natasa Brankovic, Jasna Popovic, Vladimir Savic, Evagelia Boli, Milos Popovic and Radomir Pržulj
INTERDISCIPLINARY ............................................................................................... 153 FORCE‐VELOCITY RELATIONSHIP OF LOWER‐BODY MUSCLES DURING HORIZONTAL JUMPS‐PRELIMINARY RESULTS .............................................................................................................. 155 Danica Janićijević, Amador García‐Ramos, Olivera Knežević, Miloš Petrović and Dragan Mirkov
8
International Scientific Conference
A STYDY OF VOJTA THERAPY EFFECT ON INFANT CHILDREN WITH DEVELOPMENTAL MOTOR DISORDER ......................................................................................................................................... 160 Nesrin Shyukri
AUTONOMY IN SPORT ‐ MYTH OR REALITY, OPPORTUNITY OR ILLUSION ....................... 164 Vasil Dimitrov and Albena Dimitrova
INTERNSHIP AND EMPLOYMENT IN HEALTH‐RELATED PHYSICAL ACTIVITY SECTOR: CURRENT SITUATION IN SERBIA ............................................................................................................ 170 Saša Bubanj, Sanja Mazić and Borislav Obradović
CHARACTERISTIC FEATURES OF SPORTS WRITING ..................................................................... 173 Danica Pirsl, Nebojsa Randjelovic, Danijela Zivkovic and Tea Pirsl
ABUSE OF DOPING SUBSTANCES ‐ KNOWLEDGE AND ATTITUDES OF THE REGISTERED NIŠ SPORTS CLUBS ATHLETES ................................................................................................................. 178 Nebojša Ranđelović, Ljiljana Bjelaković, Danica Piršl, Danijela Živković, Irena Stanišić and Aleksandar Tasić
INFLUENCE OF MUSCULAR STRENGTH ON MILITARY PHYSICAL TASKS IN THE SERBIAN ARMED FORCES ............................................................................................................................................... 184 Daniel Stanković, Ivana Petrović and Ivan Petrović
RELATIONS BETWEEN PHYSICAL ACTIVITY, ANXIETY AND SYMPTOMS OF DEPRESSION ..................................................................................................................................................... 191 Marija Mičić, Natalija Milić, Nenad Stojilković, Milica Mitrović and Petar Mitić
POSSIBILITIES FOR THE DEVELOPMENT OF SOCIAL SKILLS IN STUDENTS THROUGH PHYSICAL EDUCATION AND SPORT ...................................................................................................... 196 Maria Boncheva
EVALUATION OF KNOWLEDGE AND ATTITUDES ON DOPING IN SPORT AMONG STUDENTS.......................................................................................................................................................... 202 Dušan Veličković, Aleksandra Catić‐Đorđević and Romina Herodek
SECULAR TRENDS IN CHILDREN AND ADOLESCENT PHYSICAL ACTIVITY BEHAVIOR: AN ALARM TO INCREASE PHYSICAL ACTIVITY ....................................................................................... 206 Dragan Radovanović and Aleksandar Ignjatović
POSTURAL DISORDERS OF ATHLETES WITH VISUAL IMPAIRMENT .................................... 210 Marko Kostov, Bojan Jorgić, Stefan Đorđević, Dobrica Živković, Saša Milenković , Marina Milenković and Dana Maria Ciocan
RELATIONSHIP OF AEROBIC ABILITIES AND AGILITY WITH MILITARY PHYSICAL TASKS IN THE SERBIAN ARMED FORCES .......................................................................................................... 215 Ivana Petrović, Daniel Stanković and Ivan Petrović
SIMPLE VISUAL REACTION TIME: DIFFERENCES IN RELATION TO GENDER AND LEVEL OF PHYSICAL ACTIVITY IN SERBIAN YOUNG ADULTS – PILOT STUDY ................................. 221 Stefan Marković and Milivoj Dopsaj
THE RELATIONS BETWEEN FITNESS AND BMI AND THE ARTERIAL BLOOD PRESSURE OF ELDERLY MEN FROM AN URBAN ENVIRONMENT................................................................... 228 Saša Pantelić , Zoran Milanović, Milovan Bratić, Anđela Đošić, Aleksandar Ivanovski, Nebojša Čokorilo and Milena Mikalački
THE INFLUENCE OF STRENGHT ON THE SPEED OF NAVIGATING AN INFANTRY TRAINING OBSTACLE COURSE ................................................................................................................. 234 Mihajlo Golubović and Saša Pantelić 9
Fis Communications 2018
THE IMPACT OF THE SCHOOL OF SPORT ON MOTOR ABILITIES OF PRESCHOOL CHILDREN .......................................................................................................................................................... 241 Aleksandra Aleksić Veljković; Katarina Herodek; Mladen Živković and Dejana Nikolić
CONNECTION OF RECREATIONAL PHYSICAL ACTIVITIES AND VITALITY OF THE ELDERLY ............................................................................................................................................................. 246 Benin Murić, Izet Kahrović, Oliver Radenković, Vladan Milić and Omer Špirtović
PHYSIOLOGY OF RECREATIONAL SMALL‐SIDED GAMES: BRIEF REVIEW .......................... 250 Emilija Stojanovic
HOW TO MOTIVATE ELDERS TO ENGAGE IN PHYSICAL ACTIVITY ...................................... 255 Oliver Radenković, Milanka Radenković, Izet Kahrović, Benin Murić, Vladan Milić and Omer Špirtović
PHYSICAL ACTIVITY LEVELS OF THE STUDENTS OF THE UNIVERSITY OF NIŠ ............... 260 Emilija Petković, Branislav Dragić, Ana Lilić and Ana Stanković
AN OVERVIEW OF THE RESEARCH OF PHYSICAL ABILITIES AND PHYSICAL DEVELOPMENT OF ELEMENTARY SCHOOL STUDENTS .............................................................. 268 Jelena Ivanović, Aco Gajević, Ivanka Gajić and Dragan Atanasov
GENERALIZATION OF THE FORCE‐VELOCITY RELATIONSHIP PARAMETERS OBTAINED FROM BOTH THE BENCH‐PRESS THROW AND SQUAT JUMP WITH DIFFERENT TYPES OF LOADS .................................................................................................................................................................. 273 Marko Ćosić, Saša Đurić, Milena Živković, Olivera Knežević and Aleksandar Nedeljković
FOOT STATUS IN THE POPULATION OF STUDENTS OF THE UNIVERSITY OF NIŠ .......... 279 Saša Bubanj, Vladan Petrović, Anastasia Tsismalidou and Parissis Doulgeridis
THE EFFECTS OF A SIX‐MONTH INDIVIDUAL EXERCISE PROGRAM OF A BLIND CHILD – A CASE STUDY .................................................................................................................................................. 283 Stefan Nikodić, Dobrica Živković, Bojan Jorgić, Aleksandra Projović and Marko Aleksandrović
THE EFFECTS OF FOLK DANCE ON THE CHANGES IN COORDINATION PARAMETERS IN STUDENTS AMATEUR DANCERS ............................................................................................................. 288 Slavoljub Uzunović, Viktor Kuslic, Dejan Stosić, Lora Kostić, Vladan Petrović, Jovan Marković and Alen Miletić
FLAT FOOT IN PRESCHOOL CHILDREN: A SYSTEMATIC REVIEW ........................................... 294 Miloš Stamenković
THE POSTURAL STATUS OF FEMALE FIRST LEAGUE BASKETBALL PLAYERS.................. 299 Stefan Đorđević, Mikica Vidojević, Milan Đokić, Marina Milenković and Ratko Stanković
PHYSICAL EDUCATION ........................................................................................... 305 THE IMPACT OF DEVELOPMENTAL GYMNASTICS PROGRAM ОN THE BALANCE OF ТНЕ YOUNGER SCHOOL AGE GIRLS ................................................................................................................. 307 Katarina Herodek, Aleksandra Aleksić Veljković, Saša Veličković and Stefan Janevski
MOTOR ABILITIES OF CHILDREN OF YOUNGER SCHOOL AGE (OVERVIEW) ..................... 313 Miloš Glišić, Nikola Utvić, Miodrag Kocić, Milan Mitić and Katarina Nejić
ATTITUDES OF TEACHERS AND PROFESSORS ABOUT INCLUSION IN PHYSICAL EDUCATION TEACHING ............................................................................................................................... 321 Živorad Marković, Aleksandar Ignjatović, Antonio Antonov and Sandra Milanović
10
International Scientific Conference
THE EFFECTS OF COMPLEX TRAINING ON THE DEVELOPMENT OF MOTOR ABILITIES OF STUDENTS INVOLVED IN SCHOOL SPORT ................................................................................... 327 Stefan Stanojević, Nikola Stojanović, Zvezdan Savić, Anastasia Tsismalidou and Parissis Doulgeridis
DIFFERENCES IN BILATERAL COORDINATION STATUS BETWEEN MALE AND FEMALE STUDENTS WITH INTELLECTUAL DISABILITIES ............................................................................ 336 Marija Stojanovic
EFFECTS OF PHYSICAL EXERCISE WITH PRESCHOOL CHILDREN .......................................... 340 Velibor Srdić, Srboljub Vuković and Osmo Bajrić
DETERMINING THE DIFFERENCE IN THE REPETITIVE POWER OF THE ARM AND SHOULDER GIRTH IN STUDENTS AGED 16‐18 YEARS .................................................................. 346 Ivana Arsić
REPRESENTATION OF LANGUAGE COMPETENCES IN THE EARLY YEARS OF CHILDREN'S EDUCATION PROCESS ....................................................................................................... 351 Vesna Horvatovik
YOGA PRACTICES IN KINDERGARTEN ................................................................................................. 356 Ana Buyuklieva
11
Fis Communications 2018
12
International Scientific Conference
Plenary Sesion
13
Fis Communications 2018
14
International Scientific Conference
HAMSTRING INJURY PREVENTION AND REHABILITATION Eleftherios Kellis1 Laboratory of Neuromechanics, Department of Physical Education and Sport Sciences at Serres, Aristotle University of Thessaloniki, Greece
1
Eleftherios Kellis
UDC 616.001:615.8:796.01
SUMMARY Hamstring injury represents one of the most important injuries in sports that involve explosive actions such as soccer and sprinting. The aim of this presentation is to provide the latest information regarding injury mechanisms and subsequent rehabilitation. Particularly, inter‐ and intra‐muscular variations between the hamstring muscle components appears to play an important role for injury occurrence, prevention and rehabilitation. There is a debate on the best practices for injury prevention; currently, programs that involve eccentric exercise appear particularly effective. Similarly, rehabilitation interventions involving eccentric exercise at longer lengths and trunk stabilization are the only ones that appear particularly effective. Keywords: Sport injury; Return to play; biceps femoris long head; muscle.
INTRODUCTION Hamstring muscle strains are one of the most frequent injuries in sports with a prevalence ranging from 8% to 25% (Opar, Williams, & Shield, 2012; Prior, Guerin, & Grimmer, 2009), depending on injury mechanism and type of sport. More importantly, such injury displays a greater recurrence rate, which is in the range of 30% or greater (Brooks, Fuller, Kemp, & Reddin, 2006; Ekstrand et al., 2012) . The purpose of this presentation is to specifically examine latest research on the architecture and mechanical properties of the hamstrings and their implications for injury and rehabilitation.
Hamstring injury mechanisms: the debate continues Numerous factors have been proposed for causing hamstring injury, ranging from age and muscle morphology to the actual game or weather conditions (Opar et al., 2012). Nevertheless, the mechanisms that lead to injury and the subsequent rehabilitation remain unclear with different and, sometimes, controversial views expressed in the literature (Garrett, Safran, Seaber, Glisson, & Ribbeck, 1987; Herzog, 2017; Liu, Sun, Zhu, & Yu, 2017; Mendiguchia, Alentorn‐Geli, & Brughelli, 2012;
Nikolaou, Macdonald, Glisson, Seaber, & Garrett Jr., 1987; Yu, Liu, & Garrett, 2017b, 2017a). Most of these views are mainly related to the way the hamstrings respond to high loading conditions, such as when they are stretched over a long period of time or they resist forced active lengthening over brief periods of time. In addition, injury risk varies significantly between individual hamstring components (Koulouris & Connell, 2003, 2006; Verrall, Slavotinek, Barnes, Fon, & Spriggins, 2001). This raises questions whether specific movements can lead to injury of specific hamstring muscles; conversely, one may wonder whether specific intervention strategies can be used to prevent specific hamstring muscles from getting injured.
Architecture can explain hamstring injury mechanisms Despite the identified need for managing hamstring injuries, there is not enough information on the fundamental properties of the hamstrings. For example, the implications from the differences in architecture between individual hamstrings are currently not being understood (Kellis, 2018b). Yet, it is clear, that the biceps femoris muscle is by far the most likely muscle to sustain injury compared with the rest hamstrings. Currently, there is enough evidence to suggest that the biceps femoris has different tendon and fascicle properties than the 15
Fis Communications 2018 other hamstrings and this is likely to contribute to its higher susceptibility to injury (Kellis, 2016, 2018a). Evidence indicates that the main mechanism of hamstring muscle injury is excessive lengthening during fast sprint movements or slow dancing movements (Liu et al., 2017; Nikolaou et al., 1987; Yu et al., 2017b). The greater injury episodes for the biceps femoris long head compared with the other muscles may be related to a greater relative lengthening of this muscle, a reduced capacity to withstand high forces at these long lengths and, perhaps, an altered activation pattern (Kellis, 2018a; Kellis, Galanis, Chrysanthou, & Kofotolis, 2016).
Injury prevention Amongst the factors that can be modified and prevent injury, strength and flexibility are the most important ones. Nevertheless, the significance of these factors either independently or in combination with other factors is not fully supported in the literature (Opar et al., 2012; Prior et al., 2009). This places some doubt on the value of strength and flexibility tests for predicting muscle injuries. Nevertheless, it appears evident that athletes which display very high bilateral strength differences or very low H:Q ratios are more likely to get injured. However, there is some evidence that athletes with a selective reduction of strength at longer muscle lengths, shorter fascicles and lower activation of the hamstrings may have a higher risk for injury (Timmins et al., 2016). However, much more evidence is necessary to support such a concept (Schuermans, Van Tiggelen, & Witvrouw, 2017).
Rehabilitation Research studies have identified that eccentric training and progressive agility and trunk exercises may have some advantages over other forms of training for hamstring injury rehabilitation (Heiderscheit, Sherry, Silder, Chumanov, & Thelen, 2010). It becomes clear, however, that restoration of architecture and mechanics represent an important aim of the rehabilitation following hamstring injury (Kellis, 2018b; Kellis et al., 2016). Inclusion of co‐ contraction exercises may assist in better controlling the knee at the terminal phase of sprinting phase (Kellis, 1998) but it is unclear how this can apply to hamstring rehabilitation. Third, the role of tendinous tissue adaptations to hamstring injury and rehabilitation should be clarified (Askling, Tengvar, Tarassova, & Thorstensson, 2014; Brukner & Connell, 2016). Managing chronic pain or fear of pain in those individuals who display recurrent injuries may also be “key” factor for a successful recovery and this should be investigated further. 16
CONCLUSION There has been a major progress in identifying, understanding and treating hamstring injuries. This presentation specifically focused on the architecture and mechanics of hamstrings and their implications for injury and rehabilitation. Due to inter‐ and intra‐ muscular differences in mechanical properties, it becomes evident that hamstrings exercises do not recruit all individual hamstrings in the same way. Similarly, injury prevention and rehabilitation programs, such as eccentric exercises at longer lengths, are designed to restore architecture and mechanical behavior of the muscles to pre‐injury levels.
REFERENCES Askling, C. M., Tengvar, M., Tarassova, O., & Thorstensson, A. (2014). Acute hamstring injuries in Swedish elite sprinters and jumpers: a prospective randomised controlled clinical trial comparing two rehabilitation protocols. British Journal of Sports Medicine, 48, 532–539. Brooks, J. H., Fuller, C. W., Kemp, S. P., & Reddin, D. B. (2006). Incidence, risk, and prevention of hamstring muscle injuries in professional rugby union. American Journal of Sports Medicine, 34, 1297–1306. Brukner, P., & Connell, D. (2016). “Serious thigh muscle strains”: beware the intramuscular tendon which plays an important role in difficult hamstring and quadriceps muscle strains. British Journal of Sports Medicine, 50, 205– 8. Ekstrand, J., Healy, J. C., Walden, M., Lee, J. C., English, B., & Hagglund, M. (2012). Hamstring muscle injuries in professional football: the correlation of MRI findings with return to play. British Journal of Sports Medicine, 46, 112– 117. Garrett, W. E., Safran, M. R., Seaber, A., Glisson, R. R., & Ribbeck, B. M. (1987). Biomechanical comparison of stimulated and nonstimulated muscle pulled to failure. American Journal of Sports Medicine, 15, 448–454. Heiderscheit, B. C., Sherry, M. A., Silder, A., Chumanov, E. S., & Thelen, D. G. (2010). Hamstring strain injuries: recommendations for diagnosis, rehabilitation, and injury prevention. Journal of Orthopaedics and Sports Physical Therapy, 40, 67–81. Herzog, W. (2017). Eccentric vs. concentric muscle contraction: That is the question. Journal of Sport and Health Science, 6, 128–129. Kellis, E. (1998). Quantification of quadriceps and hamstring antagonist activity. Sports Medicine (Auckland, N.Z.), 25, 37–62. Kellis, E. (2016). Biceps femoris and semitendinosus tendon/aponeurosis strain during passive and active (isometric) conditions. Journal of Electromyography and Kinesiology, 26, 111–9. Kellis, E. (2018a). Biceps femoris fascicle length during passive stretching. Journal of Electromyography and Kinesiology, 38, 119–125.
International Scientific Conference Kellis, E. (2018b). Intra‐ and Inter‐Muscular Variations in Hamstring Architecture and Mechanics and Their Implications for Injury: A Narrative Review. Sports Medicine, 48, 2271–2283. Kellis, E., Galanis, N., Chrysanthou, C., & Kofotolis, N. (2016). Use of Ultrasound to Monitor Biceps Femoris Mechanical Adaptations after Injury in a Professional Soccer Player. Journal of Sports Science and Medicine, 15, 75–9. Koulouris, G., & Connell, D. (2003). Evaluation of the hamstring muscle complex following acute injury. Skeletal Radiology, 32, 582–589. Koulouris, G., & Connell, D. (2006). Imaging of hamstring injuries: therapeutic implications. European Radiology, 16, 1478–1487. Liu, Y., Sun, Y., Zhu, W., & Yu, J. (2017, June). Comments to “Mechanism of hamstring muscle strain injury in sprinting” by Yu et al. Journal of Sport and Health Science, pp. 139–140. Mendiguchia, J., Alentorn‐Geli, E., & Brughelli, M. (2012). Hamstring strain injuries: are we heading in the right direction? British Journal of Sports Medicine, 46, 81– 85. Nikolaou, P. K., Macdonald, B. L., Glisson, R. R., Seaber, A. V, & Garrett Jr., W. E. (1987). Biomechanical and histological evaluation of muscle after controlled strain injury. American Journal of Sports Medicine, 15, 9–14.
Opar, D. A., Williams, M. D., & Shield, A. J. (2012). Hamstring strain injuries: factors that lead to injury and re‐injury. Sports Medicine, 42, 209–226. Prior, M., Guerin, M., & Grimmer, K. (2009). An Evidence‐Based Approach to Hamstring Strain Injury: A Systematic Review of the Literature. Sports Health: A Multidisciplinary Approach, 1, 154–164. Schuermans, J., Van Tiggelen, D., & Witvrouw, E. (2017). Prone Hip Extension Muscle Recruitment is Associated with Hamstring Injury Risk in Amateur Soccer. International Journal of Sports Medicine, 38, 696–706. Timmins, R. G., Bourne, M. N., Shield, A. J., Williams, M. D., Lorenzen, C., & Opar, D. A. (2016). Short biceps femoris fascicles and eccentric knee flexor weakness increase the risk of hamstring injury in elite football (soccer): a prospective cohort study. British Journal of Sports Medicine, 50, 1524–1535. Verrall, G. M., Slavotinek, J. P., Barnes, P. G., Fon, G. T., & Spriggins, A. J. (2001). Clinical risk factors for hamstring muscle strain injury: a prospective study with correlation of injury by magnetic resonance imaging. British Journal of Sports Medicine, 35, 435–9; discussion 440. Yu, B., Liu, H., & Garrett, W. E. (2017a). Comment on “The late swing and early stance of sprinting are most hazardous for hamstring injuries” by Liu et al. Journal of Sport and Health Science, 6, 137–138. Yu, B., Liu, H., & Garrett, W. E. (2017b). Mechanism of hamstring muscle strain injury in sprinting. Journal of Sport and Health Science, 6, 130–132.
17
Fis Communications 2018
THE POTENTIAL OF TENSIOMYOGRAPHY TO MEASURE MUSCLE ASYMMETRIES Boštjan Šimunič 1, 2 and Rado Pišot 2 University of Primorska
1 2
Science and Research Centre Koper, Institute for Kinesiology Research Boštjan Šimunič and Rado Pišot
UDC 615.8:611.7:796.012
SUMMARY Skeletal muscle’s intrinsic mechanical contractile properties are of interest in many fields (e.g. sport training, rehabilitation, sport and medical diagnostics, research, ageing). They have been assessed using dynamometer, since its invention back in the 18th century, although there are several issues that diminish the quality of the interpretation of dynamometry results. Slovenia played a marginal role in this quest with tensiomyography (TMG) that measures contractile properties through detection of skeletal muscle belly thickening, vibration and bulk movement during twitch isometric contraction in selective and non‐invasive way. Since the first TMG publication back in 1990 several improvements have emerged with over 110 SCI publications, rising exponentially. Although the TMG method is generally accepted, it rises several important questions: (i) what is the distinction between TMG and dynamometry, as both methods are assessing mechanical contractile properties; (ii) how is the TMG amplitude related to muscle contractile properties; (iii) How is the shape of the TMG curve related to muscle contractile properties; (iv) what is the predictive value of TMG results on sport and health parameters. TMG underwent a series of thorough validation studies to provide enough scientific evidences and become an accepted method in different fields. Even more, the state‐of‐the‐art potential of TMG (or even above it) is its instalment in monitoring sarcopenia, early atrophy dynamics, fatigue/potentiation, and prediction of health events (e.g. injuries). We will present findings from most recent studies on the effects of development, disuse, rehabilitation and ageing on TMG‐derived contractile parameters. Furthermore, we will present the contradictory results obtained in fatigue studies supporting possible sensitivity of TMG parameters to different fatigue modalities. We will also focus on predictive value of muscle asymmetries on injury incidence in sport and occupational health. The most recent basic research activities are focusing on a decomposition of TMG response to three different mechanical responses originating from three muscle phenotypes (slow, fast‐oxidative and fast‐glycolytic). The decomposition is based on different exponential‐shaped mathematical curves, each with three parameters representing variance in physiological parameters of single fibres, summating to a best fit in comparison to original TMG response. We will demonstrate decomposition results (content validity) from various TMG studies: potentiation, fatigue, rehabilitation and atrophy. Our results (so far) confirm the logic of 3‐component linear decomposition of TMG responses in abovementioned studies. And by this it also emphasizes the correctness of TMG approach, to detect muscle belly thickening rather than longitudinal shortening, to study intrinsic skeletal muscle contractile parameters. And this is important to understand that the heterogeneity of a muscle composition plays an important role in whole muscle contractile properties that is not evident from dynamometric assessment, but it is from TMG assessment.
18
International Scientific Conference
Individual and Team Sports
19
Fis Communications 2018
20
International Scientific Conference
HANDGRIP DIFFERENCES BETWEEN YOUNG KARATE ATHLETES AND NON‐ATHLETES IN RELATION TO GENDER Vesna Vuković1 and Nenad Koropanovski2 Faculty of Sport and Physical Education, University of Belgrade
1 2
Academy of Criminalistic and Police Studies in Belgrade Belgrade Vesna Vuković and Nenad Koropanovski
UDC 796.85:613.25
SUMMARY Handgrip is positively established marker for evaluation of body strength in general. Even though several recent studies in combat sports have highlighted the role of handgrip force (HGF) in sports achievement, the impact of training, in particular in karate, on development of the HGF parameters in children before puberty has not been sufficiently explored. Having regard to these issues, the present study aimed to reveal existence of contractile differences in male and female preadolescents i.e. karate athletes and non‐athletes in relation to activity. A total of 219 children (Male n = 125, karate athletes = 73, non‐athletes = 52; Female n = 94, karate athletes = 48, non‐athletes = 46), age from 10 to 13 years, participated in the study. Both hands, dominant and non‐dominant, were tested using the standard handgrip test and the highest value from two trials was used to determine the maximal isometric handgrip force (Fmax) and the maximal rate of force development (RFD). Multivariate analysis of variance (MANOVA) revealed the existence of differences between karate athletes vs. non‐ athletes in male subjects (F=5.07; p0.05). Results has shown that penalties are the important part of the judo match and that they are used, as a tactical tool, in the same way by all high level judokas. As a coaching advice we can recommend to athletes to try to avoid three most frequent rule infringement: being passive, establish a bad kumikata and conducting a false attack. Keywords: rule infringement, tactical preparation, penalty.
INTRODUCTION Judo is a combat sport that emerged from Japan’s traditional martial art jujutsu. Dr Jigoro Kano, the founder of judo, transformed the method that was used for closed combat by samurai warriors, making it more interesting for the civil society. From the beginning, he planned to establish a form of physical education that can be practiced by anyone, regardless of status, age, or any other mean. As a first member of International Olympic Committee from Asia, Kano realized the power of sport movement and shifted his martial arts toward sport by making it safe for all the practitioners and by establishing clear fighting rules (Bratić, Nurkić, Cicović, 2014). Modern judo of the 21st century is combat sport which is characterized by spectacular throwing techniques
74
mixed with brilliant ground fighting sequences. Rules of sport divide competitors by age and weight. The ideal “perfect technique will always win” was abounded and competitors are now given equal chances by including the weight divisions. There are seven weight categories for man and equal number for women. For men there are: under 60kg, form 60kg to 66kg, from 66kg to 73kg, from 73kg to 81kg, from 81kg to 90kg, from 90kg to 100kg and above 100kg. Researchers have shown that there are different factors that influence technical and tactical arrangements during a judo fight. For example expertise (Calmet and Ahmaidi, 2004), competitive outcome (Escobar‐Molina et al., 2014) or weight categories (Courel et al. 2014). Winning athletes have shown to attempt more effective attacks than losing athletes after being penalized (Escobar‐Molina et al., 2014). Consequently, it is
International Scientific Conference recommended that notational analysis in judo should be conducted with consideration for penalties because with the latest rule changes we have higher percentage of penalties during the combat (Franchini, Takito, Calmet, 2013; Calmet et al. 2017). When we investigate penalties we need to take into consideration that there is a gender difference (Franchini et al., 2008) and also a difference between different weight categories, since it is documented that in the heaviest categories higher percentage of penalties was detected (Pujszo, Adam, Kuźmińska, Błach, 2014). Aim of this research is to analyze frequency and type of penalties awarded in combats conducted by world top judokas in the under 90kg category.
METHODS Subjects Sample was consisted of 132 fights from the under 90kg category. Criteria for including the fight in the sample where as follows: Fight was conducted on the one of the major tournaments (Continental Championship, Masters, Grand Slam, and Grand Prix). Fight was conducted in 2018. One of the competitors was the TOP 10 ranked judoka on the IJF’s World ranking
list in the under 90kg (downloaded on 27.08.2018)
category
Procedure All combats were downloaded from Dartfish.tv ‐ platform for viewing and sharing of video materials. International Judo Federation and European Judo Union have their official channels on the platform where one can freely download the videos from the competitions organized by IJF and EJU. Combats where analyzed in Lince software. Lince is digital software for sport performance analysis (Gabín, Camerino, Anguera & Castañer, 2012). Observational instrument was created for the purpose of the study. Following actions were registered: unsuccessful attacks, successful attacks (wazari, ippon), penalties (type: passivity, blocking attitude, stepping out of the contest area, bad kumikata, false attack, and other reasons).
Statistical analysis Percentage was used for presenting the general data about the fights conducted (number of attacks, scores, penalties, etc.). For testing the difference between frequencies of awarded penalties Chi‐square analysis was conducted.
RESULTS Table 1 Total actions conducted Scores 143 (18%)
Unsuccessful attacks 338 (43%)
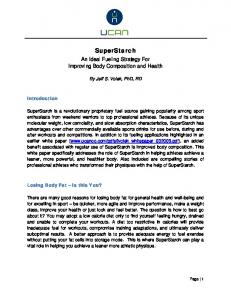
In 132 analyzed combats total of 792 observed parameters were detected. There were 481 attacks and 311 penalties. Attacks included 143 scores and 338 unsuccessful attacks (table 1). Almost half of the fights (63) ended with best possible outcome – Ippon for one of the competitors. 32 fights were decided by scoring the technical point Wazari. There were 37 fights with the most unwanted outcome, finishing with third penalty and Hansoku make (disqualification) for one of the judokas. Neither one direct disqualification was registered. Picture 1 is showing the percentage of decisive points in the analyzed combats. In the picture 2 attacking ratio was presented – percentage of successful and unsuccessful attacks, as well as percentage of Ippon and Wazari scored. From these data we can extract that effectiveness of attacks was 0.3. (Effectiveness of attacks – a
Penalties 311 (39%)
Total 792
proportion of the number of attacks, for which points were granted, to the number of attacks made – Boguszewski, 2014). Large share of the sample were penalties (311). In table 2 you can see number and type of penalties awarded during the fights. Best judokas have enforced 188 penalties to their opponents (1.4 per match), while in the same time receiving 123 (0.9 per match). That means that Top 10 judokas had a tactical advantage during the fight. Most of the penalties was awarded for passivity (non combativity) 49%, followed by mistakes in kumikata ‐ 20% and false attack attempts ‐ 16 %. We used nonparametric Chi‐square test to determine is there a significant difference between frequencies of penalties awarded to Top 10 judokas and their opponents (table 3). We wanted to see is there a difference in tactical approach by comparing the type of penalties awarded.
75
Fis Communications 2018
Picture 1 Decisive points
Table 2 Total number and type of penalties awarded in the analyzed combats Passivity 151 (49%)
Blocking 19 (6%)
Stepping out 15 (5%)
Bad kumikata 63 (20%)
False attack 49 (16%)
Other reasons 14 (4%)
Total 311
Table 3. χ2 Calculations Two‐way Contingency Table Top 10 Opponents
Difference in enforced penalties between top 10 and other judokas Stepping Bad False Other Passivity Block out kumikata attack reasons 86 10 8 40 35 9 65 9 7 23 14 5 151 19 15 63 49 14
188 123 311
χ2 = 4.376, df = 5, χ2/df = 0.88 , P(χ2 > 4.376) = 0.4967 Chi‐square analysis showed that there is no (Top 10) and their opponents, lower ranked significant difference between frequencies of judokas (p>0.05). enforced penalties between world best judokas
76
International Scientific Conference
DISCUSSION General data shows us a big percentage of penalties in the sample (39%), with only 18% of successful attacks that ended with a score for one of the competitors, Little bit more encouraging is the share of decisive points (points that decided the match outcome). 48% of the fights was won by scoring an Ippon, meaning in the best possible way. These results are better compared to results obtained at London Olympic Games where percentage of Ippons was 42.9%, but still slightly worse than results at Beijing Olympics where percentage of Ippons was 51.3% (Nakamura, 2012). With attack effectiveness of 0.3, our results are equal to results obtained by Boguszewski, 2014. It is important to highlight that his sample also included combats of World best judokas. It was made of the final combats of major tournaments held between 2007 and 2010, including gold medal combats from the Beijing Olympic Games, the World Championships in Tokyo (2010) and in Rotterdam (2009), the Grand Slam in Paris (2010), and the World Cups in Warsaw (2007 and 2009). One of the first performance analysis research (Sikorski, Mickiewicz, Majle & Laksa, 1987) state that most important tactical skill is ability to enforce a penalty to your opponent. Judo rules changed significantly afterwards, but the importance of this ability remains. This is confirmed by the fact that winning odds rise with every penalty enforced upon your opponent (Escobar‐Molina et al., 2014). Thus it is logical that judokas use their tactical skills to obtain advantage via penalties. When we compared difference between frequencies of enforced penalties between top 10 and their opponents, we found no significance (p>0.05). These results suggest that World best judokas and lower ranked judokas use same tactical approach to gain advantage via penalties, only elite judokas do it slightly better (they provoke 0.5 more penalties than they receive). They try to be dominant and attack often (most of the penalties are awarded for passivity). By having a dominant position and grip they provoke opponents to make mistakes in kumikata or to make false attack attempts.
CONCLUSION Performance anlysis in judo usually address technical and tactical skills of the judokas. Tactics include offensive, defensive actions, but they also
include prohibited actions that resulted with a penalty for one of the competitors. Results has shown that penalties are the important part of the judo match and that they are used, as a tactical tool, in the same way by all high level judokas. As a coaching advice we can recommend to athletes to try to avoid three most frequent rule infringement: being passive, establish a bad kumikata and conducting a false attack.
REFERENCES Boguszewski, D. (2014). Offensive activity as an element of the evaluation of struggle dynamics of judo contestants. Archives of Budo, 10, 101‐106. Bratić, Nurkić, Cicović (2014). Džudo. Niš: Fakultet sporta i fizičkog vaspitanja. Calmet, M., & Ahmaidi, S. (2004). Survey of advantages obtained by judoka in competition by level of practice. Perceptual and motor skills, 99(1), 284‐290. Calmet, M., Pierantozzi, E., Sterkowicz, S., Challis, B., & Franchini, E. (2017). Rule change and Olympic judo scores, penalties and match duration. International Journal of Performance Analysis in Sport, 17(4), 458‐465. Courel, J., Franchini, E., Femia, P., Stankovic, N., & Escobar‐Molina, R. (2014). Effects of kumi‐kata grip laterality and throwing side on attack effectiveness and combat result in elite judo athletes. International Journal of Performance Analysis in Sport, 14(1), 138‐147. Gabín, B., Camerino, O., Anguera, M.T., Castañer, M. (2012), Lince: multiplatform sport analysis software. Procedia Computer Science Technology, 46, 4692 – 4694. Escobar‐Molina, R., Courel, J., Franchini, E., Femia, P., & Stankovic, N. (2014). The impact of penalties on subsequent attack effectiveness and combat outcome among high elite judo competitors. International Journal of Performance Analysis in Sport, 14(3), 946‐954. Franchini, E., Sterkowicz, S., Meira Jr, C. M., Gomes, F. R. F., & Tani, G. (2008). Technical variation in a sample of high level judo players. Perceptual and Motor Skills, 106(3), 859‐869. Franchini, E., Takito, M. Y., & Calmet, M. (2013). European Judo Championships: impact of the new rule changes on points and penalties. International Journal of Performance Analysis in Sport, 13(2), 474‐479. Nakamura, I. (2012). The monthly magazine of Modern Judo. The Base Ball Magazine. 11, 42‐45. Pujszo, R., Marek, A., & Kuźmińska, A. (2014). The course of the judo fight in the heaviest category (+ 100kg) seen from the perspective of attacks in the standing position, based on the Olympic Games in London 2012. Ido Movement for Culture. Journal of Martial Arts Anthropology, 14(1), 63‐71. Sikorski, W., Mickiewicz, G., Majle, B., & Laksa, C. (1987). Structure of the contest and work capacity of the judoist. In European Judo union proceedings of the international congress on judo “contemporary problems of training and judo contest”, (p. 58–65). Spala, European Judo Union.
77
Fis Communications 2018
DIFFERENCES IN THE EXPLOSIVE STRENGTH OF LOWER LIMBS DURING THE PERFORMANCE OF BASKETBALL JUMP SHOTS Marko Radenkovic1, Ratko Stankovic1, Milan Stojic1 and Milos Paunovic1 1
Faculty of Sport and Physical Education, University of Nis, Serbia
Marko Radenkovic, Ratko Stankovic, Milan Stojic and Milos Paunovic
UDC 796.323:591.473
SUMMARY The aim of this study was to determine the difference in explosive strength of lower limbs during the performance of basketball jump shots by youth basketball players. Participants were 64 basketball players, divided into two groups, experimental with 32 players (age 15.41 ± 0.33), and control with 32 players (age 15.9 ± 0.11). For determining the differences between groups on initial and on final measurement t‐test for independent samples was used. The results showed that on the initial measurement there was a difference between the two variables and that on final measurement, after 10 weeks of the training program, there was the difference in eight variables. Keywords: Vertical jump, Basketball, OptoJump, youth.
INTRODUCTION According to Varghesea & Shelvam (2014), a proper jump shot is the most important technique in a basketball game. For performing an effective jump shot, biomechanical parameters and balance of the body are playing an important role (Millslagle, 2002; Button et al., 2003; Okubo & Hubbard, 2006; Fontanella, 2007; Lam et al., 2009). This is the most known technique (Chen, Lo, Lee, Wang, & Shiang, 2005) as well as the most important and most common one (Hess, 1980; Çetin & Muratl, 2014). There are many factors that can determine the outcome of the jump shot. One of them is certainly the height of the vertical jump. With higher vertical jump it is much easier to release the ball over the defender and it’s harder to block that kind of shot. For performing such a jump, player needs to have a high level of physical fitness (Oudejans, Karamat, & Stolk, 2012; Struzik, Pietraszewski, & Zawadzki, 2014) in other words, high level of lower limbs explosive strength. The lower limbs of the shooter are playing a big role in performing a precise jump shot. They should provide a good balance and need to have a high level of explosive strength (Krause, Meyer, & Meyer, 2008; Chen, Lo, Lee, Wang, & Shiang, 2005). At the movements such as takeoff and landing, during the vertical jump, explosive strength is necessary (Bubanj, Bubanj, Stanković, & Đorđević,
78
2010). Explosive strength allows athletes to accelerate their body, or part of the body to a certain point. In a basketball game, it can be seen all the time because the players are using it in both offense and defense.
METHODS Subjects There were 64 healthy basketball players divided into two groups who participated in the research. One of the groups was experimental with 32 basketball players (age 15.41 ± 0.33), who trained according to a training program for 10 weeks. The second group controlled with 32 basketball players (age 15.9 ± 0.11) who trained according to their coach's program.
Procedure The Initial measurement was done one week before the start of the program and the final measurement was done a week after the end of the program. OptoJupm was used for measuring the variables of explosive strength of lower limbs. The following variables were used to estimate explosive straight: FLT – Flight time of the jump shot (s); HIG – Height of the jump shot (cm); POW – Power of the jump shot (W/kg); FOR – Force of
International Scientific Conference the jump shot (N/kg) and SPE – Speed of the jump shot (cm/s). Each player performs a jump shot from the left and right wing and from a position against the basket. After making three shots player moved to the next position. Those three made shots, form each position, are used for further analysis. Shooting positions were set at distance of five meters (two points) and 6.75 m (three points).
Training Program The program lasted for 10 weeks, three practices a week with one (24h) or two days (48h) for recovery. Duration of each practice was 90 minutes with introductory, preparatory, main and final part of the practice. The program was a combination of plyometric and shooting exercise. The introductory part of the practice had a purpose of preparing the body for the main part with warm‐up exercises. In the preparatory part of practice, the players were introduced to the
training goal of that day. In the main part, players carried out appropriate exercises, planned for that practice. The final part of the training was used for relaxation and recovery of the muscles. The plyometric program had six levels of exercise load intensity, from lower to higher, depending on a week. The shooting part of the program consisted of shooting exercises, tasks and mutual competitions with different levels of difficulties also depending on a week. The level of difficulties was reflected by bringing the exercises into realistic conditions. The training program with exercises and dosing can be found in Radnković, Bubanj, Berić, Stanković, & Stojić, (2018).
Statistical analysis Data for the made shots from each position were used for statistical analysis (three made shots from three positions, from both distance). The difference between groups on initial and on final measurement was determined using the t‐test.
RESULTS Table 1: Descriptive statistic for control (CG) and experimental (EG) group on initial and final measurement INITIAL ID
FLT2p FLT3p HIG2p HIG3p POW2p POW3p FOR2p FOR3p SPE2p SPE3p
N
FINAL
Mean
Std. Dev.
Mean
Std. Dev.
CG 288
0.27
0.08
0.27
0.09
EG 288
0.26
0.08
0.32
0.05
CG 288
0.32
0.07
0.33
0.08
EG 288
0.32
0.07
0.38
0.04
CG 288
9.71
5.27
9.83
5.38
EG 288
9.27
4.94
15.45
4.07
CG 288
13.53
5.41
13.82
5.74
EG 288
13.34
4.86
21.31
4.39
CG 288
7.09
2.54
7.05
2.35
EG 288
6.74
2.21
8.52
1.54
CG 288
8.54
2.22
8.69
2.32
EG 288
8.35
1.89
10.65
1.49
CG 288
0.44
0.17
0.44
0.15
EG 288
0.43
0.14
0.44
0.09
CG 288
0.57
0.18
0.59
0.19
EG 288
0.58
0.14
0.61
0.10
CG 288
16.38
2.29
16.29
2.38
EG 288
15.95
2.03
19.49
2.30
CG 288
15.30
2.76
15.15
2.52
EG 288
14.62
1.99
17.79
2.08
79
Fis Communications 2018 Table 2: Difference between groups on initial measurement. INITIAL
F
Sig.
t
df
Equal variances 0.30 0.58 1.08 547.00 assumed FLT2p Equal variances 1.08 543.47 not assumed Equal variances 1.41 0.23 0.48 547.00 assumed FLT3p Equal variances 0.48 540.58 not assumed Equal variances 1.40 0.24 1.01 547.00 assumed HIG2p Equal variances 1.01 541.84 not assumed Equal variances 3.91 0.05 0.42 547.00 assumed HIG3p Equal variances 0.42 536.43 not assumed Equal variances 1.70 0.19 1.74 547.00 assumed POW2p Equal variances 1.73 531.26 not assumed Equal variances 3.75 0.05 1.08 547.00 assumed POW3p Equal variances 1.07 527.02 not assumed Equal variances 5.96 0.01 1.16 547.00 assumed FOR2p Equal variances 1.16 520.97 not assumed Equal variances 12.02 0.00 ‐0.27 547.00 assumed FOR3p Equal variances ‐0.27 509.43 not assumed Equal variances 1.81 0.18 2.35 547.00 assumed SPE2p Equal variances 2.34 533.94 not assumed Equal variances 22.18 0.00 3.32 547.00 assumed SPE3p Equal variances 3.30 488.45 not assumed
Std. Err. Dif.
Low
Up
0.28
0.01
0.01
‐0.01 0.02
0.28
0.01
0.01
‐0.01 0.02
0.63
0.00
0.01
‐0.01 0.01
0.63
0.00
0.01
‐0.01 0.01
0.31
0.44
0.44
‐0.41 1.30
0.31
0.44
0.44
‐0.42 1.30
0.67
0.18
0.44
‐0.68 1.05
0.68
0.18
0.44
‐0.68 1.05
0.08
0.35
0.20
‐0.05 0.75
0.08
0.35
0.20
‐0.05 0.75
0.28
0.19
0.18
‐0.16 0.54
0.28
0.19
0.18
‐0.16 0.54
0.25
0.02
0.01
‐0.01 0.04
0.25
0.02
0.01
‐0.01 0.04
0.79
0.00
0.01
‐0.03 0.02
0.79
0.00
0.01
‐0.03 0.02
0.02*
0.43
0.18
0.07
0.80
0.02
0.43
0.18
0.07
0.80
0.00
0.68
0.21
0.28
1.08
0.00*
0.68
0.21
0.28
1.09
2p‐ two points; 3p – three points
By analyzing table 2 it can be seen that in the column Sig. most of the results are higher than 0.05. That is the reason why the values from the first row (Equal variances assumed) were used for farther analysis. The only variable where the values are lower or the same as 0.05 are POW3p – Power of the jump shot; FOR2p/3p ‐ Force of the jump shot and SPE3p ‐ Speed of the jump shot. For these variables, values from the second row (Equal variances not assumed) were used. By farther analysis and for determining the difference between groups on initial measurement, values for column Sig. (2‐tailed) and from the correct row were used. Difference between groups on initial measurement can be seen at SPE2p ‐ Speed of the jump shot for 2 points with a value of
80
Sig. Mean (2‐tailed) Dif.
p=0.02 and SPE3p ‐ Speed of the jump shot for 3 points with a value of p=0.00. By analyzing table 3 it can be seen that in the column Sig. all of the results are lower than 0.05 and that means that for farther analysis the values from a second row (Equal variances not assumed) were used. The only variable witch values form the first row (Equal variances assumed) were used for farther analysis is SPE2p ‐ Speed of the jump shot for 2 points. By determining the difference between groups on final measurement, values for column Sig. (2‐ tailed) and from the correct row were used. Difference between groups on final measurement were determent in eight variables (FLT2p/3p – Flight time of the jump shot for 2 and 3 points; HIG2p/3p – Height of the jump shot for 2 and 3
International Scientific Conference points; POW2p/3p – Power of the jump shot for 2 p=0.00. The only two variables where the and 3 points and SPE2p/3p ‐ Speed of the jump differences were not found are FOR2p/3p – Force shot for 2 and 3 points) with highest level of of the jump shot for 2 and 3 points. Table 3: Difference between groups on final measurement. FINAL Equal variances assumed FLT2p Equal variances not assumed Equal variances assumed FLT3p Equal variances not assumed Equal variances assumed HIG2p Equal variances not assumed Equal variances assumed HIG3p Equal variances not assumed Equal variances assumed POW2p Equal variances not assumed Equal variances assumed POW3p Equal variances not assumed Equal variances assumed FOR2p Equal variances not assumed Equal variances assumed FOR3p Equal variances not assumed Equal variances assumed SPE2p Equal variances not assumed Equal variances assumed SPE3p Equal variances not assumed
F
Sig.
Sig. Mean (2‐tailed) Dif.
Std. Err. Dif.
t
df
‐7.26
547.00
0.00
‐0.05
0.01
‐0.06 ‐0.03
‐7.20
413.08
0.00*
‐0.05
0.01
‐0.06 ‐0.03
‐9.40
547.00
0.00
‐0.05
0.01
‐0.06 ‐0.04
‐9.32
421.23
0.00*
‐0.05
0.01
‐0.06 ‐0.04
24.09 0.00 ‐13.83 547.00
0.00
‐5.62
0.41
‐6.42 ‐4.82
‐13.77 500.96
0.00*
‐5.62
0.41
‐6.42 ‐4.82
19.87 0.00 ‐17.21 547.00
0.00
‐7.49
0.44
‐8.35 ‐6.64
‐17.13 503.20
0.00*
‐7.49
0.44
‐8.35 ‐6.63
‐8.75
547.00
0.00
‐1.48
0.17
‐1.81 ‐1.15
‐8.70
460.79
0.00*
‐1.48
0.17
‐1.81 ‐1.15
34.64 0.00 ‐11.83 547.00
0.00
‐1.96
0.17
‐2.29 ‐1.64
‐11.75 455.62
0.00*
‐1.96
0.17
‐2.29 ‐1.64
‐0.68
547.00
0.50
‐0.01
0.01
‐0.03
0.01
‐0.68
451.31
0.50
‐0.01
0.01
‐0.03
0.01
‐1.45
547.00
0.15
‐0.02
0.01
‐0.04
0.01
‐1.44
409.35
0.15
‐0.02
0.01
‐0.05
0.01
0.34 ‐16.04 547.00
0.00*
‐3.20
0.20
‐3.60 ‐2.81
‐16.03 544.42
0.00
‐3.20
0.20
‐3.60 ‐2.81
0.01 ‐13.42 547.00
0.00
‐2.64
0.20
‐3.03 ‐2.25
‐13.38 521.09
0.00*
‐2.64
0.20
‐3.03 ‐2.25
65.66 0.00
66.34 0.00
41.72 0.00
41.65 0.00
42.52 0.00 0.93 6.10
Low
Up
2p‐ two points; 3p – three points
DISCUSSION The aim of this study was to determine the difference in explosive strength of lower limbs during the performance of basketball jump shots. Observing the results, it can be concluded that there are differences between groups on initial measurement at two variables (SPE2p/3p) and that there are different at eight variables (FLT2p/3p; HIG2p/3p; POW2p/3p; SPE2p/3p) on the final measurement. Such obtained results indicate that after 10 weeks training program
experimental group had changes in the values of the monitoring explosive straight variables. According to the results from table 1 (Mean column), it can be concluded that after the 10 weeks training program, experimental group values increased. This means, for the explosive strength variables which were monitored, that the training program has had a positive effect. Whit that said, this research, as well as many previous ones (Wilson, Murphy, & Giorgi, 1996; Fatouros et al., 2000; Matavulj, Kukolj, Ugarkovic, Tihanyi, & Jaric, 2001; Shiner, Bishop, & Cosgarea, 2005; Tricoli, Lamas, Carnevale, & Ugrinowitsch, 2005;
81
Fis Communications 2018 Lehance, Croisier, & Bury, 2005; Kotzamanidis, 2006; Markovic, 2007; Markovic, Jukic, Milanovic, & Metikos, 2007; Lehnert, Hůlka, Malý, Fohler, & Zahálka, F. 2013) confirms the positive effect of plyometric exercises on explosive strength. Also, there are some researches about the vertical jump in basketball (Santos & Janeira, 2008; de Villarreal, Kellis, Kraemer, & Izquierdo, 2009; Shallaby, 2010; Santos & Janeira, 2011; Sharma & Multani, 2012) which can confirm the results of this research. In some researches (Rojas, Cepero, Oña, & Gutierrez, 2000; Okazaki, & Rodacki, 2012; Ramesh, 2014; Tapera, Gundani, Amusa, Makaza, & Goon, 2014; Podmenik, Supej, Čoh, & Erčulj, 2017) it was concluded that height of a vertical jump during jump shot from greater distance is decreasing. This research cannot confirm such a statement because, as you can see in table 1, the mean value of HIG3p is higher than the value of HIG2p. That is the situation on the initial and the final measurement for both groups. However, there are also researches (Tapera, Gundani, Makaza, Amusa, & Goon, 2014; Kant, 2014) in which has been concluded that a successful jump shot should be performed from a higher point. Such a statement is mostly due to the presence of a defender but there are also other reasons. With further distance, target visualization becomes smaller (Walters, Hudson, & Bird, 1990; Satern, 1993; Okazaki & Rodacki, 2012) and in basketball, the only way to decrease that distance is to release the ball in highest point. The shortest path that the ball can cross when it is released is when it is in the same horizontal level with the rim. One way in which this can be done is to jump higher when performing a jump shot. That is the reason why when performing a jump shot vertical jump needs to be as explosive and as high as it can be. In order for players to do such think they need to have a high level of explosive strength. Aldo, this training program isn’t classic plyometric training, it had a positive effect on most explosive strength variables that were monitored such as height of the vertical jump, flight time of the jump shot, power, and speed of jump. If players want to perform a higher vertical jump, they need more muscle straight in lower limbs and it has been shown that plyometric training is the correct method.
CONCLUSION So far it can be concluded that for performing the jump shot, maximum speed and straight of vertical jump is needed. For doing such a thing the explosive straight of the lower limbs is important. Obviously, according to this and previous researches, plyometric training is the right method
82
for influencing on explosive strength especially when it comes to young players.
REFERENCES Bubanj, S., Bubanj, R., Stanković, R., & Đorđević, M. (2010). Praktikum iz biomehanike (The Workbook in Biomehanics). Niš: Faculty of Sport and Physical Education, University of Niš Button, C., MacLeod, M., Sanders, R., & Coleman, S. (2003). Examining movement variability in the basketball free throw action at different skill levels. Research Quarterly for Exercise and Sport, 74(3), 257– 269. Çetin, E., & Muratlı, S. (2014). Analysis of Jump Shot Performance among 14‐15 Year Old Male Basketball Player. Procedia‐Social and Behavioral Sciences, 116(5), 2985‐2988. Chen, W. C., Lo, S. L., Lee, Y. K., Wang, J. S., & Shiang, T. Y. (2005). Effects of upper extremity fatigue on basketball shooting accuracy. ISBS‐Conference Proceedings Archive, 1(1), 633‐636. de Villarreal, E. S. S., Kellis, E., Kraemer, W. J., & Izquierdo, M. (2009). Determining variables of plyometric training for improving vertical jump height performance: a meta‐analysis. The Journal of Strength & Conditioning Research, 23(2), 495‐506. Fatouros, I., G., Jamurtas, A., Z., Leontsini, D., Taxildaris, K., Aggelousis, N., Kostopoulos, N., & Buckenmeyer, P. (2000). Evaluation of plyometric exercise training, weight training, and their combination on vertical jumping performance and leg strength. The Journal of Strength & Conditioning Research, 14(4), 470‐ 476. Fontanella, J., J. (2007). The Physics of Basketball. International Journal of Sports Science & Coaching, 2(2), 197–209. Hess, C. (1980). Analysis of the jump shot. Athletic Journal, 61(3), 30‐32. Kant, S., U. (2014). Linear Kinematical Analysis of Successful and Unsuccessful Free Shot in Basketball. Online International Interdisciplinary Research Journal, 4(5), 246‐252. Krause, J., Meyer, D., & Meyer, J. (2008). Basketball skills and drills. Human Kinetics. Kotzamanidis, C. (2006). Effect of plyometric training on running performance and vertical jumping in prepubertal boys. The Journal of Strength & Conditioning Research, 20(2), 441‐445. Lam, W.K., Maxwell, J.P., & Masters, R.S. (2009). Analogy versus explicit learning of a modified basketball shooting task: Performance and kinematics outcomes. Journal of Sports Sciences, 27(2), 179–191. Lehance, C., Croisier, J. L., & Bury, T. (2005). Optojump system efficiency in the assessment of lower limbs explosive strength. Science & Sports, 20(3), 131‐ 135. Lehnert, M., Hůlka, K., Malý, T., Fohler, J., & Zahálka, F. (2013). The effects of a 6 week plyometric training programme on explosive strength and agility in professional basketball players. Acta Gymnica, 43(4), 7‐ 15. Markovic, G. (2007). Does plyometric training improve vertical jump height? A meta‐analytical review. British journal of sports medicine, 41(6), 349‐355.
International Scientific Conference Markovic, G., Jukic, I., Milanovic, D., & Metikos, D. (2007). Effects of sprint and plyometric training on muscle function and athletic performance. The Journal of Strength & Conditioning Research, 21(2), 543‐549. Matavulj, D., Kukolj, M., Ugarkovic, D., Tihanyi, J., & Jaric, S. (2001). Effects of plyometric training on jumping performance in junior basketball players. Journal of sports medicine and physical fitness, 41(2), 159‐164. Millslagle, D.G. (2002). Recognition accuracy by experienced men and women players of basketball. Perceptual and Motor Skills, 95(1), 163–172. Okazaki, V. H., & Rodacki, A. L. (2012). Increased distance of shooting on basketball jump shot. Journal of sports science & medicine, 11(2), 231 Okubo, H., & Hubbard, M. (2006). Dynamics of the basketball shot with application to the free throw. Journal of Sports Sciences, 24(12), 1303–1314. Oudejans, R. R., Karamat, R. S., & Stolk, M. H. (2012). Effects of actions preceding the jump shot on gaze behavior and shooting performance in elite female basketball players. International Journal of Sports Science & Coaching, 7(2), 255‐267. Podmenik, N., Supej, M., Čoh, M., & Erčulj, F. (2017). The effect of shooting range on the dynamics of limbs angular velocities of the basketball shot. Kinesiology: International Journal of Fundamental and Applied Kinesiology, 49(1), 92‐100. Radnković, M., Bubanj, S., Berić, D., Stanković, R., & Stojić, M. (2018). The influence of a ten‐week training program on the kinematic parameters of made jump shots in young basketball palyers. Facta Universitatis, Series Physical Education and Sport, 16 (1), 127‐136. Ramesh, A. (2014). Biomechanical analysis of the jumping ability in basketball. International Journal of Physical Education and Sports, 1(1), 1‐8. Rojas, F. J., Cepero, M., Oña, A., & Gutierrez, M. (2000). Kinematic adjustments in the basketball jump shot against an opponent. Ergonomics, 43 (10),1651‐ 1660. Santos, E. J., & Janeira, M. A. (2008). Effects of complex training on explosive strength in adolescent male basketball players. The Journal of Strength & Conditioning Research, 22(3), 903‐909.
Santos, E. J., & Janeira, M. A. (2011). The effects of plyometric training followed by detraining and reduced training periods on explosive strength in adolescent male basketball players. The Journal of Strength & Conditioning Research, 25(2), 441‐452. Shallaby, H. K. (2010). The effect of plyometric exercises use on the physical and skillful performance of basketball players. World Journal of Sport Sciences, 3(4), 316‐324. Sharma, D., & Multani, N. K. (2012). Effectiveness of Plyometric Training in the Improvement of Sports Specific Skills of Basketball Players. Indian Journal of Physiotherapy and Occupational Therapy‐An International Journal, 6(1), 77‐82. Shiner, J., Bishop, T., & Cosgarea, A. J. (2005). Integrating low‐intensity plyometrics into strength and conditioning programs. Strength and Conditioning Journal, 27(6), 10. Struzik, A., Pietraszewski, B., & Zawadzki, J. (2014). Biomechanical analysis of the jump shot in basketball. Journal of human kinetics, 42(1), 73‐79. Tapera, E. M., Gundani, M. P., Amusa, L. O., Makaza, D., & Goon, D. T., (2014). Release parameters across player position in elite male Zimbabwe basketball players. African Journal for Physical Health Education, Recreation and Dance. 20(1), 145‐152. Tapera, E. M., Gundani, M. P., Makaza, D., Amusa, L. O., & Goon, D. T., (2014). Release parameters across jump shot success among Zimbabwean league basketball players. African Journal for Physical Health Education, Recreation and Dance, 20(3), 928‐938. Tricoli, V., Lamas, L., Carnevale, R., & Ugrinowitsch, C. (2005). Short‐term effects on lower‐body functional power development: weightlifting vs. vertical jump training programs. Journal of strength and conditioning research, 19(2), 433‐437. Varghesea, J., & Shelvam, P., V. (2014). Effect of resistance training on shooting performance of basketball players. International Journal of Physical Education, Fitness and Sport, 3(4), 133‐138. Wilson, G. J., Murphy, A. J., & Giorgi, A. (1996). Weight and plyometric training: effects on eccentric and concentric force production. Canadian Journal of Applied Physiology, 21(4), 301‐315.
83
Fis Communications 2018
RELATION OF POWER, SPEED AND AGILITY IN BASKETBALL PLAYERS BY POSITION Dušan Stanković 1 and Мария Цанкова‐Калоянова 2 Faculty of Sport and Physical Education ‐ University of Niš
1
2
National Sports Academy „Vassil Levski “Sofia
Dušan Stanković and Мария Цанкова‐Калоянова
UDC 796.323:613.25
SUMMARY The aim of this study was to determine differences in motor skills among top NBA players. In order to conduct the research, data was collected from the official NBA Draft Combine website, where statistical analysis of information was done in order to determine the differences between players depending on the players’ positions. We analyzed the variables that characterize agility and strength, which are integral parts of the battery of tests applied to this draft. Based on “One Way ANOVA“, it can be concluded that the arithmetic mean of the applied tests differs significantly in three motor variables at the level of p≤0.01 in relation to players playing in different positions (Lane Agility Time, Three Quarter Sprint and Max Vertical Leap). In all these variables, groups of players were formed and homogenized with similar average values in relation to body height that definitely determines the values of the performed motor skill tests, as shown by post‐hoc analysis. A group of "lower‐height" players (Shooting guard, Small forward and Point guard) showed on all three tests that their arithmetic means do not differ statistically, so their test results are very similar, which quite explains the tendency of modern basketball that on the positions 1‐3 players can easily rotate. Cilj ovog istraživanja je bio da se utvrde razlike u motoričkim sposobnostima vrhunskih NBA igrača. Na osnovu podataka sa zvanicnog sajta NBA draft combine uradjena je statistička obrada podataka sa ciljem da se utvrde razlike izmedju igrača u odnosu na poziciju koju igraju. Analizirane su varijable koje karakterišu agilnost i snagu, a koje su sastavni delovi baterije testova koje se primenjuju na ovom draftu. Na osnovu One Way Anove može se zaključiti da aritmetičke sredine primenjenih testova se značajno razlikuju u tri motoricke varijable na nivou p≤0.01 u odnosu na igrace koji igraju na različitim pozicijama (Lane Agility Time, Three Quarter Sprint and Max Vertical Leap). Kod svih ovih varijabli grupe igrača su se formirale i homogenizovale sa sličnim prosečnim vrednostima u odnosu na telesnu visinu koja definitivno odredjuje vrednosti realizovanih testova motoričkih sposobnosti, sto je pokazano post‐hoc analizom. Grupa „nižih“ igrača, Shooting guard, Small forward and Point guard, je u sva tri testa pokazala da se njihove aritmetičke sredine statistički značajno ne razlikuju p≥0.01, tako da su njihovi rezultati na testu veoma slični, što donekle i objašnjava tendenciju savremene košarke da na poziciji 1‐3 moze da se lako rotiraju igrači. Keywords: strength, agility, basketball, player positions
INTRODUCTION Agility is an important component of many sports but has not been extensively researched (Young & Farrow, 2006). Some studies noted that the improvement in speed, power, and balance should result in an improvement of agility(Sekulic, Spasic, Mirkov, Cavar, & Sattler, 2013). One more study showed that the physiological profile of elite players in the Belgian first division differs by player position. More specifically, guards were characterized by high endurance, speed, and agility, whereas centers and power forwards had higher muscle strength than the other positions. (Boone & Bourgois, 2013). In one research where the strength on bench press 1RM was examined,
84
power forwards and centers were stronger than the rest of the players' positions (Ben Abdelkrim, Chaouachi, Chamari, Chtara, & Castagna, 2010). Some researchers have been investigating basketball footwear requirements depending on playing position (Brauner, Zwinzscher, & Sterzing, 2012). Furthermore, many researches have been looking into physical fitness (Köklü, Alemdaroǧlu, Koçak, Erol, & Findikoǧlu, 2011) (Scanlan, Tucker, & Dalbo, 2014). In another research where male basketball players were doing agility tests, 20m shuttle run tests, a significant difference was found on the speed and agility tests between playmakers and centers. (Tsitskaris, Theoharopoulos, & Garefis, 2003). The point guard “(PG), also known as “number one (1)”, is typically a team's best ball
International Scientific Conference handler and passer. Therefore, they often lead their team in assists and steals. They are often quick and can hit shots either outside the three‐ point line or "in the paint", largely depending on the player's skill level. Point guards are looked upon as the "floor general" or the "coach on the floor". They should study the game and game film to be able to recognize the weaknesses of the defense, and the strengths of their own offense. They are responsible for directing plays, making the position equivalent to that of quarterback in American football, a playmaker in Association football, center in ice hockey, or setter in volleyball. Good point guards increase team efficiency and generally have a high number of assists. They are often referred to as dribblers or play‐makers. In the NBA, point guards are usually the least tall players on the team and are usually 6 feet 5 inches (1.96 m) tall or shorter. The shooting guard “(SG)” is also known as “number two (2)” or the “off guard”. Along with a small forward, a shooting guard is often referred to as a wing because of its use in common positioning tactics. As the name suggests, most shooting guards are good shooters from the three‐point range. Besides being able to shoot the ball, shooting guards tend to have good ball handling skills and the ability to drive the ball to the basket, often creating their own shots off the dribble. A versatile shooting guard will have good passing skills, allowing them to assume point guard responsibilities known as combo guards. In the NBA, shooting guards usually range between 6 feet 4 inches (1.93 m) and 6 feet 7 inches (2.01 m) in height. The small forward (SF), also known as “number three (3)”, is the most versatile of the five main basketball positions. Versatility is key for small forwards because of the nature of their role, which resembles that of a shooting guard more often than that of a power forward. This is why the small forward and the shooting guard positions are often interchangeable and referred to as wings. Small forwards have a variety of assets, such as quickness and strength inside. One common thread among all kinds of small forwards is the ability to "get to the line" and draw fouls by aggressively attempting (post up) plays, lay‐ups, or slam dunks. As such, accurate foul shooting is a common skill for small forwards, many of whom record a large portion of their points from the foul line. Besides being able to drive to the basket, they are also good long‐range shooters. Some small forwards have good passing skills, allowing them to assume point guard responsibilities known as point forwards. Small forwards should be able to do a little bit of everything on the court, typically playing roles such as swingmen and defensive specialists. In the NBA, small forwards usually range from 6 feet 6 inches (1.98 m) and 6 feet 9 inches (2.06 m) in
height. The power forward “(PF)”, also known as “number four (4)”, often plays a role similar to that of the center, down in the "post" or "low blocks". The power forward is often the team's most versatile scorer, being able to score close to the basket while also being able to shoot mid‐range jump shots from 12 to 18 feet away from the basket. Some power forwards, known as “stretch fours”, have since extended their shooting range to three‐pointers. On defense, they are required to have the strength to guard bigger players close to the basket and to have the athleticism to guard quick players away from the basket. Most power forwards tends to be more versatile than centers since they can be part of plays and are not always in the low block. In the NBA, power forwards usually range from 6 feet 8 inches (2.03 m) and 6 feet 11 inches (2.11 m) in height. The center “(C)”, also known as “number five (5)”, nicknamed the "pivot", usually plays near the baseline, close to the basket (referred to as the "low post"). They are usually the tallest player on the floor. The center usually scores "down low, in the paint" (near the basket, in the key), but some can be good perimeter shooters. They are typically skilled at gathering rebounds, contesting shots and setting screens on plays. The center position has been traditionally considered [by whom?] one of the most important positions, if not the most important. The range of players used in the position has transitioned from relatively slower but much taller 'back to the basket' players to players who would normally be classified as power forwards but can dominate the position with their defensive skills, or mismatch ability to shoot from the high post. This has been due to the scarcity of players possessing the combination of great skill, ideal height, and durability. This has been matched by the development of more fast‐paced and athletic basketball play which calls for less traditional center play and a more up‐and‐down the court style. In the NBA, centers are usually 6 feet 10 inches (2.08 m) or taller.
METHODS Subjects The NBA Draft Combine is a multi‐day showcase that takes place every May before the annual June NBA draft. At the combine, college basketball players receive measurements, participate in interviews, undergo shooting drills, take medical tests, go through five‐on‐five drills and perform various athletic tests in front of National Basketball Association (NBA) coaches, general managers, and scouts. Athletes attend by invitation only. An athlete's performance during the combine can affect perception, draft status,
85
Fis Communications 2018 salary, and ultimately the player's career. In this study, the results from the past five years were taken with a total of N = 250 players divided into the following subgroups: Point guard N=58, Shooting guard N=59, Small forward N=43, Power forward N=60 and Center N=30.
Procedure In this research, we used the variables that are used in the testing of players who were at the draft. Data extracted from the following website: https://stats.nba.com/draft/combine‐strength‐ agility/, based on the results from the last 5 years. The athletic tests include an athletes measurements of a standing vertical jump (inches), maximum vertical jump (inches), shuttle run (seconds), three‐quarter‐court sprint time (seconds) and lane agility time (seconds). The vertical jump ‐ is a test of an athlete’s explosive leg
power. There are two versions of this test performed, the standard (no step) vertical jump and a running Max Vert. ¾ Court Sprint ‐ Time to sprint over the distance of three‐quarters of the court is measured in seconds. Maximum running speed is important in basketball, though the acceleration or time over the first few steps is probably more important. See the details of the 3/4 sprint test procedure. Lane Agility Drill‐ Agility is very important in basketball and is measured using the lane agility test at the NBA camp. The Lane Agility test measures how fast a player moves laterally around the key.
Statistical analysis Statistical analysis was carried out on raw data using one‐way repeated measures of ANOVA followed by Tukey’s post hoc test (p < 0.01 was set as the level of statistical significance).
RESULTS Table 1 One Way ANOVA and descriptive
N
LANE AGILITY TIME*
SHUTTLE RUN
MEAN (* p ≤ 0.01) THREE QUARTER S STANDING VERTICAL PRINT * LEAP
MAX VERTICAL LEAP *
Point guard Shooting guard Small forward Power forward
58
11.05
3.02
3.24
30.63
37.08
59
11.08
3.06
3.28
30.04
36.30
43
11.32
3.09
3.28
30.51
36.38
60
11.55
3.13
3.36
29.47
34.73
Center
30
11.86
3.10
3.41
28.43
32.43
Table 2 Post Hoc Tukey HSD test for Lane Agility Test POSITION Point guard Shooting guard Small forward Power forward Center Sig.
Subset for alpha = 0.05 1 2 3 11,0517 11,0822 11,3209 11,3209 11,5500 11,8640 ,075 ,182 1,000
Table 3 Post Hoc Tukey HSD test for Tree Quarter Sprint test POSITION Point guard Small forward Shooting guard Power forward Center Sig.
86
Subset for alpha = 0.05 1 2 3,2393 3,2763 3,2825 3,3617 3,4083 ,321 ,246
International Scientific Conference Table 4 Post Hoc Tukey HSD test for Max Vertical Leap test POSITION Center Power forward Shooting guard Small forward Point guard Sig.
Subset for alpha = 0.05 1 2 3 32,433 34,725 36,297 36,297 36,384 36,384 37,078 1,000 ,134 ,804
DISCUSSION Table No. 1 shows the results of the descriptive statistics and One Way ANOVA. We notice that in three variables there are statistically significant differences between subgroups, LANE AGILITY TIME, THREE QUARTER SPRINT and MAX VERTICAL LEAP on a level greater than 0.01. These results are mostly very similar to the results of previous researches (Tsitskaris, Theoharopoulos, & Garefis, 2003, Köklü, Alemdaroǧlu, Koçak, Erol, & Findikoǧlu, 2011). Given that these studies were conducted on a sample of athletes who did not possess the same amount of quality as Draft NBA players, we can conclude that the performance and level of the players do not play a crucial role in the differences in the motor skills of the basketball players compared to the position they play. Variable Lane Agility Time shows that the minimum average time was 11.05 seconds for the point guard subgroup, for which we can say that they were the fastest on this test. The slowest were centers with a time of 11.86 seconds. In the next test, shuttle run, point guards also had the best average time which was 3:02 seconds, while the subgroup “power forwards” had the time of 3.13 seconds, where we see that power forwards are slower than the subgroup “centers” which is very interesting considering that the players at these positions are usually of less height and physically more prepared. Turning technique and coordination is also a large factor in this test. At Three Quarter Sprint variable point guards also had the best average time of 3.24 seconds, small forwards and shooting guards both had the time of 3.28, while centers were the slowest with the time of 3.41 seconds. What is unusual is that on the next test, the point guards had the best results even though speed was not included, At the standing vertical leap the average height of the jump was 30.63 inches; however, the centers had the worst results, with the average jump being 28.43 inches. On the last test, Max Vertical Leap, point guards once more had the best results with an average jump height of 37.08 inches, whereas the centers were the worst with a 32.43 average jump height. According to post‐hoc analysis, shown in the following tables, we can see that subgroups, whose
arithmetic means statistically did not differ significantly, have separated from the lowest to the highest players. Table 2 shows that lane agility time test has three subset players, in table no. 3 for THREE QUARTER SPRINT two subsets, for MAX VERTICAL LEAP test in table no. 4 also 3 subsets. The general conclusion is that the highest players of the Subgroup “Center” had the weakest results in the max vertical leap and lane agility time test and they were separated as a special subset with very specific results of motor skills.
CONCLUSION Based on the conducted research, using data collected from the official website, it can be concluded that the differences in motor skills in treated basketball players compared to the position they play exist and that they are mainly conditioned by anthropometric characteristics. Three Quarter Sprint test shows two groups of basketball players with similar results, table 3. In the other two tests, the Agility and Power test, three groups of athletes were clearly differentiated, where the centers were isolated from other players. The obtained results point to the tendency of the modern basketball that the differences in motor skills are becoming lesser and to look for players who can equally be good at any position.
REFERENCES Ben Abdelkrim, N., Chaouachi, A., Chamari, K., Chtara, M., & Castagna, C. (2010). Positional role and competitive‐level differences in elite‐level men’s basketball players. Journal of Strength and Conditioning Research, 24(5), 1346–1355. https://doi.org/10.1519/JSC.0b013e3181cf7510 Boone, J., & Bourgois, J. (2013). Morphological and physiological profile of elite basketball players in Belgium. International Journal of Sports Physiology and Performance. https://doi.org/10.1123/ijspp.8.6.630 Brauner, T., Zwinzscher, M., & Sterzing, T. (2012). Basketball footwear requirements are dependent on playing position. Footwear Science. https://doi.org/10.1080/19424280.2012.674980 Köklü, Y., Alemdaroǧlu, U., Koçak, F. Ü., Erol, A. E., & Findikoǧlu, G. (2011). Comparison of chosen physical fitness characteristics of turkish professional basketball players by division and playing position. Journal of
87
Fis Communications 2018 Human Kinetics. https://doi.org/10.2478/v10078‐011‐ 0077‐y Scanlan, A. T., Tucker, P. S., & Dalbo, V. J. (2014). A comparison of linear speed, closed‐skill agility, and open‐skill agility qualities between backcourt and frontcourt adult semiprofessional male basketball players. Journal of Strength and Conditioning Research, 28(5), 1319–1327. https://doi.org/10.1519/JSC.0000000000000276 Sekulic, D., Spasic, M., Mirkov, D., Cavar, M., & Sattler, T. (2013). Gender‐specific influences of balance, speed, and power on agility performance. Journal of Strength
88
and Conditioning Research. https://doi.org/10.1519/JSC.0b013e31825c2cb0 Tsitskaris, G. . B., Theoharopoulos, A. ., & Garefis, A. . (2003). Speed, speed dribble and agility of male basketball players playing in different positions. Journal of Human Movement Studies. https://doi.org/refwid:7513 Young, W., & Farrow, D. (2006). A review of agility: practical applications for strength and conditioning. Strength and Conditioning Journal, 28(5), 24–29. https://doi.org/10.1519/1533‐ 4295(2006)28[24:AROAPA]2.0.CO;2
International Scientific Conference
DIFFERENCES IN SPEED AND AGILITY OF YOUNG FOOTBALL PLAYERS AFTER THE SAQ EXPERIMENTAL TRAINING PROGRAMME Ivana Bojić¹, Marjan Mihajlović¹,Miroslav Smajić² and Vlatko Nedelkovski3 ¹The Faculty of Sport and Physical Education, University of Niš ² The Faculty of Sport and Physical Education, University of Novi Sad 3 Faculty of Physical Education, Sport and Health, Skopje, Macedonia Ivana Bojić, Marjan Mihajlović, Miroslav Smajić and Vlatko Nedelkovski
UDC 796.332.012
SUMMARY A football match is comprised of repetitive high‐intensity short strains, between which there are periods of running (high‐, medium‐ and low‐intensity), walking and standing. Speed, agility and quickness (SAQ) are the important determinants of a football player’s anaerobic abilities which enable the players to be successful in important moments of the game such as the important ball possession, dribbling opponents and/or scoring. The aim of this research was to establish the differences in speed and agility of 30 young football players of FC ‘Vučje’(Vučje), aged 7 to 10, after a six‐week‐long experimental training programme (2 times a week/12 training sessions/45 minutes in the first part of the training session). Training programme was consisted of SAQ exercises (sprinting, changing directions, foot‐worked drills). The results of Student t‐test showed the statistically significant difference between two testing situations in the tests estimating starting speed (5m sprint, p = .000) and acceleration (10m sprint, p = .001), whereas there was no statistically significant difference in the third test which estimated maximum speed (40m sprint, p = .118). The results of the tests estimating agility also showed statistically significant difference in Arrowhead agility drill test (p = .000) and Balsom agility test (p = .001), but there was no significant changes in the 505 agility test (p = .116). From the practical point of view, our results show that quickness and agility can be successfully improved in young players (aged 7 to 10) with the application of the organized SAQ training programme. This programme, however, does not seem appropriate when it comes to increasing the maximum speed in 40m sprints at the same time.
Keywords: Speed, agility, experimental programme, young football players
INTRODUCTION A football match is comprised of repetitive high‐intensity short strains, between which there are periods of running (high‐, medium‐ and low‐ intensity), walking and standing. Even though high‐intensity strains are not frequent, they are mandatory for ball possession, scoring and final victory, as the ultimate goal. Over the last decades football has gradually changed its tempo, with the game becoming faster, the players covering a longer distance, and the high‐intensity running undergoing certain changes (Casajus, 2001; Helgerud, Engen, Wisløff, and Hoff, 2001; Gil, Gil, Ruiz, Irazusta, and Irazusta, 2007). Some statistical data show that a football player sprints each 90 seconds, with each sprint lasting between 2 and 4 seconds, and changes directions between 1000 to 1400 times during the game (Bahtijarević i Barčot,
2006). The ability of a player to sprint, speed up and slow down with direction changes is known as agility. Agility is defined as a whole body fast movements with speed and direction changes, in response to a stimulus (Sheppard & Young, 2006). Speed, agility and quickness (SAQ) are the important determinants of a football player’s anaerobic abilities which enable the players to be successful in important moments of the game (such as the important ball possession, dribbling opponents and/or scoring) (Hammami, Makhlouf, Chtara, Padulo, & Chaouachi, 2015). Sprinting demands a high level of quickness and strength needed for overcoming body mass inertia. Several studies have examined the relationship between the relative strength and the ability to sprint in young football players and confirmed that stronger football players achieve better results in all maximum speed movements, that is, sprints (Baker & Nance, 1999; Cronin &
89
Fis Communications 2018 Hansen, 2005; Kotzamanidis, Chatzopoulos, METHODS Michailidis, Papaiakovou, and Patikas, 2005; Comfort, Bullock & Pearson, 2012). Even though Subjects there are well‐established advantages of SAQ activities in the training process of young 30 football players of the football club ‘Vučje’ sportsmen and adolescents, so far there have not from Vučje, aged 7 to 10, who had been training been researches done with young football players, football actively for a year, participated in the aged 7 to 10. Training programmes of pre‐ research. All the players and their parents had adolescent football players are comprised of been familiarised with the aim and the protocol of exercises similar to the ones of the SAQ method the research, as well as with the testing method. within the regular technical and tactical training The parents had given their written consent for sessions. For example, when training young their children to participate in the research. football players, aged 6 to 12, the activities which The following measuring instruments were are included in the training sessions are used for evaluating speed and quickness: 5m, 10m deliberately and accidentally chosen (the games and 40m sprints. Measuring instruments were adapted to the age and the technical training) and used to assess agility: 505 agility test, Balsom are comprised of multi‐directional steps, speeding agility test, Arrowhead agility drill test up, slowing down, turning around, as well as of cognitive stimuli in the form of unpredictable Procedure football‐related games (Trecroci, Milanović, Rossi, Broggi, Formenti, and Alberti, 2016). Authors The experimental training programme was Fransen et al (2012) emphasize the fact that the conducted in the period of preparations and it training methods which include the combination of lasted for six weeks, 2 times a week (12 training physical and cognitive exercises (SAQ training, for sessions), for 45 minutes in the first part of the instance) can be more effective with younger training session. After that, the players continued children than adults. with their regular technical and tactical training. Therefore, the aim of this research was to The experimental programme aimed at the establish the differences in speed and agility of development of speed and agility. The training young football players, aged 7 to 10, after a six‐ included football movements with and without week‐long experimental training programme. We direction changes, with and without the ball (SAQ presumed that the target plan and programme of training programme). the training sessions would bring about positive changes in speed and agility of young football players. Table 1. Descriptive characteristics of the 6‐week training program for speed and agility
Speed, Agility and Quickness (SAQ)
Week 1 and 2
– Foot‐working exercises using hoops (e.g. split steps, line drills, lateral line hops and multiple hops) – Brief line sprints (over 10, 20, 30m) – Brief sprints with few directional changes (e.g. from 1 to 3) and different angles (30° and 45°) – Speed‐ladder exercises with a combination of basic drills (e.g. one/two in the hole, skipping and hopscotch) – Brief line sprints with a ball (over 10, 20, 30m) – Brief sprints with several directional changes (e.g. from 3 to 5) and different angles (30°, 45° and 90°) – Speed‐ladder exercises with a combination of advanced drills e.g.slaloms, carioca, cha‐cha, cherry pickers) – Brief line sprints with/without ball (over 10, 20, 30m) – Agility drills in response to different commands (e.g. right‐to‐left direction, forward – backward direction)
Week 3 and 4
Week 5 and 6
Table. 2. Description of a training session Number of series/ repetitions 3/3
90
Length of a series in minutes 5
Pauses between repetitions (s) 30
Pauses between series (mins) 5
International Scientific Conference
Statistical analysis Student’s T‐test was used for determining significant differences between arithmetical means of the applied measuring sets for estimating speed and agility of young football players, before and after the experimental training programme.
RESULTS
testing situations in the tests estimating starting speed (5m sprint, p = .000) and quickness (10m sprint, p = .001), whereas there was no statistically significant difference in the third test which estimated maximum speed (40m sprint, p = .118). The results of the tests estimating agility also showed statistically significant difference in Arrowhed agility drill test (p = .000) and Balsom agility test (p = .001). There were no statistically significant changes in the third test (505 agility test, p = .116).
The results obtained (Table 3) show the statistically significant difference between two Tabele 3. Differences in speed and agility of young football players after a six‐week‐long training process Тest
N
Mean
p (< 0.05)
Pre ± Std.Dev
Post ± Std.Dev
T‐ value
1.64± 0.16
1.61±0.15
4.34
.000**
2.74±0.21
2.71±0.22
4.17
.001**
8.19±0.65
8.15±0.65
1.64
.118
3.66±0.39
3.57±0.27
1.65
.116
30
10.81±0.81
10.77±0.82
5.30
.000**
30
17.82±1.39
17.76±1.43
4.10
.001**
5m sprint 10m sprint 40m sprint 505 agility test
30 30 30 30
Arrowhed agility drill Balsom agility test
DISCUSSION The aim of this research was to establish the changes of the motor abilities, speed and agility, in young football players, aged 7 to 10, after a programmed training process. The results of the research show that the applied six‐week‐long training programme had a positive effect on the changes in the starting speed (5m sprint) and quickness (10m sprint), whereas there were no improvements in the maximum speed results (40m sprint). The significant improvement can be ascribed to the SAQ training programme itself (for instance, skips, different jumps and hops, short sprints), all based on a short time contact of a foot with the surface. When working with children aged 10 and 11, applying explosive activities (based on a very short cycle of lengthening and shortening) proved most useful for improving sprint, due to high neuromuscular adaptations (intramuscular coordination) (Michailidis et al., 2013). The results obtained prove the fact that around 90% of all maximum movements during a football match happen at 5m to 15m distance (Bloomfield, Polman, O’Donoghue, and McNaughton, 2007). Along with that, modern football requires
reactional ability at 5m to 15m distance (Sporis, Jukic, Ostojic, and Milanovic, 2009). The obtained results rely heavily on the results of the previous researches (Jovanovic, Sporis, Omrcen, and Fiorentini, 2011; Milanovic, Sporis, Trajkovic, James, and Samija, 2013; Trecroci et al., 2016; Azmi and Kusnanik, 2017) which showed that SAQ training programme, lasting from 8 to 12 weeks, could improve the speed, quickness and agility of players. However, after the experimental programme there were no changes in the maximum running speed in 40m sprint, which can be ascribed to the fact that as a sport football is mostly comprised of short‐distance movements, which were also a part of the experimental programme. According to Kusnaniku and Rattray (2017), speed and agility can be considered the most dominant traits in football. Taking into account the fact that the movements observed in the training sessions were short‐distance sprints with and without direction changes, hops and jumps (as in the SAQ programme), the obtained results were expected. The examinees’ age (7 to 10) is a particularly sensitive period in which almost all motoric abilities can be developed, which is in line with the results of a six‐week‐long training process. It must 91
Fis Communications 2018 be added that the positive changes might also be the result of the technical and tactical training sessions which followed the experimental programme ones.
CONCLUSION The elements of the SAQ programme training include the exercises and equipment which provoke neural adaptations in both programmed and unpredictable conditions of a football match. Our research shows that the application of this method leads to the improvements in quickness (in 5m and 10m sprints) and agility of the examinees, which is not the case in maximum speed in 40m sprint. The methods and exercises which can be used for improving speed and agility are speed ladder and the repetitions of sprints, with and without direction changes. From the practical point of view, our results show that quickness and agility can be successfully improved in young players (aged 7 to 10) with the application of the organized SAQ training programme. This programme, however, does not seem appropriate when it comes to increasing the maximum speed in 40m sprints at the same time.
REFERENCES Azmi, K. and Kusnanik, N.W. (2017). Effect of Exercise Program Speed, Agility, and Quickness (SAQ) in Improving Speed, Agility, and Acceleration. Journal of Physics Conference Series 947 (1) : 012043; DOI: 10.1088/1742‐6596/947/1/012043. Bahtijarević, Z., Barčot, Z. (2006). Kondicijski trening mlađih dobnih skupina. Zagreb: Kineziološki fakultet Sveučilišta u Zagrebu. Baker, D. & Nance, S. (1999).The relationship between running speed and measures of strength and power in professional rugby league players. Journal of Strength Conditioning Research,13, 230–235. Bloomfield, J, Polman, R, O’Donoghue, P, and McNaughton, L. (2007). Effective speed and agility conditioning methodology for random intermittent dynamic type sports. Journal of Strength Conditioning Research, 21, 1093–1100. Casajus, J. ( 2001). Seasonal variation in fitness variables in professional soccer players. Journal of Sports Medicine and Physical Fitness, 41, 463–469. Comfort, P., Bullock, N., & Pearson, SJ. (2012). A comparison of maximal squat strength and 5‐, 10‐ and 20‐meter sprint times, in athletes and recreationally trained men. Journal of Strength Conditioning Research, 26, 937–940. Cronin, JB, Hansen KT. (2005). Strength and power predictors of sports speed. Journal of Strength Conditioning Research, 19, 349–357.
92
Fransen, J., Pion, J., Vandendriessche, J., Vandorpe, B., Vaeyens, R., Lenoir, M., & Philippaerts, R. M. (2012). Differences in physical fitness and gross motor coordination in boys aged 6–12 years specializing in one versus sampling more than one sport. Journal of Sports Sciences, 30 (4), 379–386. Gil, SM, Gil, J, Ruiz, F, Irazusta, A, and Irazusta, J. (2007). Physiological and anthropometric characteristics of young soccer players according to their playing position: Relevance for the selection process. Journal of Strength Conditioning Research, 21, 438–445. Hammami, R., Makhlouf, I., Chtara, M., Padulo, J., & Chaouachi, A. (2015). The contribution of vertical explosive strength to sprint performance in children. Sport Sciences for Health, 11, 37–42. doi:10.1007/s11332‐014‐0200‐2. Helgerud, J, Engen, LC, Wisløff, U, and Hoff, J. (2001). Aerobic endurance training improves soccer performance. Medicine and Science in Sports and Exercise, 33, 1925–1931. Jovanovic, M., Sporis, G., Omrcen, D. and Fiorentini, F. (2011). Effects Of Speed,Agility,Quickness Training Method On Power Performance In Elite Soccer Players. Journal Of Strength And Conditioning Research,25 (5), 1285‐1295. Kotzamanidis, C, Chatzopoulos, D, Michailidis, C, Papaiakovou, G, and Patikas, D. (2005). The effect of a combined high‐intensity strength and speed training program on the running and jumping ability of soccer players. Journal of Strength Conditioning Research, 19, 369–375. Kusnanik, N. and Rattray, B. (2017). Effect Of Ladder Speed Run And Repeated Sprint Ability In Improving Agility And Speed Of Junior Soccer Players. Acta Kinesiologica, 11 (1), 19‐22. Michailidis, Y., Ioannis, G. F., Primpa, E., Michailidis, C., Avloniti, A., Chatzinikolaou, A., and Kambas, A. (2013). Plyometrics’ trainability in preadolescent soccer athletes. Journal of Strength and Conditioning Research, 27(1), 38–49. Milanovic, Z., Sporis, G., Trajkovic, N., James, N. and Samija, K. (2013). Effect of a 12 Week SAQ Training Programme on Agility with and without the Ball among Young Soccer Players. Journal of Sport Science and Medicine, 12, 97‐103. Sheppard JM, Young WB. (2006). Agility literature review: classifications, training and testing. Journal of Sports Sciencе, 24 (9), 919–932. [PubMed] Sporis, G., Jukic, I., Ostojic, SM., and Milanovic, D. (2009). Fitness profiling in soccer: Physical and physiological characteristics of elite players. Journal of Strength Conditioning Research, 23, 1947–1953. Trecroci, А., Milanović, Z., Rossi, A., Broggi, M., Formenti, D., and Alberti, G. (2016). Agility profile in sub‐elite under‐11 soccer players: is SAQ training adequate to improve sprint, change of direction speed and reactive agility performance? Research In Sports Medicine, 24 (4), 331‐340.
International Scientific Conference
DIFFERENCES IN SPEED AND BODY COMPOSITION OF BASKETBALL PLAYERS DEPENDING ON THEIR POSITION IN THE TEAM Milan Mitić1, Miodrag Kocić 1, Dragana Berić 1, Dragan Radovanović 1 and Borče Daskalovski2 The Faculty of Sport and Physical Education, University of Niš
1 2
Faculty of Physical Education, Sport and Health, University of Skopje, Republic of Macedonia Milan Mitić, Miodrag Kocić , Dragana Berić , Dragan Radovanović and Borče Daskalovski
UDC 796.323:52‐68
SUMMARY During a game of basketball the players are susceptible to different demands of offense and defense considering the characteristics of the game. To achieve top results in basketball, it is necessary to select the players with particular predispositions and characteristics. Basketball is comprised of a variety of fast, explosive and agile movements. The body composition of the players is different and it largely depends on the position in a team. However, it should be understood that there is no ideal body composition universal to all the sports. The sample of 15 players was divided into three groups depending on the position in a team (guards, forward and centres). The parameters which were the focal points of the research were the differences in speed (Shuttle Test, Sprint Fatigue Test and the Sprint Speed Test in 15m) and the body composition (applying the direct segmental multi‐frequency method, using the InBody 770 analyzer). The differences between the players depending on their team position were established by ANOVA analysis for the independent samples and the subsequent Post hoc analysis. The results obtained show that there are no differences in speed. The most notable differences in the body composition between the players and in relation to the position they play are between guards and wings as are between guards and centres. Keywords: basketball players, body composition, speed, the position in the team, differences.
INTRODUCTION For the top results to be achieved in basketball, it is important to establish which characteristics, features and abilities should the players possess. It is also necessary to select those players who have special predispositions (such as those who run fast, jump high and do quick directions changes) which are manifested during the period of growth and development (Popović, Smajić, Molnar and Mašanović, 2009). Basketball has intensively developed over the time and nowadays it is one of the most dynamic sports which requires perfect forms and work methods that can produce results in the near future. The structure of basketball is comprised of fast, explosive and agile movements (short sprints, quick stops and speeding up, direction changes, various types of jumping, passing and throwing the ball) (Nikolić, Kocić, Berić & Jezdimirović, 2015; Nikolić, Berić, Kocić & Daskalovski, 2016). The fact is that ideal body composition and physiological requirements are not sufficient for achieving top results in basketball
(Ransone, 2016). Players' body composition differs depending on the position in the team (Jesús Ramos‐Campo et al., 2014). The body composition is the estimate of the subcuttaneous fatty tissue as well as muscular and bone mass in the body (Mišigoj‐ Duraković et al, 1999). The body composition is defined as a relative proportion between the fats and the body mass (ACSM, 2005). Basketball, as a physically challenging game, depends on numerous motor abilities, including the speed of running. In order to increase the result values of short sprints, plyometric training is used, being efficient and easily applicable (Asadi et al., 2016). It has been estimated that top basketball players cover the distance between 3500 and 5000m during a game (Janeira & Maia, 1998). It has also been shown that a player does around 1000 two‐minute‐long activities per game (Abdelkrim, El Fazaa, & El Ati, 2007). Speed is the ability important for the players regardless of the position in the team, with the aim of accelerating the transition between offense and defense (Nikolić, 2016). A professional basketball player
93
Fis Communications 2018 does one or two‐second‐long sprints 105±52 times per game (Castagna et al., 2009). The research conducted in Australian National Basketball League games by McInnes et al. (1995) shows that the longest sprint was 5.5 seconds, that 5% of all the sprints were longer than 4 seconds, whereas the largest number of sprints (51%) was between 1.5 and 2 seconds. On average, the sprints lasted for 1.7 seconds. Basketball is the game of tall people who should play in the positions under the basket (positions 4 and 5). These players should undergo special speed developing training (Jakovljević, Karalejić, Pajić & Mandić, 2011). The analysis of the game characteristics, the number of players who take part, the size of the court has shown that for achieving top results the players need to move with unabated dynamics and movement control, with the aim of getting into the most favourable position for the successful ending of the action (Kuliš, 2010). That is the reason why speed development is crucial in modern basketball so it is essential to organize a special training process, starting from the youngest players to the senior categories (Trunić, 2007). Speed represents man’s ability to complete a frequency of movements over a certain period of time, or just one movement in the shortest period of time (Milenković & Simić, 2009). In basketball, speed is important for all players' positions. Backs/ Guards should be able to demonstrate speed and explosive abilities in all the aspects of the game. In offense, because they organize it (fast and secure passing the ball from the defensive to the offensive half of the court) and in defense, because they need to guard the opponent players (Kocić, 2007). Their greatest responsibility is to organize and control the game. Wings and center extort personal fouls and score points. The players in these positions should be able to score successfully not only from the inner but also from the outer positions. Defensive centers have the task to obtain rebounds by timely blocking while jumping. In offense, by timely demarking and positioning, they have the task to come closer to the basket , jump in defense and block (Kocić, 2007). Players’ speed differs depending on their positions in the team (Tsitskaris, Theoharopoulos & Garefis, 2003; Delextrat & Cohen, 2009) in that the playmakers and guards have better results when compared to the players in the center position. It has also been proven that the players of the higher‐ranking
competitions show better results when it comes to speed depending on the position they have in the team (Kocić, Berić, Radovanović & Simović, 2012). The aim of this research was to establish the differences in the body composition and speed in top basketball players depending on their positions in the team.
METHODS Subjects 15 basketball players of the basketball club "Konstantin" from Niš participated in this research. The examinees were divided into three groups as follows: guards (playmakers and shooting guards, 1 and 2), forwards and short post (3 and 4) and centers (5). The players of the basketball club "Konstantin" compete in the Serbian Second National League in the 2018/ 19 season.
Procedure The body composition was measured by InBody 770 analyzer which uses the direct segmental multi‐frequency method (Direct Segmental Multi‐frequency – DSM method) of the bioelectric impedance analysis. The method uses a different frequency range from 1kHz to 1 MHz and the reactive measuring of the quantity or mass of all four major body components, water, fat, proteins and minerals, with the high degree of accuracy. Before the measuring all the examinees were given the recommendation to which they adhered (Radovanović & Đurašković, 2018). The following set of measuring instruments was used for estimating speed: 10х5m Shuttle Test (10X5m); Sprint Fatigue Test (SFT); 15m Sprint Speed (S15m). All the measuring instruments were taken from Topend Sports: http://www.topendsports.com/testing/tests/inde x.htm (in Nikolić, 2016).
Statistical analysis The differences between the players depending on their team position were established by ANOVA analysis for the independent samples (the statistical level of significance p 90% HRmax) with a fewer players (3 vs. 3) might lead to an increased risk of adverse cardiac event. This brief review has demonstrated that, with the exception of football, other team sports have not been investigated thoroughly. Although, recreational basketball and handball may lead to broad‐spectrum health benefits (Póvoas et al., 2017; Randers et al., 2018b) little evidence is available considering acute physiological demands during SSG. Therefore, future research should examine the influences of manipulating variables
Babraj, J. A., Vollaard, N. B., Keast, C., Guppy, F. M., Cottrell, G., & Timmons, J. A. (2009). Extremely short duration high intensity interval training substantially improves insulin action in young healthy males. BMC Endocrine Disorders, 9(1), 3. Casamichana, D., & Castellano, J. (2010). Time– motion, heart rate, perceptual and motor behaviour demands in small‐sides soccer games: Effects of pitch size. Journal of Sports Sciences, 28(14), 1615‐1623. Cvetković, N., Stojanović, E., Stojiljković, N., Nikolič, D., Scanlan, A. T., & Milanović, Z. (2018). Exercise training in overweight and obese children: Recreational football and high‐intensity interval training provide similar benefits to physical fitness. Scandinavian Journal of Medicine and Science in Sports, 28(1), 18‐32. Dellal, A., Hill‐Haas, S., Lago‐Penas, C., & Chamari, K. (2011). Small‐sided games in soccer: amateur vs. professional players' physiological responses, physical, and technical activities. The Journal of Strength and Conditioning Research, 25(9), 2371‐2381. Halouani, J., Chtourou, H., Gabbett, T., Chaouachi, A., & Chamari, K. (2014). Small‐sided games in team sports training: A brief review. The Journal of Strength and Conditioning Research, 28(12), 3594‐3618. Helgerud, J., Engen, L. C., Wisløff, U., & Hoff, J. (2001). Aerobic endurance training improves soccer performance. Medicine and Science in Sports and Exercise, 33(11), 1925‐1931. Hill‐Haas, S. V., Dawson, B., Impellizzeri, F. M., & Coutts, A. J. (2011). Physiology of small‐sided games training in football. Sports Medicine, 41(3), 199‐220. Katis, A., & Kellis, E. (2009). Effects of small‐sided games on physical conditioning and performance in young soccer players. Journal of Sports Science and Medicine, 8(3), 374‐380. Kelly, D. M., & Drust, B. (2009). The effect of pitch dimensions on heart rate responses and technical
253
Fis Communications 2018 demands of small‐sided soccer games in elite players. Journal of Science and Medicine in Sport, 12(4), 475‐479. Krustrup, P., Aagaard, P., Nybo, L., Petersen, J., Mohr, M., & Bangsbo, J. (2010). Recreational football as a health promoting activity: a topical review. Scandinavian Journal of Medicine and Science in Sports, 20, 1‐13. Milanović, Z., Pantelić, S., Čović, N., Sporiš, G., & Krustrup, P. (2015). Is Recreational Soccer Effective for Improving V˙O2 max? A Systematic Review and Meta‐ Analysis. Sports Medicine, 45(9), 1339‐1353. Milanović, Z., Pantelić, S., Čović, N., Sporiš, G., Mohr, M., & Krustrup, P. (2018). Broad‐spectrum physical fitness benefits of recreational football: a systematic review and meta‐analysis. British Journal of Sports Medicine, bjsports‐2017‐097885. Milanović, Z., Sporiš, G., & Weston, M. (2015). Effectiveness of high‐intensity interval training (HIT) and continuous endurance training for VO 2max improvements: a systematic review and meta‐analysis of controlled trials. Sports Medicine, 45(10), 1469‐1481. Nybo, L., Sundstrup, E., Jakobsen, M. D., Mohr, M., Hornstrup, T., Simonsen, L., Bulow, J., Randers, M., Nielsen, J., Aagaard, P., & Krustrup, P. (2010). High‐ intensity training versus traditional exercise interventions for promoting health. Medicine & Science in Sports and Exercise, 42(10), 1951‐1958. Póvoas, S. C., Castagna, C., Resende, C., Coelho, E. F., Silva, P., Santos, R., Seabra, A., Tamames, J., Lopes. M., . . Randers, M.B., & Krustrup, P. (2017). Physical and physiological demands of recreational team handball for adult untrained men. BioMed Research International, doi10.1016/j.jshs.2017.09.007. Rampinini, E., Impellizzeri, F. M., Castagna, C., Abt, G., Chamari, K., Sassi, A., & Marcora, S. M. (2007). Factors
254
influencing physiological responses to small‐sided soccer games. Journal of Sports Sciences, 25(6), 659‐666. Randers, M., Andersen, T. B., Rasmussen, L., Larsen, M., & Krustrup, P. (2014a). Effect of game format on heart rate, activity profile, and player involvement in elite and recreational youth players. Scandinavian Journal of Medicine and Science in Sports, 24, 17‐26. Randers, M. B., Hagman, M., Brix, J., Christensen, J. F., Pedersen, M. T., Nielsen, J. J., & Krustrup, P. (2018b). Effects of 3 months of full‐court and half‐court street basketball training on health profile in untrained men. Journal of Sport and Health Science, 7(2), 132‐138. Randers, M. B., Nielsen, J. J., Bangsbo, J., & Krustrup, P. (2014b). Physiological response and activity profile in recreational small‐sided football: No effect of the number of players. Scandinavian Journal of Medicine and Science in Sports, 24, 130‐137. Randers, M. B., Nybo, L., Petersen, J., Nielsen, J. J., Christiansen, L., Bendiksen, M., Brito, J., Bangsbo, J., Krustrup, P. (2010). Activity profile and physiological response to football training for untrained males and females, elderly and youngsters: influence of the number of players. Scandinavian Journal of Medicine and Science in Sports, 20, 14‐23. Randers, M. B., Ørntoft, C., Hagman, M., Nielsen, J. J., & Krustrup, P. (2018a). Movement pattern and physiological response in recreational small‐sided football–effect of number of players with a fixed pitch size. Journal of Sports Sciences, 36(13), 1549‐1556. Stojanović, E., Stojiljković, N., Scanlan, A. T., Dalbo, V. J., Berkelmans, D. M., & Milanović, Z. (2018). The activity demands and physiological responses encountered during basketball match‐play: A systematic review. Sports Medicine, 48(1), 111‐135.
International Scientific Conference
HOW TO MOTIVATE ELDERS TO ENGAGE IN PHYSICAL ACTIVITY Oliver Radenković1, Milanka Radenković2 Izet Kahrović1, Benin Murić1, Vladan Milić1 and Omer Špirtović1 The State University of Novi Pazar, Department of Biomedical Science, The Sport and Physical Education program, Novi Pazar, Serbia;
1
2
Primary school “Rastko Nemanjić”, Novi Pazar, Serbia;
Oliver Radenković, Milanka Radenković, Izet Kahrović, Benin Murić, Vladan Milić and Omer Špirtović
UDC 796.015.132‐053.9 796:313.628
SUMMARY The interest towards exploring a more active lifestyle, ie. being physically active at an older age, as one of the key components of a healthier way of life with elders is viewed through interdisciplinary scientific research. Unless elders lead an active lifestyle, they expose themselves to the risk of reduced muscle mass, functional mobility, and with that the social surroundings will view people of the older age group as helpless and “socially less valuable”, which will in turn create a psychological barrier in terms of further development and adaptation. Physical activity with elders over 65 years of age has shown to be a key factor in maintaining a desirable health condition with individuals from the aspect of primary medical care and the primary care of mental health at an older age. Research used to discuss this topic, which have studied the effect of motivation on physical activity, as well as changes that occur within the cognitive functions due to exercise at an older age, were analyzed and presented in this paper. Keywords: older age, physical activity, motivation
INTRODUCTION Motivation to participate in sports activities is a well researched topic with the aim of finding a model which will inspire a wider population to go from a passive to a more physically active way of life. In the last twenty years, aside from the general interest in this phenomenon, the interest to research a more active lifestyle has risen, ie. being physically active at an older age. Researchers were also interested not only about the functional changes which occur in the body, but also about the psychological changes which influence mental and physical health at an older age. Physical exercise is one of the pivotal components of a healthy lifestyle. It is hard to find a method which would be more useful to elders in all segments of mental and physical health, from an adequate physical activity and recreational standpoint. When an appropriate intensity, duration, frequency, type and purpose of a physical activity is determined, it can be applied from the earliest to the latest stage of life (Radenković, 2016). Regular exercise is one of the most natural methods of preserving bodily vitality, preventing
and reducing development of chronic and degenerative changes and diseases which appear with aging of the body (Andrijašević, M., & Andrijašević, M., 2006), however it is often the case with elders that this segment lacks motivation and interest the most (Bogdan & Babačić, 2016). It is obvious that psychological factors which determine positive healthy behavior, as well as awareness of one’s own health and its changes, in today’s sedentary and fast paced way of life are often not developed enough to produce positive health habits, such as dedications to physical activity (Prelog, 2017). One of the reasons for this is the human tendency to conformity, as well as avoiding physical strain and discomfort which muscle activity will produce (Andrijašević, 2010). One’s social surrounding often perceives the elderly as powerless and “socially less usefull”, which in turn makes the elderly form a psychological barrier towards developing and adaptation of certain abilities and qualities in life (Skinner, 1983). From the aspect of primary medical care and primary care of mental health, especially at an older age, physical activity should be the main way of maintaining the desired health condition of an individual, ie. society in general.
255
Fis Communications 2018 This is at the same time the most economically acceptable way of preserving health, so with necessary intrinsic motivation it will not require a significant dedication of resources (Prelog, 2017). The secret to aging well is certainly in the positive approach to life (Habic, Đukić, & Marijanović. 2010). Regular physical activity can help the elderly reduce the risk of chronic diseases, help maintain the illnesses they already have, help them function better both physically and mentally, to avoid injury like falling and to live longer independently (Bennet & Winters‐stone, 2011). Numerous research have shown that the number of falls increases by 35‐40% after the age of 60 and is the result of reduced muscle strength, balance, and flexibility (Hornbrook, Stevens, Wingfield, 1994; Hayes, Myers, Robinovitch, 1996). For example, intensity training with its many effects on strength, is safe and well accepted with healthy persons in their 80s, and causes adaptive neuromuscular change in physiological variables which are often connected to risk of falling and limits of one’s ageing (Caserotti, et al., 2008). Many physiological, as well as psychological falls find their source in the lack of activity, and as such can be avoided (Schwenk, 1999). Muscle mass and strength are reduced by 30‐50% between the ages of 30 and 80 (Daley, 2000). The main cause decline in muscle mass, muscle strength, motor functions and physical capabilities is the reduced number of muscle fibers (Caserotti, Aagaard, Larsen and Puggaard, 2008), as well as the limit to daily body activity (Milanovic, Pantelić, Sporiš, Krakan, & Mudronja, 2012). Research results show that muscle strength reaches its maximum in one’s 20s and 30s, and stays stable in one’s 40s, and that approximately 6% of muscle mass, and 12 to 14% of muscle strength is lost every ten years after reach 50 years of age, keeping in mind that it can be increased by 12% after several months of strength training (Lynch Metter & Lindle, 1999). Therefore, the main question is how to efficiently motivate people in their mature age to change their behavior and stay active as they age?
METHODS In order to better acquire quality material to support this topic, browsing was conducted through numerous electronic data bases: KOBSON, EBSCO, PubMed, ScienceDirect, SCIndex and Google Scholar. This research includes papers that relate to the elder population over 65 years of age. Searching was conducted with a combination of terms connected to physical exercise, motivation, intrinsic and extrinsic motivation, how to motivate the elderly to engage in physical exercise, cognitive functions with the elderly who engage in physical activity etc. Relevant studies were acquired after
256
detailed observation and after fulfilling the inclusion criteria. The descriptive method was used for the analysis of the acquired data.
RESULTS AND DISCUSSION According to the definition of the World Health Organization, older people are between 60 and 75 years of age, old people between 76 to 90 years of age, and very old people are those above the age of 90. (Papalia, Olds & Feldman, 1992). Psychological theories of ageing mostly support this definition. Jung was the among the first who, in the 30s of the 20th century, defined the periods of physical development, and he differentiated the period of youth which starts after puberty and lasts until one’s middle age (35‐40). After forty years of life, which he calls the “the noon of life”, comes the process of individuation, and it refers to a mature age of life. During that period a person will start to focus on themselves, become more aware of one’s self and start searching for a goal, a meaning, and wholeness of one’s own life (Birren & Schaie, 2001). The cognitive theory of adapting to ageing developed by Brandstadter (Brajković, 2010; Lacković‐Grgin, 2014) assumes the existence of three core forms of facing the perceived or expected developmental losses during this adaptation: assimilation, accommodation, and immunization. Successful ageing, according to this theory assumes the balance between these tree forms of confrontation, and in the context of this papers topic, assimilation sets itself aside as the confirmation of the previously mentioned need for physical activity at an older age. Assimilation represents the confirmation of man’s tendency to actively adjust or change according to his life situation, so that it better suits his personal goals and possibilities. For example, and older person will still engage in physical exercise, but instead of intensity training he or she will take walks outdoors. Cognitive abilities will inevitably go through changes during one’s life, and regular physical activity reduces the risk of dementia and weakening (cognitive decline) of cognitive abilities (Yaffe, Barnes, Nevitt, Lui, & Covinsky, 2001), as well as cognitive degeneration (cognitive impairment) at an older age (Laurin, Verreault, Lindsay, MacPherson, Rockwood, 2001). Certain studies claim that reduced physical activity and mobility in general increase the risk of failing cognitive functions (Keysor, 2003). Experimental research (Colcombe, Kramer, 2003) with the elderly show that even one aerobic training session can temporarily improve memory, attention, and reaction time. It is still impossible to describe in detail which exercise program would have the most benefit to physical and cognitive
International Scientific Conference functions at an older age (Yaffe, et al., 2001), also, motivation to engage in sports activities is a well researched topic with the aim of finding a model which will inspire a wide population of people to change from a passive to a physically active life style (Bogdan & Babačić, 2016). Motivation can be portrayed as a collection of impulses or needs of an individual which require action or initiation in order to achieve a goal. It doesn’t matter what acquired knowledge and competence one may possess, if there is no motivation, it is hard to assume that the desired results will be achieved (Horga, 1993). Motivation is the inner moving force which supplies us with the power needed to achieve goals and satisfy needs. Extrinsic motivation (Sansone & Harackievicz, 2000) is characterized and moved by the desire to achieve outer rewards, recognition. With this kind of motivation, rewards like trophies and material gain push the individual to try harder and dedicate oneself while achieving one’s desired goals, but it is not without its limits. Opposite to this, intrinsic motivation could be defined as a collection of inner factors which affect the individual in a way where the desire to achieve a goal comes from within themselves (Petz, & Ivanović, 1987), without necessarily aiming towards achieving an outward kind of reward. In the beginning, motivation starts of as extrinsic, and later it gradually grows into its intrinsic variant. Intrinsic motivation is of extreme importance when it comes to achieving supreme goals, expecially in creative, non routine jobs. It is of key importance with athletes and recreational athletes, especially in individual sports. Bogdan et. al (2016) state that extrinsic factors such as pay, bonuses, medals, recognition and other outside rewards result in positive outcome when it comes to routine work. Inner motivation and self‐imposed extrinsic motivation inspire activity with elders, and after a motivated workout, positive factors that surface with research candidates are health and fitness, social/emotional advantages, weight management, stress management, enjoyment and physical appearance (Dacey, Baltzell & Zaichowsky 2008). In order to analyze the influence of motivation for sports and exercise, a survey research was conducted on a sample of 200 people. The goal of the research was to examine the intrinsic and extrinsic factors that influence motivation for participation in sports activities in relation to age. People if the 20‐40 age group view sports activities as a lifestyle. With persons of 40 to 60 and 60 and above, sports and exercise is generally practiced for health reasons. With people of 60 years of age and older, survey candidates who engage in no physical activity claim the main reason is lack of interest for sports and physical exercise. Of the
most common reasons to avoid sports and exercise for the 20 to 40 and 40 to 60 years of age sample, the most important ones were lack of time and motivation, which confirms some results of previous research on the same topic (Bogdan & Babačić, 2016). Similar results, in connection to the age group of 60 to 80 years of age, were noted by Milanovic et. al (2012), where the authors have concluded that with ageing the interest for sports and participation in physical activities significantly drops. However, even though the interest in participating in physical activities drops with one’s age, the recommended amount of exercise for the elderly is the same as with adults aged 18‐64, at least 150 minutes a week (around 30 minutes 5 days a week) of physical activity of medium intensity (Bennett & Winters‐Stone, 2011). Unless people at an older age lead an active lifestyle in terms of physical activity, they expose themselves to risk of reduced muscle mass, but also reduced functional mobility (Milanović, et al., 2012). The effects of circular training on the body of the elderly who exercise, in comparison to the elderly that don’t, are visible through: a) higher maximum aerobic capacity; b) better economy of breathing, higher maximum volume of breathing; c) lower heart frequency in a state of stagnancy and intensity; the possibility of achieving higher heart frequency during activity; d) lower tendency for irregular heart rhythm; e) lower blood pressure in a state of stagnancy and intensity; f) better heart economy and function; g) bigger absolute muscle force; h) lower levels of lactic acid during body strain, (Medved, et al. 1987., prema Andrijašević, M., & Andrijašević, M., 2006). Certainly all the above mentioned positive results can be expected if all the criteria of physical activity are met, which foremost refer to an adequate intensity level, regularity in exercise according to one’s age. Bennet & Winters‐Stone (2011) came up with some interesting results after a comparative study about whether motivation with elders is influenced more by an eight‐week group cognitive behavioral therapy, or an individual approach. Long‐term effects on motivation to exercise are achieved by one individual motivational session and 15 booster telephone calls, delivered by phone or computer, and this includes a big percentage of participants who fulfill the desired levels of physical activity, compared to a group which was motivated by group KBT or a control group. Moreno‐Murcia, Belando, Huescar, & Torres (2017) have researched the predictive relationship between perceived social support (by an instructor/trainer, and family), psychological needs, intrinsic motivation, health goals, regular physical activity and the satisfaction in life with a
257
Fis Communications 2018 group of physically active women aged 18 to 82. These women have done aerobic, pilates, turns, strength training, and swimming three times a week, with a minimum of six months. The results have shown that there is a positive relationship between the perceived support autonomy (social support) and psychological needs, which are positively linked with intrinsic motivation. Intrinsic motivation is also linked with health goals (resistance to illness), which is positively lined to regular physical activity, and finally, physical education, ie. education about the importance of physical activity, have shown a positive relationship with the satisfaction in life. The results of this study have shown the need for social‐cognitive physical interventions in order to maximize the advantages of physical exercise with women.
CONCLUSION The question how to efficiently motivate the elderly to change their behavior and stay active as they age provided no concrete answer, but some recommendations are in order based on the research we have analyzed. The secret to good ageing is in a positive approach to life. Many physiological and psychological falls are due to physical inactivity and as such can be prevented. Motivation with people at an older age for physical activity, and especially intrinsic motivation, is positively linked with health goals, ie. resistance to illness, and education about the importance of physical activity at this age has a positive relationship with satisfaction in life. Physical activity has a positive influence on the prevention of developing disease and illness, and positive health attitude, but also on the psychological health and the integration of the elderly into society. Inactivity has a much higher effect on ageing than any other physiological factor. Research shown and theories which were covered by this paper state that any well dosed regular physical activity with adequate intensity and length will have positive results on psycho‐ physical health of adults aged 65 and up, rather than inactivity. We must certainly determine the motivational mechanisms which will inspire this age group that engages in no physical activity to start engaging in some. The stated conclusions could indeed serve as a guideline to future planning and programming of physical exercise and activity for the elderly and how to better motivate them to pursue them.
REFERENCES Andrijašević, M., & Andrijašević, M. (2006). Sportska rekreacija–faktor kvalitet života osoba starije životne
258
dobi. 15. ljetna škola kineziologa Republike Hrvatske, 266‐270. Andrijašević, M. (2010). Kineziološka rekreacija. Kineziološki fakultet Sveučilišta u Zagrebu, str. 15‐371. Birren, J.E., Schaie, K.W., (2001). Handbook of the Psychology of Aging. New York:Academic Press. Bennett, J. A., & Winters‐Stone, K. (2011). Motivating older adults to exercise: what works? Age and Ageing. 40(2), 148–149. Bogdan, A., & Babačić, D. (2016). Intrinzična i ekstrinzična motivacija za sport i vježbanje u funkciji dobi. Zbornik radova Međimurskog veleučilišta u Čakovcu, 6(2), 21‐34. Brajković, L. (2010). Pokazatelji zadovoljstva životom u trećoj životnoj dobi (doktorska dizertacija). Zagreb: Medicinski fakultet Sveučilišta u Zagrebu. Caserotti, P., Aagaard, P., Larsen, J.B., Puggaard, L. (2008). Explosive heavy resistance training in old and very old adults: changes in rapid muscle force, strength and power. Scand J Med Sci Sports,18(6): 773‐82. Colcombe S, Kramer AF. (2003). Fitness effects on the cognitive function of older adults: a meta‐analytic study. Psychol Sci.;14(2):125–30. Daley, M. J., & Spinks, W. L. (2000). Exercise, mobility and aging. SportsMedicine, 29(1), 1‐12 Dacey, M., Baltzell, A., & Zaichkowsky, L. (2008). Older adults' intrinsic and extrinsic motivation toward physical activity. American Journal Of Health Behavior, (6), 570. Habic, V., Đukić, M. M., & Marijanović, M. R. (2010). Fizička aktivnost osoba posle pedesete godine starosti ‐ Physical activity for people after the age of fifty. Alfa univerzitet . Fakultet za menadžment u sportu, 42. Hayes, W.C., Myers, E.R., Robinovitch, S.N. (1996). Etiology and prevention of age‐related hip fractures. Bone 18, 77‐86S. Hornbrook, M.C., Stevens, V.J., Wingfield, D.J. (1994). Preventing falls among community dwelling older persons: results from a randomized trial. Gerontologist, 34, 16‐23. Horga, S. (1993). Psihologija sporta. Fakultet za fizičku kulturu Sveučilišta u Zagrebu. Keysor, J.J. (2003). Does late‐life physical activity or exercise prevent or minimize disablement? A critical review of the scientific evidence. Am J Prev Med.;25(3 Suppl 2):129–36 Lacković‐Grgin, K. (2014). Novo u psihologijskim razvojnim teorijama: Modificiranje ranijih, te formuliranje i provjera novih teorija i koncepata. Suvremena psihologija, 17(2), 199‐227. Laurin D, Verreault R, Lindsay J, MacPherson K, Rockwood K. (2001). Physical activity and risk of cognitive impairment and dementia in elderly persons. Arch Neurol.;58(3):498–504 Lynch, N.A., Metter, E.J., Lindle, R.S. (1999). Muscle quality I: ageassociated differences in arm vs leg muscle groups. Journal fo Applied Physiology, 86 (1), 188‐94. Milanović, Z., Pantelić, S., Sporiš, G., Krakan, I., & Mudronja, L. (2012). Razlike u nivou tjelesne aktivnosti kod muškaraca i žena preko 60 godina starosti. In Intenzifikacija procesa vježbanja u područjima edukacije, sporta, sportske rekreacije i kineziterapije. 21. ljetna škola kineziologa Republike Hrvatske. Moreno‐Murcia, J. A., Belando, N., Huéscar, E., & Torres, M. D. (2017). Social support, physical exercise
International Scientific Conference and life satisfaction in women. Revista Latinoamericana de Psicología, 49(3), 194‐202. Papalia, D. E., Olds, S. W., & Feldman, R. D. (2007). Human development. New York: McGraw Hill. Petz, B., & Ivanović, Z. (1987). Psihologija rada. Školska knjiga. Prelog, D. (2017). Važnost tjelesne aktivnosti osoba starije životne dobi. (Doctoral dissertation, University North. University centre Varaždin. Department of Nursing.). Radenković, O. M. (2016). Efekti vežbanja sa opterećenjem na mišićni potencijal studenata.(Doktorska disertacija, Univerzitet u Nišu, Fakultet sporta i fizičkog vaspitanja).
Sansone, C., & Harackiewicz, J. M. (Eds.). (2000). Intrinsic and extrinsic motivation: The search for optimal motivation and performance. San Diego: Academic Press. Skinner, B. F. (1983). Intellectual self‐management in old age. American Psychologist, 38(3), 239. Schwenk, T. L. (1999). Rejuvenating patients—One step at a time. The Physician and sportsmedicine, 27(11), 3‐8. Yaffe, K., Barnes, D., Nevitt, M., Lui, L. Y., & Covinsky, K. (2001). A prospective study of physical activity and cognitive decline in elderly women: women who walk. Archives of internal medicine, 161(14), 1703‐1708.
259
Fis Communications 2018
PHYSICAL ACTIVITY LEVELS OF THE STUDENTS OF THE UNIVERSITY OF NIŠ Emilija Petković1, Branislav Dragić1 , Ana Lilić1 and Ana Stanković1 University of Niš, Faculty of Sport and Physical Education
1
Emilija Petković, Branislav Dragić, Ana Lilić and Ana Stanković
UDC 796.01(497.11)
SUMMARY The aim of the research is to determine if there is a difference in the level of physical activity of students of four faculties of the University of Niš. The research includes students from the Faculty of Philosophy, Law, Economics and the Faculty of Electronic Engineering. The subject matter of research is a student population whose curricula do not include physical education classes. The results obtained in the analysis of differences in physical activity among students of the Faculty of Economics and Faculty of Philosophy indicate that there is a significant difference in the level of the students' physical activity. Based on the completed testing, we can conclude that there are no significant differences in the level of physical activity among the students of the Faculty of Law and Faculty of Philosophy, while in the case of the students of the Faculty of Electronic Engineering and Faculty of Philosophy we can conclude that the former are a little less active than the latter. Based on our analysis, it can be concluded that students of the Faculty of Law showed a significantly higher level of activity at work, while the least active students of the Faculty of Electronic Engineering were active during their commute. When it comes to household activities, students of the Faculty of Economics showed an enviable level of activity, while students of the Faculty of Philosophy were more active during their free time. On the basis of the obtained results it can be established that there is a significant difference in the level of physical activity among the students of the University of Niš. Keywords: research, students, level of student’s physical activity, results, testing
possible. Furthermore, physical activity is closely related to mental health and well‐being Taking part in physical activities can cause (Andrijašević et al, 2005). Physical culture is a very certain changes in the psycho‐physical health of an broad concept which includes all forms of physical individual. Contrary to that, not taking part has activities in the field of physical education in either a minimal positive effect on the physical and educational institutions ranging from preschools psychological health of people, or none at all. As a to universities, elite sport activities, recreational result, the World Health Organization sport, and kinesitherapy. Physical culture also (http://www.who.int/) and International includes complexes of sports facilities, and the Federation of Sports Medicine equipment and props necessary for the realization (http://www.fims.org/) expressed concern that of physical activities. Physical education as a approximately one half of humanity is not constituent part of physical culture has a sufficiently physically active. It is the biological‐health related, educational and bio‐ recommendation of these organizations to put motor influence on the body. This influence is very emphasis on regular physical activity which should prominent among children and youths since become the basis for a healthy lifestyle. Children systematic and programmed physical exercise has and adolescents should be given the opportunity to a stimulating effect on a young body at the age of participate in programmed activities, so that adolescence, particularly on proper growth and regular physical activity will become a life‐long psycho‐physical development (Nikolić, 2005). habit. Regular physical activity of an individual These kinds of physical activity significantly should gradually increase with the aim of influence the proper development and normal achieving at least 30 min of physical activity of functioning of internal organs, especially the moderate intensity. Scientific findings and facts on cardio‐vascular and respiratory system, the the positive health effects of physical exercise in all movement apparatus, the functions of the age categories should be popularized as much as endocrine system and the organs which take part metabolic processes. All these positive influences
INTRODUCTION
260
International Scientific Conference of physical activity increase the defense mechanism of the human body. Physical education also has a positive influence on the development of a series of personality features: determination, independence, fine motor skills, agility in time and space, persistence, etc. Physical activity, in addition to having a positive influence on the transformation of human motor skills, influences the development of the esthetic component of proper exercise. In addition to the physical experience, there is also a subjective sense of satisfaction which is manifested through the esthetic component of human movement. In their research, Helou et al. (2017) wanted to determine that the validity and reliability of the adapted Arabic version of the IPAQ long form was equivalent with the French version used when studying the Lebanese population. The sample participants consisted of 159 students and staff members of the University of Beirut, who had randomly been selected to take part in the study. The indicators of physical activity were derived from the questionnaire and were compared to the body mass index of the participants for validity construction. In the research on the questionnaire’s reliability and validity for a Malaysian population performed by Chu & Moy (2015), the questionnaire was administered twice over a period of one week so as to evaluate the reliability of the test. The validity of the criteria was determined between the questionnaire and a seven‐day physical activity program. In total, 81 adults participated in the study. The aim of the research carried out by Minetto et al. (2017) was to determine the level of validity and applicability of the long and short form of the Italian version of the questionnaire. The research of Lee et al. (2011) included 23 confirmed studies on the validity of the short form of the IPAQ. Hallal et al. (2010) studied the ten‐year use of the IPAQ in Brazil and Columbia.
METHODS In this research we used the International Physical Activity Questionnaires – IPAQ, which was developed by experts in 1997. This questionnaire was designed to facilitate solving the problem of evaluating the level of physical activity on a global level (Craig, Marshall, Sjostrom, Bauman, Booth, Ainsworth et al., 2003). It refers to the physical activities which are performed during the course of one week. The IPAQ evaluates frequency, duration and intensity of physical activity of adults aged 18 to 65, in four domains: leisure time physical activity; physical activity in the home and garden; physical activity at work, and physical activity during the commute to work.
There is an International Physical Activity Questionnaire Long Form – IPAQ – LF and International Physical Activity Questionnaire Short Form – IPAQ – SF. Research which has been carried out using this questionnaire has indicated that the long form is very adaptable and applicable in all cultures and languages, and that it has an acceptable level of reliability and validity (Hallal et al, 2010, Lee et al., 2011, Helou et al., 2017, Minetto et al., 2017, Kregisar, 2003; Van Holle et al, 2015; Milanović et al, in press). The questionnaire is being used in approximately 70 countries and is available in several languages. It has been proved to be reliable and valid. The questions are structured so that they allow separate scoring for walking, moderate physical activity, and physical activity of high intensity. The calculation of the overall result requires a summation of the duration (in minutes) and frequency (days) of walking, moderate and high intensity physical activity. The subject matter of the research was a student population of the University of Niš, whose curricula does not include physical exercise as either an obligatory or elective course. The research problem was the evaluation of the level of physical activity of the student population of the University of Niš, which was studied by a questionnaire for the self‐evaluation of physical activity (IPAQ – long form). The aim of this research was to determine whether there was a difference in the level of physical activity of the students attending four faculties of the University of Niš whose curricula did not include physical education. The research included students from the Faculty of Philosophy, Economics, Law and Electronic Engineering of the University of Niš. The age of the participants was included in the questionnaire, but the age difference was only one year ± 6 months, and so was negligible, while the duration of study was not determined in the questionnaire. The only studied difference that could have an effect on the level of physical activity among the students was their faculty of choice. The sample of participants in this study consisted of 109 students who attend four faculties of the University of Niš: the Faculty of Philosophy, Economics, Law and Electronic Engineering. The participants were randomly selected and voluntarily agreed to participate in the study, after they had been informed of the idea behind the project which had originated from the Faculty of Sport. The sub‐sample of students attending the Faculty of Economics was 30 (age 23 yrs ± 0,6 months), of Electronic Engineering was 30 (age 21 yrs ± 0,6 months), of Law was 25 (age 20 yrs ± 0,6 months) and of Philosophy was 24 (age 22 yrs ± 0,6 months).
261
Fis Communications 2018 All of the students attended only one of the aforementioned faculties, which provides sub‐ sample independence based on the students’ faculty of choice. Once the responses provided by the participants were collected, all of the values were expressed as hours and minutes over the course of one week and converted to values of metabolic equivalents (МЕТ) expressed in hours per week. To evaluate physical activity, the measuring instrument that was used was the IPAQ – long form. The Serbian version of this questionnaire can be found on the site of the Sports and Sports Medicine Association of Serbia (http://www.usms.rs/kontent/stranicy/podaci_i_s tatistika_ipaq/upitnik.pdf) and the site (http://www.usms.rs/index.php?jezik=la&strana= podaci_i_statistika_ipaq), which is the version used in this research. The research was carried out with the approval of the relevant authorities of the University of Niš. The participants filled out the questionnaire immediately prior to one of their regular classes at their respective faculties in May 2017. The values for each response given on the IPAQ should be calculated according the criterion provided in this section. After scoring, a numeric value is obtained which allows further data processing. This processing was carried out at the univariate level, with the basic descriptive statistics (arithmetic means, medians, minimal and maximal values, standard deviations). To test the normality of the distribution, considering that each group has fewer than 50 participants, the Shapiro‐ Wilk test of normality was used. Statistical analyses were carried out using the statistical package SPSS (v. 20), at the level of significance of р ≤0.05.
RESULTS The aim of this research was to determine whether there were any differences in the level of physical activity of the students from four faculties of the University of Niš whose course curricula does not include physical education classes: the Faculty of Philosophy, Economics, Law, and Electronic Engineering. With the aim of evaluating the alternative hypotheses, the task was to compare the differences in the level of physical activity of students attending different faculties in pairs, which required the use of appropriate techniques for comparing independent groups of participants. Considering the fact that in most cases the hypothesis of the normality of distribution was rejected, the recommendation of the IPAQ scoring protocol was that all the indicators be presented as metabolic equivalents (МЕТ) in hours per week, and that all the comparisons be made at the level of the median, as
262
the measure of central tendency. A comparison of the medians proved the better choice due to their decreased sensitivity to extremely small and large values, which was not the case with the average value of the sample. In such cases non‐parametric techniques are used, and so to compare the levels of physical activity in this case we used the Mann– Whitney test. This test is used to evaluate the differences between two independent groups on a continuous rating scale. The values of the data on a continuous rating scale are transformed into ranks, and then an analysis is performed to determine whether there are significant differences between these ranks. The measure of central tendency is the median, and not the means of the data, so for this test the actual distribution of the data is not important. To accept or reject the set hypotheses is a decision made after the statistical processing of the data in a series of steps. At the very beginning, descriptive statistics were determined for all the variables (arithmetic means, medians, minimal and maximal values, standard deviations). Skewness and kurtosis were also used to indicate data distribution. Skewness indicates an asymmetric distribution. In the case of a symmetric distribution, the value of this indicator is zero. A negative sign indicates that most of the data is located to the right of the means, while a positive sign indicates that most of the data are located in the smaller value section. The kurtosis indicates whether the distribution is platykurtic or leptokurtic. The value of kurtosis for a normal distribution is 3, but most programs are set to calculate a modified kurtosis value, where the value 3 is deducted from the calculated value, which is why positive values indicate a greater leptokurtic distribution, and negative values a greater platykurtic distribution. To test the normal distribution of the data, considering that each group has fewer than 50 participants, the Shapiro‐ Wilk test of normality was used. Finally we provided a comparison of the levels of activity by using a technique used to determine inter‐group differences by analyzing the variance. Just like in the comparison of faculties in pairs, here also the recommended comparison is of medians. For this comparison we use the non‐parametric Kruskal – Wallis test. This test is analogous to the Mann – Whitney test, but allows the comparison of several independent groups of participants. The variables which are used to compare the levels of physical activity of the students of the University of Niš are the values of the level of activity expressed as МЕТ hours per week, viewed in four categories of physical activity: activities at work, activities during the commute, household activities (activities in the home and garden) and leisure
International Scientific Conference time activities (recreation, sport and other activities). If we would like to accept or reject the alternative hypotheses, we should compare, in pairs, the levels of activity of students in various everyday activities (work, commute, household activities, and leisure activities). To test all the alternative hypotheses, we will use the non‐ Table 1. Physical activity in МЕТ hours/per week Faculty Philosophy Economics Law
parametric Mann‐Whitney test. Table 2. provides the values of the medians of the studied groups presented in МЕТ hours per week, as well as the values of the 95% confidence interval for the median and the inter‐quartile range which represents the range from the first to the third quartile within which 50% of the data can be found.
Work
Commute
Household activities
Free time
Total
162,6 (19,8‐350,4) 254,4 22,7 (12,4‐33,0) / 242,1 (199,6‐331,8) 97,4
23,1 (16,5‐46,2) 31,4 29,0 (19,8‐41,2) 29,7 46,2 (39,6‐46,2) 29,7 19,8 (11,6‐23,10) 14,9 23,1 (21,6‐34,7) 29,7
17,9 (9,0‐45,0) 36,2 3,0 (3,0‐7,0) 4,0 18,0 (13,0‐37,0) 33,0 20,0 (12,0‐25,0) 15,9 14,0 (10,5‐20,0) 21,0
83,8 (23,1‐130,8) 116,7 35,1 (31,1‐47,6) 21,5 55,6 (31,6‐83,4) 68,0 24,4 (17,2‐66,2) 55,7 39,6 (31,6‐54,2) 57,3
132,8 (72,3‐346,8) 304,9 72,1 (65,2‐88,3) 27,8 201,9 (138,9‐354,6) 224,15 73,4 (47,9‐124,2) 117,3 93,8 (77,5‐112,4) 145,4
Electronic Engineering
108,0 (1,3‐147,8) 110,8
Entire sample
169,6 (96,0‐232,8) 188,1
Legend: In the fields one below the other in the following order we find: the median, 95% confidence interval, interquartile range. By analyzing the data in Table 1., we can note differences in the level of physical activities of the that the students of the Faculty of Economics are students, we used the Mann‐Whitney test. All the much less physically active at work; however, here alternative hypotheses will be tested based on the we should bear in mind that only two of the differences in the levels of physical activity in all participants responded that they were employed, fields, as well as the levels of overall physical which makes for a very small sample. In addition, activity. we can note that the students attending this faculty Table 2. shows the results for the test of the are less involved in household activities. The differences in the level of physical activity of the students of the Faculty of Law are more dominant students of the Faculty of Economics and Faculty of in terms of physical activities at work and in terms Electronic Engineering. The Mann‐Whitney test of activities during their commute, while the determined that there was a statistically significant students of the Faculty of Philosophy are more difference in the activities of the students active during their leisure time. This general table attending these faculties in certain fields. The leads us to the conclusion that there are differences can be noted in the activities related to differences in the activities that students attending the commute and household activities, while no different faculties take part in. As a result, we will significant differences were noted for leisure time further analyze whether these differences are activities. statistically significant. To determine the Table 2. Differences in the level of physical activity of the students attending the Faculty of Economics and Faculty of Electronic Engineering Activity Work
Mann‐Whitney U 3,0
p – value ,242
Commute
256,0
,006***
Household activities
25,5
,000***
Free time
378,5
,660
Total
409,0
,544
Legend: *,**,***, indicate levels of significance of 10%, 5% and 1%, respectively.
263
Fis Communications 2018 However, even though the level of activities at work is greater in favor of one group, and in household activities in another, and in the overall result, which is viewed on the overall level of activities exhibited by these students, there is no
statistically significant difference (U=409,0, p=0,544>0,05). The following comparison is of the students of the Faculty of Economics and Faculty of Law . The results are shown in Table 3.
Table 3. Differences in the level of physical activity of the students attending the Faculty of Economics and Faculty of Law Activity Work
Mann‐Whitney U 0,0
p – value ,032**
Commute
280,5
,107
Household activities
51,5
,000***
Free time
247,5
,046**
Legend: *,**,***, indicate levels of significance of 10%, 5% and 1%, respectively. The test of the differences in the level of students of the Faculty of Economics (Md=3, activities of the students of the Faculty of n=17), compared to the students of the Faculty of Economics and Faculty of Law indicates that Electronic Engineering, participate in household except for activities related to the commute, in all activities only a little, and so this difference in other fields there are significant differences. relation to the students of the Faculty of Furthermore, the test which compares the overall Philosophy (Md=17,88, n=22), was here proved to levels of activity also indicates that the difference be significant. However, since the differences in the in the levels is significant (U=79,0, p=0,000 62.70 % decreasing with increasing age, from 66.3% in three‐year‐old children to 58.7% in five‐year‐olds. The authors explain this as a prevalence of a flat foot decreases during growth, and that the progress of development of the foot arch is faster for young children. This only suggests as well as confirms the assertion by many researchers that the timely detection of certain symptomatic signs that can be the basis for pathological progression and the creation of certain discomforts in this case a flat foot leads to stabilization, or to stop its progression. Szymanska & Mikolajczyk (2015) have done research in order to determine whether overweight in preschool children has a negative
effect on the very anatomical‐morphological structure of the foot. In this study, it was found that the longitudinal arch of the foot at the left and right legs in the boys was significantly lower than in the girls, and this tendency did not change during the duration of the 24‐month research methodology. They have come to the conclusion that excessive obesity negatively affects the longitudinal arch of the foot in pre‐school children. Mickle, Steel & Munro (2011) have been working to investigate whether the movement of the foot, as a daily locomotor activity in preschool children correlates with the objective time spent in physical activity and with sedentary behavior. The analysis of the determination of the mechanical pressure generated by walking is significantly related to the level of physical activity in preschool children, where preschool children who have generated a high coefficient of pressure across the whole foot and heel are classified into that group of subjects that are less concerned with physical activity, as opposed to children who achieved a lower pressure coefficient on the platform. While girls who achieved a high pressure coefficient under the fingers of the foot belong to the group sedentary live mode this, than girls who have achieved a lower pressure coefficient on the platform. Generally speaking, most papers supported the initiative and the theory that pre‐school period is the most suitable period of the beginning of the disruption of the morpho‐anatomic structure of the foot in children. The elasticity, and the very plasticity of the ligament bonds, joint structures, tendons and muscles of the foot is very sensitive and accompanied by morphological changes, which certainly occur in this period of the child. Most authors consider the study of the age of the respondents, sex, as well as age, that there is a gender effect as well as years of age with an increase in the prevalence of the flat foot, as well as the difference in the appearance of flat‐foot disorders between the sexes. Some have found that, as the child is older, the incidence of flat spine disorders is lower. All these are in some ways potential variables that can certainly give a certain (percent) contribution to the morpho‐anatomical change in the foot. Some research also pointed to the importance of physical activity in the form of applying natural forms of movement and exercise in maintaining normal anatomical foot image. However, taking into account the modern way of life, it can be noted that there has been a statistical decline in the use of natural forms of movement, which, in addition to the occurrence of post‐ mortem changes, also leads to a change in terms of deterioration of body status (obesity). Research by individual researchers also found that variables such as reduced movement, use of means of transport, excessive obesity and inappropriate
297
Fis Communications 2018 footwear (sneakers) can significantly contribute to the disruption of the biomechanical model of the locomotor apparatus, in this case the biomechanical foot model. However, what has not been investigated is the effect of genetics on the transformational morpho‐anatomic process of the anatomical parameters of the foot in terms of disrupting the model itself. Summarizing research, it is evident that special attention should be paid to this period of the child and to act preventively in order to prevent progression of foot disorders to a higher stage (structural nature). Also, it is necessary to pay attention to the transition from pre‐school to school period and the influence of the school period on the transformational‐ morpho‐anatomical process of the very architecture of the foot.
CONCLUSION Flat foot is one of the most common physical deformities that affects the vast majority of the population. The latest research has shown that a flat foot represents a global problem not only in society, but also in the world together with other body deformities and other forms of deformation of the body (excessive obesity). Therefore, in the early childhood, a system of prevention must be provided, both in kindergarten, in school, and in the family.
298
REFERENCES Živković, D. (2009). Osnove kineziologije sa elementima kliničke kineziologije. Niš: Fakultet sporta i fizičkog vaspitanja. Mihajlović, I., Smajić, M., & Sente, J. (2010). Učestalost deformiteta stopala kod devojčica predškolskog uzrasta. Vojnosanitetski pregled, 67(11), 928‐932. Simov, S. B., Minić, S. M., & Stojanović, D. O. (2011). Učestalost pojave lošeg držanja tela i ravnih stopala kod dece predškolskog uzrasta. Apollinem medicum et aesculapium, 9(2), 5‐8. Bjeković, G., Arnaut, Đ., & Gerdijan, N. (2011). Deformiteti stopala kod djece predškolskog uzrasta u obdaništu ''Nova radost''‐ Istočno Sarajevo. Sport mont, 1‐5. Abolarin, T., Aiyegbusi, A., Tella, A., & Akinbo, S. (2011). Predictive factors in flatfoot: The role of age and footwear in children in urban and rural communities in South West Nigeria. The Foot, 21(4), 188‐192. Mickle, K. J., Cliff, D. P., Munro, B. J., Okely, A. D., & Steele, J. R.(2011). Relationship between plantar pressures, physical activity and sedentariness among preschool children. Journal of science and medicine in sport, 14(1), 36‐41. Chen, K. C., Tung, L. C., Yeh, C. J., Yang, J. F., Kuo, J. F., & Wang, C. H. (2013). Change in flatfoot of preschool‐ aged children: a 1‐year follow up study. European journal of pediatrics, 172(2), 255‐260. Živković, D. i Karalejić, S. (2014). Korektivna gimnastika. Niš: Grafika galen. Jankowicz‐Szymanska, A., & Mikolajczyk, E. (2015). Effect of excessive body weight on foot arch changes in preschoolers: a 2‐year follow up study. Journal of the American Pediatric Medical Association, 105(4), 313‐319.
International Scientific Conference
THE POSTURAL STATUS OF FEMALE FIRST LEAGUE BASKETBALL PLAYERS Stefan Đorđević1, Mikica Vidojević2, Milan Đokić3, Marina Milenković4 and Ratko Stanković3 The Faculty of Sport and Physical Education, University of Nis, Serbia
1
Sports Association of Knjaževac, Knjaževac, Serbia
2
Municipal Assembly of Knjaževac, Knjaževac, Serbia
3
4 High School “T.S. 12. Febrruary”, Nis, Serbia Stefan Đorđević, Mikica Vidojević, Milan Đokić, Marina Milenković and Ratko Stanković
UDC 796.323:613.71/.72‐055.2
SUMMARY The aim of this research was to determine the postural status of first league female basketball players. The sample of participants consisted of 12 elite senior basketball players who had been involved in a training program for more than eight years. To evaluate the postural status of the spinal column in the frontal and sagittal plane, as well as to evaluate the postural status of the legs and feet in the frontal plane, a special measuring instrument was used (Formetric 4D System, Diers, Germany). To determine the differences in the prevalence of deformities and normal posture, the Chi square test was used. The results indicated that the prevalence of physical deformities of the spinal column are found in the following percentages: kyphosis (66.7%), lordosis (100%) and scoliosis (91.7%) while the prevalence of the percentage of leg and arch deformity was: knock‐knees (8,3%), bowlegs (91.7%) and flat feet (58.3%). Based on the obtained information on their postural status, we can conclude that frequent control and monitoring of postural status among elite female athletes is necessary. In addition, the constant strengthening of both sides of the body is needed, especially in the case of sports where the specific nature of the technical elements is tied to the dominant side of the body. Key words: kyphosis, lordosis, scoliosis, knock‐knees, bowlegs, flat feet, deformities, basketball, senior age group, women
INTRODUCTION Postural status represents a particular position of body segments in static and dynamic positions (Demeši‐Drljan, & Mikov, 2012). However, due to increasingly more demanding and dynamic sports competitions today physiological and postural parameters represent a great challenge for the athlete himself (Marelić, 2015) . In accordance with the specificities of each sport, or sport techniques, we could use one (the dominant) side of the body more intensely, that is, one group of muscles more compared to the other, which as a result leads to a muscle imbalance, or a parallel discrepancy in the increase in the power of the muscles of the dominant and non‐dominant side of the body(Gioftsidou, Beneka, Malliou, Pafis & Godolias, 2006; Nešić, Ostojić, Đokić & Šeper, 2012). The muscle disbalance which occurs as a result of improving sport techniques which are not symmetrical leads to the occurrence of deformities in the postural status.
Deformities, based on the level of muscle disbalance, can be classified as deformities of the functional type and deformities of the structural type. Deformities of the functional type are those which occur as the result of insufficient muscle power or a great difference between the muscle power of the dominant and non‐dominant part of the body, and the structural type represent changes which in addition to muscle tissue also affect both the ligaments and bone tissue. Postural disorders can be noted on the human body in two planes, the sagittal and frontal (Milenković, 2007). Deformities located on the spinal column in the sagittal plane are kyphosis, lordosis and flat back, while the deformity located in the frontal plane of the spinal column is known as scoliosis. Deformities which occur in the region of the legs in the frontal plane are knock‐knees and bowlegs, while deformities of the foot are flat feet and hollow foot(Živković, 1998; Živković, 2009) . Determining postural status is important for athletes of all ages, categories and levels of competition, especially for elite professionals, due
299
Fis Communications 2018 to the exceptionally great physical exertions which they undertake with the aim of achieving higher competitive results, so that they could keep their state of health at a high level and to have a strong and healthy body following the end of their sports careers (Kilinç, Yaman & Atay, 2009; Baldini, Beraldi, Nota, Danelon, Ballanti & Longoni, 2012). Considering the fact that the disbalance in the prevalence of body activation when performing basketball techniques might cause inequality in the muscle power of the dominant and non‐dominant side of the body, it is interesting to determine what the state of postural disorders among elite female basketball players is. In accordance with the previously determined facts, the aim of this paper is to determine the postural status of the senior female basketball players of the First league of Serbia.
METHODS Participants The research included 12 participants. The participants were all women, senior basketball players competing in the First league of Serbia, with an average age of 21,5 ± 5,7 yrs. The female participants had been involved in active training for more than eight years.
Procedure To determine postural status in the frontal and sagittal plane of the spinal column, but also to determine the postural status of the legs in the frontal plane and determine the status of the feet, a
particular measuring instrument was used (Formetric 4D System, Diers, Germany). “Diers“ represents the most modern of instruments from the group of non‐invasive measuring methods, that is, for the evaluation of the state of the postural status of the whole body in the frontal and sagittal plane, as well as in static and dynamic circumstances (Betsch, Wild, Jungbluth, Hakimi, Windolf, Haex, & Rapp, 2011; Mangone, Raimondi & Paoloni, 2013). The validity and reliability of the instrument (Formetric 4D System, Diers, Germany) was determined in various studies (Somoskeöy, Tunyogi‐Csapó, Bogyó & Illés, 2012; Lason, Peeters, Vandenberghe, Byttebier & Comhaire, 2015). The instrument was also used among participants of various age groups (Sung, Yoon & Park, 2015; Knott, Sturm, Lonner, Cahill, Betsch, McCarthy, Kelly, Lenke & Betz, 2016). Based on the data on the postural status of the spinal column in the sagittal plane obtained during measurements using this instrument, the following variables were isolated: KIF I – kyphotic posture, first degree; KIF II – kyphotic posture, second degree; LOR I – lordotic posture, first degree; LOR II – lordotic posture, second degree; SKOL I – scoliotic posture of the first degree; Xn I – knock‐knees, first degree; On I – bowlegs, first degree; RS I – flat feet, first degree; Rs II – flat feet, second degree.
Statistical analysis The obtained measurements are represented as frequencies and percentages. To determine the differences in the prevalence of deformities and normal body posture among the female participants, we used the Chi square test.
RESULTS Table 1. Descriptive parameters of the female basketball players, senior competitors in the First league of Serbia. Descriptive Statistics N Minimum Maximum Mean
Std. Deviation
tvis
12
164.00
194.50
176.76 8.15
tmas
12
58.20
87.70
69.27
8.32
BMI
12
26.50
22.66
2.21
Valid N
12
19.00
tvis – body height; tmas – body mass; BMI – body mass index
Table 1 represents the basic parameters of descriptive statistics on the numeric ratio of the prevalence of the deformities as well as information on their body height (SD 176,7 ± 8,15),
300
body mass (69,27 ± 8.32) and the body fat index (22,26 ± 2.21). These parameters were presented for a more complete description of the sample of participants.
International Scientific Conference Table 2. Postural status of the spinal column in the sagittal and frontal plane among female basketball players, senior competitors in the First league of Serbia. Postural deformities in the frontal plane of the spinal column Lordosis Scoliosis Kyphosis Variable Frequency Percent Variable Frequency Percent Variable Frequency Percent N 4 33.3 N 0 0 N 1 8.3 KIF I 5 41.7 LOR I 3 25 SKOl I 11 91.7 KIF II 3 25 LOR II 9 75 Total 12 100 Total 12 100 Total 12 100 N – number of participants without the deformity; KIF I – kyphosis, first degree; KIF II – kyphosis, second degree; LOR I – lordosis, first degree; LOR II – lordosis, second degree; SKOL I – scoliosis, first degree; Total – overall number of statistically processed participants within the variable. Postural deformities in the sagittal plane of the spinal column
Based on the results shown in Table 2, that is, following results were obtained: kyphotic posture the overview of the basic descriptive parameters of of the first degree was found in 8 of the the numeric ratio of the prevalence of the participants (66.7%), lordotic posture in 12 of the deformity of the spinal column in the sagittal and participants (100%) and scoliotic posture in 11 of frontal plane, among female basketball players, the participants (91.7%). senior competitors of the First league of Serbia, the Table 3. Postural status of the legs in the frontal plane and flat feet among the female basketball players, senior competitors in the First league of Serbia. Postural status of the feet Flat feet Variable Frequency Percent N 5 41.7 RS I 4 33.3 RS II 3 25 Total 12 100 Total 12 100 Total 12 100 N – the number of participants without a deformity; Xn I – knock‐knees, first degree; On I – bowlegs, first degree; RS I – flat feet, first degree; Rs II – flat feet, second degree; Total – overall number of statistically processed participants within the variable. Postural deformities of the legs located in the frontal plane Bowlegs Knock‐knees Variable Frequency Percent Variable Frequency Percent N 11 91.7 N 1 8.3 Xn I 1 8.3 On I 11 91.7
Based on the results shown in Table 3, that is, basketball players, senior competitors in the First the overview of the basic descriptive statistics league of Serbia, the following results were parameters of the numeric ratio of the prevalence obtained: knock‐knees were noted in one of the of leg deformities in the frontal plane, as well as participants (8,3%), bowlegs in 11 (91.7%) and the prevalence of flat feet among the female flat feet in 7 of the participants (58.3%). Table 4. The results of the Chi square test for the female basketball players, senor competitors in the First league of Serbia. Chi‐Square df Asymp. Sig.
Test Statistics Kyphosis Scoliosis Knock‐knees Bowlegs 1.333a 8.333a 8.333a 8.333a 1 1 1 1 .248 .004 .004 .004
The results in Table 4 represent the results of the Chi square test of the female basketball players, senior competitors of the First league of Serbia. Based on the obtained results we can note a statistically significant difference between the female basketball players with and without a diagnosed deformity for the following variables: Scoliosis (p=0.004), knock‐knees (p=0.004), and
Flat feet .333a 1 .564
bowlegs (p=0.004), while for the variables: Kyphosis (p=0.248) and Flat feet (0.564) no statistically significant differences were determined. All of the female participants had lordosis, so this variable was not analyzed in the Chi square test.
301
Fis Communications 2018
DISCUSSION The measurement results indicate a high level of prevalence of physical deformities among the female basketball players, senior competitors in the First league of Serbia. Analyzed based on the location of the deformity on the body of the players, the most prevalent deformity is located on the spinal column in the lumbar region in the sagittal plane, also known as lordotic posture, which is found in all the female participants (100%). In addition to this deformity of the spinal column, scoliotic posture was also quite prevalent, in as much as (91.7%) of the participants. Among the deformities localized in the leg region in the frontal plane, the most prevalent are bowlegs with as much as (91.7%) while only one of the participants (8.2%) was knock‐kneed. Flat feet were present in as many as (58.3%) of the participants. The remaining deformities were present in a significantly smaller percentage. These results of the postural status of the spinal column and the arches of the feet are in accordance with the studies carried out on athletes (Radaš & Trošt Bobić, 2011; Đurić, Janićijević, Majstorović & Ilić, 2015; Grabara, 2016; Jandrić, 2016). Athletes represent a group of the population which due to increased physical activity, which in the case of elite athletes far exceeds the limits of recommended, healthy levels, which along with a specific technique or muscle activation may lead to the occurrence of a muscle disbalance. A muscle disbalance is more present in sports whose performance technique is conditioned by the asymmetry of movement on both sides of the body, as well as the position or primacy of the upper or lower extremities. In accordance with previous research results, but also the data obtained in this study, we could explain the high percentage of lordosis with the dominance of the technical element of the block and defense, as well as the contact part of the game during which for a more stable position, the legs are placed wider than shoulder width with a more taut musculature in the lumbar region of the back, which is more often found among the female players whose anthropometric parameters do not provide an advantage in the game. The results for the posture of the spinal column in the frontal plane, that is, the occurrence of scoliosis which is exceedingly frequent (91,7%) could be explained by the specific nature of the performance technique of leading the ball with the dominant hand, which leads to the strengthening and shortening of the musculature of one side of the body, that is, the side of the body which is performing the technical element of leading the ball, with the simultaneous stretching and weakening of the musculature of the opposite side
302
of the body, which leads to a muscle disbalance and the emergence of the deformity at a functional level. Also, a high prevalence of the deformity known as bowlegs may indicate more prevalent technical elements of low leading the ball with changes in direction and stopping during the game, where the inertia is extensive, and the knee joint suffers extensive lateral resistance which leads to a further strengthening of the adductor muscles, that is, the medial muscles of the legs, and the simultaneous weakening of the muscles on the lateral side of the legs. The results which pointed to a difference in the prevalence of body deformities among female basketball players of the First league of Serbia indicated a statistically significant difference (p=0,004) in deformities such as lordosis, scoliosis and bowlegs in favor of the participants with the deformity, which had previously been indicated in the descriptive analysis and explained in the previous part of the discussion. In accordance with the aforementioned, there is a clear message for the coaches of elite athletes regarding the severity of the occurrence of deformities as a result of the performance of technical elements, asynchronous and non‐cyclical sports, that is, sports whose performance techniques are focused on the unequal prevalence of the muscles of the left and right side of the body, as well as the activation of only the upper or lower extremities. In addition, the recommendation to coaches is that it is necessary to plan the space in the training process of female basketball players both on the macro and mezzo and micro level of performing movements which activate the musculature which is non‐dominant in the sports technique applied during preparations for competitions and the competitions themselves.
CONCLUSION The results obtained in this study indicate an unexpectedly high level of the prevalence of deformities both of the spinal column in the frontal and sagittal plane and the legs in the frontal plane, while the status of the feet is present in slightly more than one half of the female basketball players. These results indicate that physical inactivity is not the sole parameter for the emergence of physical deformities during our life, and that excessive physical activity with the dominant use of a particular side of the body can cause excessive power of one side of the body and lead to a muscle disbalance, that is, the emergence of deformities. Based on the knowledge obtained on postural status, we can conclude that frequent control and monitoring of the postural status of elite athletes is necessary for the equal development of the musculature of the entire body,
International Scientific Conference both during the preparatory period and during competitions. The necessity of strengthening both sides of the body is especially relevant for sports where the specific nature of the technical elements is related to the dominant side of the body. Furthermore, the obtained results indicate the necessity for new studies on the postural status of elite athletes.
ACKNOWLEDGEMENT The authors would like to thank the female basketball players of the ŽKK “Student” for their participation and all the employees of the basketball club for their contribution, as well as the Sports Association of Knjaževac for the use of their diagnostics center where the evaluation of the postural status of the female basketball players took place (Formetric 4D System, Diers, Germany). A special thanks is given to the Ministry of Education, Science and Technological development of the Republic of Serbia on their support which made this research possible, as part of the project “Biomechanical effectiveness of elite Serbian athletes” no. ОI179024.
REFERENCES Baldini, A., Beraldi, A., Nota, A., Danelon, F., Ballanti, F., & Longoni, S. (2012). Gnathological postural treatment in a professional basketball player: a case report and an overview of the role of dental occlusion on performance. Annali di stomatologia, 3(2), 51. Betsch, M., Wild, M., Jungbluth, P., Hakimi, M., Windolf, J., Haex, B., & Rapp, W. (2011). Reliability and validity of 4D rasterstereography under dynamic conditions. Computers in biology and medicine, 41(6), 308‐312 Demeši‐Drljan, Č. & Mikov, A. (2012). Posturalni status dece predškolskog i rano školskog uzrasta. U M. Lazović (ur), Zbornik radova sa 12. kongresa fizijatara Srbije sa međunarodnim učešćem, (str. 65‐69). Vrnjačka Banja: Udruženje fizijatara Srbije. Đurić, S., Janićijević, D., Majstorović, N., & Ilić, D. (2015). Postural status of female volleyball players aged 12 to 16 years. Fizička kultura, 69(2), 110‐118. Gioftsidou, A., Beneka, A., Malliou, P., Pafis, G., & Godolias, G. (2006). Soccer players' muscular imbalances: restoration with an isokinetic strength training program. Perceptual and motor skills, 103(1), 151‐159. Grabara, M. (2016). Sagittal spinal curvatures in adolescent male basketball players and non‐training individuals–a two‐year study. Science & Sports, 31(5), 147‐153.
Jandrić, S. Đ. (2016). Differences in postural disturbances between female adolescents handball players and nontraining peers. Vojnosanitetski pregled, 73(4), 337‐342. Kilinç, F., Yaman, H., & Atay, E. (2009). Investigation of the effects of intensive one‐sided and double‐sided training drills on the postures of basketball playing children. Journal of Physical Therapy Science, 21(1), 23‐ 28. Knott, P., Mardjetko, S., Rollet, M., Baute, S., Riemenschneider, M., & Muncie, L. (2010). Evaluation of the reproducibility of the formetric 4D measurements for scoliosis. Scoliosis, 5(1), O‐10. Knott, P., Sturm, P., Lonner, B., Cahill, P., Betsch, M., McCarthy, R., Michael Kelly, MDg, Lawrence Lenke & Betz, R. (2016). Multicenter comparison of 3D spinal measurements using surface topography with those from conventional radiography. Spine deformity, 4(2), 98‐103. Lason, G., Peeters, L., Vandenberghe, K., Byttebier, G., & Comhaire, F. (2015). Reassessing the accuracy and reproducibility of Diers formetric measurements in healthy volunteers. International Journal of Osteopathic Medicine, 18(4), 247‐254. Mangone, M., Raimondi, P., & Paoloni, M. (2013). Vertebral rotation in adolescent idiopathic scoliosis calculated by radiograph and back surface analysis‐ based methods: correlation between the Raimondi method and rasterstereography. Eurpian journal for Spine, 22, 367‐371. Marelić, M. (2015). Stav prema profesionalnom sportu. Hrvatski športskomedicinski vjesnik, 30(2), 106‐ 117. Milenković, S. (2007). Korektivna gimnastika, teorija i vežbe. Niš: SIA. Nešić, N., Ostojić, S., Đokić, Z., & Šeper, V. (2012). RAZLIKE U REGIONALNOJ MIŠIĆNOJ DISTRIBUCIJI KOD FUDBALERA. 15. LJETNA ŠKOLA KINEZIOLOGA REPUBLIKE HRVATSKE (367‐362) 20‐24 jun RovinjTepublika Hrvatska. Radaš, J., & Trošt Bobić, T. (2011). POSTURA U VRHUNSKIH HRVATSKIH RITMIČARKI. Kinesiology: International journal of fundamental and applied kinesiology, 43(1), 64‐73. Somoskeöy, S., Tunyogi‐Csapó, M., Bogyó, C., & Illés, T. (2012). Clinical validation of coronal and sagittal spinal curve measurements based on three‐dimensional vertebra vector parameters. The Spine Journal, 12(10), 960‐968. Sung, D. H., Yoon, S. D., & Park, G. D. (2015). The effect of complex rehabilitation training for 12 weeks on trunk muscle function and spine deformation of patients with SCI. Journal of physical therapy science, 27(3), 951‐ 954. Živković, D. (1998). Teorija i metodika korektivne gimnastike. Niš: Grafika Galeb. Živković, D. (2009). Osnove kineziologije sa elementima kliničke kineziologije. Niš: Fakultet sporta i fizičkog vaspitanja.
303
Fis Communications 2018
304
International Scientific Conference
Physical Education
305
Fis Communications 2018
306
International Scientific Conference
THE IMPACT OF DEVELOPMENTAL GYMNASTICS PROGRAM ОN THE BALANCE OF ТНЕ YOUNGER SCHOOL AGE GIRLS Katarina Herodek1, Aleksandra Aleksić Veljković1, Saša Veličković1 and Stefan Janevski2 Faculty of Sport and Physical Education, University of Niš
1
Katarina Herodek, Aleksandra Aleksić Veljković, Saša Veličković and Stefan Janevski
UDC 796.41‐053.3
SUMMARY The aim of this research is to determine the impact of a specific program of developmental gymnastics on the balance of children of the younger school age. The program lasted eight weeks, two training sessions per week for 60 minutes. In order to test the balance ability, nine tasks of the Balance subtest, which is part of the Bruininks‐Oseretsky test (BOT‐2), were used. This test is designed to evaluate the motor efficiency of children aged 4 to 21 years. The application of the exercise program showed a significant influence of the development gymnastics program on the balance of the respondents, so the authors recommend its use in practice. This program is focused on the development of all basic, motor skills and includes exercises on the apparatus and the floor, as well as the techniques of basic gymnastic elements on all apparatus. Keywords: Bruininks‐Oseretsky test, gymnastics, motor abilities
INTRODUCTION Only the appropriate level of motor skills enables successful learning of more complex motor tasks, the adoption of skills and the creation of habits. Therefore, the development of motor skills, the acquisition of skills and the development of useful habits should be considered as inseparable factors for the integral development of the child. Nevertheless, it should be emphasized that, due to the limited duration of time and the number of lessons in the curriculum, despite the application of various organizational‐methodical forms of work in order to improve the physical development and development of motor skills of pupils at the time of physical education, teachers of physical education are not able to influence the visible improvement of the physical development and motor skills of students. Motor abilities are those abilities of a person who participates in solving motor assignments and condition a successful movement, regardless of whether they have been acquired by training or not. In terms of motor abilities in gymnastics, the greatest importance belongs to coordination, but equally important is balancing, and flexibility. Balance, along with other motor abilities, plays a significant role in the successful performance of sports skills, as well as in the prediction of sports injuries (Sabin et al., 2010). Potential relationships
between balance and injuries have been highlighted by increased interest in developing instruments (tests, assignments, exercises) in order to develop balance programs and reduce the risk of injury (Sabin et al., 2010; Zech et al., 2010). Balance training is used as part of a rehabilitation program after injuries to the hocks and knee joints (Hrysomallis, 2007; Aleksić Veljković, A., 2016). Balance is the ability to preserve a stable, appropriate position of the body when it moves ‐ a dynamic balance or a standstill ‐ a static balance. Balance involves coordination and control, which is necessary for everyday life, as well as in sports, and it is to be understood not only as the ability to maintain a position but primarily as the ability to rapidly return to the balance position after its violation in conditions of rest or movement. It is also defined as the ability of a person to maintain the body in a balanced position and to be corrected by movements of gravitational gravity action, which makes it difficult to maintain a balanced position by the action of external irritants. The coefficient of inheritance of this ability is very large and for these reasons, the balance is rather specific and difficult to develop (Kukolj, 2006; Aleksić Veljković, A., 2016) Motor development is a process through which the child develops motor skills, movement patterns and skills, it occurs throughout his life. The changes have been most visible in young children and should be monitored and compared with the 307
Fis Communications 2018 typical phases of motor development of children that are characteristic of a certain age. It takes place in a continuous process of modification due to the interaction of different factors (Malina, 2004), and these factors are: neuromuscular maturation, which has a significant genetic component, characteristics of child growth, pace of physical growth, maturation and biological development, effects of previous motor experiences, and prenatal experiences and new motor experiences. Correct and regular physical activity in children of the younger school‐age affects: proper growth and development and improves the child's adapting to society, the state of health of the child, the development of motor skills, which creates the basis for the adoption of more complex skills and psychic abilities, since children satisfy their needs for movement that they are less prone to nervousness, depression, and tension (Milanović & Stamatović, 2009). The period of the young school age is a very sensitive phase for the majority of authors to improve motor skills and during this time period, if the developmental effects in this area are to be achieved, their stimulation with appropriate physical exercise should be achieved. The younger school age is a very important sensitive period for the development of motor abilities in general, and especially when it comes to learning and adopting a broad repertoire of motor skills and activities. The child of this age is quite independent when it comes to physical activity, and its coordination, balance, and precision improve over time, along with speed, strength, and durability. One of the basic sports recommended at this age is gymnastics. Artistic gymnastics affects the development of motor skills: strength, coordination, flexibility, and balance. In coordination terms, gymnastic elements are classified into the most complex movements. Testing and periodic monitoring of the ability of young athletes is also important for defining training programs adapted to the requirements of sports and age. In this way, a harmonious and optimal development of fundamental motor abilities is achieved in accordance with the physical development of an athlete (Arruda & Farinatti, 2007; Carrick et al., 2007). When it comes to developmental gymnastics, the performance of balance positions requires overcoming the inertia of the previous movement and stopping in a certain position with the support. In order to maintain balance, it is important to set the center of gravity of the body relative to the surface of the support. The body weight of the body is farther away from the surface of the support, or it is reduced, making it more difficult to hold in that position. Performing balance positions
308
requires certain agility and nervous‐muscular coordination. The aim of this research is to determine, through a certain potential influence of a specific program of developmental gymnastics, through the differences between initial and final exercises.
METHODS Subjects The study included a total of 23 girls aged 7 to 9 years old, who at the beginning of the study were members of the gymnastics club "Olimp" from Knjazevac. In addition to regular physical education activities in the school, the group was subjected to a program of developmental gymnastics lasting 8 weeks, 60 minutes twice a week. The development gymnastics program focuses on the development of basic motor abilities, consisting of exercises for the development of motor skills through exercise on machines and ground, and learning techniques of basic gymnastics elements on each apparatus.
Procedure For the measurement of children's balance, the Bruininks‐Oseretski test for motor efficiency, second edition (BOT‐2), was used (Bruininks & Bruininks, 2010). BOT‐2 is designed to: (a) determine the level of motor efficiency of young people between 4‐21 years; (b) detecting difficulties on the move; (c) contributes to the design and evaluation of different training programs. The Balance subtest assesses the skills of controlling attitudes, movements and movements. The Balance subtlety contains nine tasks: 1. Standing with feet on the line ‐ eyes open (SSOO); 2. Footsteps on the line ‐ eyes closed (SSOZ); 3. An attitude on one leg on the line ‐ eyes open (SJOO); 4. Moving forward in the line with open eyes (HLOO); 5. Walk forward along the line so that the fifth one touches the fingers of the second foot (HLJD); 6. An attitude on one foot on the line ‐ Closed eyes (PSC); 7. Position on one leg on the lower shaft ‐ eyes open (SNOO); 8. Stand with one foot behind the other on the low beam (SJNG) and 9. Position on one leg on the lower shaft ‐ eyes closed (SJNZ).
International Scientific Conference
Statistical analysis All data analyses were performed in IBM SPSS Statistics 19.0 statistical program. The following basic central and dispersion parameters were calculated: Minimum (Min) value, Maximum (Mah) value of the result, Arithmetic mean (AS), The curvature of distribution is determined by the coefficient of asymmetry ("Skunis"), and the distribution is distributed through the coefficient of flattening ("Kurtosis"). For the determination of statistically significant differences in the mean values of the results on the initial and final measurement, the T‐test for the dependent samples was applied.
Experimental program
instructors and a PE teacher. Each class unit contained three training phases: First phase started with a warm‐up which included slow running and stretching and ended with a polygon with different kind of movements and different games for motor learning of children this age. This was followed by a set of gymnastic exercises. The third phase of a class was the focus on restoring the normal level of emotional, mental and physiological bodily functions and re‐establishing the same state that the pupils were in before the beginning of the practice period. The experimental treatment included basic gymnastics skills, according to apparatus available at the moment: acrobatic, vault, mini trampoline, parallel bars.
RESULTS WITH DISCUSSION
The experimental program was implemented This chapter presents the results of research during 2018 in a period of eight weeks in the and interpretation of the obtained data by gymnastics club in Knjaževac. The aim of the following the order of the data processing training process was to influence the improvement methods. The basic descriptive statistical of balance, but also to help pupils to learn some parameters of all the variables included in the basic gymnastics elements. The gymnastics survey are included. Table 1 shows the central and program was conducted two times a week. Each dispersive parameters of the distribution of motor session lasted for 60 minutes. All workouts were abilities of pre‐school children at initial supervised by trained artistic gymnastics measurement. Table 1. Descriptive statistical parameters at initial measurement Вар. Min. Max. Mean SD Skew. Kurt. ССОО 1.00 4.00 2.78 .24 1.17 ‐.29 ‐1.44 ССОЗ 1.00 4.00 2.04 .18 .88 .35 ‐.64 СЈОО 1.00 4.00 2.00 .17 .79 .59 .38 ХЛОО 1.00 4.00 2.78 .21 .99 ‐.12 ‐1.13 ХЛЈД 1.00 2.00 1.61 .10 .49 ‐.48 ‐1.95 СУЗО 1.00 3.00 2.17 .10 .49 .47 .90 СНОО 1.00 3.00 1.43 .12 .59 1.00 .16 СЈНГ 1.00 3.00 1.96 .12 .56 ‐.03 .67 СЈНЗ 1.00 2.00 1.83 .08 .39 ‐1.84 1.52 N ‐ number of respondents, Min ‐ minimum score, Max ‐ maximum score, Mean ‐ mean value, SD ‐ standard deviation, Skew. ‐ coefficient of asymmetry, Kurt. ‐ coefficient of curvature
Table 2. Descriptive statistical parameters on final measurement Вар. ССОО ССОЗ СЈОО ХЛОО ХЛЈД СУЗО СНОО СЈНГ СЈНЗ
Min. 2.00 2.00 2.00 2.00 2.00 2.00 2.00 2.00 2.00
Max. 4.00 4.00 4.00 4.00 4.00 4.00 4.00 4.00 4.00
Mean 3.26 .16 2.78 .12 2.83 .16 3.17 .14 2.96 .16 2.56 .12 2.65 .16 3.09 .12 2.91 .12
SD .75 .59 .78 .65 .77 .59 .78 .59 .59
Skew. ‐.48 .09 .32 ‐.18 .08 .45 .72 ‐.01 .01
Kurt. ‐1.00 ‐.20 ‐1.22 ‐.46 ‐1.22 ‐.61 ‐.89 .16 .16
N ‐ number of respondents, Min ‐ minimum score, Max ‐ maximum score, Mean ‐ mean value, SD ‐ standard deviation, Skew. ‐ coefficient of asymmetry, Kurt. ‐ coefficient of curvature
309
Fis Communications 2018 Table 3. Differences between initial and final measurement of motor abilities of children (T ‐ test for small dependent samples) Variable SSOO SSOZ SJOO HLOO HLJD SUZO SNOO SJNG SJNZ
t ‐3.867 ‐5.147 ‐6.876 ‐3.761 ‐9.986 ‐2.598 ‐5.183 ‐6.653 ‐8.740
Table 3 shows the differences between the balance variables on the initial and final measurement. A statistically significant difference at the level of p