Oct 24, 2008 - The methodology set out in Sections 3.2 and 3.3 can be extended to predict the chances of holding an outdoor ice-skating marathon for the ...
The following text is an addendum to the article
The likelihood of holding outdoor skating marathons in the Netherlands as a policy-relevant indicator of climate change Published in Climatic Change, DOI 10.1007/s10584-0089498-6
by H. Visser and A.C. Petersen 24 October 2008
This addendum is not an official part of the article named above. It is added to explore future chances of holding an Elfstedentocht (outdoor ice-skating marathon). These future chances have been calculated for the year 2050. The style of the addendum is consistent with that of Climatic Change.
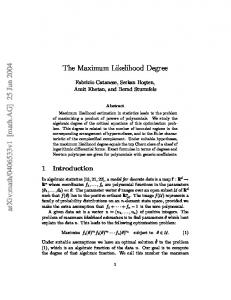
3.4 Future chances The methodology set out in Sections 3.2 and 3.3 can be extended to predict the chances of holding an outdoor ice-skating marathon for the year 2050. The KNMI recently launched a new set of climate change scenarios for the Netherlands, spanning a wide range of possible future climate conditions. Scenario values have been constructed by combining output from an assembly of recent GCM simulations, RCM output and meteorological data. For variables, such as temperature and precipitation, four scenarios have been deduced for the year 2050, denoted by ‘G’, ‘G+’, ‘W’ and ‘W+’. The rationale behind these scenarios is briefly given in Figure 6. For details please refer to Van den Hurk et al. (2006, 2007) and Lenderink et al. (2007). The KNMI scenarios give the following changes in average temperatures of the coldest day per year, relative to 1990, as: +1.0 °C, +1.5 °C, +2.1 °C and +2.9 °C for the G, G+, W and W+ scenarios, respectively. Unfortunately, no natural variability
Fig. 6
Schematic overview of four KNMI climate scenarios. The letter ‘G’ refers to
‘moderate’ (in Dutch Gematigd), while ‘W’ refers to ‘Warm’. The symbol ‘+’ indicates that a scenario includes a strong change of atmospheric circulation occurring in winter and summer. The scenarios G and G+ correspond to a global climate regime with a warming of +1.0°C between 1990 and 2050. The scenarios W and W+ correspond to a global climate regime with a warming of +2.0°C between 1990 and 2050. Recently, the Dutch TNO institute developed two extreme scenarios − E and E+ − with a warming of +3.0°C between 1990 and 2050. These two
scenarios
have
not
been
considered
here.
Graph
taken
from
Van den Hurk et al. (2006).
is given for the year 2050 and the KNMI advises setting this variability equal to the historic variability of 1990 (Van den Hurk et al., 2006). We will follow this advise. Now, if (i) we assume that temperature changes for the coldest day will be equal to temperature changes for the coldest period of 15 consecutive days It between 1990 and 2050 4 , and (ii) take the temperature changes relative to the estimated trend in 1990, shown in the upper panel of Figure 3 [see Climatic Change article], being 1.02 after re-transformation, we arrive at the following estimates for I2050: -0.02, 0.48, 1.08 and 1.88°C for the G, G+, W and W+ scenarios, respectively.
4
We checked this assumption with historic data and found that the temperatures during the coldest periods of 15 consecutive days, differ from the temperature on the coldest day of the same year, with a constant of +5.2 °C plus random noise. Therefore, changes in temperatures for the period 1990-2050 are likely to be equal for both coldest days and coldest periods of 15 consecutive days.
2
'Elfstedentocht' not organized
'Elfstedentocht' is organized
density
0.25 0.20
Pdf for G scenario Pdf for G+ scenario Pdf for W scenario Pdf for W+ scenario
0.15 0.10 0.05 0.00 -14.0
-12.0
-10.0
-8.0
-6.0
-4.0
-2.0
0.0
2.0
4.0
6.0
'Elfsteden' indicator It (°C)
Fig. 7 Probability density functions (Pdfs) for the ‘Elfstedentocht’ in the year 2050: indicator IG (green line), IG+ (blue line) and I2050,W (orange line) and I2050,W+ (red line). Vertical lines are the geometric mean values: -0.02 ˚C for scenario G, 0.48 ˚C for scenario G+, 1.08 ˚C for scenario W and 1.88 ˚C for scenario W+. The probability functions are shifted log-normal with long tails to the left (due to the transformation yt = ln (10.0 - It) ). The surface of the yellow area for each curve equals the chance for holding a marathon.
In Figure 7, the consequences have been summarized, analogue to the presentation in Figure 4 [see Climatic Change article]. The chances of holding a marathon in 2050 are (the yellow areas to the left of the value -4.2°C): 0.056, 0.035, 0.018 and 0.0055, for the G, G+, W and W+ scenarios, respectively. The corresponding chances of recurring periods are once every 18, 29, 55 and 183 years. Note that the future value of once every 18 years equals the trend value in the current year 2008. It is interesting to compare these four chances with chances which can be deduced from the work of Brandsma (2001). Brandsma calculated the potential number of marathons to be 38, between 1901 and 2000 (given a maximal ice thickness of 15 cm). Then, he calculated changes in this number of marathons as a function of temperature increase, relative to the 20th century, using the ice-grow model of Bruin and Wessels (1990). His results are summarized in his Figure 5 [see Climatic Change article]. From this Figure, we obtained the potential number of marathons for the G, G+, W and W+ scenarios (with projected temperature increases of +1.0°C, +1.5°C, +2.1°C and +2.9°C, respectively). In doing so, we found the
3
Table 2 Return periods and chances for holding an 11-city marathon around the year 2050. Calculations are based on Brandsma (2001). The last column shows the corresponding chances found in this study.
Scenario
G G+ W W+
Number of marathons within a 100 year period 8.9 6.5 4.7 3.6
Recurring period [years] 11.2 15.4 21.3 27.8
Chance of holding a marathon (Brandsma) 0.089 0.065 0.047 0.036
Chance of holding a marathon (this study) 0.056 0.035 0.018 0.006
following potential number of marathons for the warming situation around the year 2050 to be: 8.9, 6.5, 4.7 and 3.6, all within a 100 year period. In Table 2 we have summarized these results in terms of recurring periods and corresponding chances, after correction of potential tours with a factor 15/38, as suggested by Brandsma. The last column shows the chances found in this study. The table shows that the Brandsma approach predicts the higher chances of holding an 11city marathon around the year 2050. An explanation for these differences could be that Brandsma assumed chances to remain stable over the historic period between 1901 and 2000, while we have found that these chances decreased significantly, between 1970 and 2008 (cf. Figure 3 [see Climatic Change article]). We note that recent KNMI research shows that Europe, and thus the Netherlands too, is warming much faster than one would expect from the historic global mean temperature changes and GCM projections. This suggests that the W+ scenario is more likely to occur than the G scenario. See KNMI (2008) and Van Oldenborgh et al. (2008). This would imply a chance of holding a marathon to ly between 0.036 (adapted after Brandsma) and 0.006 (this study) around the year 2050. In conclusion, the climatic ‘signs’ show that the ‘Elfstedentocht’ might become a rare event in the future. However, we sincerely hope that the book of J. Lolkama on the tour of all tours, the history of the Elfstedentocht 1749-2006, is not closed yet ...
4
Photo: H. Visser
5
Additional references Brandsma, T (2001) How many 11 city ice-skate marathons in the 21st century? Zenit 28: 194-197 (in Dutch). See KNMI website: http://www.knmi.nl/kenniscentrum/hoeveel_elfstedentochten.html KNMI (2008) The state of the climate in the Netherlands 2008. KNMI report July 2009 (in Dutch). Electronic version: www.knmi.nl/toestandklimaat . Lenderink, G, Van Ulden, A, Van den Hurk, B and Keller, F (2007) A study on combining global and regional climate model results for generating climate scenarios of temperature and precipitation for the Netherlands. Clim. Dyn. 29: 157-176 Lolkama, J (2007) The tour of all tours. The history of the Elfstedentocht, 1749-2006 (in Dutch). Steven Sterk, Utrecht. Oldenborgh, GJ, et al. (2008) Western Europe is warming much faster than expected. Climate of the Past Disc. 4: 897-928 Van den Hurk, B, et al. (2007) New climate change scenarios for the Netherlands. Water Science & Technology, 56(4): 27-33
6