Oct 26, 2011 - ... 'Project Masonry'. The Natural Hazards Research Platform maintains a website .... COMPARISON OF URM BUILDING TYPOLOGIES. ...... building. As for the mortar samples no scratch tests, as prescribed by NZSEE (2011),.
ENG.UOA.0002.1
Addendum Report to the Royal Commission of Inquiry
The Performance of Earthquake Strengthened URM Buildings in the Christchurch CBD in the 22 February 2011 Earthquake
by
Associate Professor Jason M. Ingham The University of Auckland and
Professor Michael C. Griffith The University of Adelaide October, 2011
ENG.UOA.0002.2
The Performance of Earthquake Strengthened URM Buildings in the Christchurch CBD in the 22 February 2011 Earthquake
Acknowledgements
This report has drawn extensively upon the works of a number of current and former postgraduate students, whose involvement is acknowledged below:
Dmytro Dizhur is a doctoral candidate at the University of Auckland. Dmytro has expertise in the field testing of unreinforced masonry buildings, and has played a significant role in collecting and analysing the data reported throughout this report. Many of the images presented in this report were provided by Dmytro, whose doctoral studies are supported financially by a University of Auckland Doctoral Scholarship. Lisa Moon is a doctoral candidate at the University of Adelaide. Lisa’s doctorate will report on the damage to unreinforced clay brick buildings in the February 2011 earthquake, and Lisa made major contributions to this report. Lisa’s doctoral studies are supported financially by a University of Adelaide Doctoral Scholarship and her expenses in Christchurch were supported by the New Zealand Natural Hazards Research Platform. Ronald Lumantarna is a doctoral candidate at the University of Auckland. Ronald’s doctoral studies are focussed on developing a knowledge base regarding the material properties of New Zealand’s unreinforced masonry buildings, for use by practicing structural engineers in their seismic assessment and retrofit designs. Ronald’s doctoral studies are supported financially by a University of Auckland Doctoral Scholarship.
Expertise associate with the seismic response of unreinforced masonry buildings was developed at the University of Auckland as part of the ‘Retrofit Solutions’ research project that was funded by the New Zealand Foundation for Research Science and Technology grant UOAX0411 during the period 1 July 2004 to 30 September 2010. The website associate with this project may be accessed at www.retrofitsolutions.org.nz
i
ENG.UOA.0002.3
The Performance of Earthquake Strengthened URM Buildings in the Christchurch CBD in the 22 February 2011 Earthquake Expertise associated with the seismic response of unreinforced masonry buildings was developed at the University of Adelaide, in part, through research funded by the Australian Research Council over the period 1 January 2004 to 31 December 2010. Data on the performance of unreinforced masonry buildings in the 22 February 2011 earthquake was collected as part of the Natural Hazards Research Platform Recovery Project ‘Project Masonry’. The Natural Hazards Research Platform maintains a website at http://www.naturalhazards.org.nz/. The authors wish to thank the numerous professional structural engineers and building owners who have provided valuable data, opinions, expertise and their experiences. In particular: John Hare, Stuart Oliver and others from Holmes Consulting Group Ltd.; Paul Campbell, Will Parker and others from Opus International Consultants Ltd.; Win Clark, Cecil DelaRue, Fiona Wykes and others from the Civil Defence Heritage team; Hossein Derakhashan and others from Aurecon New Zealand Ltd.; Andrew Marriot and others from Marriot Consulting Engineers Ltd.; and URS Consulting Ltd. The authors thank Ronald Lumantarna for conducting and providing mortar and clay brick compression strength results. EQ STRUC Ltd. is thanked for providing expertise and test equipment and Hilti (NZ) Ltd, Reids Construction Systems Ltd and Sika (NZ) Ltd is thanked for proving materials in order to conduct in-field anchor pull-out tests. Darryl and Alistair from the Civil Defence demolition team, Graceworks Demolition, Ward Demolition, Southern Demolition, Nikau Demolition, and other demolition companies are thanked for allowing site investigation and access for sample collection during demolition of damaged buildings. Stephanie German and Jazalyn Dukes from Georgia Institute of Technology and Chaminda Konthesingha from the University of Newcastle are also thanked for their assistance and contributions. The authors acknowledge the financial support for Project Masonry from the New Zealand Natural Hazards Research Platform. The testing of adhesive anchors was undertaken in conjunction with the RAPID grant CMMI-1138614 from the US National Science Foundation.
ii
ENG.UOA.0002.4
The Performance of Earthquake Strengthened URM Buildings in the Christchurch CBD in the 22 February 2011 Earthquake
Table of Contents
ACKNOWLEDGEMENTS ................................................................................................................... I TABLE OF CONTENTS ...................................................................................................................III GLOSSARY AND ABBREVIATIONS ............................................................................................ VI EXECUTIVE SUMMARY ................................................................................................................... 1 SECTION 1:
INTRODUCTION..................................................................................................... 4
1.1 PEER REVIEW COMMENTS ........................................................................................................ 5 1.1.1 Structural forms considered in this study .................................................................... 6 1.2 THE LEARNING EXPERIENCE PROVIDED BY THE CHRISTCHURCH EARTHQUAKES .................... 6 1.3 SCOPE AND PURPOSE ............................................................................................................... 7 1.4 DISCLAIMER ............................................................................................................................. 7 SECTION 2: CALIFORNIA
URM EARTHQUAKE STRENGTHENING TECHNIQUES USED IN 9
2.1 COMPARISON OF URM BUILDING TYPOLOGIES ........................................................................ 9 2.2 SEISMIC IMPROVEMENT APPROACH ....................................................................................... 11 2.3 SEISMIC IMPROVEMENT TECHNIQUES .................................................................................... 11 2.3.1 Parapet restraints......................................................................................................... 11 2.3.2 Wall-to-diaphragm ties ................................................................................................ 13 2.3.3 Inter-storey wall supports ............................................................................................ 13 2.3.4 In-plane wall strengthening......................................................................................... 13 2.4 SUMMARY .............................................................................................................................. 14 SECTION 3:
BUILDING INSPECTION AND DATA PROCESSING DETAILS ............... 15
3.1 DATA COLLECTION PROCESS .................................................................................................. 15 3.2 SURVEY POPULATION ............................................................................................................. 16 3.3 SURVEY DATA ......................................................................................................................... 17 3.3.1 General building information...................................................................................... 17 3.3.2 Condition of timber diaphragms ................................................................................. 18 3.3.3 Building elevation details ............................................................................................ 19 3.3.4 Concrete ring beams ..................................................................................................... 19
iii
ENG.UOA.0002.5
The Performance of Earthquake Strengthened URM Buildings in the Christchurch CBD in the 22 February 2011 Earthquake 3.3.5 Cavity construction....................................................................................................... 20 3.3.6 Awnings ........................................................................................................................ 21 3.4 WALL FAILURE MECHANISMS ................................................................................................. 21 3.4.1 In-plane damage mechanisms ..................................................................................... 21 3.4.2 Out-of-plane damage mechanisms .............................................................................. 24 3.4.3 Wall corner damage ..................................................................................................... 25 3.5 OVERALL BUILDING DAMAGE LEVEL ...................................................................................... 25 3.6 OVERALL ELEVATION DAMAGE LEVEL .................................................................................... 27 3.7 DAMAGE TO PARAPETS ........................................................................................................... 27 3.8 OTHER RECORDED DAMAGE ................................................................................................... 28 3.9 TEMPORARY SHORING AND SECURING ................................................................................... 28 3.10 RISK LEVELS TO BUILDING OCCUPANTS AND PASSERS-BY ...................................................... 29 3.11 CATEGORIES OF EARTHQUAKE STRENGTHENING ................................................................... 29 3.11.1 Parapet restraints......................................................................................................... 29 3.11.2 Type A earthquake improvements ............................................................................... 30 3.11.3 Type B earthquake improvements ............................................................................... 33 3.11.4 Retrofit level (%NBS) ................................................................................................... 34 SECTION 4:
GENERAL DAMAGE AND DEMOLITION STATISTICS.............................. 35
4.1 GENERAL BUILDING CHARACTERISTICS ................................................................................. 35 4.1.1 Number of storeys ......................................................................................................... 36 4.1.2 Building typologies ....................................................................................................... 37 4.1.3 Building elevations....................................................................................................... 37 4.1.4 Concrete ring beams and cavity construction ............................................................. 38 4.1.5 Construction material type .......................................................................................... 38 4.1.6 Construction date ......................................................................................................... 39 4.1.7 Occupancy type ............................................................................................................. 39 4.2 DAMAGE ASSESSMENTS ......................................................................................................... 40 4.2.1 Placard data from level 1 inspections ......................................................................... 40 4.2.2 General damage classification scheme ........................................................................ 40 4.3 COMPARING ASSESSED DAMAGE LEVEL AND BUILDING PLACARD DATA ................................. 42 4.4 DAMAGE FOR DIFFERENT BUILDING FORMS ........................................................................... 43 4.5 DAMAGE TO INDIVIDUAL BUILDING ELEVATIONS ................................................................... 45 4.6 DAMAGE TO AWNINGS ............................................................................................................ 46 4.7 WALL CORNER DAMAGE ......................................................................................................... 46 4.8 DAMAGE DUE TO POUNDING .................................................................................................. 46 4.9 THE PERFORMANCE OF TEMPORARY SECURING AND SHORING .............................................. 46 4.10 DIRECTIONALITY EFFECTS ..................................................................................................... 47 4.11 BUILDING DEMOLITION DATA................................................................................................. 47 4.11.1 Condition of protected and heritage buildings ........................................................... 47 SECTION 5: THE PERFORMANCE OF EARTHQUAKE STRENGTHENING TECHNIQUES............................................................................................................................ 49 5.1 EARTHQUAKE STRENGTHENING OF HERITAGE BUILDINGS .................................................... 49 5.2 NUMBER OF EARTHQUAKE STRENGTHENED URM BUILDINGS .............................................. 50 5.3 PARAPET RESTRAINTS ............................................................................................................ 51 5.4 TYPE A EARTHQUAKE STRENGTHENING TECHNIQUES ........................................................... 53 5.4.1 Gable end wall restraints ............................................................................................. 54 5.4.2 Roof diaphragm improvement ..................................................................................... 56 5.4.3 Floor diaphragm improvement.................................................................................... 56
iv
ENG.UOA.0002.6
The Performance of Earthquake Strengthened URM Buildings in the Christchurch CBD in the 22 February 2011 Earthquake 5.5 5.6
TYPE B EARTHQUAKE STRENGTHENING TECHNIQUES ........................................................... 57 COMPARISON BETWEEN EARTHQUAKE STRENGTHENING SCHEMES AND OVERALL BUILDING DAMAGE ............................................................................................................................................. 59
SECTION 6: INFLUENCE OF EARTHQUAKE STRENGTHENING LEVEL ON OBSERVED DAMAGE AND ASSESSED HAZARD.................................................................... 61 6.1 COMPARISON OF %NBS AND ASSESSED DAMAGE LEVEL ....................................................... 61 6.1.1 Damage interpretations ............................................................................................... 67 6.2 RISK TO BUILDING OCCUPANTS AND PASSERS-BY .................................................................. 68 6.2.1 Occupant and passer-by hazard for differing levels of building damage ................. 69 6.2.2 Occupant and passer-by hazard for differing levels of earthquake strengthening ... 69 6.2.3 Damage due to neighbouring buildings ...................................................................... 70 SECTION 7:
SAMPLE COLLECTION AND IN-SITU TESTING ......................................... 71
7.1 MASONRY MATERIAL PROPERTIES ........................................................................................ 71 7.1.1 Material properties used in prior earthquake strengthening design ......................... 72 7.1.2 Mortar compressive strength ....................................................................................... 72 7.1.3 Brick compressive strength .......................................................................................... 74 7.2 STUDIES ON THE EARTHQUAKE PERFORMANCE OF ADHESIVE ANCHORS IN MASONRY ........... 75 7.2.1 Observed earthquake performance of adhesive anchors............................................. 76 7.2.2 In-field testing of adhesive anchor connections in existing clay brick masonry walls 76 SECTION 8: 8.1 8.2
RECOMMENDATIONS AND CLOSING REMARKS ..................................... 80
RECOMMENDATIONS .............................................................................................................. 80 CLOSING REMARKS ................................................................................................................ 81
SECTION 9:
REFERENCES ....................................................................................................... 83
9.1 REFERENCES PROVIDED BY MR TURNER ............................................................................... 90 9.2 REFERENCES PROVIDED BY MR LIZUNDIA ............................................................................. 91 9.2.1 Codes, Model Codes, and Related Documents ............................................................ 91 9.2.2 California URM Law Policy Discussions .................................................................... 92 9.2.3 Seismic Evaluation and Rehabilitation Guidelines ................................................... 92 9.2.4 Evaluating the Capacity of Damaged Buildings ........................................................ 93 9.2.5 Earthquake Damage Studies ....................................................................................... 94 9.2.6 Cost and Lost Estimation Studies ............................................................................... 94 APPENDIX A: TERMS OF REFERENCE – ROYAL COMMISSION OF INQUIRY INTO BUILDING FAILURE CAUSED BY THE CANTERBURY EARTHQUAKE .......................... 96 APPENDIX B:
OBSERVED PERFORMANCE OF PARAPET RESTRAINTS ............... 100
v
ENG.UOA.0002.7
The Performance of Earthquake Strengthened URM Buildings in the Christchurch CBD in the 22 February 2011 Earthquake
Glossary and abbreviations
Acceleration response spectra
Anchor
Braced frame
Cantilever Cavity
Central Business District (CBD) Diaphragm
Ductility
A diagram that shows the peak ground acceleration that a building of a specific period will be subjected to. The spectra can be used to assess both the seismic inertial forces induced in an elastically responding structure and the amount of induced displacement relative to the ground A structural element used to assist with connecting various parts of the building, such as between floors and walls. In URM buildings anchors have frequently been added after the original construction A structural system that consist of beams, columns, and stiff diagonal braces that perform like shear walls, but use less material (see also ‘moment frame’). In masonry buildings a braced frame would normally be constructed of structural steel A structural element that is rigidly connected at one end, and is unsupported along its length and at its other end A method of wall construction where there is an inner and an outer leaf (or layer) of masonry and a central gap (cavity) that has the function of providing ventilation and a pathway for moisture to exit the wall (see also solid construction). The air in the cavity also has insulation value The terms of reference for the Royal Commission define the Christchurch City CBD to mean the area bounded by the 4 avenues (Bealey Avenue, Fitzgerald Avenue, Moorhouse Avenue, and Deans Avenue); and Harper Avenue A horizontal or inclined structural element within a building that has the function of providing stiffness and stability to perpendicular walls and to transmit loads to these walls. In unreinforced masonry buildings this term is normally applied to mid-height floors and to roofs, which in both cases are usually constructed of timber The ability of a building or a structural element of a building to be able to plastically deform without losing strength
vi
ENG.UOA.0002.8
The Performance of Earthquake Strengthened URM Buildings in the Christchurch CBD in the 22 February 2011 Earthquake Earthquake Prone Building Earthquake Risk Building Facade Fibre Reinforced Polymer (FRP) Gable wall Iconic buildings Importance Level
In-plane behaviour
Intensity Leaf (also referred to as wythe)
Magnitude (M) Mega Pascal (MPa) Moment frame
Near Surface Mounting (NSM)
Out-of-plane behaviour
A building having an expected earthquake performance that is less than or equal to 33% of that of an equivalent new building correctly designed to current standards and located at the same site (see also %NBS below) A building having an expected earthquake performance that is between 34% and 67% of that of an equivalent new building correctly designed to current standards and located at the same site (see also %NBS below) The front of a building, that typically has a more pleasant appearance than the sides and rear of the building A high strength lightweight material composed of synthetic fibres held within a polymer layer than can be used to improve the earthquake performance of a building The vertical triangular section at the top of a wall, located between the two sloping ends of a pitched roof Historically or culturally significant buildings The importance of a building in and after an earthquake. Buildings that are expected to contain large numbers of people or buildings that are expected to have an emergency function after an earthquake have higher importance. Behaviour that occurs in the direction parallel to the orientation of the structural element, which is typically a wall. The term is often used to describe failure, where for instance door and window openings in a wall may no longer have right angle corners (see also out-of-plane behaviour) A measure of the effect of an earthquake at a particular site, often measured in terms of the maximum ground acceleration at that location A leaf of masonry refers to a single vertical layer of masonry bricks. In most unreinforced masonry construction it is common to have a multi-leaf wall that has a width corresponding to the thickness of several bricks. In North America the term ‘wythe’ is usually used instead. A measure of the total energy released by the earthquake, originally based upon the Richter Scale but now determined using a revised technique called Moment Magnitude A unit of stress typically used to describe the strength of materials used in structural engineering. The same units are also used to describe material stiffness A structural system that consist of beams and columns that are connected at moment-resisting joints (see also ‘braced frame’). In masonry buildings a moment frame would normally be constructed of either structural steel or reinforced concrete An earthquake strengthening technique where slots are cut into a masonry wall and strengthening elements are inserted into the slots. The reinforcing element can then be covered over such that it is located near the surface rather than on the surface of the wall Behaviour that occurs in the direction perpendicular to the orientation of the structural element, which is typically a
vii
ENG.UOA.0002.9
The Performance of Earthquake Strengthened URM Buildings in the Christchurch CBD in the 22 February 2011 Earthquake
Parapet
Period
Pier
Render Report No. 1
Sarking boards’ Securing
Seismic zone factor Shear wall Shoring Shotcrete Solid construction Spandrel
wall. The term is often used to describe failure, where for instance a wall may deform outwards or completely collapse into the adjacent street or alley (see also in-plane behaviour) A section of wall that typically extends above the intersection between the roof and wall. The parapet may be either triangular or rectangular and is an ornamental element that may report the name or construction date of the building A structural characteristic that is used to describe how the building will oscillate in an earthquake. The period is measured in seconds and is dependent on a building’s mass and its stiffness. The term describes the time taken for a building to complete one full cycle of lateral deformation A structural element oriented vertically and typically bounded by window or door openings. The term is analogous to ‘wall’ but refers to a part of a wall when the wall has openings. A layer of mortar that is applied to the exterior of a masonry building The authors’ first report to the Royal Commission of Inquiry, having the following bibliographic details: Ingham, J. M. & Griffith, M. C. (2011). ‘The Performance of Unreinforced Masonry Buildings in the 2010/2011 Canterbury Earthquake Swarm’, Report to the Royal Commission of Inquiry into Building Failure Caused by the Canterbury Earthquakes’, Accessed at: http://canterbury.royalcommission.govt.nz/Technical-Report--The-Performance-of-Unreinforced-Masonry-Buildings-inthe-2010-2011-Canterbury-Earthquake-Swarm The use of wood panels under the shingles of a roof to provide support The term ‘securing’ is used here to refer to temporary securing measures such as the addition of anchors to connect wall elevations to roof and floor diaphragms for temporary securing, or the addition of steel straps to hold cracked building corners together. A factor that numerically describes the seismicity of a region A wall that has the structural function of transmitting lateral loads to the foundations, and frequently has few or no openings (see also ‘in-plane behaviour’) Refers to the addition of bracing members (usually braced to the ground or an adjacent building) to stabilise building elements from damage in subsequent aftershocks. Concrete that is pumped through a hose and sprayed on to the surface of a wall Wall construction where multiple leafs (or layers) of masonry are used to create the wall thickness, without including a cavity A structural element oriented horizontally and typically bounded by window or door openings. The term is analogous to ‘wall’ but refers to a part of a wall when the wall has openings.
viii
ENG.UOA.0002.10
The Performance of Earthquake Strengthened URM Buildings in the Christchurch CBD in the 22 February 2011 Earthquake Strongback Typology Unreinforced masonry (URM)
Territorial Authorities
Veneer
%NBS
A structural element that is added to a wall to increase its stiffness, typically oriented vertically A systematic classification of types that have similar characteristics Construction of clay brick or natural stone units bound together using lime or cement mortar, without any reinforcing elements such as steel reinforcing bars. The term herein is used for a class of building that in North America is referred to as a ‘URM bearing wall building’ and furthermore is herein used to exclude reference to masonry infilled concrete frames and to confined masonry construction. Territorial authorities are the second tier of local government in New Zealand, below regional councils, and are based on community of interest and road access. There are 67 territorial authorities Masonry veneer refers to the practice of using masonry to form the external vertical envelope of a building when the internal structure of the building may be of a different form. In New Zealand it is common to construct timber framed residences having masonry veneer. The term may also be used to describe a decorative outer leaf of brick in multi-leaf construction Percentage New Building Standard: A number that scores the expected earthquake performance of a building compared to that of an equivalent new building correctly designed to current standards and located at the same site
ix
ENG.UOA.0002.11
The Performance of Earthquake Strengthened URM Buildings in the Christchurch CBD in the 22 February 2011 Earthquake
Executive Summary
Following the 22 February 2011 Christchurch earthquake a comprehensive damage survey of the unreinforced masonry (URM) building stock of Christchurch was undertaken, principally led by Lisa Moon, a doctoral research student from the University of Adelaide, and by Dmytro Dizhur, a doctoral research student from the University of Auckland. Lisa and Dmytro were supported by a number of research colleagues and the information contained in this report is attributable to their collective efforts. In late July 2011 the authors provided to the Royal Commission of Inquiry a report that provided background information on the characteristics of the national URM building stock and details of the damage information to Christchurch URM buildings that had been collated following the 4 September 2010 Darfield earthquake. In September 2011 the authors were requested to prepare an Addendum Report documenting the damage to Christchurch URM buildings in the 22 February 2010 earthquake. Because of the wealth of data that has been collected and the need to expeditiously provide the Commission with this Addendum Report, a decision was made to exclusively focus on URM buildings located in the CBD zone. The collected damage data was supplemented by technical drawings and calculations on file with the Christchurch City Council, plus the use of post-earthquake aerial photography where available. The procedure used to collect and process information associated with damage, general analysis and interpretation of the available survey data for 370 buildings, the performance of earthquake strengthening techniques, the influence of earthquake strengthening levels on observed damage, and finally material and in-situ testing are reported here. With respect to URM buildings in the 22 February 2011 Christchurch earthquake the principal findings from this subsequent investigation are:
97% of URM buildings that had received no prior earthquake strengthening were either seriously damaged (i.e. suffered heavy or major damage) or collapsed. 90%
1
ENG.UOA.0002.12
The Performance of Earthquake Strengthened URM Buildings in the Christchurch CBD in the 22 February 2011 Earthquake
of unretrofitted buildings have since been demolished or are currently scheduled to be demolished 63% of all URM buildings in the CBD had received some form of earthquake strengthening o 68% of heritage and protected URM buildings had received some form of earthquake strengthening, whereas 58% of buildings not listed as heritage or protected had received some form of earthquake strengthening.
With respect to URM buildings that had received some form of earthquake strengthening:
Of those URM buildings that had been earthquake strengthened to less than 33%NBS, 60% were seriously damaged (i.e., suffered heavy or major damage) or collapsed Of those URM buildings that had been earthquake strengthened to 34-67%NBS, 72% were seriously damaged or collapsed Of those URM buildings that had been earthquake strengthened to 67-100%NBS, only 24% were seriously damaged or collapsed Of those URM buildings that had been earthquake strengthened to 100%NBS or greater, none were seriously damaged or collapsed.
With respect to earthquake strengthening methods:
44% of restrained parapets failed, compared with failure of 84% of unrestrained parapets. Whilst parapet restraint generally improved earthquake performance, it is clear that many parapet restraints failed to perform as intended. Clearly, parapet retrofits provided some earthquake resistance but probably less would be expected. This somewhat surprising result was partly attributable to the observed poor performance of adhesive anchorage systems and may have also been due to parapets being secured to roof systems having diaphragms that were too flexible 57% of restrained gable end walls failed, compared with 88% of unrestrained gable end walls. Similar to parapets, whilst gable restraint also generally improved earthquake performance, it is clear that many gable restraints also failed to perform as intended.
Further investigation should be conducted to ascertain which parapet and gable wall retrofit techniques were most effective and why, in order to improve the effectiveness and reliability of earthquake strengthening solutions in the future. There is clear evidence that installed earthquake strengthening techniques reduced damage levels, that Type A+B retrofits were significantly more effective at reducing overall structural damage, and that shotcrete strengthened wall retrofits and added cross wall retrofits appeared to be more effective than steel strongback retrofits, again probably due to better material deformation compatibility with masonry.
2
ENG.UOA.0002.13
The Performance of Earthquake Strengthened URM Buildings in the Christchurch CBD in the 22 February 2011 Earthquake Additional findings are that:
In general, the earthquake strengthening techniques applied to Christchurch URM buildings are consistent with the earthquake strengthening techniques used in California. California is specifically used as a benchmark because of the repeated number of large earthquakes that have been experienced there in the previous several decades, and the similarity in the characteristics of its URM building stock. Also, the authors’ first report was peer reviewed by two people resident in California, and the authors encourage all readers to incorporate those peer review reports into the collective information available on the earthquake performance of URM buildings Observations indicate that the characteristics of the Christchurch URM building stock located outside the CBD zonation differ somewhat from that reported here, with a greater proportion of URM buildings located outside the CBD having cavity wall construction. This data will need to be amalgamated with the data reported herein in order to obtain a complete understanding of the overall damage to Christchurch URM buildings.
3
ENG.UOA.0002.14
The Performance of Earthquake Strengthened URM Buildings in the Christchurch CBD in the 22 February 2011 Earthquake
Section 1: Introduction
This section provides introductory information on the scope and purpose of this report. This report is an addendum to the authors’ earlier report to the Royal Commission of Inquiry into Building Failure Caused by the Canterbury Earthquakes1, hereafter referred to as ‘Report No. 1’. The Commission specifically requested supplementary information on the performance of unreinforced masonry (URM) buildings in the Christchurch Central Business District (CBD, as defined in the Terms of Reference for the Royal Commission), for the earthquakes that occurred on 22 February 2011 and later. In particular, the Commission specifically requested further details on the performance of URM buildings located in the CBD that had received prior earthquake strengthening2.
Ingham, J. M. & Griffith, M. C. (2011). ‘The Performance of Unreinforced Masonry Buildings in the 2010/2011 Canterbury Earthquake Swarm’, Report to the Royal Commission of Inquiry into Building Failure Caused by the Canterbury Earthquakes’, Accessed at: http://canterbury.royalcommission.govt.nz/Technical-Report---The-Performance-of-UnreinforcedMasonry-Buildings-in-the-2010-2011-Canterbury-Earthquake-Swarm 2 Note that the term ’Earthquake Strengthening’ is used throughout this report to refer to the exercise of improving the seismic performance of a building in an earthquake. For unreinforced masonry buildings this improvement is almost always associated with the incorporation of additional structural components or elements that do increase the building’s strength. However, in the more general sense the phrase can be applied to alternative techniques also, which may modify the building’s structural dynamic characteristics in a manner that does not make the building stronger, but does allow the building to perform better when subjected to earthquake loads. 1
4
ENG.UOA.0002.15
The Performance of Earthquake Strengthened URM Buildings in the Christchurch CBD in the 22 February 2011 Earthquake In response to this request the authors and their postgraduate student research team compiled a database on the performance of 370 URM buildings located in the Christchurch CBD, and accessed technical drawings from Christchurch City Council for 74 buildings that had been earthquake strengthened. This report summarises the collated data from this database. In summary it was determined that 232 (63%) URM buildings in the Christchurch CBD had some form of earthquake strengthening, with 149 (34%) parapets having restraints installed, out of a total of 435 parapets surveyed. From the collected information it was possible to assign a %NBS value of strengthening to 94 URM buildings in the Christchurch CBD.
1.1 Peer review comments Report No. 1 was peer reviewed by Mr Fred Turner of the Californian Seismic Safety Commission3 and Mr Bret Lizundia of Rutherford & Chekene from San Francisco4. The authors are indebted to both Mr Turner and Mr Lizundia for the high quality of their reviews, and encourage all readers to treat these review comments as an integral part of the overall reporting of the performance of URM buildings in the recent Christchurch earthquakes. In particular, the authors wish to re-state a key comment made by Mr Turner:
Limitations of Retrofits: The recommendations should acknowledge, as evidenced from past retrofit performance, that it is neither practical nor feasible to state conclusively that the public can be effectively protected from “all” falling hazards and that “strengthened URM buildings will survive severe earthquake ground motions.” Other similar policy documents use qualifying phrases to characterize the limits of performance objectives such as: “risk reduction programmes” (NZSEE 2006); “reduce the risk of life or injury” (IEBC 2009); “decrease the probability of loss of life, but this cannot be prevented” (IEBC 2006); “compliance with this standard does not guarantee such performance” (ASCE 2006); and “reduce damage and needed repairs” (CHBC, 2010). The reason for proposing these clarifications is that the public should be made aware of the practical limitations of seismic retrofits, considering the margins of safety from collapse and parts of buildings falling, particularly in light of the large known variability and uncertainty of ground motions, as well as variations and uncertainty in the quality of building materials, the states of repair, and the integrity of connections between building components. In a retrofitted URM building, a single masonry unit that may fall from an appreciable height has the potential to be lethal or cause serious injury. Retrofits that represent best practices may not always guarantee that all masonry units will remain in
See http://canterbury.royalcommission.govt.nz/Technical-Report---Peer-Review---ThePerformance-of-Unreinforced-Masonry-Buildings-in-the-2010-2011-Canterbury-EarthquakeSwarm 4 See http://canterbury.royalcommission.govt.nz/documents-bykey/20111003.4/$file/ENG.RUT.0001.pdf 3
5
ENG.UOA.0002.16
The Performance of Earthquake Strengthened URM Buildings in the Christchurch CBD in the 22 February 2011 Earthquake
place, nor that URM buildings will always avoid cost-prohibitive repairs or demolitions after experiencing severe ground motions. The authors accept the wisdom of this comment, and the uncertainty that it implies. It is also noted that Mr Lizundia has made a similar comment in this regard. It is therefore plausible to theorise that an earthquake strengthened building could perform remarkably well in an earthquake, and that the building may be immediately useable after the earthquake such that the structural engineering objectives of the earthquake strengthening design were achieved, and yet the dislodgement of even one brick could potentially cause a fatality.
1.1.1 Structural forms considered in this study Mr Lizundia has correctly identified that greater clarity is merited regarding the definition of buildings that have been considered in the scope of the current study. The authors have previous research experience with reinforced concrete masonry buildings (see for instance Voon & Ingham (2006) and Voon & Ingham (2007)) and also with both confined masonry construction and buildings constructed using concrete frames with masonry infill, following their post-earthquake research in Sumatra (see Griffith et al. 2010). The authors have also collated damage statistics following the Christchurch earthquake for buildings constructed with a timber frame and having a masonry veneer. The study reported both herein and in Report No. 1 has exclusively focussed on clay brick unreinforced masonry (URM) buildings, which in North America are referred to as URM bearing wall buildings. This scope was requested by the members of the Royal Commission.
1.2 The learning experience provided by the Christchurch earthquakes It is customary for innovations in structural earthquake engineering to be developed through a process of laboratory experimental testing and supplementary computer modelling, matched with a rational design procedure, such that the structural engineering community discerns the innovation to be appropriate for implementation into actual buildings. In some cases, further in-field testing may be conducted on parts of buildings in which the innovation has been installed, in an attempt to simulate the effect of earthquake loading and identify likely behaviour. Consequently, it is to be expected that many earthquake strengthening techniques are implemented primarily on the basis of laboratory evidence of their suitability, rather than their observed adequate performance in past earthquakes. Based upon the above, it is suggested that the well documented earthquake performance of such a large number of unreinforced masonry buildings that had received various levels of prior strengthening ranging from unstrengthened (referred to here as ‘as-built’) to fully strengthened (corresponding to 100%NBS) is a somewhat unique event, particularly when accounting for the number and intensity of the aftershocks that these buildings were subjected to. Consequently, these observations are of major significance
6
ENG.UOA.0002.17
The Performance of Earthquake Strengthened URM Buildings in the Christchurch CBD in the 22 February 2011 Earthquake in order to gain an updated understanding of the likely seismic performance of previously strengthened URM buildings located not only throughout New Zealand, but also in countries having an analogous stock of URM buildings, such as for instance Australia and West Coast USA. Furthermore, it may be argued that the observations reported herein have relevance to the likely seismic performance of URM buildings worldwide. Mr Lizundia has independently made a similar comment in his peer review. Since release of Report No. 1 it has been evident that readers and commentators are particularly interested in such aspects as:
How have buildings performed when they were strengthened to 34%NBS (the minimum level required by the Building Act), to 67%NBS (the minimum level recommended by the New Zealand Society for Earthquake Engineering; NZSEE) and to 100%NBS (corresponding to the seismic loading used for the design of new structures)? The answers to these questions are of tremendous significance as they provide insight into the adequacy of current legislation, and whether alterations to this legislation may be warranted. What specific seismic improvement techniques have been shown to perform well when subjected to ‘real world’ earthquake loading, and what techniques have failed to perform in the manner anticipated. The answers to these questions will likely have significance for future earthquake strengthening strategies employed both in New Zealand and elsewhere worldwide.
1.3 Scope and purpose This document reports the performance of earthquake strengthened unreinforced masonry buildings located in the Christchurch CBD, during the 22nd February 2011 earthquake. The report also provides details on the performance of various earthquake strengthening techniques that had been used in these buildings. The report should be read in conjunction with the authors’ Report No. 1 and the peer review reports of Mr Turner and Mr Lizundia. The Terms of Reference of the Royal Commission of Inquiry are reproduced in Appendix A
1.4 Disclaimer The authors wish to emphasise that they are unqualified to make an informed comment on the cost of earthquake strengthening of URM buildings, beyond the very preliminary comments made in the original report that was primarily a reproduction of the data
7
ENG.UOA.0002.18
The Performance of Earthquake Strengthened URM Buildings in the Christchurch CBD in the 22 February 2011 Earthquake since made available on the Royal Commission website5. No effort is made herein to place a cost on any earthquake strengthening that is reported. The authors have had no prior involvement with any earthquake strengthening projects in Christchurch that were implemented prior to 22 February 2011. The data reported herein is believed to be correct and reported without bias.
.
See http://canterbury.royalcommission.govt.nz/documents-by-key/2011-0923101/$file/ENG.HOL.0001.pdf 5
8
ENG.UOA.0002.19
The Performance of Earthquake Strengthened URM Buildings in the Christchurch CBD in the 22 February 2011 Earthquake
Section 2: URM earthquake strengthening techniques used in California
As noted in Section 1, the authors’ Report No. 1 was peer reviewed by Mr Turner and Mr Lizundia, both of California, USA. This section is included herein in an attempt to briefly demonstrate the similarities in earthquake strengthening practices between California and New Zealand, and by extension the suitability of using Californian peer reviewers in this reporting exercise. Furthermore, both reviewers have provided an extensive set of references that have been reproduced herein as sections 9.1 and 9.2. As further outlined below, California has both an analogous stock of URM buildings and a comparable seismicity to New Zealand, but with both more large earthquakes having caused major building damage in California over the last century and with a greater population, it is natural that significant effort relevant to New Zealand has been committed in California to the authoring of references associated with earthquake strengthening of URM buildings. Indeed, many New Zealand engineers have previously consulted US documents when designing earthquake strengthening solutions for New Zealand URM buildings.
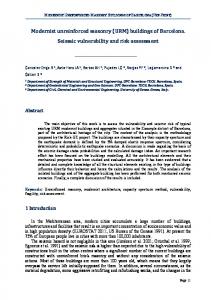
2.1 Comparison of URM building typologies Details of the architectural characteristics of the New Zealand URM building stock have been reported in Section 2 of Report No. 1, with representative photographs of different building typologies reported in Figure 2.8 of Report No. 1. Figure 2.1 provides illustrations of the similarities between building typologies in New Zealand and the State of California.
9
ENG.UOA.0002.20
The Performance of Earthquake Strengthened URM Buildings in the Christchurch CBD in the 22 February 2011 Earthquake
(a) San Luis Obispo, Cal -Typology A
(b) Auckland, NZ - Typology A
(c) San Luis Obispo, Cal -Typology C
(d) Bulls, NZ - Typology C
(e) San Francisco –Typology E
(f) Auckland –Typology F
Figure 2.1 Comparison of New Zealand and Californian URM building stock
10
ENG.UOA.0002.21
The Performance of Earthquake Strengthened URM Buildings in the Christchurch CBD in the 22 February 2011 Earthquake
2.2 Seismic improvement approach The peer review comments of Mr Lizundia provide comprehensive details on standard earthquake strengthening practice is California, with the two documents:
ASCE 41-06 (also previously known as FEMA 356) titled ‘Seismic Rehabilitation of Existing Buildings Standard’ FEMA 547 titled ‘Guidelines on Seismic Rehabilitation of Existing Buildings’
being the appropriate documents to use in California for earthquake strengthening of URM buildings. These documents are well known and have been widely consulted by New Zealand structural engineers undertaking earthquake strengthening.
2.3 Seismic improvement techniques 2.3.1 Parapet restraints Parapet bracing is typically undertaken using a steel brace angle that is anchored into the top of the parapet and secured back to the roof structure. Typically the roof area where the brace is being connected to also requires localised strengthening to adequately support the brace forces. A typical parapet bracing detail is shown Figure 2.2.
Figure 2.2 Parapet restraint detail (FEMA 547, 2006)
11
ENG.UOA.0002.22
The Performance of Earthquake Strengthened URM Buildings in the Christchurch CBD in the 22 February 2011 Earthquake Removal of the unreinforced masonry parapet is typically combined with the addition of a concrete cap or bond beam in order to compensate for the reduction in wall axial compressive stresses and the negative effect the reduced stress level has on the capacity of roof-to-wall anchors. The concrete cap or bond beam is then typically anchored into the roof. Typical details of parapet removal and concrete cap beam are shown in Figure 2.3. See also Figure B.1(a) for an examples where this type of construction failed in the 22 February 2011 Christchurch earthquake.
Figure 2.3 Parapet removal and concrete cap beam installation (FEMA 547, 2006)
12
ENG.UOA.0002.23
The Performance of Earthquake Strengthened URM Buildings in the Christchurch CBD in the 22 February 2011 Earthquake
2.3.2 Wall‐to‐diaphragm ties Ties that connect masonry walls and timber floor or roof diaphragms are used to secure the separate building components together. Two examples from California that show this type of earthquake strengthening are shown in Figure 2.4.
(a) Extensive addition of wall-todiaphragm anchorage, San Louis Obispo
(b) Extensive addition of wall-todiaphragm anchorage, San Louis Obispo
Figure 2.4 Addition of wall-to-diaphragm connections
2.3.3 Inter‐storey wall supports The provision of inter-storey wall supports, commonly referred to as “strong-backs”, is commonly used in the United States to increase the out-of-plane wall capacity of tall thin walls. Examples of this technique are shown in Figure 2.5.
(a) Installation of steel moment frames and steel strong-backs, San Louis Obispo
(b) Addition of internal strong-backs and extensive anchorage of masonry, San Louis Obispo Figure 2.5 Addition of strong-backs for increased out-of-plane wall capacity
2.3.4 In‐plane wall strengthening Due to the commercial need for open shop fronts, moment frames are the most common way to retrofit unreinforced masonry frames without introducing obstructions to door and window openings. Numerous examples can be seen of braced frames (see Figure 2.6) and shotcrete retrofit (see Figure 2.7), as well as the application of surface bonded Fibre
13
ENG.UOA.0002.24
The Performance of Earthquake Strengthened URM Buildings in the Christchurch CBD in the 22 February 2011 Earthquake Reinforced Polymer (FRP) overlays. Examples were also identified of centre-coring and the insertion of either grouted reinforcing bars or unbounded post-tensioning.
(b) Steel moment frames used in a (c) Reduction of (a) Steel k-brace frames multi storey URM building in San window opening to used in a multi storey Francisco increase in-plane wall URM building in San capacity Francisco Figure 2.6 Addition of lateral resisting systems
(a) Internally applied shotcrete to a URM building located in San Francisco
(b) Shotcrete applied to (c) Externally applied a URM building shotcrete to a URM located in San building located in San Francisco Francisco Figure 2.7 Shotcrete rehabilitation technique
2.4 Summary As shown in the previous sections and by making comparison with the information presented in section 4 of Report No. 1, it can be seen that the methods used to earthquake strengthen URM buildings in Christchurch are very similar to the techniques used in California.
14
ENG.UOA.0002.25
The Performance of Earthquake Strengthened URM Buildings in the Christchurch CBD in the 22 February 2011 Earthquake
Section 3: Building Inspection and Data Processing Details
In this section the procedures used to collect and process information associated with damage to URM buildings following the 22 February 2011 earthquake are reported. Details are provided regarding the general building information that was collected, and parameters that were used to describe damage to individual building elements. Information is also provided regarding assessed risk levels for potential building occupants and for potential passers-by located directly adjacent to and outside the URM building. Categories used to describe various types of earthquake strengthening are then detailed, with illustrations provided for the most commonly encountered techniques. The section concludes with an explanation of how %NBS was calculated for cases where sufficient information was available to make a determination.
3.1 Data collection process Commencing in March 2011 a team of researchers was deployed to document and interpret the observed earthquake damage to masonry buildings in the Canterbury region, by investigating the failure patterns and collapse mechanisms that were commonly encountered. The procedure used by Urban Search and Rescue (USAR) was adopted, where the Christchurch CBD was discretised into numbered blocks. Building surveys were primarily external only, with all building elevations surveyed where this was safe and access was available. However, when safe and when access was available, internal building inspections were also undertaken.
15
ENG.UOA.0002.26
The Performance of Earthquake Strengthened URM Buildings in the Christchurch CBD in the 22 February 2011 Earthquake Throughout the CBD numerous active demolition sites were visited and inspected. In many cases these inspections allowed the building’s internal structure to be partially inspected during the demolition process, which otherwise would not have been possible due to safety considerations. This exercise also allowed for relatively straightforward collection of small building samples from building demolition sites, including: brick and mortar samples, through ties with timber assemblages, adhesive anchor rods, and cavity ties. Inspection of demolition sites also proved to be valuable when attempting to identify the seismic strengthening systems within the internal parts of the building, and when seeking to investigate the quality of earthquake strengthening installations, particularly for adhesive type anchors. Christchurch City Council (CCC) property records were requested and reviewed in order to confidently identify cases of earthquake strengthening, with 82 URM buildings located in the Christchurch CBD selected. Time constraints restricted a greater number of records from being reviewed. However, in some cases the CCC records lacked information about earthquake assessment and strengthening, or any structural aspects of the building. Therefore only 74 sets of records were used in the study, representing 20% of the 370 URM buildings in the CBD database. Google maps were extensively used throughout the survey for:
Identifying building addresses, business names and building boundaries Providing imagery prior to the earthquake, and allowing identification of buildings and of building elevation types, for buildings that suffered extensive damage such that details were unrecognisable following the earthquake.
Post-earthquake aerial photography was extensively used throughout the damage analysis stage of this survey. In particular, post-earthquake aerial photograph was used for:
Identification of out-of-plane cantilever type failure modes was typically made possible (see section 3.4.2) Identification of parapet failures and other building components in the regions of buildings otherwise not visible from the street elevation (see section 3.7).
3.2 Survey population Only buildings located in the Christchurch CBD area were included within the survey reported herein, being those URM buildings located with the region confined by the four main avenues as specified in the Terms of Reference for the Royal Inquiry and reproduced herein as Appendix A. The CBD was delineated as:
South of Bealey Avenue North of Moorhouse Avenue West of Fitzgerald Avenue East of Deans Avenue.
16
ENG.UOA.0002.27
The Performance of Earthquake Strengthened URM Buildings in the Christchurch CBD in the 22 February 2011 Earthquake See Figure 3.1 for the location of the 370 URM building included in the database. All surveyed buildings were constructed of load-bearing unreinforced clay brick or natural stone masonry, with no building that was constructed having a concrete frame with masonry infill being incorporated into the study. Significant effort was made to ensure that all URM buildings located in the Christchurch CBD were incorporated into the survey. However it is known that approximately 10 buildings were not incorporated into the survey database due to limited available information on these buildings. Hence it is thought that the database includes approximately 97% (370 of 380 possible) of the URM buildings located in the Christchurch CBD area.
Figure 3.1 Location of URM buildings included in this study
3.3 Survey data Survey assessment forms were specifically developed for assessment of the earthquake performance of Christchurch URM buildings. Details explaining the nature of the individual parameters that were surveyed are reviewed below.
3.3.1 General building information General building information was recorded, such as:
The address (building number and street) The building’s original name and current name as of February 2011
17
ENG.UOA.0002.28
The Performance of Earthquake Strengthened URM Buildings in the Christchurch CBD in the 22 February 2011 Earthquake
The name of the business(es) operating within the building as of February 2011 The date of construction, if known Whether the building was registered with the New Zealand Historic Places Trust under the Resource Management Act 1991 or whether the building was on the Christchurch City Council list of protected buildings.
The following information was also noted:
Number of storeys The presence of a basement The occupancy type The building typology (in accordance with the classification detailed in section 2.2 of Report No. 1) Whether the buildings was a row building or a stand-alone building If the building was a row building, whether it was located mid-row or end-of-row.
The level 1 placard data available from the CCC was recorded for each building and if known, the level 2 inspection placard status was also recorded. The current damage state of the building at the time of writing was noted, using the classifications of:
Demolished Partially demolished Scheduled for demolition Standing.
3.3.2 Condition of timber diaphragms Where possible the condition of the floor and roof diaphragms was visually assessed and a condition rating was assigned based upon the corresponding condition description as detailed in Table 3.1. Table 3.1 Diaphragm condition visual assessment criteria Condition Rating Good
Fair
Poor
Condition description Timber free of Bora; little separation of floorboards; no sign of past water damage; little or no nail rust; floorboard-to-joist connection tight; coherent and unable to wobble Little of no Bora; less than 3 mm of floorboard separation; little or no signs of past water damage; some nail rust but integrity still fair; floorboard-tojoist connection has some but little movement; small degree timber wear surrounding nail Considerable Bora: floorboards separation greater than 3 mm; water damage evident; nail rust extensive; significant timber degradation surrounding nails; floorboard-to-joist connection appears loose and able to wobble.
Examples of fair and poor roof diaphragms are shown in Figure 3.2.
18
ENG.UOA.0002.29
The Performance of Earthquake Strengthened URM Buildings in the Christchurch CBD in the 22 February 2011 Earthquake
(a) Example of fair roof diaphragm (b) Example of poor roof diaphragm condition condition Figure 3.2 Diaphragm condition examples
3.3.3 Building elevation details The orientation of the main facade (or of multiple facades where present) was noted, as were details of the building elevation types. Elevation types were divided into three categories:
Solid wall Solid wall with a few openings Perforated frame (piers and spandrels).
Where possible each building elevation was assigned a type. elevation types are shown in Figure 3.3.
(a) Solid wall
Examples of building
(b) Solid wall with a few openings
(c) Perforated masonry frame, 236 Tuam Street
Figure 3.3 Classification of building elevations
3.3.4 Concrete ring beams Buildings having concrete ring beams were identified, with an illustration of this type of construction shown in Figure 3.4. It is important to recognise that this form of construction is distinct from the ‘concrete frame with masonry infill’ construction type as there are no vertical concrete elements in this type of construction. Buildings constructed from concrete frame with masonry infill were excluded from this study.
19
ENG.UOA.0002.30
The Performance of Earthquake Strengthened URM Buildings in the Christchurch CBD in the 22 February 2011 Earthquake
Figure 3.4 Concrete ring beams example
3.3.5 Cavity construction Cavity construction refers to a form of wall construction where an air gap is left between leaves or wythes of brick. During post-earthquake inspections cavity construction was encountered in almost half of the URM buildings surveyed in Christchurch, with the remainder having solid interconnected multi-leaf walls. However, it was identified that there were comparatively few URM buildings within the Christchurch CBD having cavity construction. A single leaf of outer clay brick veneer is the most common type of cavity construction, with the inner section being two or more leaves thick, although double leaves on each side of the cavity were also observed. Leaves on either side of a cavity are typically held together by regularly spaced metal cavity ties, but in the case of poor connection between the leaves the outer veneer layer can ‘peel’ separately, as illustrated in Figure 3.5(a). It was commonly observed that some cavity ties in failed cavity walls had deteriorated and were in poor condition due to rust, as shown in Figure 3.5(b). Out-of-plane failure of the veneer was typically attributed to either the deteriorated condition of the metal ties or to pullout of the ties from the mortar bed joints due to the use during construction of weak lime mortar.
(a) Out-of-plane failure of a single (b) Metal cavity ties in poor rusted leaf veneer condition Figure 3.5 Cavity wall failure
20
ENG.UOA.0002.31
The Performance of Earthquake Strengthened URM Buildings in the Christchurch CBD in the 22 February 2011 Earthquake
3.3.6 Awnings Awnings (also called canopies) frequently sustained significant damage due to masonry debris falling from collapsed parapets, gable ended walls, or upper storey walls. An example of a collapsed awning is shown in Figure 3.6.
Figure 3.6 Collapse of awnings due to falling debris, at the corner of Colombo and Kilmore Streets looking north-east
3.4 Wall failure mechanisms The earthquake failure mechanisms for unreinforced masonry walls are complex, with overall behaviour customarily separated into in-plane response and out-of-plane response. Damage to wall corners also arises due to interaction between these failure modes. All three categories of wall failure mechanisms are briefly reviewed below.
3.4.1 In‐plane damage mechanisms In-plane wall failure modes can be associated with pier, spandrel or joint failure of masonry frames, including both diagonal tension failure and rocking and toe crushing failure for masonry piers. Horizontal bed joint sliding may also occur. These failure modes are shown schematically in Figure 3.7.
21
ENG.UOA.0002.32
The Performance of Earthquake Strengthened URM Buildings in the Christchurch CBD in the 22 February 2011 Earthquake
Figure 3.7 FEMA 306 Classification of in-plane failure modes (FEMA, 1999a) Representative examples of in-plane failure to unreinforced masonry walls, which occurred during the 22 February 2011 earthquake, are shown in Figure 3.8.
22
ENG.UOA.0002.33
The Performance of Earthquake Strengthened URM Buildings in the Christchurch CBD in the 22 February 2011 Earthquake
Pier Toe Crushing
Spandrel Diagonal Tension
Spandrel Diagonal Tension
Pier Rocking
(a) Spandrel failures, 203 Hereford Street
(b) Spandrel failures, 144 Gloucester Street
(c) Weak piers, pier rocking, 82 Lichfield Street
(d) Complete collapse of top storey due to weak piers, 84 Lichfield Street
(e) Weak piers, 156 Gloucester Street
Figure 3.8 Examples of in-plane wall failure modes
23
ENG.UOA.0002.34
The Performance of Earthquake Strengthened URM Buildings in the Christchurch CBD in the 22 February 2011 Earthquake
3.4.2 Out‐of‐plane damage mechanisms Out-of-plane wall collapse was the most commonly observed failure mode for clay brick URM buildings following the 22 February 2011 aftershock, with many two-storey buildings losing their entire front facades or upper storey walls (see Figure 3.9(a-c)).
(a) Aerial view of damage, 202-204 Madras Street
(b) North elevation damage view, 202-204 Madras Street Evidence of one-way bending failure
(c) Out-of-plane collapse of parapet and facade, 105 -109 Manchester Street
(d) One-way out-of-plane bending wall failure below a concrete ring beam (building located outside CBD)
(f) Two-way bending out-of-plane wall failure (e) FEMA 306 classification of damage due to one-way bending failure (FEMA, 1999a) Figure 3.9 Out-of-plane damage types Two primary types of out-of-plane wall failures were observed:
24
ENG.UOA.0002.35
The Performance of Earthquake Strengthened URM Buildings in the Christchurch CBD in the 22 February 2011 Earthquake
Vertical (or one-way) bending of the wall, which tended to occur in longer walls or walls without side supports (see Figure 3.9(d-e)) Two-way bending, which required support of at least one vertical edge of a wall (see Figure 3.9(f)).
Cantilever type out-of-plane failure with the entire top section of a wall or building facade collapsing (see Figure 3.9(c)) was commonly observed. However, when the top section of the wall was well connected to diaphragms, failures in vertical or two-way bending were observed. Post-earthquake aerial photography was used where possible to identify the cantilever type of out-of-plane failure (see Figure 3.9(a-b)).
3.4.3 Wall corner damage The intersections between perpendicular masonry walls can sustain significant damage due to the required transfer of forces at this location and the interplay between in-plane and out-of-plane deformation modes for the two walls connected at the corner. Examples of this type of damage are shown in Figure 3.10.
(a) FEMA 306 schematic of wall corner failure mechanism (FEMA, 1999a)
(b) Corner failure
Figure 3.10 Corner failure mechanism
3.5 Overall building damage level Two scales were used to identify the overall damage observed for each building. The protocols developed by the Applied Technology Council were used because of their widespread use in past post-earthquake damage inspections, with the damage scale shown in Table 3.2. The second damage scale adopted was that developed by Wailes and Horner (1933), which was specifically developed to describe damage to unreinforced masonry buildings. Details of this damage scale are reported in Table 3.3. Figure 3.11 shows examples of damage levels A-D using the Wailes and Horner (1933) damage scale.
25
ENG.UOA.0002.36
The Performance of Earthquake Strengthened URM Buildings in the Christchurch CBD in the 22 February 2011 Earthquake Table 3.2 ATC 38/13 General Damage Classification (ATC, 1985) Classification None Insignificant Moderate Heavy Major Destroyed
Replacement Value 0% 1-10% 10-30% 30-60% 60-100% 100%
Table 3.3 Wailes and Horner (1933) Damage Scale Damage level A B C D E
Damage description Undamaged or Minor Cracking, No Significant Structural Damage, Minor Veneer Damage Parapet Failure or Separation of Veneer, Major Wall Cracking and Interior Damage Failure of Portion of Exterior Walls, Major Damage to less than 50% of walls Major Damage to more than 50% of walls Unrepairable Damage, Demolition Probably Appropriate
(a) Damage classification - Insignificant Damage level – A (292 Kilmore Street)
(b) Damage classification - Moderate Damage level – B (200 Madras Street)
(c) Damage classification - Heavy Damage level – C (120 Manchester Street)
(d) Damage classification - Destroyed Damage level – D (202 Hereford Street)
Figure 3.11 Damage classification examples
26
ENG.UOA.0002.37
The Performance of Earthquake Strengthened URM Buildings in the Christchurch CBD in the 22 February 2011 Earthquake
3.6 Overall elevation damage level The level of damage to each building elevation was based upon an adaption of the ATC 38/13 classification detailed in Table 3.2, using the following damage levels:
unknown non-visible insignificant moderate heavy extreme
Also, the orientation of each building elevation was noted in order to identify the influence of directionality on wall failure modes.
3.7 Damage to parapets Parapets are parts of URM construction that project above the roof of the building. When subjected to lateral loads, if unrestrained the parapet acts as a vertical cantilever which potentially rocks on the base support at the roof line. The level of damage to parapets and the parapet orientation were recorded. For each orientation the damage was classified as:
none minor moderate (see Figure 3.12(a)) heavy (see Figure 3.12(b)) partial collapse full collapse.
(a) Moderate damage to parapet
(b) Heavy damage to parapet
Figure 3.12 Damage level to parapets due to rocking
27
ENG.UOA.0002.38
The Performance of Earthquake Strengthened URM Buildings in the Christchurch CBD in the 22 February 2011 Earthquake
3.8 Other recorded damage The level of damage due to falling debris from adjacent building was recorded and classified as:
none minor moderate severe.
Damage due to pounding from adjacent building (see Figure 3.13) was also assessed and recorded.
Figure 3.13 Example of building pounding causing in-plane failure, High Street The level of liquefaction, lateral spreading and permanent ground settlements at each site was also recorded for each building. However, the influence of ground effects upon observed damage (as distinct from earthquake shaking effects) is not specifically addressed in this report.
3.9 Temporary shoring and securing For URM buildings damaged in the September 2010 earthquake, temporary shoring was commonly used to prevent further out-of-plane wall damage or collapse. Hence the performance of temporary shoring was assessed following the major aftershocks. Figure 3.14 shows post-September 2010 shoring that assisted in preventing collapse of URM buildings in February 2011. A critical review of the performance of temporary securing and shoring is outside the scope of this report.
28
ENG.UOA.0002.39
The Performance of Earthquake Strengthened URM Buildings in the Christchurch CBD in the 22 February 2011 Earthquake Temporary through ties
(b) Temporary securing work on a URM (a) Extensive steel temporary shoring of a building following 4 Sept. 2010 Darfield URM building following 4 Sept. 2010 earthquake, corner of Gloucester and Darfield earthquake, (building located outside CBD) Manchester Street Figure 3.14 Examples of temporary shoring and securing
3.10 Risk levels to building occupants and passers‐by The risk level or hazard for building occupants was estimated depending on the extent of observed damage, with the risk assigned to each building using the classifications of:
unlikely risk of death or serious injury likely risk of death or serious injury near certain risk of death or serious injury.
The same exercise was undertaken for the occupants (frequently referred to herein as ‘passers-by) of the public spaces that were located directly outside and adjacent to the building. Illustrations of this hazard to passers-by are shown in Figure 3.15.
3.11 Categories of earthquake strengthening The various forms of earthquake strengthening of unreinforced masonry buildings that were encountered during the survey were divided into three general categories for ease of assessment and the convenient interpretation of data. These three categories were: Parapet restraints, Type A earthquake improvements, and Type B earthquake improvement. Each category of earthquake strengthening is further discussed below.
3.11.1 Parapet restraints Recognising the obvious hazard that parapets pose to building occupants and passers-by (see section 3.10), it follows that the installation of parapet restraints is one of the earthquake strengthening techniques that is most commonly encountered in unreinforced masonry buildings.
29
ENG.UOA.0002.40
The Performance of Earthquake Strengthened URM Buildings in the Christchurch CBD in the 22 February 2011 Earthquake
(a) Entire collapse of a building on to a road, near certain risk to building occupants and to public space, 225-227 Manchester Street
(b) Partially collapsed building poses a near certain risk to building occupants and to public space , 194 Gloucester Street
(c) Partially collapsed building poses a unlikely risk to building occupants and near certain risk to public space, 195 Armagh Street
(d) Partially collapsed building poses a likely risk to building occupants and near certain risk to public space, 202 Hereford Street
Figure 3.15 Examples of risk levels to building occupants and passers-by
Typically observed methods used to provide parapet restraint include but are not limited to:
lowering of the parapets the addition of a concrete ring beam bracing of the parapet back into the roof structure via steel members connected to the parapets and secured into the masonry using either adhesive anchors or through ties.
3.11.2 Type A earthquake improvements Earthquake improvement techniques that assisted in connecting the walls and diaphragms of unreinforced masonry buildings were categorised as Type A earthquake improvements. Type A earthquake improvements were:
30
ENG.UOA.0002.41
The Performance of Earthquake Strengthened URM Buildings in the Christchurch CBD in the 22 February 2011 Earthquake
Securing/strengthening URM building elements such as gable ends (excluding parapet restraints, which were considered separately as detailed in section 3.11.1). Installing connections between the walls and the roof and floor systems of the URM building so that walls no longer respond as vertical cantilevers secured only at their base. An example of this connection type is shown in Figure 3.16(a) Stiffening of the roof and/or floor diaphragms.
Further details of these Type A earthquake strengthening techniques are provided below. 3.11.2.1 Gable end wall restraints A gable is the triangular portion of wall that is typically located at the ends of URM buildings. As with parapets, because it is widely known that gable end walls are prone to failure, it is not uncommon to find some form of restraint provided to inhibit out-ofplane failure during an earthquake. Where present, the type of gable end wall restraint was identified and recorded, using three categories:
through ties adhesive anchors original (referring to restraints installed at the time of construction)
Examples of gable end wall restraints are shown in Figure 3.16. 3.11.2.2 Wall to diaphragms connection improvement The addition of positive connection between masonry walls and the floor or roof diaphragms assists the URM building to respond as a single complete structure (rather that a set of poorly connected structural elements) when subjected to earthquake loading. This type of earthquake strengthening is typically done by the installation of:
Through tie anchors (see Figure 3.17(a)) Adhesive anchors (see Figure 3.17(b)).
3.11.2.3 Floor and roof diaphragm improvement Similar to the installation of wall to diaphragm connections, the strengthening and stiffening of flexible timber diaphragms improves the earthquake response of URM buildings. Diaphragm improvement techniques, where identified, were noted in the survey and typically consisted of:
Addition of steel bracing (see Figure 3.18(a)) Addition of horizontally oriented steel brace frames (see Figure 3.18(b)) Plywood diaphragm overlays (see Figure 3.18(c)) Addition of a concrete floor slab.
Any diaphragms not readily described using the above classifications were referred to as ‘other’.
31
ENG.UOA.0002.42
The Performance of Earthquake Strengthened URM Buildings in the Christchurch CBD in the 22 February 2011 Earthquake
(a) Restraint used at the time of constriction
(b) Restraint used at the time of constuction
(c) Example of through tie anchorage
(d) Gable collapse due to inadequate connections
Figure 3.16 Examples of gable restraints
(a) Example of through ties
(b) Example of adhesive diaphragm anchors
Figure 3.17 Diaphragm to wall connections
32
ENG.UOA.0002.43
The Performance of Earthquake Strengthened URM Buildings in the Christchurch CBD in the 22 February 2011 Earthquake
(a) Roof diaphragm improvement using steel brace frames
(b) Roof diaphragm improvement using steel braces
(c) Floor diaphragm improvement using plywood overlays
(d) Floor diaphragm improvement using overlays and steel framing
Figure 3.18 Example of diaphragm improvement techniques
3.11.3 Type B earthquake improvements Type B earthquake improvements were defined as strengthening techniques that sought to strengthen masonry walls and/or introduce added structure to supplement or replace the earthquake strength provided by the original unreinforced masonry structure. Examples of Type B earthquake improvement are:
Strong-backs installed either internally or externally Steel moment frames Steel brace frames Concrete moment frames Addition of cross walls Shotcrete FRP Post tensioning Other
In this study the term shotcrete was used to not only describe added concrete walls that have been ‘shot’ onto the URM wall using high pressure pumping equipment, but also cast concrete walls. This decision was made in order to avoid having an increased
33
ENG.UOA.0002.44
The Performance of Earthquake Strengthened URM Buildings in the Christchurch CBD in the 22 February 2011 Earthquake number of classifications that each had a minimal number of recorded cases of implementation. Further background details regarding these Type B strengthening techniques are provided in section 4 of Report No. 1.
3.11.4 Retrofit level (%NBS) The level of seismic improvement (i.e. %NBS) was obtained either from CCC records, from personal communication with building owners, engineers and heritage personnel, or in some cases where sufficient seismic details about the building were known, was based upon estimation. Assessed CCC records showed that most engineering reports provided the level of strengthening in terms of design PGA values. To convert the level of earthquake strengthening for a building to the current (2011) %NBS values the procedure outlined below was used. From NZS1170.5:2004, the horizontal design action coefficient is: C d T1
CT1 S p k
where CT C h T Z R N T, D
Assuming T = 0.5 s, and adopting soil class type D (which is typical for URM buildings located in the Christchurch CBD), C h 0.5 3.00 , Z 0.22 (now revised to 0.3), R 1.0 , and N T, D 1.0 .
Therefore C0.5 3.00 0.22 1.0 1.0 0.66 . Then k
1 for T1 < 0.7s and soil class D and S p 1.3 0.3
.
Using the recommendations from NZSEE (2011) kμ = 1.2, and therefore: 1.2
1
. .
1
1.28 and
1.28
0.3
1.3
0.89 so
0.5
.
. .
0.46
Therefore, to calculate the seismic strengthening level (%NBS) of a building given the design PGA values: Retrofit design PGA C 0.5
100%
%NBS
34
ENG.UOA.0002.45
The Performance of Earthquake Strengthened URM Buildings in the Christchurch CBD in the 22 February 2011 Earthquake
Section 4: General Damage and Demolition statistics
In this section the general analysis and interpretation of the available survey data for 370 URM buildings located in the Christchurch CBD area is presented. The presented information includes a critique of the general characteristics of the surveyed buildings, followed by a review of damage statistics for 368 buildings (damage data was not recorded for two URM buildings). Currently available statistics regarding the number of URM buildings formerly located in the Christchurch CBD that have been or are scheduled to be demolished is also provided. It is known that approximately 10 buildings located between Park Terrace and Deans Ave (in the Hagley Park area) were not incorporated into the database due to limited available information on these buildings. Hence the database is thought to contain approximately 97% (370 of 380 possible) of all URM buildings located in the Christchurch CBD. It is emphasised that data for additional URM buildings surrounding the Christchurch CBD, totalling approximately 250 additional URM buildings, has also been collected but has been excluded from the analysis reported here. This decision was made in consultation with the Royal Commission in order to expedite the release of this report.
4.1 General building characteristics In this section the general characteristics of the 370 surveyed buildings are reported. Where appropriate, comparisons are made between the URM building stock in the Christchurch CBD and the general characteristics of the national URM building stock as detailed in Report No. 1.
35
ENG.UOA.0002.46
The Performance of Earthquake Strengthened URM Buildings in the Christchurch CBD in the 22 February 2011 Earthquake
4.1.1 Number of storeys The distribution of above ground number of storeys is presented in Figure 4.1(a), where it can be seen that 59% of the surveyed buildings had two storeys and 22% of buildings surveyed had 3 storeys. Consequently two storey buildings were most prevalent and 85% of all URM buildings surveyed were multi-storey. This distribution of storey height differs from the national average as detailed in Report No. 1, where it was reported that approximately 70% of all URM buildings are thought to be single storey, but is readily explained by recognising that the surveyed buildings were exclusively from the CBD area, where building density is high. 4 st. 3%
1 st. 15%
3 st. 22%
A 2%
5 st. 1%
other 14%
C 9%
B 4%
F 18%
2 st. 59%
D 47%
E 6%
(b) Building typologies
(a) Number of storeys
Unknown 9%
Other Stand‐ 13% alone 18%
Partially demolished 2%
Standing 21%
Scheduled for demolition 10%
Row building 69%
Demolished 58%
(d) State of buildings
(c) Row buildings
Green 1%
Yellow 17%
Red 82%
(e) Level 1 placarding data (known building placards only, 337 buildings total) Figure 4.1 General building characteristics
36
ENG.UOA.0002.47
The Performance of Earthquake Strengthened URM Buildings in the Christchurch CBD in the 22 February 2011 Earthquake
4.1.2 Building typologies The distribution of all the surveyed buildings into their respective typologies (see section 2.2 of Report No. 1 for a review of typologies) is illustrated in Figure 4.1(b). Typology D (two storey row buildings) was the predominant typology in the surveyed CBD building stock. Figure 4.1(c) shows the distribution of row buildings and stand-alone buildings, again illustrating the predominance of URM row buildings in the CBD. Of the 254 (69%) row buildings, the distribution between buildings classified as being either end-of-row or mid-row was approximately equal, with 130 (51%) being end-of-row buildings and 124 (49%) being mid-row buildings.
4.1.3 Building elevations A total of 922 building elevations were surveyed, where ‘building elevation’ refers to an exterior building face. Hence two building elevations exist for a mid-row building (front and back), three building elevations exist for an end-of-row building (front, back, side) and four building elevations exist for a stand-alone building (front, back, two sides). When accounting for the mix of row and stand-alone buildings as discussed in section 4.1.2, the 922 surveyed building elevations is thought to represent approximately 84% of all building elevations associated with the 370 surveyed URM buildings. Missing data was due to restricted access for some buildings. The distribution of elevation types is presented in Table 4.1, showing that 391 (42%) of the surveyed elevations were perforated masonry frames and a further 383 (42%) building elevations were walls that were either solid (without openings) or had few openings. Table 4.1 Data distribution by elevation type Elevation type
Perforated frame (piers/spandrels) Solid wall Solid wall with a few openings Not identified Total
No. of elevations
% of elevations
391
42%
120
13%
263
29%
148
16%
922
100%
As shown in Table 4.2, 216 (55%) of the perforated frames had piers with an aspect ratio (ratio of pier vertical height divided by pier horizontal length) greater than 1 (classified as tall piers), with only 36 (9%) of the perforated frames having piers with an aspect ratio of less than 1 (classified as squat piers).
37
ENG.UOA.0002.48
The Performance of Earthquake Strengthened URM Buildings in the Christchurch CBD in the 22 February 2011 Earthquake Table 4.2 Pier aspect ratio type
Tall Squat Mix
No. of elevations 216 36 53
% of elevations 55% 9% 14%
Unspecified
86
22%
Total
391
100%
Pier type
4.1.4 Concrete ring beams and cavity construction A relatively small number of buildings having concrete ring beam construction (see section 3.3.4) were identified, and likewise few buildings having cavity type construction (see section 3.3.5) were identified (note that this latter comment is inconsistent with observations for URM buildings located outside the CBD but not reported herein, where a significant proportion of all buildings were identified to have cavity construction). Of the 370 buildings surveyed, in most cases it was not possible to identify whether cavity construction had been employed due to the extensive use of external render shielding identification of the brick bond pattern, but of the 134 buildings where a definitive assessment was possible it was established that 94 (70%) buildings were of solid wall construction and 40 (30%) buildings had cavity wall construction (see Table 4.3). Table 4.3 Prevalence of cavity wall construction in the Christchurch CBD Cavity construction
No. of buildings
% of buildings
Yes No Unknown
40 94 236
11% 25% 64%
% where wall type known 30% 70% -
Total
370
100%
100%
4.1.5 Construction material type 333 (90%) of the surveyed URM buildings were constructed using clay brick masonry as the principal construction material type, with the remaining 37 (10%) being constructed of either natural stone or a combination of clay brick and natural stone masonry. The distribution of the construction material of all surveyed buildings is shown in Table 4.4. Table 4.4 Construction material type Material type
Clay brick Stone Clay brick and stone Total
No. of buildings 333 13 24 370
% of buildings 90% 4% 6% 100%
38
ENG.UOA.0002.49
The Performance of Earthquake Strengthened URM Buildings in the Christchurch CBD in the 22 February 2011 Earthquake
4.1.6 Construction date The year of construction of each building was recorded where possible, and ranged from 1864 to 1930. This information was mostly available for buildings that are registered with the New Zealand Historic Places Trust (NZHPT) and/or on the Christchurch City Council (CCC) list of protected buildings, or cases where the construction year was displayed on the building. The year or decade of construction was recorded for 154 (42%) buildings. The distribution of construction date by decade is shown in Table 4.5, showing that for the data available the construction of URM buildings peaked in the Christchurch CBD during the first decade of the 20th century. The data in Table 4.5 are consistent with the documented early history of Christchurch as reported in section 1.2 of Report No. 1. Table 4.5 Construction date by decade Decade of construction
No. of buildings
% of total buildings
1860-1869 1870-1879 1880-1889 1890-1899 1900-1909 1910-1919 1920-1929 unknown
6 13 24 20 55 24 12 216
2% 4% 7% 5% 15% 6% 3% 58%
% of building for which date known 4% 8% 15% 13% 36% 16% 8% -
Total
370
100%
100%
4.1.7 Occupancy type As shown in Table 4.6 the most common occupancy type was commercial/offices, with 323 (87%) buildings being assigned this classification. This finding is consistent with the fact that the survey was confined to the CBD area, but is also likely to be true for the national URM building stock. Table 4.6 Occupancy type Occupancy type
Commercial/offices Dwelling Mixed Industrial School Religious Community Total
No. of buildings 323 4 13 11 2 8 9 370
% of buildings
87% 1% 4% 3% 1% 2% 2% 100%
39
ENG.UOA.0002.50
The Performance of Earthquake Strengthened URM Buildings in the Christchurch CBD in the 22 February 2011 Earthquake
4.2 Damage assessments In this section two methods for describing the extent of damage to the entire URM building population incorporated within the study are presented. Damage assessment statistics are presented for 368 buildings as damage data was not recorded for two URM buildings.
4.2.1 Placard data from level 1 inspections Available placard data specifically associated with the 22 February 2011 earthquake was obtained from Christchurch City Council, and was supplemented where appropriate by observed placards identified during surveying. Placard data was obtained for a total of 337 (91%) buildings, as shown in Table 4.7. In Figure 4.1(e) the distribution of building placard levels is plotted. The unknown category exists because there were some gaps in the data obtained from CCC. It is evident that the majority of URM buildings in the Christchurch CBD were given a red placard following the 22 February 2011 earthquake, which differs markedly from the placard distribution (for 595 URM buildings located both within and outside the CBD) for the 4 September 2010 earthquake as reported in Figure 3.5 of Report No. 1, where 47% were assigned Green, 32% were assigned Yellow and 21% were assigned Red. Table 4.7 URM building placard data for 22 February 2011 earthquake Level 1 Placard Green Yellow Red Unknown
No. of buildings 3 59 275 33
% of buildings 1% 16% 74% 9%
Total
370
100%
4.2.2 General damage classification scheme The overall damage to each surveyed building was visually assessed using two damage scales, as further detailed below. The ATC scale has previously been used widely for a variety of structural forms whereas the scale by Wailes and Horner has previously been used specifically for URM buildings. Reviews of various damage classification schemes relevant to this study have been published by EERI (2003b) and Spence (2010). Martel (1936) published details on a survey of 1,261 URM buildings following the 10 March 1933 Long Beach earthquake and more recently Rutherford & Chekene (1990) and Lizundia et al. (1993) have presented results of a survey of 2,007 unreinforced masonry buildings in San Francisco in the months after the 1989 Loma Prieta earthquake. For the recording of damage states following the 1989 Loma Prieta earthquake the ATC-13 (1985) and Wailes and Horner scales were adopted, and for consistency the same procedure was used in the current study. In order to expedite
40
ENG.UOA.0002.51
The Performance of Earthquake Strengthened URM Buildings in the Christchurch CBD in the 22 February 2011 Earthquake release of the current report no effort has yet been made to correlate the Christchurch damage data sets with other post-earthquake damage data sets previously collected elsewhere, but it is the intent that in time this exercise will be completed. Notably, one conclusion from prior studies was that the quality of recorded data was negatively influenced by the large number of people responsible for data collection whereas in the current study the same personnel were responsible for collecting the entire data set. 4.2.2.1 ATC 38/13 General Damage Classification Scheme The Applied Technology Council (ATC) has a general damage classification scheme6 as detailed in Table 4.8, based upon an assessment of the overall scale of damage (ATC, 1985). This scheme has been adopted because of the widespread usage of ATC protocols in post-earthquake building assessments. Table 4.8 ATC 38/13 general damage classification Classification None Insignificant Moderate Heavy Major Destroyed Total
Associated damage value 0% 1-10% 10-30% 30-60% 60-100% 100%
No. (%) of buildings 0 48 (13%) 101 (27%) 107 (29%) 84 (23%) 28 (8%) 368 (100%)
As can be seen in Table 4.8 and Figure 4.2(a), the ATC scale reported damage in excess of moderate for 219 (60%) of all surveyed buildings, and damage in excess of insignificant for 320 (87%) of all surveyed buildings. Insignificant 13%
Destroyed 8%
Major 23% Moderate 27% Heavy 29%
E 13%
A 12% B 24%
D 23%
C 28%
(a) ATC 38/13 Classification (b) Wailes and Horner Scale Figure 4.2 Damage level using two different classifications schemes
6
See http://www.atcouncil.org/pdfs/atc38assmtfrm.pdf
41
ENG.UOA.0002.52
The Performance of Earthquake Strengthened URM Buildings in the Christchurch CBD in the 22 February 2011 Earthquake 4.2.2.2 Wailes and Horner General Damage Classification Scheme As discussed earlier, the Wailes and Horner (1933) damage scale was specifically developed for the post-earthquake assessment of URM buildings, and is based upon descriptions of URM building damage instead of an overall assessment. Damage statistics as classified using this scale are reported in Table 4.9 and in Figure 4.2(b). It can be seen that 322 (88%) of all buildings were classified as having suffered significant structural damage (Level B, C, D or E) when using the Wailes and Horner damage scale. Table 4.9 Wailes and Horner damage scale Damage Level
Damage description
No. (% ) of buildings
A
Undamaged or Minor Cracking, No Significant Structural Damage, Minor Veneer Damage
46 (12%)
B
Parapet Failure or Separation of Veneer, Major Wall Cracking and Interior Damage
88 (24%)
C
Failure of Portion of Exterior Walls, Major Damage to less than 50% of walls
106 (28%)
D
Major Damage to more than 50% of walls
86 (23%)
E
Unrepairable Damage, Demolition Probably Appropriate
42 (13%)
Total
368 (100%)
4.2.2.3 Correlation between the two damage scales As noted above, it was determined that when using the ATC 38/13 damage classification there were 320 (87%) surveyed buildings that suffered damage in excess of insignificant, and when using the Wailes and Horner damage scale there were 322 (88%) surveyed buildings that suffered significant structural damage (Level B, C, D or E). Clearly this comparison indicates a high level of correlation between the two survey methods. This high correlation can be further identified by considering the two charts in Figure 4.2, where it can be seen that comparable numbers of buildings were assigned for each of the incremental damage levels within the two scales.
4.3 Comparing assessed damage level and building placard data A plot of overall building damage against available placard data (from level 1 inspections as reported in section 4.2.1) is shown in Figure 4.3. The prevalence of the red placard assignments to URM buildings having insignificant or moderate damage shows that assigned placard levels tended to be a conservative estimate of structural damage. Note that both the building damage assessments and the level 1 inspections for placards were primarily based on external inspections only.
42
ENG.UOA.0002.53
The Performance of Earthquake Strengthened URM Buildings in the Christchurch CBD in the 22 February 2011 Earthquake
Percentage of buildings
100% 80% 60% 40% 20% 0% Insignificant Moderate 10 Heavy 30 ‐ 1 ‐ 10% ‐ 30% 60%
Major 60 ‐ 100%
Destroyed 100%
Damage level red yellow green
Figure 4.3 Plot of damage levels vs. placard data (level 1)
4.4 Damage for different building forms The ATC 38/13 damage classification was used to investigate any possible relationship between the number of stories and the level of damage (see also Figure 4.1(a) for the distribution of storey heights for the entire URM building population). As shown in Figure 4.4, and specifically neglecting the case for 5 storey buildings due to this category representing only 1% of the building population, it was concluded that there was no distinct relationship between overall building height and the level of sustained building damage. Notably the same conclusion was reached following the 4 September 2010 Darfield earthquake (see Figure 3.5(c) of Report No. 1).
Percentage of buildings
100% 80% 60% 40% 20% 0% 1
2 destroyed
major
3 No. of stories heavy moderate
4
5
insignificant
Figure 4.4 ATC 38/13 damage classification for number of stories Next the level of damage was investigated by separating the damage data into standalone versus row buildings (see Figure 4.5(a)), where it was established that there was a
43
ENG.UOA.0002.54
The Performance of Earthquake Strengthened URM Buildings in the Christchurch CBD in the 22 February 2011 Earthquake
100%
100%
80%
80%
Percentage of buildings
Percentage of buildings
greater degree of damage to stand-alone buildings than to row buildings. Similarly, the performance of row buildings was considered based upon damage correlated to whether the building was located mid-row or end-of-row (see Figure 4.5(b)), where it was found that greater damage was sustained to end-of-row buildings. These findings are consistent with the generally held view that mid-row buildings are somewhat protected from damage by the end-of-row buildings (occasionally referred to as ‘bookend’ behaviour) and similarly that the practice of constructing multiple URM buildings connected together provides additional robustness when compared to the earthquake performance of stand-alone URM buildings.
60% 40% 20% 0%
60% 40% 20% 0%
stand alone destroyed heavy insignificant
row major moderate
(a) Damage levels for stand-alone vs. row buildings
middle destroyed heavy insignificant
end major moderate
(b) Damage levels for row buildings depending on position
Figure 4.5 ATC 38/13 damage classification for stand-alone and row buildings Finally, the two analyses discussed above were amalgamated to identify the associated damage levels for different building typologies (see Figure 4.6). Recalling that Typology A and C are 1 and 2 storey stand-alone buildings and that Typology B and D are 1 and 2 storey row buildings (see section 2.2 of Report No. 1 for a full description), the damage trends discussed above lead to the conclusion that Typology B and D buildings should exhibit less damage than for other typologies. This trend is shown in Figure 4.6.
44
ENG.UOA.0002.55
The Performance of Earthquake Strengthened URM Buildings in the Christchurch CBD in the 22 February 2011 Earthquake
Percentage of builsings
100% 80% 60% 40% 20% 0% A
B
C
D
E
F
other
Typology destroyed
major
heavy
moderate
insignificant
Figure 4.6 ATC 38/13 damage classification for building typology
4.5 Damage to individual building elevations The damage levels for individual building elevations using the ATC damage scale reported in section 4.2.2.1 are presented in Table 4.10. Also reproduced in the far right column of Table 4.10 are the damage statistics previously reported in Table 4.8 for entire buildings. Table 4.10 Damage levels for all elevations Elevation damage level None visible Insignificant
No. (%) of elevations 68 (7%) 127 (14%)
No. (%) of buildings 0 48 (13%)
Moderate
237 (26%)
101 (27%)
Heavy Extreme
204 (22%) 286 (31%)
107 (29%) 112 (31%)
Total
922 (100%)
368 (100%)
It is evident in Table 4.10 that there is a strong correlation between the percentages of damage recorded for each damage level when comparing the data for individual building elevations and overall building response, as would be expected. By careful scrutiny of the photographs of each building elevation it is expected that it will eventually be possible to report the distribution of different failure modes that led to the damage levels reported in Table 4.10, but this analysis has yet to be undertaken.
45
ENG.UOA.0002.56
The Performance of Earthquake Strengthened URM Buildings in the Christchurch CBD in the 22 February 2011 Earthquake
4.6 Damage to awnings Of the 370 URM buildings surveyed in the CBD only 173 (47%) buildings were identified as having awnings. Of these, 68 (39%) buildings had failed awnings due to falling debris from parapets and walls above.
4.7 Wall corner damage Of the 370 buildings surveyed in the CBD, 108 (29%) buildings were identified as having wall corner damage failure (see section 3.4.3 for description) and 262 (71%) were identified as having no wall corner damage.
4.8 Damage due to pounding Approximately 12% of URM buildings were identified as having some degree of damage due to pounding with neighbouring building(s). Comprehensive data on the location and extent of pounding damage in URM buildings was collected, but currently is not sufficiently collated for inclusion herein.
4.9 The performance of temporary securing and shoring Following the original 4 September 2010 Darfield earthquake a number of buildings had temporary shoring7 installed in preparation for or during repair works. Of the 370 buildings surveyed, 49 (13%) buildings had visible temporary shoring. Of these 49 shoring installations, 22 (45%) installations used steel braces, 25 (51%) installations used timber braces and 2 (4%) installations used other shoring methods. The performance of the shoring was assessed, and it was determined that installed shoring prevented collapse in 37 (75%) cases. In some cases, more substantial securing8 work was undertaken, mostly through the addition of adhesive anchors. However, securing work was only done in 56 (15%) cases. Therefore in total only 91 (25%) buildings had either visible shoring (49) and/or securing (56) work done on them following 4 September 2010.
7
The term ‘shoring’ refers to the addition of bracing members (usually braced to the ground or an adjacent building) to stabilise building elements from damage in subsequent aftershocks.
8 The term ‘securing’ is used here to refer to temporary securing measures such as the addition of anchors to connect wall elevations to roof and floor diaphragms for temporary securing, or the addition of steel straps to hold cracked building corners together.
46
ENG.UOA.0002.57
The Performance of Earthquake Strengthened URM Buildings in the Christchurch CBD in the 22 February 2011 Earthquake
4.10 Directionality effects A distinct correlation between building orientation and damage levels was observed, which is a characteristic referred to as ‘directionality’. This directionality information is still being processed and is not reported herein.
4.11 Building demolition data Figure 4.1(d) shows the state of buildings based upon demolition statistics published as at 4 October 2011. It is evident that over half (216, 58%) of the URM buildings included in the survey have already been demolished and that an additional 35 (10%) URM buildings are on the active demolition list (and may have already been demolished). 79 (21%) of the buildings appear to not be on the demolition list and are classified as ‘standing’, indicating that these building have currently been retained. See also section 4.11.1 for a critique on the condition of heritage listed buildings.
4.11.1 Condition of protected and heritage buildings Of the 370 surveyed URM buildings, 192 (52%) buildings were either heritage buildings registered with the New Zealand Historic Places Trust (NZHPT) and/or were recognised as a protected building by CCC (note that of the two buildings for which no damage data was acquired, one building was ‘Heritage and protected’, resulting in 191 data entries). The damage data reported in Table 4.8 was further analysed to identify the assessed level of damage for those buildings that were either heritage listed or were protected by CCC, compared with those buildings that had no special classification. As shown in Table 4.11 and Figure 4.7 there was little difference between the damage distributions for the two groups of buildings. Table 4.11 Damage classifications for heritage and non-heritage buildings Heritage & protected
Neither Heritage nor protected
No. of buildings
% of buildings
No. of buildings
% of buildings
insignificant moderate Heavy Major destroyed
23 50 61 45 12
12% 26% 32% 24% 6%
25 51 46 39 16
14% 29% 26% 22% 9%
Total
191
100%
177
100%
Damage level
47
ENG.UOA.0002.58
The Performance of Earthquake Strengthened URM Buildings in the Christchurch CBD in the 22 February 2011 Earthquake destroyed 6%
insignificant 12%
destroyed 9% insignificant 14%
major 24%
major 22% moderate 26%
moderate 29% heavy 26%
heavy 32%
(a) Heritage and protected buildings
(b) Neither heritage nor protected buildings
Figure 4.7 Damage classifications for heritage and non-heritage buildings Interestingly, Table 4.12 shows that 52 (27%) heritage and protected buildings remain standing whereas 28 (16%) of other buildings remain standing, and of the buildings that remain standing 52 (65% of 80) are heritage listed. Hence a higher proportion of heritage protected URM buildings have been retained, as would be expected both because these buildings are likely to have attracted a greater extent of earthquake strengthening, and because additional effort to avoid the demolition of heritage listed buildings would be expected. Table 4.12 Demolished and retained buildings Demolished (incl. scheduled) Standing Unknown
Heritage listed 128 (67% of 192) 52 (27% of 192) 12 (6% of 192)
Other 130 (73% of 178) 28 (16% of 178) 20 (11% of 178)
Total 258 (70%) 80 (22%) 32 (8%)
Total
192 (52% of 370)
178 (48%)
370 (100%)
48
ENG.UOA.0002.59
The Performance of Earthquake Strengthened URM Buildings in the Christchurch CBD in the 22 February 2011 Earthquake
Section 5: The Performance of Earthquake Strengthening Techniques
This section extends the information presented in Section 4, with details specifically provided regarding the performance in the 22 February 2011 Christchurch earthquake of various earthquake strengthening techniques installed within URM buildings located in the Christchurch CBD. The section begins with details regarding the distribution of earthquake strengthening improvements installed in heritage and protected URM buildings compared with their non-heritage equivalent, followed by the observed performance in the 22 February 2011 Christchurch earthquake of various earthquake strengthening techniques.
5.1 Earthquake strengthening of heritage buildings For the 370 buildings that were surveyed, an analysis was performed to identify the proportion of heritage and protected URM buildings that had received some form of earthquake strengthening, compared with the corresponding proportion for buildings that were not heritage protected. This information is reported in Table 5.1 and Figure 5.1, where it can be identified that the two classes of buildings had received comparable levels of earthquake strengthening. However, as might be expected, a greater proportion (67%) of heritage and protected buildings had received identifiable earthquake strengthening than for the non-heritage equivalent (58%), representing a comparative increase in the proportion of earthquake strengthening of 16% (67/58 = 1.155).
49
ENG.UOA.0002.60
The Performance of Earthquake Strengthened URM Buildings in the Christchurch CBD in the 22 February 2011 Earthquake Table 5.1 Distribution of earthquake strengthening for heritage and nonheritage URM buildings
Presence of earthquake strengthening
Neither Heritage nor protected buildings
Heritage & protected buildings
Combined dataset
No. of buildings
% of buildings
No. of buildings
% of buildings
No. of buildings
% of buildings
yes no unlikely unknown
129 17 30 15
67% 9% 16% 8%
102 14 27 34
58% 8% 15% 19%
231 31 57 49
63% 8% 15% 14%
Total
191
100%
177
100%
368
100%
unknown 8% unknown 19%
unlikely 16% no 9%
yes 67%
(a) Heritage and protected buildings
unlikely 15% no 8%
yes 58%
(b) Non-heritage buildings
Figure 5.1 Distribution of earthquake strengthening implementation
5.2 Number of earthquake strengthened URM buildings As outlined in section 3.11, the various forms of earthquake strengthening of URM buildings were categorised into three types, being parapet restraints (see section 3.11.1), Type A seismic retrofits (see 3.11.2), and Type B seismic retrofits (see section 3.11.3). The distribution of different Type A and Type B earthquake strengthening improvements is outlined in Table 5.2, with details of the earthquake performance of URM buildings having parapet restraints discussed in section 5.3.
50
ENG.UOA.0002.61
The Performance of Earthquake Strengthened URM Buildings in the Christchurch CBD in the 22 February 2011 Earthquake Table 5.2 Distribution of earthquake strengthening types Type of earthquake strengthening A&B
No. of buildings
% of buildings
82
22%
A
149
40%
none confirmed
139
38%
Total
370
100%
As can be seen in Table 5.2, 231 (62%) of all URM buildings in the Christchurch CBD had some form of earthquake strengthening installed at the time of the 22 February 2011 Christchurch earthquake (in addition to parapet restraints possibly being installed also), with 82 (22%) buildings identified as having one or more Type B earthquake strengthening methods installed. This data is shown graphically in Figure 5.2.
no unlikely 8% 15%
unknown 14%
yes 63%
(a) Proportion of earthquake strengthened buildings
none confirmed 37%
A&B 19%
A 41% B 3%
(b) Identified type earthquake strengthening
Figure 5.2 Distribution of installed earthquake strengthening types
5.3 Parapet restraints A total of 435 records of parapets were associated with the surveyed buildings, with some buildings having multiple parapets, such as those on street corners or for end-ofrow or stand-alone buildings. As shown in Table 5.3, of these 435 parapets only 149 (34%) parapets could be positively identified as having parapet restraints installed. Unfortunately, it was not possible to definitively identify a sufficient sample size of specific types of parapet restraint systems from building inspections.
51
ENG.UOA.0002.62
The Performance of Earthquake Strengthened URM Buildings in the Christchurch CBD in the 22 February 2011 Earthquake Table 5.3 Distribution of parapet restraints restrained unrestrained unknown
No. of cases 149 89 197
% of parapets 34% 21% 45%
Total
435
100%
As expected (see Table 5.4 and Figure 5.3), restrained parapets performed significantly better than parapets having no restraint, with 75 (84%) unrestrained parapets suffering full or partial collapse while only 65 (44%) restrained parapets suffered similar damage. Furthermore, 71 (48%) restrained parapets suffered no or moderate damage while only 12 (13%) unrestrained parapets achieved such good response, such that 86% (71/83) of those parapets that performed satisfactorily were restrained. Table 5.4 Damage sustained by restrained and unrestrained parapets Damage classification none moderate heavy partial collapse full collapse Total
none
Restrained Parapet 35 (23%) 36 (24%) 13 (9%) 29 (20%) 36 (24%) 149 (100%)
Unrestrained Parapet 5 (6%) 7 (8%) 2 (2%) 25 (28%) 50 (56%) 89 (100%)
Unrestrained parapets Restrained parapets
Damage level
moderate
heavy
partial collapse
full collapse 0%
10%
20% 30% 40% Percentage of Buildings
50%
60%
Figure 5.3 Performance of unrestrained and restrained parapets Overall it may be concluded that unrestrained parapets were twice as likely to collapse as were restrained parapets. It would seem that this is a disappointing finding as it would have been sensible to assume that the majority of restrained parapets would have
52
ENG.UOA.0002.63
The Performance of Earthquake Strengthened URM Buildings in the Christchurch CBD in the 22 February 2011 Earthquake performed satisfactorily. This finding suggests that further investigation is required to better understand why parapet restraints were not more uniformly successful in preventing damage.
5.4 Type A earthquake strengthening techniques As detailed in section 3.11.2, Type A retrofits include gable restraints, wall-to-diaphragm anchorage, and roof and floor diaphragm improvement. Earthquake performance details associated with this class of earthquake strengthening is reported below. As shown in Table 5.2 and also Table 5.5, 231 (62%) of all URM buildings in the Christchurch CBD had some form of Type A earthquake strengthening installed. Table 5.5 Distribution of buildings having Type A earthquake strengthening Type A retrofit installed
No of buildings
% of buildings
yes no unlikely unknown
231 26 57 56
62% 7% 15% 15%
Total
370
100%
The various forms of Type A earthquake strengthening that were installed are reported in Table 5.6, showing that the use of through ties was the most commonly encountered form of Type A earthquake strengthening. In addition, 52 URM buildings (14% of 370 total population) had diaphragm stiffening installed, with 18 buildings being identified as having both floors and roof diaphragm stiffening. Table 5.6 Forms of Type A earthquake securing Form of Type A retrofit
No of buildings
% of buildings
through ties adhesive anchors other original
162 39 2 6
70% 17% 1% 3%
unknown
22
10%
Total
231
100%
Of the 231 buildings where a Type A retrofit was implemented, 162 (70%) of these retrofits used ‘through tie’ anchors. However, as ‘through ties’ are the most easily identified Type A earthquake strengthening method, this would have influenced the number of identified installations. The next most common form of Type A earthquake strengthening was adhesive anchors, with 39 (17%) buildings identified as using this type of securing. Only 6 (3%) buildings were identified as exclusively having original
53
ENG.UOA.0002.64
The Performance of Earthquake Strengthened URM Buildings in the Christchurch CBD in the 22 February 2011 Earthquake wall-diaphragm connections (which technically is not part of earthquake strengthening improvement). This low percentage of observed cases of original earthquake resistant construction is likely to be due to both the difficultly of identifying this connection form and the rarity of its occurrence. Further details of the performance of Type A earthquake strengthening techniques are reported below.
5.4.1 Gable end wall restraints A total of 185 wall elevations having gables were identified in the survey. Table 5.7 shows the distribution of gable restraints for these gable ended walls, indicating that 129 (70%) gable end walls had gable restraints installed. Table 5.7 Prevalence of restraints for gable end walls Type of restraint
Number (%)
no restraint present gable restraints identified unknown
25 (14%) 129 (70%) 31 (17%)
Total
185 (100%)
Table 5.8 shows the distribution of the type of restraints used to secure the gable elevation from out-of-plane collapse, with 108 (84%) of the identified gable restraints being ‘through ties’ (see section 3.11.2.1). It should be noted that ‘through ties’ are more readily identifiable than many other restraint types, especially adhesive anchors, and so the reported distribution is likely to under-count securing types such as adhesive anchor systems that are less readily identified. Table 5.8 Identified types of gable restraints
original through ties adhesive anchors through ties + concrete beam other
% of gables (out of 129 gables) 14 (10%) 108 (84%) 5 (4%) 1 (1%) 1 (1%)
Total
129 (100%)
Restraint types
As can be seen in Figure 5.4, restrained gables performed better than for situations where no gable restraint was identified. However, 74 (57%) restrained gables suffered partial or full collapse.
54
ENG.UOA.0002.65
The Performance of Earthquake Strengthened URM Buildings in the Christchurch CBD in the 22 February 2011 Earthquake heavy 8%
partial collapse 28%
none 4%
full collapse 25%
full collapse 60%
partial collapse 33%
none 30%
minor 1% heavy 1%
moderate 10%
(a) Damage levels to unrestrained (b) Damage levels to restrained gables, all gables, all elevations elevations Figure 5.4 Gable damage levels As discussed above, Table 5.8 shows that there were 108 gable elevations where ‘through ties’ were used to provide restraint. This data population allowed the specific performance of through ties to be further analysed, as shown in Table 5.9 and Figure 5.5. From this analysis it may be determined that this securing technique resulted in mixed success, with 58 (54%) gable elevations suffering in excess of moderate damage. Further correlation between damage levels and the spacing of through tie anchors would assist in determining future recommendations for earthquake strengthening procedures, but is beyond the scope of the study reported here. Nevertheless, the finding that approximately half of all restrained gables sustained either heavy damage or collapse suggests that further investigation of appropriate procedures for the earthquake protection of unreinforced masonry gable end walls is merited. Table 5.9 Damage levels for gables restrained using through ties Damage level for gables restrained with through ties
No. of buildings
% of buildings
none minor moderate heavy partial collapse full collapse Total
39 0 11 2 36 20 108
36% 0% 10% 2% 33% 19% 100%
55
ENG.UOA.0002.66
The Performance of Earthquake Strengthened URM Buildings in the Christchurch CBD in the 22 February 2011 Earthquake
full collapse 19%
none 36%
partial collapse 33%
minor 0% moderate heavy 10% 2%
Figure 5.5 Damage distribution for gables restrained using through ties
5.4.2 Roof diaphragm improvement Roof diaphragm improvement was identified in 37 (17%) URM buildings where Type A earthquake strengthening was implemented (see Table 5.10). The most common roof diaphragm improvement type was steel bracing (19 cases), followed by steel brace frames (12 cases) and plywood overlay (6 cases). However, for 162 (70%) earthquake strengthened buildings it was not possible to confirm whether roof diaphragm improvements were implemented. Table 5.10 Distribution of roof diaphragm improvements Roof diaphragm stiffening plywood overlay steel bracing steel brace frame other none unknown Total
No. of buildings
% of buildings
6
3%
19
8%
12
5%
1 31 162
0% 13% 70%
231
100%
5.4.3 Floor diaphragm improvement Floor diaphragm improvement was confirmed in only 32 (14%) buildings where Type A earthquake strengthening was implemented, and was not able to be confirmed in 187 (81%) URM buildings (see Table 5.11). For those buildings where floor diaphragm improvement had been implemented, plywood overlay was the most common stiffening type, with 20 (9%) cases identified. Four (2%) cases each of steel bracing, steel brace frames and the addition of concrete were also identified. Of the four concrete floor
56
ENG.UOA.0002.67
The Performance of Earthquake Strengthened URM Buildings in the Christchurch CBD in the 22 February 2011 Earthquake improvements identified, three were in-situ concrete floors over the full floor area to replace the original timber floor diaphragm and one floor was a concrete overlay above the original timber floor, with supplementary steel beams added to support the added weight of the concrete overlay. Table 5.11 Distribution of floor diaphragm improvements Floor diaphragm stiffening
No. of buildings
% of buildings
20
9%
4
2%
plywood overlay steel bracing steel brace frame concrete none unknown
4
2%
4 12 187
2% 5% 80%
Total
231
100%
5.5 Type B earthquake strengthening techniques As shown in Table 5.2 and Table 5.12, 82 (22%) URM buildings in the Christchurch CBD had various Type B earthquake strengthening techniques installed. Table 5.12 Distribution of buildings having Type B earthquake strengthening Type B retrofit installed
No of buildings
% of buildings
yes no unlikely unknown
82 63 120 105
22% 17% 32% 28%
Total
370
100%
Within these 82 URM building having Type B earthquake strengthening, there were some cases where multiple Type B strengthening techniques were used, such that overall a total of 109 Type B installations were surveyed, as reported in Table 5.13. The most common Type B earthquake strengthening technique surveyed was the addition of steel moment frames, followed closely by concrete moment frames (see Table 5.13).
57
ENG.UOA.0002.68
The Performance of Earthquake Strengthened URM Buildings in the Christchurch CBD in the 22 February 2011 Earthquake Table 5.13 Distribution of Type B strengthening techniques encountered Strengthening technique steel moment frames steel brace frames strong-backs - internal strong-backs - external concrete moment frames addition of cross walls shotcrete FRP post tensioning other
No. of buildings 24 14 14 4 22 13 10 1 2 5
% of buildings 22% 13% 13% 4% 20% 11% 9% 1% 2% 5%
Total
109
100%
The overall building damage levels for 97 (89%) of the 109 identified cases of Type B earthquake strengthening were considered, with the damage distribution shown in Table 5.14 and Figure 5.6. The Type B strengthening methods of Fibre Reinforced Polymer (FRP), post-tensioning, and external strong-backs were not included in Table 5.14 as the number of surveyed cases of implementation was small. Note that buildings having more than one form of Type B seismic strengthening (eg. steel moment frames and internal strong backs) are represented twice in Table 5.14 and Figure 5.6 such that the 97 entries do not represent 97 different buildings. Table 5.14 Damage level for various Type B earthquake strengthening techniques Method of Type B strengthening Shotcrete
Strong backs Internal Steel moment frames Addition of cross walls Concrete moment frames Steel brace frames Total
Destroyed
Major
Heavy
Moderate
Insignif.
Total
0 (0%)
0 (0%)
0 (0%)
5 (50%)
5 (50%)
10 (100%)
0 (0%)
2 (14%)
1 (7%)
8 (57%)
3 (22%)
14 (100%)
0 (0%)
1 (4%)
7 (29%)
13 (54%)
3 (13%)
24 (100%)
0 (0%)
0 (0%)
5 (38%)
3 (24%)
5 (38%)
13 (100%)
1 (5%)
3 (14%)
6 (27%)
7 (32%)
5 (23%)
22 (100%)
0 (0%)
3 (21%)
4 (29%)
5 (36%)
2 (14%)
14 (100%)
1 (1% of 97)
9
(9% of 97)
23
(24% of 97)
41
(42% of 97)
23
(24% of 97)
97
(100% of 97)
58
ENG.UOA.0002.69
The Performance of Earthquake Strengthened URM Buildings in the Christchurch CBD in the 22 February 2011 Earthquake
Percentage of buildings
100% 80% 60% 40% 20% 0% Shotcrete
Strong backs ‐ Internal
Steel moment Addition of cross Concrete frames walls moment frames
Steel brace frames
Seismic strengtheing techniques insignificant
moderate
heavy
major
destroyed
Figure 5.6 Building damage distribution for various Type B earthquake strengthening techniques As might be expected, the data presented in Table 5.14 and Figure 5.6 shows that the two Type B earthquake strengthening methods that resulted in the least damage were shotcrete and the addition of cross walls. The two methods are somewhat analogous as the former involves the application of new reinforced concrete walls adhered to the exterior of existing URM walls and the latter involves the installation of new walls. The data also shows that the damage statistics for buildings having internal strong backs, steel moment frames and concrete moment frames was comparable.
5.6 Comparison between earthquake strengthening schemes and overall building damage In this section the building damage data for 368 URM buildings in the Christchurch CBD is correlated against earthquake strengthening schemes, recalling that building damage information was not available for two URM buildings. As shown in Table 5.15, URM buildings having no earthquake strengthening suffered greater damage than those buildings that had received some form of earthquake strengthening. Of the 31 URM building confirmed to have no earthquake strengthening, 30 (97%) suffered heavy, major or severe damage (see Table 5.15 and Figure 5.7). Similarly, of the 149 buildings that had a Type A earthquake strengthening scheme installed, 104 (70%) suffered heavy, major, or severe damage whereas for combined Type A&B strengthening only 29 (35%) buildings suffered this level of damage.
59
ENG.UOA.0002.70
The Performance of Earthquake Strengthened URM Buildings in the Christchurch CBD in the 22 February 2011 Earthquake Table 5.15 Damage level for different types of earthquake strengthening Damage level Insignificant Moderate Heavy Major Destroyed Heavy, Major and Destroyed combined
Seismic strengthening type Type A Type A&B 10 7% 19 23% 35 23% 34 41% 48 32% 20 24% 42 28% 8 10% 14 9% 1 1%
No retrofit 0 0% 1 3% 16 52% 9 29% 5 16% 30 of 31
97%
104 of 149
70%
29 of 82
35%
Unknown 19 18% 31 29% 23 22% 25 24% 8 8% 56 of 106
53%
From this data it is clear that Type B earthquake strengthening was more successful at minimising building damage than were Type A earthquake strengthening improvements. This observation is to be expected, recognising that the aim of Type B earthquake strengthening improvements is to increase the global earthquake capacity of the building, and consequently reduce the expected overall building damage level.
Percentage of buildings
60%
40%
20%
0% insignificant
moderate
heavy
major
destroyed
Damage level Types A&B
Type A only
No Retrofit
Figure 5.7 Plot of damage level against seismic strengthening types
60
ENG.UOA.0002.71
The Performance of Earthquake Strengthened URM Buildings in the Christchurch CBD in the 22 February 2011 Earthquake
Section 6: Influence of earthquake strengthening level on observed damage and assessed hazard
In this section the data from Section 4 and Section 5 are extended to investigate the relative performance of URM buildings in the Christchurch CBD that had received various levels of earthquake strengthening. The %NBS parameter is used throughout to describe the level of earthquake strengthening, with all calculations performed using a zone factor for Christchurch of Z = 0.22, which was the zone factor in place at the time of the 22 February 2011 earthquake. The section concludes with an analysis of the hazard to building occupants and to passers-by due to the observed extent of building damage.
6.1 Comparison of %NBS and assessed damage level Earthquake strengthening levels in terms of %NBS were identified for 94 (26% of the 368 total) URM buildings, either by consulting CCC records, by personal communication with building owners, engineers and heritage personnel, or in cases where sufficient details about the building were known was based upon estimation. The distribution of %NBS data is reproduced in Table 6.1 where it is shown that 61 (65% of 94) URM buildings had been earthquake strengthened to at least 67%NBS and a further 18 (19%) URM buildings had been earthquake strengthened to at least 34%NBS. 15 (16%) buildings had been strengthened to less than 33%NBS, and 31 (8% of the 368 total) URM buildings were positively confirmed to have received no earthquake strengthening. Further investigation will facilitate the identification of whether the remaining 243 (=368-94-31) URM buildings in the Christchurch CBD for which damage data is
61
ENG.UOA.0002.72
The Performance of Earthquake Strengthened URM Buildings in the Christchurch CBD in the 22 February 2011 Earthquake available had received any form of earthquake strengthening. However, this expanded investigation was not undertaken in order to expedite the release of this report.
Table 6.1 Distribution of %NBS classifications for 94 earthquake strengthened URM buildings NBS Retrofit level %NBS < 33 33 ≤ %NBS < 67 67 ≤ %NBS < 100 %NBS ≥ 100
No. of buildings 15 18 50 11
% of buildings 16% 19% 53% 12%
Total
94
100%
The performance of these 94 earthquake strengthened buildings and 31 unstrengthened buildings was analysed by determining the damage distribution for each category of %NBS as shown in Table 6.2 and Figure 6.1. Table 6.2 Damage levels for different %NBS categories %NBS ≥ 100 Insignificant 1 - 10% Moderate 10 - 30% Heavy 30 - 60% Major 60 - 100% Destroyed 100%
67 ≤ %NBS < 100
33 ≤ %NBS < 67
%NBS < 33
No retrofit
8
73%
10
20%
1
6%
1
7%
0
0%
3
27%
28
56%
4
22%
5
33%
1
3%
0
0%
10
20%
9
50%
5
33%
16
52%
0
0%
2
4%
4
22%
1
7%
9
29%
0
0%
0
0%
0
0%
3
20%
5
16%
Combined Heavy, Major and Destroyed
0 of 11
0%
12 of 50
24%
13 of 18
72%
9 of 15
60%
30 of 31
97%
Total
11
50
18
15
31
62
ENG.UOA.0002.73
The Performance of Earthquake Strengthened URM Buildings in the Christchurch CBD in the 22 February 2011 Earthquake
Percentage of buildings
80%
60%
40% 20% No retrofit All %NBS < 33 33 ≤ %NBS < 67
0%
67 ≤ %NBS < 100 %NBS ≥ 100
Damage level
%NBS ≥ 100
67 ≤ %NBS