Cambridge Journal of Regions, Economy and Society 2011, 4, 3–11 doi:10.1093/cjres/rsr001
The Persistence of Inequality?
Philip Arestisa,b, Ron Martinc and Peter Tylera a
Introduction There is powerful evidence that substantial income, poverty and welfare inequalities exist between and within countries across the globe (see, for example, Dollar, 2007; Milanovic, 2006; Held and Kaya, 2007; World Bank, 2007). What is perhaps less clear, and is certainly debated, is whether these disparities have been narrowing or increasing over the past 50 years or so: compare, for example, Sala-i-Martin (2002) and Dollar (2007) with Wade (2007) and Milanovic (2007). One source of contention derives from the concept or measure of inequality that is used. Milanovic (2007a, 2007b) has shown how three different measures yield different pictures of global inequality trends. An unweighted inequality measure of the differences between countries’ mean incomes, as proxied by gross domestic product (GDP) per capita, shows that international inequality was generally on the rise during the 1950–2000 period, with a marked upward trend from the late1970s onwards. On the other hand, a populationweighted measure suggests that international inequality has decreased, particularly since the late1970s, mainly due to the growth of China and India. But yet further, a measure of income inequality between the individuals of the world, both inter-country and intra-country differences, does not chart any
clear pattern: whilst inter-country inequalities may have declined, intra-nation inequalities appear to have increased almost everywhere. The precise trends in income, wages and welfare inequalities would thus appear to be complex and open to dispute. But what does seem indisputable is that while a few poor countries are catching up with the rich world, the differences between the richest and poorest individuals around the world are very large and likely growing (Milanovic, 2007b). A second source of disagreement centres on the role played by globalization in shaping global income inequalities and their trends over time. On the one side are those who have argued that by facilitating economic integration and trade, the acceleration of globalization since the late-1970s has led to significant improvements in the development and growth prospects of the poorer countries of the world and has helped thereby to raise the incomes of the populations of those countries (Dollar, 2007). Others, however, are less convinced, and instead believe that greater trade, migration, and capital flows have had little or no discernible affect on the catch up of poorer countries (for example, Kapstein, 1999; Thompson, 2007), and that the rise from the late-1970s onwards of neoliberal policies that have promoted and supported globalization
Ó The Author 2011. Published by Oxford University Press on behalf of the Cambridge Political Economy Society. All rights reserved. For permissions, please email:
[email protected]
Downloaded from http://cjres.oxfordjournals.org/ at Marshall Library on January 4, 2012
Department of Land Economy, University of Cambridge, 19 Silver Street, Cambridge, CB3 9EP, UK,
[email protected],
[email protected] b Department of Applied Economics V, Faculty of Economics and Business, University of the Basque Country, Avenida Lehendakari Agirre, 83, 48015 Bilbao, Spain c Department of Geography, University of Cambridge, Downing Place, Cambridge CB2 3EN, UK,
[email protected]
Arestis, Martin and Tyler
The extent of global inequality The World Bank database provides one of the most comprehensive sources of data and it is helpful to use the Word Bank broad country groupings to provide an overview of the current extent of global income inequality and how it has been changing through time. We use GDP per capita (constant 2000 US$) as our measure of inequality. Table 1 indicates the
4
geographical variation by World Bank country groupings for all income levels with the addition of North America and shows how this compares with the distribution of world population as at 1971 and 2009. Table 1 illustrates both the bad and good news in the quest to tackle world income inequality over the last 40 years. The four country groups with the lowest GDP per capita relative to the world average in 1971 were East Asia and the Pacific, the Middle East and North Africa, South Asia and Sub-Saharan Africa. In Table 1. Population and GDP per capita for 1971 and 2009 by country groups (all income levels, constant 2000 US$). Population % of GDP % of World (M) World per GDP per population capita capita 1971 East Asia & Pacific Europe and Central Asia Latin America and Caribbean Middle East and North Africa North America South Asia Sub-Saharan Africa World 2009 East Asia and Pacific Europe and Central Asia Latin America and Caribbean Middle East and North Africa North America South Asia Sub-Saharan Africa World
1324
35.2
1853 54.8
745
19.8
6405 189.5
292
7.7
2842 84.1
142
3.8
1756 51.9
229 731 301
6.1 19.4 8.0
18125 536.1 221 6.5 559 16.5
3766
100.0
3381 100.0
2183
32.2
4948 84.7
888
13.1
12372 211.8
579
8.5
4780 81.8
377
5.6
3481 59.6
341 1568 840
5.0 23.1 12.4
35843 613.6 706 12.1 618 10.6
6775
100.0
5842 100.0
Note: The definitions used for country groups can be accessed from the World Bank Website at the following link http:// data.worldbank.org/topic/poverty by selecting the ‘Databank’ and looking up the aggregate classifications. Source: The World Bank Databank and authors’ calculations.
Downloaded from http://cjres.oxfordjournals.org/ at Marshall Library on January 4, 2012
have in fact made conditions worse for large sections of the populations of many developing and underdeveloped countries (Galbraith, 2007; Stiglitz, 2002). Some would go further and attribute the increase in inequality within some of the advanced, developed nations—such as the USA and UK—to those very same policies. Together, the existence of immense income inequalities across the globe, and the debate over whether globalization has or has not contributed to these disparities, are arguably two of the most pressing issues of our times. In one sense, the issues are nothing new: throughout its history, capitalism has generated social and spatial disparities (Harvey, 2006). The task is to elucidate the complexities of global income inequalities—both within and between nations—and to illuminate the processes at work in producing and reproducing those inequalities. Only then can persuasive and effective policies to achieve a more equitable distribution of income across the globe be designed and implemented. This special issue is intended as a contribution to this endeavour. The papers that follow focus on different interpretations of the main determinants of inequality including theoretical, institutional, historical and spatial interpretations, as well as the effect of different policy interventions. The impact of the current crisis on inequality is another important element of this special issue, covering both interregional and spatial inequalities. The next section briefly reviews what has been happening to inequality both between and within countries in the world. The final section discusses how the articles help to increase our understanding of the causes of the changes observed and the scope for positive intervention.
The Persistence of inequality?
The contribution of world economic growth Table 2 shows the annual growth in GDP per capita for specific time periods by the country groups (for all income levels). In the immediate post oil crisis period of 1973–1983, world GDP per capita grew at just below 1% per capita per annum. However, the countries in the Sub-Saharan Africa group experienced a decline of 0.3% per annum. In contrast, growth in GDP per capita in the East Asia and Pacific group and the South Asia group was an impressive 2.5 and 2.2%, respectively. Growth was also quite rapid in the Middle East and North Africa group at 2.0% per annum. The growth of world GDP per capita improved over the period 1983–2001, growing at twice that achieved in the 1970s. However, GDP per capita in Sub-Saharan Africa continued to decline over this period. A world apart was the performance of the South Asia group, at 4.2% per annum closely followed by 3.4% in the East Asia and Pacific group. The growth performance of the Middle East and North Africa group was quite slow at 0.6% per
Table 2. Annual GDP per capita growth rates for specific time periods by country groups (all income levels, constant 2000 US$). Country groups East Asia and Pacific Europe and Central Asia Latin America and Caribbean Middle East and North Africa North America South Asia Sub-Saharan Africa World
1973–1983 1983–2001 2001–2007 2.5 1.4 1.0
3.4 2.3 1.0
4.0 2.4 3.0
2.0
0.6
3.3
1.3 2.2 0.3 0.9
2.8 4.2 0.3 1.8
1.7 6.9 3.0 2.3
Note: The definitions used for country groups can be accessed from the World Bank website at the following link http:// data.worldbank.org/topic/poverty by selecting the ‘Databank’ and looking up the aggregate classifications. Source: The World Bank Databank and authors’ calculations.
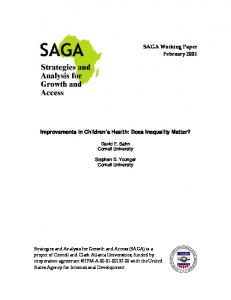
annum and the Latin America and Caribbean group also underperformed compared to the average world growth rate. The European and Central Asian group did relatively well at 2.3%. From 2001 to 2009, the average annual growth rate of world GDP per capita improved still further to 2.3% per annum. Over this period, there was at last evidence that the relative position of the SubSaharan Africa group had begun to improve, an average annual growth rate of 3.0%, reversing the very poor experience of the previous 30 years. The growth of GDP per capita in the South Asia and East Asia and Pacific groups was particularly impressive, at 6.9 and 4.0% per annum, respectively, and there was also relative improvement in the Middle East and North Asia and Latin and Caribbean groups. Figure 1 shows the cumulative annual change in GDP per capita (in constant US$ 2000) in each of the country groups after subtracting the world cumulative annual change in GDP per capita. The chart enables more insight into what has happened to the growth of GDP per income in each group through time relative to the world position. The cumulative relative deterioration in average incomes (per capita GDP) the Sub-Saharan Africa group before 2001 is particularly striking. Although there has since been a slight improvement in this area’s relative growth trend, the scale of the growth 5
Downloaded from http://cjres.oxfordjournals.org/ at Marshall Library on January 4, 2012
1971, the East Asia and Pacific group had just over a third of the world population and a GDP per capita that was just over half of world average. By 2009, this group had been able to increase its GDP per capita to nearly 85% of the average world per capita GDP. The Middle East and North Africa group had nearly 4% of world population in 1971 and a GDP per capita that was just over half the world average. An increase in population to nearly 6% of the world total by 2009 was accompanied by a relative increase in average GDP per capita to around 60% of the world average. In a similar vein, the South Asian group with nearly 20% of the world population in 1971 and 23% in 2009 managed to increase its relative GDP per capita from 6.5 to 12.1%. Again an improvement, albeit to what is still a very low level. The bad news relates to the Sub-Saharan Africa Group. Whilst this groups share of world population rose from 8% in 1971 to nearly 12% in 2009, its average GDP per capita relative to the world average actually declined over the period.
Arestis, Martin and Tyler
60 40 20 0 -20 -40
2009
2007
2005
2003
2001
1999
1997
1995
1993
1991
1989
1987
1985
1983
1981
1979
1977
1975
1973
1971
-60
East Asia & Pacific
Europe & Central Asia
Latin America & Caribbean
Middle East & North Africa
North America
South Asia
Sub-Saharan Africa
Figure 1. Cumulative growth in GDP per capita in major country groups relative to world average. Source: The World Bank Databank and authors’ calculations.
gap to be made up is clearly very large indeed. It has been a completely different story for the countries in the East Asian and Pacific group that have experienced a growth in GDP per capita that has been above the world average for virtually the whole period. The same relative improvement in the South Asian group is also apparent, but from around the early-1980s. The relative performance of the Middle East and North-Africa group was best in the early-1970s, reflecting the impact of the rising real price of oil. It then fell back until the late1980s. The Latin America and Caribbean group have tended to cycle around the world average growth throughout the period. The European and Central Asian group and North America have performed somewhat better than the world average growth virtually throughout the whole period. In summary, over the last 40 years, there has been significant and sustained improvement in the position of the East Asian, Pacific and South Asian country groupings. The Middle Eastern and Africa and Europe and Central Asian groups have also improved relatively, albeit at a somewhat slower rate. The position has been more mixed for the Latin America and Caribbean group, but the picture remains dire for the Sub-Saharan Africa group. The breadth and depth of 6
inequality, and the persistence of extremely low incomes in Sub-Saharan Africa, remains a source of great concern. However, if substantial and sustained inequalities remain between countries around the world, it is also the case that there are substantial disparities in income within countries and that these disparities have also had a tendency to persist. Table 3 presents evidence on the proportion of total national income going to the top and bottom 10% of the population in a number of selected countries. Assembling data on intranational income inequalities that can be regarded as consistent both across countries and through time is very difficult. In order to compile the evidence presented in Table 3, it has been necessary to take data for each country at different points in time. The data are for the all country population where this has proved possible. In some cases, it has been necessary to average the data from different sources. The countries in Table 3 have been chosen to represent those that have been growing rapidly in recent years and are significant emerging markets. For comparison, prominent established developed market economies are included. The evidence presented in Table 3 shows that there are very large
Downloaded from http://cjres.oxfordjournals.org/ at Marshall Library on January 4, 2012
Cumulative Differential Growth (Percent)
80
The Persistence of inequality? Table 3. Share of total income going to the top and bottom 10% of the population (%). Country
1960
1980
1.1*
1.0a,**
1.8d
2.5e,**
1.8i 1.4
2.6a 2.9a,***
1.9 3.0 4.0 1.5q,***
2.4 4.1 2.0r
48.8*
45.7a.**
36.5d
32.8e,**
26.9i 30.4
24.2a 23.6a,***
28.5 27.2o 21.3 26.6q,***
29.8 20.7 24.7r
1990
0.8* 4.1c,** 1.9g 2.9j 2.5l,*** 3.2m 2.9j,*** 4.8p,* 2.9 1.8j,*** 47.9*
33.7g 23.4j 24.9l,*** 23.8m 24.1j,*** 21.7p,* 26.0 26.4j,***
2000
0.8b,* 1.2*** 3.2f,**** 1.8b,**** 2.7 4.0 3.5 2.3*** 2.9 1.8 48.5b,* 33.5*** 28.9f,**** 33.1b,**** 24.8 22.0 22.5 25.6*** 26.4 29.5
Latest available
1.0 3.3 3.6 1.6 2.7 4.0 2.9 2.3 4.8 2.8 1.8
(2005)* (2002)**** (2004)**** (2004) (2000) (2001) (2004) (2002) (1993)* (2002) (2000)
45.0 (2005)* 23.8 (2002) **** 31.1 (2004) **** 34.9 (2004) 24.8 (2000) 22.0 (2001) 23.8 (2004) 26.5 (2002) 21.7 (1993)* 27.7 (2002) 29.5 (2000)
Note: Disposable income is used throughout except *Income (label given where income concept not available), **Gross income, ***Disposable monetary income, ****Consumption ; Taxable income. Full definitions can be accessed from: http://62.237.131.23/ wiid/WIID2c.pdf. The superscript alphabets ‘a–r’ indicate the following years, respectively, a1981, b2001, c1988, d1968, e1975, f1999, g 1995, h1961, i1971, j1991, k1962, l1989, m1992, n1959, o1969, p1993, q1972, r1979. Source: UNI-WIDER—World Income Inequality Database.
income inequalities within all the countries examined and although problems with the data make it difficult to be precise, these disparities have not been decreasing in any obvious systematic way. In some cases, there is even evidence that the disparities have worsened, particularly in more recent years. Thus, in 1960, the population classified as in the lowest income decile received between 0.5 and 2.4% of the total national income. In the early 2000s, the averages ranged from 0.8 to 4%. That so little progress has been made in increasing this share even in the most developed countries is alarming. Table 3 also shows the share of total country income that has gone to the top 10% in each country. In general, the share of the top 10% tends to be higher in the rapidly developing countries than in the advanced economies, although
among the latter, in the UK and the USA, the share taken by the top 10% has risen over the past two decades, reflecting the trend towards growing income inequalities in these countries.
Understanding the causes of spatial inequality In this issue, Galbraith (2011) begins by describing the evolution of inequality in the world economy since 1963 and describes the relationship between inequality, development, political regimes and the functional distribution of income. The paper then provides a summary of comparative evidence on the evolution of economic inequality in the world. The results are broadly consistent with the proposition that it is important to account both for the 7
Downloaded from http://cjres.oxfordjournals.org/ at Marshall Library on January 4, 2012
Poorest 10% of population Brazil 1.4* Russia India 1.1* China Canada*** 2.4h France 0.5k,; Germany Italy Japan 2.4n,** UK 2.3* USA Richest 10% of population Brazil 48.3* Russia India 36.7* China Canada 23.4h France 36.8k,; Germany Italy Japan 27.0n,** UK 25.8* USA
1970
Arestis, Martin and Tyler
8
wages’ are a significant cause of these different performances. Fair wages through the workers channel, the employers’ channels and their feedback effects help to explain why since 1960s India performed poorly compared to China on all components of the health index and the education index. Fair wages also help to explain why in 2008 China recorded more than double per capita GDP than India. Angeriz et al. (2011) argue that the doubts raised about the benefits to an economy with high rates of GDP growth without at the same time accounting for distributional effects should taken seriously on board. In this paper, an alternative is proposed, which is sensitive to income distribution. Figures for GDP are modified through the use of a subjective inequality aversion parameter. A measure of equivalent income is obtained from the published data on per capita GDP and its quintile distribution. The parameter is chosen high enough for the equivalent income to be especially sensitive to distribution towards or away from the poorest quintile. This measure allows one to combine growth rates and inequality of income and thus to comment on the success of the twin objectives of growth and income distribution using one single measure. Examining recent data on Latin America, we notice that some of the countries reduced inequality, if only marginally, but the general picture was at the time not encouraging. In some countries, inequality even worsened as austerity measures, following fiscal and monetary crises that appear to be endemic in the region, have been introduced. These trends are captured in our equivalent income measure of economic well-being. This approach allows for the combination of both growth and distribution in ranking the success of some Latin American countries in the attempt to raise the living standard of the population. In their contribution, D’Angelo and Lilla (2011) analyze the relation between income inequality and social networking formation in fourteen European countries during the period 1994–2001, employing data from the ECHP survey. This allows them to construct directly their inequality indexes and their decomposition. They then test the networkinequality nexus, and they also construct inequality
Downloaded from http://cjres.oxfordjournals.org/ at Marshall Library on January 4, 2012
great complexity of economic relationships in the modern world, and the increasing prominence of regional and global factors, and particularly the critical role of relative price changes in the global economy. Broadly, the evidence supports the proposition that economic inequality is primarily a matter of intersectoral differentials, influenced in the long run by structural change and in the short run by changing intersectoral terms of trade. The movement of inequality over the period of investigation exhibits a strong common pattern across countries, suggesting that changes in the between sector terms of trade and world interest rates exerted a powerful influence. This suggests that governance of world financial and commodity markets—at the national, regional and global levels—and the conduct of global monetary and financial policy are critical, and perhaps under-acknowledged, issues in the struggle to control inequality—and to build a fair, tolerable and sustainable world. This contribution also finds that political regimes matter: egalitarian regime type exhibits lower measures of inequality, after controlling for economic variables, region and changes over time. Charles et al. (2011) examine the role of human capital in explaining the high growth rates and declining inequalities experienced by highperforming Asian economies (HPAEs) between middle-1960s and middle-1990s in comparison to the poor performance of India during the same period. It is suggested that the HPAEs have been unusually successful compared to large parts of Asia (including India), Africa and Latin America at matching high growth rates with significantly declining income inequalities. A Human Capital Index (HCI) is built. HCI is made of three components measuring the health achievement, the education achievement and per capita GDP of a country. Despite data limitations, the main outcome of the HCI analysis is unambiguous: between middle-1960s and middle-1990s, India lagged behind HPAEs on human capital development. In the case of India and China although they started from a similar position in the 1960s, they grew apart in terms of human capital and economic performances in the following decades. It is suggested that ’fair
The Persistence of inequality? pattern observed is a logical outcome of the strategies embedded in World Bank policies; these policies need to change if we are to counter the persistence of inequality and poverty on the continent. The paper outlines an alternative approach aimed at increasing rural incomes to reduce poverty and inequality. Significant improvement of income distribution and poverty reduction in Africa is contingent on a rethinking of the strategies of the past few decades. The paper briefly reviews some of the important elements for a new approach to agricultural policies in Sub-Saharan Africa and contrasts it to the strategy of the World Bank. Sutherland and Yao (2011) suggests that in just three decades or so rapid and sustained economic growth has transformed China from a centrally planned low-income country to a middle-income market economy. At the same time, though, income inequality has increased substantially. There is, however, disagreement on the extent and nature of the changes in income inequality in China. The paper focuses on the nature and complexity of China’s rising income inequality. This analysis points to some of the main reasons for the continued uncertainties surrounding its exact sources. China’s leaders do recognize the problem of income inequalities and have over the years attempted to address it. The ‘development of the western region’, ‘revitalizing the north-east region’ and ‘building a new countryside’ type of policies were implemented in the past for this purpose. Even more recently, pro-people policies have been implemented. The aim has been to reduce poverty and help disadvantaged groups in both the urban and rural areas. The list of these policies includes the total abolition of agricultural taxation, free education to school children up to year nine in all regions, social security benefits to low-income urban households and subsidies of healthcare insurance to low-income urban and rural families. Rural development as well as more balanced regional development has also been attempted. These policies, however, have focused on the urban–rural gap and have avoided putting in place more fundamental domestic institutional and political frameworks. Such policies are necessary to facilitate longer term success in addressing inequality. 9
Downloaded from http://cjres.oxfordjournals.org/ at Marshall Library on January 4, 2012
indexes directly from the microdata as well their decomposition. The key idea is that higher income inequality among differently educated individuals boosts social networks while higher income inequality among individuals with similar education (within inequality) halts social networking. The analysis yields very heterogenous results according to the inequality index used and to the divergent level of social network analyzed. Changes in overall inequality are negatively related to wide and anonymous social networks, while the relation is positive for neighbourhood ties. Increasing income inequality between different educated individuals raises the probability of club membership and friendship, while higher inequality within similar educated individuals is negatively related to anonymous social networks but not to wide social networks. They conclude that the strong correlation between inequality and social networks exists, which suggests the crucial role of policy makers in reducing income inequality, improving social network strength among citizens and raising the level of community social capital, with obvious positive consequences for growth. Consequently, policy makers in their attempt to foster social networks creation should aim at more redistributive policies in favour of the poorer members of the society. Stein (2011) presents trends in poverty and income inequality in Sub-Saharan Africa over the recent past. The focus of the presentation is on agriculture, which is the largest sector in SubSaharan Africa. This enables the author to point to the failure of the strategy and its impact on farmer incomes. The market approach to agriculture has exacerbated poverty in rural areas and likely contributed to worsening income equality. The paper argues that the original logic underlying the World Bank’s structural adjustment policies in Africa has not quite worked out. This was the removal of state created distortions, which not only did it not improve efficiency in the operation of markets but has also failed to enhance income equality and reduce poverty. The paper explores the linkage between adjustment and the deteriorating income distribution and rising poverty in Sub-Saharan Africa and suggests that the
Arestis, Martin and Tyler
10
industry emerged. Financial liberalization and rising capital flows hurt workers by increasing macroeconomic volatility, thereby leading to financial crises that affected income inequality adversely. The link between trade liberalization and inequality is analyzed by focusing on wage shares and trade intensity. The impact of capital flows, the other component of globalization, is examined by focusing on the economic crises of 1994 and 2001 and short-term capital inflows. The outcomes of this exercise are consistent with the claims of the political economy literature. Namely, the trade intensity has had a negative impact on the wage shares in the medium run during the post-trade liberalization period in Turkey. Therefore, the main conclusion of the study is that the overall effect of financial liberalization on the wage shares is negative. Finally, in this issue, Amarante et al. (2011) contribute to the debate on the effectiveness of cash transfers in terms of income inequality variations at the national and regional level, in middle-income countries like Uruguay. In order to undertake this exercise, the authors analyze the inequality impact of Asignaciones Familiares based on a microsimulation model. It is thereby shown how targeting criteria can have effects on school attendance, income inequality and poverty in terms of the recently introduced cash transfer program Asignaciones Familiares. The results obtained show that inequality tends to persist although programme effects on child education and poverty are positive. Targeting mechanisms strongly condition both the geographical distribution of beneficiaries and school attendance outcomes, but do not affect regional disparities and programme effects on inequality. A further result shows that overall inequality before transfers is mainly explained by inequality within regions and the introduction of a relevant programme does not modify this situation. Although the transfer is reaching half of the Uruguayan children, the authors can only find a moderate decrease of income inequality. This result is clearly weak; however, it should be recalled that other ambitious reforms carried out at the same time in the country, such as the inception of an income tax, yielded to an inequality reduction of a similar size. Hence, the
Downloaded from http://cjres.oxfordjournals.org/ at Marshall Library on January 4, 2012
Corrado and Corrado (2011) analyze how inequality affects individuals with relative socioeconomic status across regions in the UK. In this respect, the authors show that, apart from individual sociodemographic characteristics, such as higher educational attainment, housing tenure, ethnicity and marital status, one of the main factors in explaining the downward movements in the social ladder is the level of intraregional inequality. Regional inequality has a dual effect on social mobility: while in more dynamic areas, such as London and East Anglia, individuals with a higher socioeconomic status are less likely to move down the social ladder, in other less dynamic regions such as Wales, income inequality has an adverse effect on social mobility. Using the British Household Panel Survey for testing the status-inequality nexus and building regional inequality indices from microdata, the authors provide new evidence. This new evidence suggests that regional inequality has a dual effect on social mobility: on the one hand, in more dynamic regions, such as London and East Anglia, individuals with a higher socioeconomic status are less likely to move down the social ladder. On the other hand, in other less dynamic regions such as Wales, income inequality might translate into inequality in terms of job opportunities and career prospects; in this case, individuals with a higher social status are likely to step down while people with a lower social status might experience a social class trap. Oyvat (2011) suggests that the negative impact of globalization on functional income distribution in Turkey can be explained by building a theoretical and empirical framework along with examining the industry statistics. Globalization is often thought to result in greater labour flexibility and decreased labour bargaining power, thereby imposing a downward pressure on wages. However, this would result in a deterioration of the wage share and rising inequality within developing countries. Turkey implemented liberalization policies in the 1980s with the specific aim to promote globalization of the Turkish economy by raising trade and capital flows. The author shows with the help of a sectoral panel data set that reduced wage shares in the manufacturing
The Persistence of inequality? paths and policies needed to reduce persistent inequalities in middle-income countries such as Uruguay need to be further studied. References
11
Downloaded from http://cjres.oxfordjournals.org/ at Marshall Library on January 4, 2012
Amarante, V., Amin, R. and Vigorito, A. (2011) Cash transfer programmes, income inequality and regional disparities. The case of the Uruguayan Asignaciones familiares. Cambridge Journal of Regions, Economy and Society, 4: 139–154. Angeriz, A., Arestis, P. and Chakravarty, S. P. (2011) Inequality adjusted growth rates in Latin America. Cambridge Journal of Regions, Economy and Society, 4: 49–62. Charles, A., Fontana, G. and Srivastava, A. (2011) India, China and the East Asian Miracle: A human capital development path to high growth rates and declining inequalities. Cambridge Journal of Regions, Economy and Society, 4: 29–48. Corrado, L. and Corrado, G. (2011) Moving down the social ladder: Analysing the relationship between status and regional inequality in the UK. Cambridge Journal of Regions, Economy and Society, 4: 107–122. D’Angelo, W. and Lilla, M. (2011) Social networking and inequality: the role of clustered networks. Cambridge Journal of Regions, Economy and Society, 4: 63–77. Dollar, D. (2007) Globalisation, poverty and inequality since 1980. In D. Held and A. Kaya (eds.). Global Inequality, pp. 73–103. Cambridge: Polity Press. Galbraith, J. K. (2007) Global inequality and global macro economics. In D. Held and A. Kaya (eds.). Global Inequality, pp. 148–175. Cambridge: Polity Press. Galbraith, J. K. (2011) Inequality and economic and political change: a comparative perspective. Cambridge Journal of Regions, Economy and Society, 4: 13–27. Harvey, D. (2006) Spaces of Global Capitalism: Towards a Theory of Uneven Geographical Development. London: Verso.
Held D, Kaya A. (eds). Global Inequality. Cambridge: Polity Press. Kapstein, E. B. (1999) Sharing the Wealth: Workers and the World Economy. New York: W.W. Norton. Milanovic, B. (2006) Global Income Inequality: What It Is and Why it Matters. World Bank Policy Research Working Paper No. 3865Available at: SSRN: http:// ssrn.com/abstract=922991 [Accessed March 1, 2006] Milanovic, B. (2007a) Globalisation and inequality. In D. Held and A. Kaya (eds.). Global Inequality, pp. 26–49. Cambridge: Polity Press. Milanovic, B. (2007b) Worlds Apart: Measuring International and Global Inequality. Princeton, NJ: Princeton University Press. Oyvat, C. (2011) Globalization, wage shares and income distribution in Turkey. Cambridge Journal of Regions, Economy and Society, 4: 123–138. Sala-i-Martin, X. (2002) The Disturbing ‘Rise’ of Global Income Inequality. Cambridge, MA: National Bureau of Economic Research, Working Paper 8904 Sachs, J. (2005) The End of Poverty: Economic Possibilities for Our Time. London: Penguin. Stein, H. (2011) World Bank agricultural policies, poverty and income inequality in Sub-Saharan Africa. Cambridge Journal of Regions, Economy and Society, 4: 79–90. Stiglitz, J. (2002) Globalisation and Its Discontents. London: Penguin. Sutherland, D. and Yao, S. (2011) Income inequality in China over 30 years of reforms. Cambridge Journal of Regions, Economy and Society, 4: 91–105. Thompson, G. F. (2007) Global inequality, the great Divergence’ and Supra-National Regionalization. In D. Held and A. Kaya (eds.). Global Inequality: Patterns and Explanations. Cambridge: Polity. Wade, R. (2007) Should we worry about income inequality? In D. Held and A. Kaya (eds.). Global Inequality, pp. 104–131. Cambridge: Polity Press. World Bank. (2007) Understanding Poverty. Washington, DC: World Bank.