109S2.Part 1
04/16/01
4:04 PM
Page 199
(Black plate)
The Potential Impacts of Climate Variability and Change on Air Pollution-Related Health Effects in the United States Susan M. Bernard,1 Jonathan M. Samet,2 Anne Grambsch,3 Kristie L. Ebi,4 and Isabelle Romieu5 1Department
of Environmental Health Sciences, School of Hygiene and Public Health, Johns Hopkins University, Baltimore, Maryland, USA; of Epidemiology, School of Hygiene and Public Health, Johns Hopkins University, Baltimore, Maryland, USA; 3Office of Research and Development, U.S. Environmental Protection Agency, Washington, DC, USA; 4EPRI, Palo Alto, California, USA; 5National Center for Environmental Health, U.S. Centers for Disease Control and Prevention, Atlanta, Georgia, USA 2Department
Climate change may affect exposures to air pollutants by affecting weather, anthropogenic emissions, and biogenic emissions and by changing the distribution and types of airborne allergens. Local temperature, precipitation, clouds, atmospheric water vapor, wind speed, and wind direction influence atmospheric chemical processes, and interactions occur between local and global-scale environments. If the climate becomes warmer and more variable, air quality is likely to be affected. However, the specific types of change (i.e., local, regional, or global), the direction of change in a particular location (i.e., positive or negative), and the magnitude of change in air quality that may be attributable to climate change are a matter of speculation, based on extrapolating present understanding to future scenarios. There is already extensive evidence on the health effects of air pollution. Ground-level ozone can exacerbate chronic respiratory diseases and cause short-term reductions in lung function. Exposure to particulate matter can aggravate chronic respiratory and cardiovascular diseases, alter host defenses, damage lung tissue, lead to premature death, and possibly contribute to cancer. Health effects of exposures to carbon monoxide, sulfur dioxide, and nitrogen dioxide can include reduced work capacity, aggravation of existing cardiovascular diseases, effects on pulmonary function, respiratory illnesses, lung irritation, and alterations in the lung’s defense systems. Adaptations to climate change should include ensuring responsiveness of air quality protection programs to changing pollution levels. Research needs include basic atmospheric science work on the association between weather and air pollutants; improving air pollution models and their linkage with climate change scenarios; and closing gaps in the understanding of exposure patterns and health effects. Key words: air pollution, climate change, criteria air pollutants, global warming, ozone, particulate matter. — Environ Health Perspect 109(suppl 2):199–209 (2001). http://ehpnet1.niehs.nih.gov/docs/2001/suppl-2/199-209bernard/abstract.html
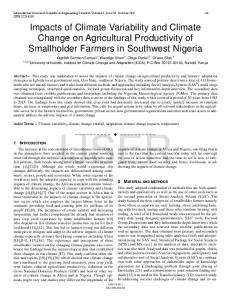
The air is contaminated with pollutants that may adversely affect health. These pollutants have many sources: natural (e.g., volcanoes and decomposition of vegetation), agricultural (e.g., methane and pesticides), commercial (e.g., dry-cleaning operations and auto body shops), industrial (e.g., fossil fuel–fired electric power plants and manufacturing facilities), transportation (e.g., truck and automobile emissions), and residential (e.g., home gas and oil burners and wood stoves). People are constantly and ubiquitously exposed to air pollutants, whether indoors or outdoors. Through the Clean Air Act (1), however, the concentrations of key pollutants are regulated to protect the public’s health. In this article we explore the potential linkages among climate change, air pollution exposures, and human health. Figure 1 sets out a conceptual framework for considering these linkages. Climate change may affect exposures to air pollutants by a) affecting weather and thereby local and regional pollution concentrations (2,3); b) affecting anthropogenic emissions, including adaptive responses involving increased fuel combustion for fossil fuel-fired power generation; c) affecting natural sources of air pollutant emissions (4,5); and d ) changing the distribution and types of Environmental Health Perspectives
airborne allergens (6). Local weather patterns—including temperature, precipitation, clouds, atmospheric water vapor, wind speed, and wind direction—influence atmospheric chemical reactions; they can also affect atmospheric transport processes and the rate of pollutant export from urban and regional environments to the global-scale environments (2,3). The chemical composition of the atmosphere may in turn have a feedback effect on the local climate. The multicomponent framework implied by Figure 1 involves hypotheses about climate change, its links to pollutant concentrations, and adaptive responses. The framework also incorporates the relationships between air pollution exposures and adverse health effects. Although the overall framework and its components are subject to numerous uncertainties, it offers an approach to addressing climate change, air pollution, and health effects. Abundant evidence demonstrates that air pollution can have adverse health effects. Air pollution has been a public health concern in the United States for many decades, beginning with the well-chronicled air pollution disasters that caused acute and readily recognized excess morbidity and mortality. In Donora, Pennsylvania, an air pollution event
• VOLUME 109 | SUPPLEMENT 2 | May 2001
over a 5-day period in October 1948 caused 19 deaths, well above the two deaths expected for this period. About 10% of the population of Donora was thought to be severely affected by the exposure, which resulted from thermal inversions that confined industrial combustion emissions at ground level (7). A few years later, when a slow-moving anticyclone came to a halt over London, England, in 1952, particulate and sulfur dioxide (SO2) pollution built up over a 3-day period, causing 3,000–4,000 excess deaths (7). Prompted by these tragic episodes and mounting scientific evidence on the health effects of air pollution, the U.S. government began a series of measures to research, monitor, and regulate air pollution, culminating in the passage of the 1970 Clean Air Act. Since 1970, implementation of the Clean Air Act (1) has resulted in controls over the ambient concentrations and emissions of the principal combustion-related pollutants and of several hazardous air pollutants (HAPS), primarily carcinogens and irritants. The combustion-related pollutants, which result from the combustion of coal and other fossil fuels, include particles, nitrogen oxides (NOx), carbon monoxide (CO), and sulfur oxides (SOx; depending on the sulfur content of the fuel). Another combustion-related pollutant, ozone (O 3 ), is a secondary pollutant formed This article is based on a background document prepared for the United States National Assessment on Climate Variability and Change. Address correspondence to S.M. Bernard, School of Hygiene and Public Health, Johns Hopkins University, 615 N. Wolfe Street, Room 7041, Baltimore, MD 21205 USA. Telephone: (410) 9554074. Fax: (410) 955-1811. E-mail:
[email protected] Thanks to M. McGeehin, J. Patz, and D. Stein for content contributions and/or editorial advice and to J. Schwartz, M. Lipsett, D. Dockery, J. Rieff, and H. Frumkin for their review and comment. The authors also acknowledge the many other expert, stakeholder, and public reviewers too numerous to name individually. This article was prepared as part of an assessment by the authors and others of the potential impacts of climate variability and change on human health in the United States. This assessment was sponsored by the U.S. Environmental Protection Agency Global Change Research Program as part of the overall U.S. National Assessment of the Potential Consequences of Climate Variability and Change (cooperative agreement CR 827040). Received 20 September 2000; accepted 20 December 2000.
199
109S2.Part 1
04/16/01
4:04 PM
Page 200
(Black plate)
Bernard et al. Moderating influencesa Atmospheric processes Climate change (natural and humancaused)
Regional weather changes • Heat waves • Extreme weather • Temperature • Precipitation
Humangenerated emissions Natural emissions
Aeroallergens (amount, timing, and distribution)
Research
Atmospheric concentrations of pollutants • O3 • PM • SO2 • NO2 • CO
Increased respiratory symptoms and illness Exacerbated chronic heart and lung disease Accelerated lung aging Increased lung cancer risk Increased risk of premature death Allergic diseases Asthma Allergic rhinitis
Adaptation measuresb
Table 1. Selected health effects and biologic markers of response associated with air pollution.a,b Premature cardiorespiratory mortality Deaths from heart or lung disease in excess of number expected Increased health care use Increased hospitalizations, physician visits, emergency department visits Asthma exacerbations Increased physician and emergency department visits, medication use, symptom reporting Decreased peak flow measurements Increased respiratory illness Increased respiratory infections, physician visits, episodic symptoms Increased respiratory symptoms Decreased lung function Spirometry, peak flow rates, airways resistance Increased airways reactivity Altered response to challenge with methacholine, carbachol, histamine, cold air Lung inflammation Influx of inflammatory cells, mediators, proteins Altered host defense Altered mucociliary clearance, macrophage function, immune response
Figure 1. Potential air pollution-related health effects of climate change. aModerating influences include nonclimate factors that affect climate-related health outcomes, such as population growth and demographic change, standards of living, access to health care, improvements in health care, and public health infrastructure. bAdaptation measures include actions to reduce risks of adverse health outcomes, such as emission control programs, use of weather forecasts to predict air quality levels, development of air quality advisory systems, and public education.
a Clinical or public health significance of some effects is unknown. bAdapted with permission from the American Thoracic Society (7).
through complicated atmospheric reactions involving NOx and hydrocarbons as the substrates and driven by sunlight. These pollutants [sulfur dioxide (SO2), nitrogen dioxide (NO2), particles, CO, and O3] along with lead are regulated under the Clean Air Act as “criteria pollutants,” referring to the process for developing the pollutant standards (8). Although pollution control measures have reduced concentrations of the regulated pollutants, adverse effects of air pollution are still found at current concentrations using epidemiologic approaches. Monitoring data from the U.S. Environmental Protection Agency (U.S. EPA) show declining trends in pollutant concentrations over recent decades (4). However, epidemiologic studies of morbidity and mortality associated with air pollution exposure continue to show associations (7,9–11), and experimental data continue to elucidate the underlying mechanisms. At present, there is substantial concern about the public health consequences of particulate matter (PM), and a major national research program is now in progress to address key uncertainties in the evidence available for setting public policy (12). The health effects of air pollution are diverse, extending from dramatic episodes of increased mortality at high concentrations to more subtle but detectable effects on respiratory health, particularly for persons made susceptible by underlying chronic heart or lung disease. Tables 1 and 2, taken from a recent comprehensive review by the American Thoracic Society, summarize health effects for the six criteria pollutants. This summary was based on extensive evidence drawn from
times, most recently in 1990. An important element of the Clean Air Act is the setting of National Ambient Air Quality Standards (NAAQS). Sections 108 and 109 of the Act require the U.S. EPA to identify pollutants that “may reasonably be anticipated to endanger public health or welfare” and to issue air quality criteria for them (8). The criteria, which must “accurately reflect the latest scientific knowledge” (8), are set with the participation of an independent scientific review panel, the Clean Air Scientific Advisory Committee. The U.S. EPA prepares Criteria Documents that extensively review and consolidate the current scientific literature for these pollutants. Besides health effects data, other scientific data are evaluated to provide a better understanding of the nature, sources, distribution, measurement, and atmospheric concentration of these pollutants. The U.S. EPA is required to review the adequacy of the NAAQS every 5 years. Most recently, the NAAQS for O 3 and PM were revised in a July 1997 rulemaking. However, the new NAAQS are not currently in effect because of legal challenge (18). The data described below concern the NAAQS in effect before 18 July 1997. The U.S. EPA must propose and promulgate primary and secondary NAAQS for contaminants; these standards are based on the air quality criteria. Primary standards are set to protect the public health with an adequate margin of safety, including the health of sensitive populations such as asthmatics, children, and the elderly, whereas secondary standards protect against welfare effects such as decreased visibility and damage to animals,
200
animal and in vitro toxicology, human clinical exposure studies, field exposure studies, and epidemiologic studies. Since these tables were prepared for 1996 publication, further evidence of the effects of particles at contemporary concentrations has increased concern about the public health consequences of PM, particularly for persons with asthma, chronic obstructive lung disease, and coronary heart disease. We do not attempt to review comprehensively the evidence of the health effects of air pollution. This literature is extensive and has been well reviewed elsewhere (7,9–11). For the criteria pollutants, the U.S. EPA’s criteria documents offer periodic, complete summaries of the evidence (13,14). We do use our present understanding of air pollution and health to explore and illustrate how climate change may affect health through changing patterns of air pollution exposure. Although in this section we focus primarily on the health effects of exposure to criteria air pollutants in particular, we also discuss briefly the issue of airborne allergens. Production of these allergens depends on the time of year and may increase with temperature increase from climate change. Climate change may affect the timing or duration of seasonal allergies such as hay fever.
Current Air Pollution Levels A series of federal legislative efforts to control air pollution began in the 1950s. Major amendments of the Clean Air Act, in 1970 and subsequently, established the current federal air pollution program (15–17). The Clean Air Act has been amended several VOLUME
109 | SUPPLEMENT 2 | May 2001 • Environmental Health Perspectives
109S2.Part 1
04/16/01
4:06 PM
Page 201
(Black plate)
Climate change and air pollution-related health effects Table 2. Health effects of air pollutants and populations at greatest risk.a,b Agent O3
N02
Numbers exposed at levels above NAAQSc
Groups at risk
69.7 × 10⁶
Healthy adults and children
8.9 × 10⁶
Athletes, outdoor workers Asthmatics (and others with respiratory illnesses) Healthy adults Asthmatics Children
SO2
Acid aerosols
5.2 × 10⁶
?
Healthy adults and COPD patients
Asthmatics Healthy adults Children Asthmatics and others
Particles (PM10)
CO
Lead
21.5 × 10⁶
Children
19.9 × 10⁶
Patients with chronic lung/heart disease Asthmatics Healthy adults Children Patients with ischemic heart disease
14.7 × 10⁶
Clinical consequences Decreased lung function Increased airway reactivity Lung inflammation Increased respiratory symptoms Decreased exercise capacity (Increased hospitalizations) Increased airway reactivity Decreased lung function Increased respiratory symptoms (Increased respiratory infections) Increased respiratory symptoms Increased respiratory mortality and increased hospital visits for respiratory disease Decreased lung function Altered mucociliary clearance Increased respiratory illness Decreased lung function (Increased hospitalizations) Increased respiratory symptoms Increased respiratory illness Decreased lung function Premature mortality Increased asthma exacerbations Decreased exercise capacity
Children
Decreased exercise capacity Angina pectoris (Premature mortality) Altered neurobehavioral function
Adults
Increased blood pressure
Comments Effects found at or below current NAAQS; effects increased with exercise
Effects seen in combination with acid aerosols and particles Effects occur at levels found indoors with unvented sources of combustion
Highly soluble gas with little penetration to distal airways
Observations related to short-term exposures Currently not a criteria pollutant: no NAAQS established Effects seen in combination with O3 and particles
Effects seen alone or in combination with SO2
Effects increased with anemia or chronic lung disease
Elimination of leaded gasoline has resulted in marked reduction in atmospheric levels
COPD, chronic obstructive pulmonary disease. aEffects shown at exposure levels occurring in the United States. Items in parentheses are associations that have been shown in some studies; additional confirmation is suggested. See Table 1 for definitions of health effects. bAdapted with permission from the American Thoracic Society (7). cNumber of people residing in U.S. counties where exposures exceed NAAQS. Data are based on 1990 population data and 1991 air quality data. These do not reflect exposures indoors or to brief peak levels of pollutants outdoors.
crops, vegetation, and buildings. Standards can be set for both long-term (annual average) and short-term (24 hr or less) averaging times. They are enforced primarily by the states. There are currently six criteria air pollutants—CO, lead, NO2, O3, PM, and SO2. Both emissions and ambient air concentration data about these pollutants have been collected nationwide for almost three decades. The Clean Air Act also provides for regulation of HAPs (also called air toxics). In 1990, the hazardous air pollutant program was substantially revised. Technology-based standards are set for HAPs, with further “residual risk” standards to be set if necessary where, even after implementation of the control technology, a source category is emitting HAPs at levels presenting an unacceptable risk to the public or the environment. Much less information is available concerning exposure to and health effects of air toxics than on criteria air pollutants. Another important federal air pollution control program is the effort to reduce acid rain by controlling emissions of Environmental Health Perspectives
precursor pollutants (SO2 and NOx) from fossil fuel-fired power plants. These and other programs are not discussed in detail in this report.
Sources and Trends of Air Pollution Overview Since the advent of the 1970 Clean Air Act, there have been substantial reductions in criteria air pollutant emissions and ambient pollutant concentrations, despite the fact that the population, the economy, and the nation’s use of on-road vehicles have grown. Between 1970 and 1997 aggregate criteria air pollutant emissions decreased 31%, although the total U.S. population increased 31%, the number of vehicle miles traveled increased 127%, and the gross domestic product increased 114% (5). Changes in emissions of individual criteria pollutants over this period ranged from a 98% decrease in lead emissions to an 11% increase in NO2 emissions (5).
• VOLUME 109 | SUPPLEMENT 2 | May 2001
Table 3 summarizes the percent changes in national air quality concentrations and emissions over the last 10 years. Overall, the declining trends in the emissions and monitored concentrations of several criteria pollutants provide strong evidence that air quality in the United States has improved significantly since the mid-1970s. The air quality in many areas, however, falls short of the NAAQS health-based standards. In 1997, approximately 52.6 million people in the United States resided in counties that did not meet the air quality standards for at least one criteria pollutant (5). Emissions and air quality trends are not uniform among the various criteria pollutants. In general, O 3 has proven the most resistant to efforts to reduce its presence in the environment, whereas the presence of lead has been dramatically reduced since 1970 (after leaded gasoline was phased out). As Figure 2 shows, fossil fuel combustion accounts for most of the carbon dioxide (CO2) emissions in the United States. In addition,
201
109S2.Part 1
04/16/01
4:06 PM
Page 202
(Black plate)
Bernard et al.
most criteria air pollutants are also derived from fossil fuel combustion (4,5). Increased energy and fuel use would likely increase greenhouse gas emissions and, without pollution controls, increase emissions of criteria air pollutants. Sources and trends for each of the pollutants are discussed separately below.
Ozone Ground-level O3 is formed in the atmosphere by the reaction of volatile organic compounds (VOCs) and NOx in the presence of sunlight. VOCs are emitted from a variety of manmade and natural sources. Anthropogenic sources include motor vehicles, chemical plants, refineries, factories, consumer and commercial products, and other industrial sources. Plant species responsible for biogenic VOC emissions of isoprene and monoterpenes vary by region of the country and include oak, citrus, eucalyptus, and pine in the Southwestern United States and oak, spruce, maple, hickory, pine, fir, and cottonwood in the Northeastern United States. NOx is emitted from motor vehicles, fossil fuel-fired power plants, other sources of combustion, and natural sources including lightning and biologic processes in soil. Between 1988 and 1997, anthropogenic emissions of VOCs decreased 20% while those of NOx increased by 1%. Estimates of biogenic emissions consider variations in climate and land use, which have a strong impact on emissions rates. For example, roughly 60% of all biogenic VOCs are estimated to occur in the summer, when temperatures are higher than at other times of the year (4). Land use differences affect spatial variation in the density of biogenic VOC emissions; for example, higher VOC densities in the Southern United States are strongly linked to large areas of high-emitting oak trees. The overall relative contributions of anthropogenic versus biogenic sources of VOCs have not been clearly established, and there is geographic variation in the relative contributions of these broad source groups. In the most recent estimates (1997), manmade VOC emissions (19.2 million tons) were exceeded by biogenic emissions (28.2 million tons), but there are large uncertainties
in both biogenic and anthropogenic VOC emission inventories (5). Changing weather patterns can contribute to yearly differences in O3 concentrations (5). For example, the hot, dry, stagnant meteorologic conditions in 1995 in the Central and Eastern United States were highly conducive to O3 formation. O3 and precursor pollutants that cause O3 can be transported into an area from pollution sources hundreds of miles upwind. In addition, ambient O3 trends are influenced by VOC to NO x ratios in the atmosphere and by changes in emissions from ongoing control measures (5). Between 1988 and 1997 ambient O3 concentrations (1-hr average) decreased 19%. O3 patterns vary across the country. In 1997, about 48 million people lived in the 77 counties where O 3 levels exceeded the NAAQS. The highest O3 concentrations that year were found in southern California, the Gulf Coast, and the ortheastern and North Central states, but for the first time the highest O3 levels were recorded not in Los Angeles, California, but in Houston, Texas (5).
Sulfur Oxides, Particulates, and Acid Aerosols The sources of and exposure to sulfur oxides, PM, and acid aerosols are presented together (here and frequently in other sources) because they often have common sources, primarily combustion processes (19). Acid aerosols (such as sulfuric acid) are generated by chemical reactions involving combustion emissions and sulfur and nitrogen oxides, which form sulfates and nitrates, respectively. Although SO2 is one of the listed criteria pollutants under the Clean Air Act, it is likely that many of the health effects of concern for SO2 reflect the combined action of the diverse components of the mixture of pollutants created by fossil fuel combustion (19). Fuel combustion accounted for 85% of all SO 2 emissions in 1997 (5). Other sources included industrial processes and transportation. Between 1988 and 1997, national annual mean SO 2 concentrations decreased 39%. The largest single-year reduction of 19%
occurred between 1994 and 1995, mainly caused by Phase I implementation of the Acid Rain Program, which aimed to reduce SO2 and NOx emissions (5). In a 1995 study, the U.S. Geological Survey reported decreases in rainfall acidity in the eastern United States, particularly along the Ohio River Valley and in the mid-Atlantic states, indicating that reductions in SO2 emissions have resulted in less acidic rainfall in these areas (20). Only one county, with a population of more than 80,000, failed to meet the ambient SO 2 NAAQS in 1997. PM consists of solid or liquid particles found in the air, including dust, pollens, and soot and aerosols from combustion activities (19). Particles originate from a variety of mobile, stationary, and natural (e.g., wind erosion) sources, and their chemical and physical compositions vary widely. PM can be emitted directly or can be formed in the atmosphere when gaseous pollutants such as SO2 and NOx undergo transformation to form fine particles. The chemical and physical composition of PM varies depending on location, source, time of year, and meteorology. Typically, suspended particles in the atmosphere are categorized into two sizes: Those that are 3–30 µm in aerodynamic diameter (coarse mode) tend to be of natural origin and to be alkaline in total pH; those that are < 3 µm in aerodynamic diameter (fine mode) derive largely from manmade sources and include acid concentrates of combustion processes (19). The size of the particle is significant because particles < 2–3 µm in aerodynamic diameter tend to deposit deep in the lungs, in the terminal bronchioles and alveoli; larger particles tend to deposit in the upper airways (19). Early air monitoring for particulates measured total suspended particulates (TSPs), which included all suspended particles up to a vaguely defined size of 30–40 µm (19). Particulate air quality standards were changed in 1987 to control inhalable particles, defined as those < 10 µm aerodynamic diameter (PM10). PM10 samples replaced the earlier TSP monitors, and the first complete year of PM 10 data for most monitors was 1988. Between 1988 and 1997 average PM 10 concentrations decreased 26%.
Pollutant O3c NO2d SO2 PM10e CO Lead
1988 24,027 23,718 23,154 3,528 116,081 7,053
Emissions 1997
% change
Air quality concentration 1988–1997 (% change)
19,214 23,582 20,369 3,112 87,451 3,915
–20 –1 –12 –12 –25 –44
–19 (1 hr) –14 –39? –26 –38 –67
aLead
emissions in short tons; other emissions in thousands of short tons. bData from U.S. EPA (5,13). cEmissions of volatile organic compounds, many of which are ozone precursors. dEmissions of nitrogen oxides. eIncludes only directly emitted particles. Does not include PM10 emissions estimates from agriculture and forestry, other combustion, cooling towers, fugitive dust, and natural sources. These sources totaled 30,469 thousand short tons in 1997. In addition, secondary PM formed from SO2, NOx, and other gases comprises a significant fraction of ambient PM.
202
VOLUME
Percent of total emissions
Table 3. National air pollutant emissions and concentrations.a,b 100 80 60 40 20 0
CO2
NOx
CO
SO2
PM10 VOCs
Pb
Air toxics
Figure 2. Emissions of air pollutants associated with fossil fuel combustion. Data from U.S. EPA (5).
109 | SUPPLEMENT 2 | May 2001 • Environmental Health Perspectives
109S2.Part 1
04/16/01
4:07 PM
Page 203
(Black plate)
Climate change and air pollution-related health effects
Directly emitted PM generally has origins in two separate source groups, neither of which includes PM secondarily formed in the atmosphere from gaseous pollutants (e.g., SO2 and NOx). The first group comprises source categories similar to those in traditional emission inventories and includes fuel combustion, industrial processes, and transportation. Altogether, this group accounted for roughly 9% of total direct PM10 emissions nationwide in 1997. The remaining 91% of direct PM10 emissions in 1997 were accounted for by the second group, made up of miscellaneous anthropogenic and natural sources. These include fugitive dust, agriculture and forestry, wind erosion, wildfires, and managed burning. However, this second group can be difficult to quantify relative to the more traditionally inventoried sources, and its contribution tends to fluctuate a great deal from year to year (45). Considering both the annual and 24-hr standards, there were 8 million people living in 13 counties with PM 10 concentrations above the NAAQS in 1997.
Nitrogen Dioxide High-temperature combustion processes (e.g., in motor vehicles, fossil fuel-fired power plants, and industrial boilers) generate nitric oxide (NO) and, to a lesser extent, NO2; NO converts to NO2 through oxidation reactions (19). NO2 is a strong oxidizing agent that reacts in the air to form nitric acid, as well as toxic organic nitrates. It also plays a central role in the atmospheric reactions that produce ground-level O3. The two primary sources of NOx emissions in 1997 were fuel combustion for energy (e.g., coal-fired electric utilities) and transportation (e.g., motor vehicles). Nationally, annual mean NO2 concentrations decreased by 14% from 1988 to 1997 (5). All monitoring locations across the nation met the federal NO2 NAAQS in 1997, for the fifth year in a row. There are biogenic sources of NO, which oxidizes in ambient air to form NO 2 . Biogenic NO emissions were estimated to be 1.5 million tons in 1997. As with biogenic emissions of VOCs, estimates of natural NO emissions are strongly affected by differences in climatology and land use. For example, relatively high densities of biogenic NO in the Midwestern United States are associated with areas of fertilized crop land (4).
Carbon Monoxide National total CO emissions decreased 25% from 1988 to 1997. Transportation accounted for about three-fourths of CO emissions nationwide in 1997, with highway vehicle exhaust contributing more than half of all CO emissions. In cities, car exhaust contributes as Environmental Health Perspectives
much as 95% of all CO emissions, producing high concentrations of CO in local areas with heavy traffic congestion. Other sources of CO emissions in 1997 included industrial processes and nontransportation fuel combustion. Miscellaneous emissions (e.g., agriculture fires, forest wildfires) represented more than 10% of CO emissions in 1997 (5). Nationally, average CO levels have decreased 38% from 1988 to 1997, and ambient levels in 1997 were the lowest recorded during the past 20 years of monitoring. Improvements in ambient CO levels have occurred despite a 25% increase in vehicle miles traveled. In 1997, only three counties with a combined population of 9 million people failed to meet the CO NAAQS.
Lead Overall lead emissions decreased by 98% between 1970 and 1997 (5). Historically, the major source of lead emissions was on-road vehicles. However, the use of lead in gasoline for on-road fuels has been phased out entirely (on-road vehicles contributed only about 0.05% to total 1997 lead emissions). Leaded gasoline is still used in off-road vehicles such as farm equipment and nonroad transportation. Metals processing is now the major source of lead emissions, accounting for about half of lead emissions in 1997 (5). Between 1988 and 1997, average lead concentrations at population-oriented monitors decreased 67% (5). Currently, the highest concentrations of lead are found around nonferrous smelters and other stationary sources of lead emissions. In 1997, four lead point sources had one or more source-oriented monitors that exceeded the NAAQS. The four counties containing these point sources, with a population of 2.4 million, did not meet the lead NAAQS in 1997 (5).
Health Effects of Air Pollution Exposure Since the 1950s, with the initial impetus coming from the air pollution disasters, the health effects of air pollution have been extensively investigated. Despite substantial research, many questions remain unanswered concerning the risks of outdoor air pollution. Some of the key health effects ascribed to exposure to criteria air pollutants are listed in Table 1. Some of the outcomes listed in Table 1 are plainly adverse, e.g., premature death and increased hospitalizations or exacerbation of asthma. Others are biologic indications of responses that have uncertain clinical significance (7,21). The information linking these effects to air pollution exposure comes from a variety of scientific approaches, including animal toxicology, human clinical exposure studies, field exposure assessment studies, and epidemiologic investigations. The resulting
• VOLUME 109 | SUPPLEMENT 2 | May 2001
data encompass molecular mechanisms to population-level impacts. For some observed effects, the mechanisms and specific pollutants responsible have not been definitively established (7). Furthermore, these pollutants and their health impacts have been studied (and are regulated and controlled) separately, although mixtures of these individual pollutants commonly occur (7). Nonetheless, evidence of health effects from these exposures has been the basis for setting policies to control air pollution throughout the world. Comprehensive reviews of this evidence have been reported elsewhere (7–11,19,22). We do not attempt to review comprehensively the evidence on the health effects of the various air pollutants. Instead, we emphasize O3 and particulate air pollution, the two pollutants for which concentrations are anticipated to be affected by climate change in the framework proposed in Figure 1. Although research is in progress on both of these pollutants, the evidence has identified a number of adverse health effects and has been the basis for standard-setting for both. With regard to climate change, we consider less relevant the combustion-related gaseous pollutants NOx, sulfur oxides, and CO, although both nitrogen and sulfur oxides contribute to the formation of secondary particles.
Ozone As noted above, photochemical pollution, for which O3 is the index pollutant, is a continuing air pollution problem in many parts of the United States. In warm weather, ambient O3 concentrations can exceed 0.12 parts per million (ppm) (the current 1-hr regulatory average) for several hours daily for 1 or more days (7). For many people in the United States, outdoor exposure to O 3 is limited because only a small part of the day is spent outside and people are encouraged to stay indoors, where levels are generally low, during episodes of particularly high O3 levels. Some occupations and activities by adults and children lead to higher exposures and lung doses, caused by the time spent outside and the increased breathing rates involved in these activities, such as outdoor work in landscape and construction, strenuous outdoor exercise (adults and children), and outdoor play (19). O 3 and other photochemical oxidants injure the epithelial surfaces onto which they are adsorbed. Experimental animal and in vitro studies have shown increased permeability and inflammation of airways; morphologic, biochemical, and functional changes; and decreased host defense functioning as a result of acute O 3 exposure (23). In vitro studies using very high concentrations of O3 (> 10 mg/m 3 ) suggest that O 3 has a low potential to cause mutagenic, cytogenic, or
203
109S2.Part 1
04/16/01
4:07 PM
Page 204
(Black plate)
Bernard et al.
cellular transformation effects (24). Thus, the health effects of concern relate primarily to lung inflammation, with clinical manifestations arising from direct effects on the lung and possibly indirect effects arising from systemic consequences of lung inflammation and mediator release. Exposure of healthy individuals (including children) to relatively low O3 concentrations can cause lung inflammation, acutely decreased lung function, and respiratory impairment (19). The evidence of short-term effects on lung function comes from both experimental exposure and observational studies (7). The experimental studies have involved exposures ranging from less than 1 hr to up to 8 hr with intermittent periods of exercise (7). These studies have consistently shown transient decline of the forced vital capacity and symptoms of irritation, such as cough and chest pain, with exposure to O3 at concentrations frequently measured in urban areas of the United States. The effects of O3 on airways and alveoli have been evaluated in studies in which human subjects have been exposed while at rest and while exercising in a chamber on a stationary cycle or treadmill (25–27). Decrements in measures of lung function and physical performance, aggravation of respiratory tract symptoms, increased airway reactivity and evidence of acute inflammation have been demonstrated at exposure levels as low as 0.08 ppm (25–27). In healthy young adults, intense and sustained exercise, which increases the effective dose to the lungs, is required to provoke changes in lung function (25–27). Significant losses in lung function and symptoms of cough and pain with deep breathing have been observed after prolonged exposure to concentrations at 0.12 ppm O3 (28). Similar acute, reversible changes in lung function have been observed in exercising children exposed to 0.12 ppm of O3 (29,30). These studies all show wide but reproducible variability among individuals’ sensitivity to O3; the factors that contribute to this large intersubject variability remain undefined. These results suggest that children and adults who engage in prolonged exercise or labor outdoors may be at risk for adverse health effects at O3 concentrations near the ambient standard and typical of summertime levels in some cities (19). Complementary evidence has been obtained from epidemiologic studies conducted at summer camps (31). In these studies, children showed transient reductions in lung function associated with ambient O3 concentrations that were comparable to those measured in the experimental studies. There appears to be some degree of adaptation to the early, reversible effects. Long-term exposure is suspected to contribute to the development and exacerbation
204
of chronic lung diseases by causing permanent changes in the airways and alveoli and accelerating lung function decline. Animal models of long-term exposure to O 3 show alveolar changes consistent with the earliest stages of emphysema and also subtle changes in the small airways; these abnormalities would be expected to have the physiologic consequence of airflow obstruction (31). These experimental observations of airways and alveolar injury suggest that O3 exposure may reduce the rate of lung growth during childhood and accelerate the decline of lung function during adulthood. Several long-term epidemiologic studies have been carried out to test these hypotheses. One prospective cohort study of children and adults in southern California showed increased decline for persons living in the communities with the higher levels of O 3 compared with those living in the lower-O3 communities (32). In this study physiologic measurements were taken over 5-year intervals; there was a statistically significant decrease in respiratory function and nitrogen washout—an indicator of damage to small airways—in persons in communities exposed to higher levels of O3, sulfates, and PM than those in less exposed communities. Reductions in nitrogen washout values in the range of 2–5% were observed in children. These findings suggest that aging of the lungs may be accelerated by long-term exposure to a mix of photochemical oxidants and other air contaminants (32,33). Cross-sectional evidence from college students in California also suggests effects of O3 exposure during childhood on the level of lung function attained (34). A recent study of children in Los Angeles, California, also found lower lung function associated with peak O3 exposure, particularly among children reported to spend more time outdoors (35,36). The health consequences of short-term O3 exposure have also been investigated in persons considered potentially susceptible, particularly those with asthma and chronic obstructive lung disease. Both epidemiologic and experimental approaches have been used. The results from clinical studies on subgroups (other than children) of the population that may be at particular risk from O3 exposure, such as persons with asthma or other lung disorders, have been mixed. Generally, the lung function and symptom responses of asthmatics and patients with chronic obstructive pulmonary disease (COPD) do not appear different from those of healthy subjects experimentally exposed to O 3 (37–39), although the available evidence is limited. However, epidemiologic studies provide evidence that O3 exposure may increase morbidity from asthma. Recent studies of asthmatics, particularly asthmatic children, have shown worsening of clinical symptoms VOLUME
and decreases in lung function associated with exposure to O3 (13). In clinical studies O3 exposure potentiates the effect of allergen exposure in sensitive asthmatics, perhaps as a consequence of increased penetrability of the respiratory epithelium from O 3 exposure (40). Time-series studies provide complementary evidence linking daily O3 concentrations to indicators of asthma morbidity. For example, daily hospital asthma admissions are consistently associated with ambient O 3 levels in various locations in the Northeastern United States (13). Time-series studies also indicate that O3 may be a more general cause of morbidity and mortality. Numerous time-series studies (31) have reported that increased O3 (and other pollutants) are associated with increased daily mortality counts. Total mortality counts are associated with O3 levels, as are some causespecific categories, including cardiac causes (31). Studies of hospitalization (31) also show associations of O3 concentrations with cardiac and respiratory admissions, even after taking other pollutants into consideration. These findings have added to the concern that the health effects of O3 exposure may still constitute a substantial public health problem, even at concentrations around current standards.
Particulate Matter Particles are another pollutant of primary interest in relation to climate change. Particles are classified as primary or secondary in their origins. As noted, the primary particles are directly emitted from sources, and the secondary particles are formed from gaseous precursors, including the sulfur oxides and NOx. During the 1990s there was resurgent interest in the health effects of PM, following evidence of short-term and long-term associations between levels of PM and mortality and morbidity (41). The health effects of particles and the mechanisms contributing to these health effects are presently under intensive investigation, and we do not attempt to cover either the full literature or the many areas of uncertainty currently under investigation (12). With regard to climate change, combustion-related particles are considered particularly relevant. Climate change may also lead to changes in particulate allergen exposures. Both historically documented episodes and more recent time-series studies link PM to adverse effects on morbidity and mortality. The sudden increase in illness and death seen in the London air pollution episode of 1952 and the Donora incident of 1948, described above, was associated with high concentrations of PM and SO2. There is little doubt that the pollution exposure caused those adverse effects (19). During the London episode, measurements of particles and SO2 reached levels at least 10-fold greater than
109 | SUPPLEMENT 2 | May 2001 • Environmental Health Perspectives
109S2.Part 1
04/16/01
4:07 PM
Page 205
(Black plate)
Climate change and air pollution-related health effects
peaks found in the most polluted cities in the United States at present. As noted, 3,000– 4,000 excess deaths were attributed to this 1952 episode. An air pollution episode a decade later, which had similar SO2 concentrations but much lower particle concentrations, was associated with about 800 excess deaths (19). This suggests that the excess deaths from the 1952 event may have been more closely associated with PM than with SO 2 pollution (19). Over the last decade, numerous reports of time-series analyses have assessed the association of daily mortality counts with levels of PM and other pollutants on the same or previous days (14,41,42). Overall, these studies show associations with measures of PM concentration that are robust with respect to control for levels of other pollutants and to control for weather (10,11, 14,43). Interpretation of these associations for public health purposes is clouded by uncertainty about the degree of life-shortening resulting from these short-term effects. However, the findings of several long-term cohort studies, including the Harvard Six Cities Study (44) and the Cancer Prevention Study of the American Cancer Society I (45,46), suggest that there may be a longterm effect of PM on mortality. Particle concentration in outdoor air has also been associated with morbidity, particularly in the elderly. A series of reports based on Medicare data have assessed associations between hospital admissions in the elderly and levels of PM and other pollutants. These studies indicate an association between PM levels and increased risk for admissions for respiratory causes, including COPD and pneumonia, and for cardiovascular causes, including ischemic heart disease (10,11, 47–50). The potential mechanisms linking inhaled particles to acute cardiac consequences are still uncertain, although hypotheses have been offered concerning lung inflammation and cytokine release with effects on the heart (51). Exposure to particulates has been associated with increases in respiratory symptoms in a diary study of adults with COPD (52). A series of analyses on adults participating in the Health Interview Study have shown associations between exposure to particles and respiratory symptoms severe enough to restrict activity (53). These studies suggest that ambient particulate pollution, even at relatively low concentrations, exacerbates chronic respiratory conditions in adults (19). Particle concentrations have also been associated with respiratory morbidity in children, as assessed by rates of hospital admissions and emergency room visits and by direct assessment of symptoms and lung function level (41). For example, Schwartz et al. reported an association between PM10 concentrations and daily rates of lower respiratory Environmental Health Perspectives
tract symptoms in a diary study of school children in the Harvard Six Cities study (54). Dockery et al. (55) have also reported associations of the rates of chronic cough, bronchitis, and chest illness in school children in the Harvard study with various measures of particulate pollution, including TSP, PM 15 , PM 2.5 , and sulfate. Associations with SO2 were also positive, though weaker.
Carbon Monoxide High exposures to CO, another criteria air pollutant, now occur primarily with certain occupations (e.g., firefighting) and unintended poisoning and suicide (e.g., defective or improperly used combustion devices). High exposure can cause acute poisoning, resulting in coma and death. Although exposures to CO in urban settings are generally several orders of magnitude lower than those associated with intoxication and poisoning, some exposures during urban activities may adversely affect the heart and the brain, the most oxygen-sensitive organs. Prolonged exposure to low-level outdoor CO may lead to development of carboxyhemoglobin levels at which adverse health effects have been clinically demonstrated for susceptible persons. Conditions such as cardiovascular disease, chronic respiratory disease, and pregnancy may put significant fractions of the population at elevated risk. Recent time-series studies continue to show evidence of associations of CO with mortality and hospitalization (19), but the effect of CO cannot be readily separated from those of other pollutants. Studies of low-level exposures to date have focused primarily on subpopulations whose cardiovascular or respiratory health is compromised (19). Susceptible groups include people with ischemic heart disease, peripheral vascular disease, and COPD. In patients with coronary heart disease, controlled exposure studies suggest that exposure to elevated levels of CO impairs the response of the myocardium to increased metabolic demands and that ventricular arrhythmias associated with ischemia induced by exercise can be aggravated by exposure to CO (19). Although controlled clinical studies have also been conducted on patients with COPD, the evidence for effects of CO on exercise performance in this potentially susceptible subgroup is limited (19). There are also only inconsistent data addressing the possible impairment of central nervous system function after exposure to low concentrations of CO. Varying effects on visual perception (56), auditory perception (57), manual dexterity (58), and vigilance (59) have been reported, but in normal subjects, clinically important neurobehavioral deficits have not been observed below 10% carboxyhemoglobin (19).
• VOLUME 109 | SUPPLEMENT 2 | May 2001
Nitrogen Oxides In outdoor air, NO 2 does not generally occur by itself, but as part of a complex mixture of primary and secondary pollutants. Consequently, characterizing the effects of NO 2 in outdoor air has proved difficult. The contribution of NO2 to secondary particles and its role in the formation of O 3 may be more relevant to public health than any direct effect of the gas. However, NO2 does have the potential to compromise respiratory health. This oxidant gas combines with water in the lungs to form nitric and nitrous acids, which are believed to damage the lung epithelium via oxidation mechanisms (60). Dosimetric modeling suggests that NO2 is absorbed principally in the large and small airways and that little is deposited in the alveoli (61,62). At extremely high concentrations (> 200 ppm), NO2 causes extensive lung injury, including fatal pulmonary edema and bronchopneumonia (63). Animal experiments show that exposure to NO2 concentrations an order of magnitude higher than those generally found in ambient urban air can impair the defense mechanisms of the lung (64,65). Few similar studies have been done on human subjects. However, one study by Goings et al. (66) on the effects of acute NO 2 exposures of 1–3 ppm on 152 young, nonsmoking adults found that during the first 2 years of the investigation there were no statistically significant differences in immune response to controlled influenza infections between subjects and controls (similar adults not exposed to NO2). However, during the third year 90% of the subjects developed an antibody response to exposure, compared with 70% of those exposed to placebo (66). Although these results suggest an effect, they are limited by the small sample size and the possibility that susceptibility to infection may have varied across the 3 years because of immunity acquired from natural influenza infections (19). From a public health perspective, the relatively high concentrations and lengthy exposures used in animal and clinical studies are not representative of exposure in the community, although daily average personal exposure levels as high as 0.065 ppm may occur (67). Few data exist on the frequency and level of transient elevated exposures during daily activities. The relation between respiratory illness and symptoms and NO2 exposure has been studied more frequently in the indoor setting. Much of the population’s exposure to NO 2 takes place indoors, where sources include cooking stoves and space heaters (19). Brief exposure to concentrations as high as 0.500 ppm may be experienced while cooking with a gas stove or driving in traffic (68). Elevated levels are also expected when an unvented gas space heater is operated, but
205
109S2.Part 1
04/16/01
4:08 PM
Page 206
(Black plate)
Bernard et al.
such elevated levels generally are not sustained (19). Several epidemiologic studies have examined the relation between respiratory tract illness and symptoms and ambient levels of NOx, with mixed findings (19).
Lead As noted above, lead emissions (especially from leaded fuels) have declined dramatically over the past 30 years, as have ambient lead levels. The reduction of lead in air has greatly reduced exposure to lead through inhaled air and swallowed dust, food, water, and beverages contaminated with lead deposited from air (19). Some lead exposure will continue to occur through background exposure resulting from natural sources of lead and from past deposition of lead onto soil and into other media from which it can become airborne or enter the human food chain. Although lead contamination is generally a diminishing air pollution concern in the United States, lead will continue to be an important public health concern in this country because of its well-established neurologic impacts on children [see, e.g., U.S. EPA Lead Criteria Document (69)].
The Role of Climate Climate change may affect exposures to air pollutants by a) affecting weather and thereby local and regional pollution concentrations; b) affecting anthropogenic emissions, including adaptive responses involving increased fuel combustion for power generation; c) affecting natural sources of air pollutant emissions; and d ) changing the distribution and types of aeroallergens. Local weather patterns—including temperature, precipitation, clouds, atmospheric water vapor, wind speed, and wind direction—influence atmospheric chemical reactions. They can also affect atmospheric transport processes and the rate of export of pollutants from urban and regional environments to global environments (2,3). In addition, the chemical composition of the atmosphere may in turn have a feedback effect on the local climate. Weather is also associated with energy demands (e.g., for space heating and cooling) that could alter patterns of fossil fuel combustion. In particular, individual responses to extremely hot weather can result in large increases in air conditioner use. In addition, high temperatures cause increased VOC evaporative emissions when people fuel and run motor vehicles. When assessing health impacts, we must consider the potential for interactions among climate change, lifestyle, and pollution exposures. For example, greater use of air conditioning to avoid heat stress would produce greater emissions of air pollutants. However,
206
the closing of windows could reduce outdoor–indoor penetration of pollutants such as particles and O3. As a result, total personal exposures might drop under this scenario. The net effect of these factors on health risks—increased pollutant levels and reduced exposures—has not been evaluated. The seasonal variation in natural emissions of VOCs and NO suggests that warmer temperatures are associated with increased natural emissions. For example, an increase of 10°C can cause over a 2-fold increase in both VOC and NO biogenic emissions (4). Natural particulate emissions (e.g., from wildfires and soil erosion) can also be affected by weather patterns such as droughts. Thus, changes in weather that may accompany climate change may affect atmospheric concentrations of air pollutants (70,71). Of particular concern are potential changes in O3 and particulate concentrations. Nonetheless, the type (i.e., local, regional, or global), the direction (i.e., positive or negative), and the magnitude of changes in air quality that may be attributable to climate change are presently unknown. Weather and climate could also affect health through exposures to biologic agents, including aeroallergens and microbiologic agents. For example, many allergies exhibit a seasonal pattern, reflecting pollen releases and levels in the air. This seasonality suggests that climate variability and weather may play a role in the amount and timing of such releases and consequent health outcomes. Over the longer term, climate influences the geographic distribution of plant species associated with allergens, although the precise impact of climatic changes on allergens is unknown.
The Role of Climate Change Of the few studies that have attempted to quantify the potential effects of climate change on air quality, most have examined the impact of increased temperature on O3 formation (72–74). In general, these studies find that O3 concentrations increase as temperatures rise, although the estimated magnitude of the effect varies considerably. However, the ability of atmospheric models to simulate complex photochemical reactions in the atmosphere is limited for several reasons, including uncertainties in emission inventories. Further, several of these studies relied on assumptions for key variables such as emission levels, mixing heights, and cloudiness (70,72–74). Because many aspects of weather affect air quality, and most of these have been held constant in modeling studies, the results of these studies should not be considered predictions of future air quality levels associated with climate change. VOLUME
Rather, they demonstrate the sensitivity of atmospheric air pollutants to changes in specific meteorologic variables. For example, the air quality simulations driven by increases in temperature and ultraviolet illumination have not addressed such issues as the frequency of occurrence of the kinds of stagnant weather episodes associated with the highest observed O3 concentrations over broad areas.
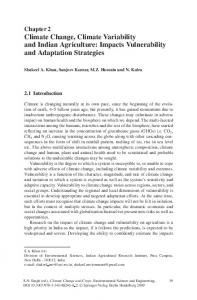
Climate Change and O3 As noted previously, ground-level O3 is not emitted directly but rather is formed through interactions between the O3 precursors (NOx and VOCs) in the presence of sunlight. Meteorologic factors that, in theory, could influence surface O3 levels include ultraviolet radiation, temperature, wind speed, precipitation, atmospheric mixing and transport, and surface scavenging. There is a direct correlation between temperature and O3 levels (Figure 3) (75–77). In general, an increase in atmospheric temperature accelerates photochemical reaction rates in the atmosphere and increases the rate at which tropospheric O3 and other oxidants (e.g., hydroxyl radicals) are produced (73,78). However, O3 levels do not always increase with an increase in temperature (e.g., when the ratio of VOCs to NOx is low). Increases in water vapor increase the potential for O3 formation (2), as do frequent or intense high-pressure systems. Furthermore, forests, shrubs, grasslands, and other sources of natural hydrocarbons (VOCs) emit greater quantities at higher temperatures. Soil microbial activity may also increase with warmer temperatures, leading to an increase in NOx emissions (5). Higher natural emissions of VOCs and NOx could lead to an increase in tropospheric O3 (71). Climate change could reduce O3 concentrations, however, by modifying factors that govern O3-producing reactions (70,71); for example, a more vigorous hydrologic cycle could lead to an increase in cloudy days. More cloud cover, especially in the morning hours, could diminish reaction rates and thus lower O3 formation. In a preliminary study, Gery et al. (76) examined the effects of increased temperature and decreased stratospheric O3 on tropospheric O3 formation in 15 separate combinations of city and meteorologic episodes. The episodes covered varying levels of O3 concentrations in Los Angeles; New York City; Philadelphia, Pennsylvania; Washington, DC; Phoenix, Arizona; Tulsa, Oklahoma; Nashville, Tennessee; and Seattle, Washington. The cityepisode pairs (cases) were grouped into four classes according to the general level of photochemical reactivity in each case. Combinations of higher temperatures (+2°C and +5°C) and
109 | SUPPLEMENT 2 | May 2001 • Environmental Health Perspectives
109S2.Part 1
04/16/01
4:08 PM
Page 207
(Black plate)
Climate change and air pollution-related health effects
Environmental Health Perspectives
O3 perturbation. This study applied a 4°C temperature perturbation uniformly on a region encompassing the Northeastern United States. In addition, the amount of upward penetration of emission plumes and the mass of emitted hydrocarbons from biogenic sources were allowed to respond to the temperature increase. [Lamb et al. (79) estimated that natural VOC emissions from deciduous forests would increase by a factor of three with a temperature change from 20 to 30°C.] The response of evaporative hydrocarbon emissions from motor vehicles to the temperature increase was also included in the analysis (74). The model simulations showed that under global warming conditions the concentrations of O3 increased throughout the region. Incremental increases in O3 concentration associated with the 4°C increase ranged from about 28 parts per billion (ppb) at the maximum (on a simulated base level of 145 ppb) to 8 ppb at the minimum (on a base of about 27 ppb).
Climate Change and SO2 and Nitrogen Oxides SO2 and NOx oxidize in the atmosphere to form sulfuric acid and nitric acid, respectively. These acids may be deposited to the earth’s surface in dry form as gases or aerosols or in wet form as acid rain. Wet deposition is determined by the amount, duration, and location of precipitation and changes in the total acid levels, which are in turn determined by atmospheric chemistry and precipitation patterns (5,80). Although regional patterns of acid deposition are uncertain, many of the factors that affect O3 formation also influence acid deposition (2,5). Higher temperatures accelerate the oxidation rates of SO 2 and NOx to sulfuric and nitric acids, increasing the potential for acid deposition. Conversely, an increase in cloud cover may reduce the rates of transformation from SO2 to acidic materials, thus reducing the potential for acid deposition. In contrast, a decline in the stratospheric O3 concentration may increase acid deposition, because more ultraviolet radiation will be available to accelerate chemical reactions (2,5). Changes in circulation and precipitation patterns will affect transport of acidic materials, which in turn will determine the geographic location of acid deposition (2,80). Local, regional, and national air quality levels, therefore, will be partially determined by changes in circulation and precipitation patterns (2,70,80). Hales (81) used a storm-cloud model (PLUVIUS-2) to examine the impacts of a temperature increase on the production of acidic materials. The model results indicated that sulfate production increased by about 2.5 times for a 10°C increase in temperature.
• VOLUME 109 | SUPPLEMENT 2 | May 2001
240 210
Atlanta, GA
180 150 120
Maximum daily O3 (ppbv)
decreased O3 column (losses of about one-sixth to about one-third of the stratospheric O3) were modeled in each case using the OZIPM3 photochemical trajectory box model (76). The results of the study are summarized for the four groups of cases for both separate and combined atmospheric perturbations. The effects of stratospheric O3 depletion (in the range considered, which corresponds to very large depletions) were larger than those of the temperature increases, as measured by changes in ground-level O3 concentrations. The temperature effect (assuming base case stratospheric O 3 ) was found to increase ground-level O3 by about 2–4% for a 2°C increase and by about 5–10% for a 5°C increase (76). These are averages over all of the groups. The more reactive groups showed greater increases and the less reactive groups showed smaller increases, which would imply that temperature impacts would be worst in those places where ground-level O3 is already highest. Morris et al. (72) examined the effects of future climate change on air quality, using an improved air quality simulation mode—the RTM-III, a three-dimensional regional oxidant model. The study examined the effects on daily tropospheric O3 concentrations of a 4°C uniform temperature increase and an attendant increase in water vapor concentration, assuming a constant relative humidity. The model results indicated that changes in the highest daily O 3 concentrations could range from –2.4 to +20%. The number of exceedences of NAAQS for O3 concentrations was estimated to increase by 1 to 2 times over the number of exceedences in the base case (i.e., no future temperature change scenario). A further study (73) used an improved version of the OZIPM3 box model and a different set of cities. This study examined a broader range of reactivity conditions and used locally specific, model-predicted temperature changes corresponding to a doubled CO2 experiment. The impact of temperature on biogenic hydrocarbon emissions was included. The study estimated the changes in VOC emission controls required to attain the O 3 NAAQS in each city (Memphis, Tennessee; Dallas, Texas; Philadelphia; Baton Rouge, Louisiana; and Atlanta, Georgia). In all cases the required controls increased approximately in proportion to the local increases in temperature. The stringency of the required controls increased further when the combined temperature and stratospheric O3 perturbations were applied, confirming the results of the earlier study (72). In the most recent of these studies (74), an updated regional photochemical grid model was applied in a simulation of impacts of climate change without the stratospheric
90 60 30 0 0
10
15
20
25
30
20
25
30
35
40
240 210
New York, NY
180 150 120 90 60 30 0
0
10
15
35
40
Maximum temperature (°C) Figure 3. Maximum daily O3 concentrations in Atlanta, Georgia, and New York, New York, versus maximum daily temperature, May–October, 1988–1990. ppbv, parts per billion volume. Data from U.S. EPA (13).
Greenhouse Gas Mitigation Policies and Air Quality As noted above, fossil fuel combustion processes that produce CO2 and other greenhouse gases also produce criteria pollutant emissions. Consequently, policies that strive to reduce greenhouse gas emissions (e.g., by reducing energy demand) can be expected to yield an ancillary benefit of reduced criteria pollutant emissions. One study found that such ancillary benefits can be substantial (82). For the United States the impact of reduced exposure to PM10 caused by climate mitigation via reduction of fossil fuel emissions that produce both PM and CO 2 emissions (energy-related CO2 emissions 15% below 1990 levels in developed countries and 10% below projected 2010 levels in developing countries) was estimated to be about 30,000 fewer premature deaths per year by 2020. Because this study relied on numerous critical assumptions, the results should be viewed as illustrating the potential magnitude of the health benefits of a mitigation policy.
Natural Allergens and Fungal Growth It has been suggested that climate change will increase exposure to natural allergens. The levels of aeroallergens, e.g., pollens, change with the seasons and affect a variety of allergyrelated conditions. Pollen counts from birch trees (the main cause of seasonal allergies in northern Europe) increase with increasing temperature (6). However, the relationships among airborne fungal spores, pollen, peak expiratory flow rates, and temperature in asthmatic subjects could not be clearly discerned in one study (83). In another study, it was found that the incidence of seasonal allergic rhinitis was linked more strongly to land use change and farming practices than to climate (84).
207
109S2.Part 1
04/16/01
4:08 PM
Page 208
(Black plate)
Bernard et al.
Fungi have adapted to virtually all environments, but fungal growth is often enhanced at increased temperature and/or humidity. Climate change may lead to increases and changes in clinical behavior in fungal infections that penetrate into subcutaneous tissue, such as sporotrichosis (85). Debility due to persistent dermatophyte infection was a problem during the Vietnam War when troops spent time in tropical jungle conditions. In addition, increased aridity and eventual desertification from increasing temperatures may increase particulate-carried fungal spores, multiplying the potential for endemic and epidemic pulmonary and systemic fungal infection with species indigenous to North America. This is documented most extensively for coccidioidomycosis, which is spread by dust, often preceded by increased rain (86,87). A well-documented outbreak of coccidioidomycosis followed the 1994 Northridge, California, earthquake (88). Much dust was disseminated following that earthquake, and dust exposure increased the risk for coccidioidomycosis. Global warming and population growth in arid areas such as the U.S. Southwest are likely to increase the risk of such hazards.
Research Needs and Data Gaps Assessing air pollution-related health effects will require the information shown in Figure 4. Future emission inventories should take into account factors such as economic growth and vehicle miles traveled, air pollution control programs, and (for estimating cobenefits) greenhouse gas mitigation policies. These emission estimates can then be added to appropriate air quality models (e.g., Models3, Regional Acid Deposition Model, Urban Airshed Model). Frequently these models include weather variables, such as temperature and wind speed, that can be adjusted based upon future climate scenarios. The resulting air quality scenarios can then be combined with demographic and Future air pollution controls Greenhouse gas mitigation Economic growth Population growth Vehicle miles traveled Technology changes Emissions
dose–response information to estimate possible health effects. Consideration of climate change, air pollution, and health effects inevitably takes place in a framework of uncertainty. Despite decades of intensive investigation, gaps remain in our understanding of the health effects of the most common combustion-related pollutants: PM, O3, and the primary gases NOx and sulfur oxides. Our understanding of the complex mixtures found in urban environments is particularly limited. Nonetheless, there is clear evidence of adverse health effects of air pollution, even at levels now present in many cities in the United States. An intensive research agenda on PM should accelerate our understanding of this key pollutant. In the future, the pollutants of concern are likely to remain, as now, PM—both from its primary sources and from the secondarily formed particles—and photochemical pollution—O 3 . Emissions of sulfur oxides and NOx due to power generation might increase, but control technologies are available and can control such emissions. Both vehicles and stationary sources can emit toxic air pollutants such as butadiene. Whether such HAPs will change in the future is uncertain. Despite the many uncertainties and the evidence concerning air pollution and its health effects and the potential impact of climate change on air pollution levels, reasonable models could be developed to assess the potential impact of climate change on the adverse effects of air pollution on populations. We already have available a variety of models relating pollutant concentrations to population-level damages. Such models are available, for example, for fossil fuel-fired power plants. The U.S. EPA performs risk assessments as an element of standard setting for the NAAQS. These damage functions would need to be joined to scenarios of pollution concentrations under various climate change alternatives. An important intermediate step involves downscaling global circulation model results to the geographic scale needed by air quality models.
8. 9.
10.
11.
12.
13.
14.
15. 16. 17. 18.
19.
20.
21.
22. 23.
24. 25.
REFERENCES AND NOTES Future population • Demographic changes Dose response
Air quality models
1. 2.
Health effects 3.
Climate variables • Temperature • Precipitation • Wind speed • Cloud cover
Climate change scenarios
Figure 4. Assessing air pollution-related health effects of climate change.
208
7.
4. 5.
6.
Clean Air Act, 42 U.S.C.A. §§7401–7671q. Penner JE, Connell PS, Wuebbles DJ, Covey CC. Climate change and its interactions with air chemistry: perspective and research needs. In: The Potential Effects of Global Climate Change on the United States (Smith JB, Tirpak DA, eds). Washington, DC:U.S. EPA, Office of Policy, Planning and Evaluation, 1989. Robinson P. The effects of climate change. In: Global Climate Change Linkages: Acid Rain, Air Quality, and Stratospheric Ozone (White JC, Wagner W, Beale CN, eds). New York:Elsevier, 1989. U.S. EPA. National Air Pollutant Emission Trends Update: 1970–1996.Washington, DC:U.S. EPA, 1997. U.S. EPA. National Air Quality and Emissions Trends Report, 1997. Washington, DC:U.S. EPA, Office of Air Quality Planning and Standards, 1998. Ahlholm JU, Helander ML, Savolainen J. Genetic and environ-
VOLUME
26.
27.
28.
29.
30.
mental factors affecting the allergenicity of birch (Betula pubescens ssp. czerepanovii [Orl.] Hamet-ahti) pollen. Clin Exp Allergy 28:1384–1388 (1998). ATS. Health effects of outdoor air pollution. Part 1. Committee of the Environmental and Occupational Health Assembly of the American Thoracic Society. Am J Respir Crit Care Med 153:3–50 (1996). Clean Air Act, 42 U.S.C.A. §§7408–7409. ATS. Health effects of outdoor air pollution. Part 2. Committee of the Environmental and Occupational Health Assembly of the American Thoracic Society. Am J Respir Crit Care Med 153:477–498 (1996). Samet JM, Dominici F, Zeger SL, Schwartz J, Dockery DW. National Morbidity, Mortality, and Air Pollution Study. I: Methods and Methodologic Issues. Health Effects Institute Research Report 94, Part I. North Andover, MA: Flagship Press, 2000. Samet JM, Zeger SL, Dominici F, Curriero F, Coursac I, Dockery DW, Schwartz J, Zanobetti A. National Morbidity, Mortality, and Air Pollution Study. II: Morbidity, mortality, and air pollution in the United States. Health Effects Institute Research Report 94, Part II. North Andover, MA: Flagship Press, 2000, NRC. Research Priorities for Airborne Particulate Matter. I. Immediate Priorities and a Long-range Research Portfolio. Washington, DC:National Academy Press, 1998;195. U.S. EPA. Air Quality Criteria for Ozone and Related Photochemical Oxidants. Vol III. Washington, DC:U.S. EPA, Office of Research and Development, 1996. U.S. EPA. Air Quality Criteria for Particulate Matter. Vol III. Washington, DC:U.S. EPA, Office of Research and Development, 1996. Clean Air Act Amendments of 1970, Publ. L. 91–604 (31 December 1970). Clean Air Act Amendments of 1977, Publ. L. 95–95 (7 August 1977). Clean Air Act Amendments of 1990, Publ. L. 101–549 (15 November 1990). American Trucking Ass’ns, Inc. vs. Browner 175 F.3d 1027 (D.C. Cir. 1999), on reh. 195 F.3d 4 (1999), aff’d in part, rev’d in part, and remanded, Whitman v. American Trucking Ass’ns, Inc., Nos. 99–1257 and 99–1426, 69 U.S.L.W. 4136, 2001 U.S. LEXIS 1952 (2001). Lambert WE, Samet JM, Dockery DW. Community air pollution. In: Environmental and Occupational Medicine (Rom WN, ed). Philadelphia:Lippincott-Raven, 1998;1501–1522. Lynch JA, Bowersox VC, Grimm JW. Trends in precipitation chemistry in the United States, 1983–94: an analysis of the effects in 1995 of phase I of the Clean Air Act Amendments of 1990, Title IV, OF 96–0346. Reston, VA:U.S. Geological Survey, 1996;100. ATS. American Thoracic Society. What constitutes an adverse health effect of air pollution? Official statement of the American Thoracic Society. Am J Respir Crit Care Med 161:665–673 (2000). Holgate ST, Samet JM, Koren HS, Maynard RL. Air Pollution and Health. San Diego, CA:Academic Press, 1999. Romieu I. Epidemiological studies of the health effects arising from motor vehicle air pollution. In: Urban Traffic Pollution (Schwela D, Zali O, eds). London:World Health Organization, 1998;10–69. U.S. EPA. National Air Quality and Emissions Trends Report, 1995. Washington, DC:U.S. EPA, 1996. McDonnell WF, Horstman DH, Hazucha MJ, Seal E Jr, Haak ED, Salaam SA, House DE. Pulmonary effects of ozone exposure during exercise: dose-response characteristics. J Appl Physiol 54:1345–1352 (1983). Avol EL, Linn WS, Venet TG, Shamoo DA, Hackney JD. Comparative respiratory effects of ozone and ambient oxidant pollution exposure during heavy exercise. J Air Pollut Control Assoc 34:804–809 (1984). Folinsbee LJ, Bedi JF, Horvath SM. Pulmonary function changes after 1 h continuous heavy exercise in 0.21 ppm ozone. J Appl Physiol 57:984–988 (1984). Folinsbee LJ, McDonnell WF, Horstman DH. Pulmonary function and symptom responses after 6.6 hour exposure to 0.12 ppm ozone with moderate exercise. J Air Pollut Control Assoc 38:28–35 (1988). McDonnell WF, Chapman RS, Leigh MW, Strope GL, Collier AM. Respiratory responses of vigorously exercising children to 0.12 ppm ozone exposure. Am Rev Respir Dis 132:875–879 (1985). Avol EL, Linn WS, Shamoo DA, Spier CE, Valencia LM, Venet TG, Trim SC, Hackney JD. Short-term respiratory effects of photochemical oxidant exposure in exercising children. J Air Pollut Control Assoc 37:158–162 (1987).
109 | SUPPLEMENT 2 | May 2001 • Environmental Health Perspectives
109S2.Part 1
04/16/01
4:09 PM
Page 209
(Black plate)
Climate change and air pollution-related health effects 31. Thurston GD, Ito K. Epidemiological studies of ozone exposure effects. In: Air Pollution and Health (Holgate ST, Samet JM, Koren HS, Maynard RL, eds). London:Academic Press, 1999; 485–510. 32. Detels R, Tashkin DP, Sayre JW, Rokaw SN, Coulson AH, Massey FJ Jr, Wegman DH. The UCLA population studies of chronic obstructive respiratory disease. 9. Lung function changes associated with chronic exposure to photochemical oxidants—a cohort study among never-smokers. Chest 92:594–603 (1987). 33. Detels R, Tashkin DP, Sayre JW, Rokaw SN, Massey FJ Jr, Coulson AH, Wegman DH. The UCLA population studies of CORD. 10. A cohort study of changes in respiratory function associated with chronic exposure to SOx, NOx, and hydrocarbons. Am J Public Health 81:350–359 (1991). 34. Kunzli N, Tager IB. The semi-individual study in air pollution epidemiology: a valid design as compared to ecologic studies. Environ Health Perspect 105:1078–1083 (1997). 35. Peters JM, Avol E, Navidi W, London SJ, Gauderman WJ, Lurmann F, Linn WS, Margolis H, Rappaport E, Gong H, et al. A study of twelve Southern California communities with differing levels and types of air pollution. I: Prevalence of respiratory morbidity. Am J Respir Crit Care Med 159:760–767 (1999). 36. Peters JM, Avol E, Gauderman WJ, Linn WS, Navidi W, London SJ, Margolis H, Rappaport E, Vora H, Gong H Jr, et al. A study of twelve Southern California communities with differing levels and types of air pollution. II: Effects on pulmonary function. Am J Respir Crit Care Med 159:768–775 (1999). 37. Linn WS, Shamoo DA, Venet TG, Spier CE, Valencia LM, Anzar UT, Hackney JD. Response to ozone in volunteers with chronic obstructive pulmonary disease. Arch Environ Health 38:278–283 (1983). 38. Kehrl HR, Hazucha MJ, Solic JJ, Bromberg PA. Responses of subjects with chronic obstructive pulmonary disease after exposures to 0.3 ppm ozone. Am Rev Respir Dis 131:719–724 (1985). 39. Koenig JQ, Covert DS, Marshall SG, Van Belle G, Pierson WE. The effects of ozone and nitrogen dioxide on pulmonary function in healthy and in asthmatic adolescents. Am Rev Respir Dis 136:1152–1157 (1987). 40. Molfino NA, Wright SC, Katz I, Tarlo S, Silverman F, McClean PA, Szalai JP, Raizenne M, Slutsky AS, Zamel N. Effect of low concentrations of ozone on inhaled allergen responses in asthmatic subjects [see comments]. Lancet 338:199–203 (1991). 41. Pope CAI, Dockery DW. Epidemiology of particle effects. In: Air Pollution and Health (Holgate ST, Samet JM, Koren HL, Maynard RL, eds). London:Academic Press, 1999;673–706. 42. Dockery DW, Pope CA III. Acute respiratory effects of particulate air pollution. Annu Rev Public Health 15:107–132 (1994). 43. U.S. EPA. National ambient air quality standards for particulate matter. Fed Reg 62:138 (1997). 44. Dockery DW, Pope CAI, Xu X, Spengler JD, Ware JH, Fay ME, Ferris BGJ, Speizer FE. An association between air pollution and mortality in six U.S. cities. N Engl J Med 329:1753–1759 (1993). 45. Pope CA III, Thun MJ, Namboodiri MM, Dockery DW, Evans JS, Speizer FE, Heath CW Jr. Particulate air pollution as a predictor of mortality in a prospective study of U.S. adults. Am J Respir Crit Care Med 151:669–674 (1995). 46. McDonnell WF, Nishino-Ishikawa N, Petersen FF, Chen LH, Abbey DE. Relationships of mortality with the fine and coarse fractions of long-term ambient PM10 concentrations in nonsmokers. J Expo Anal Environ Epidemiol 10(5):427–436 (2000). 47. Burnett RT, Dales R, Krewski D, Vincent R, Dann T, Brook JR. Associations between ambient particulate sulfate and admissions to Ontario hospitals for cardiac and respiratory diseases. Am J Epidemiol 142:15–22 (1995). 48. Schwartz J. PM 10 , ozone, and hospital admissions for the
Environmental Health Perspectives
49.
50. 51.
52. 53.
54.
55.
56.
57.
58. 59.
60.
61.
62.
63. 64.
65. 66.
67.
68. 69.
elderly in Minneapolis–St. Paul, Minnesota. Arch Environ Health 49:366–374 (1994). Schwartz J. Air pollution and hospital admissions for the elderly in Detroit, Michigan. Am J Respir Crit Care Med 150:648–655 (1994). Schwartz J. Air pollution and hospital admissions for the elderly in Birmingham, Alabama. Am J Epidemiol 139:589–598 (1994). Seaton A, MacNee W, Donaldson K, Godden D. Particulate air pollution and acute health effects [see Comments]. Lancet 345:176–178 (1995). Lawther PJ, Waller RE, Henderson M. Air pollution and exacerbations of bronchitis. Thorax 25:525–539 (1970). Ostro BD, Rothschild S. Air pollution and acute respiratory morbidity: an observational study of multiple pollutants. Environ Res 50:238–247 (1989). Schwartz J, Dockery DW, Ware JH,Spengler JD, Sypij D, Koutrakis P, Speitzer FE, Ferris BG Jr. Acute effects of acid aerosols on respiratory symptoms reporting in children. In: 82nd Annual Meeting of the Air Pollution Control Association. Paper No. 89–92. Pittsburgh, PA:Air & Waste Management Association, 1989. Dockery DW, Speizer FE, Stram DO, Ware JH, Spengler JD, Ferris BG Jr. Effects of inhalable particles on respiratory health of children. Am Rev Respir Dis 139:587–594 (1989). Horvath SM, Dahms TE, O’Hanlon JF. Carbon monoxide and human vigilance. A deleterious effect of present urban concentrations. Arch Environ Health 23:343–347 (1971). Beard RR, Wertheim GA. Behavioral impairment associated with small doses of carbon monoxide. Am J Public Health Nations Health 57:2012–2022 (1967). McFarland RA. Low level exposure to carbon monoxide and driving performance. Arch Environ Health 27:355–359 (1973). Benignus VA, Otto DA, Prah JD, Benignus G. Lack of effects of carbon monoxide on human vigilance. Percept Mot Skills 45:1007–1014 (1977). Mustafa MG, Tierney DF. Biochemical and metabolic changes in the lung with oxygen, ozone, and nitrogen dioxide toxicity. Am Rev Respir Dis 118:1061–1090 (1978). Goldstein E, Goldstein F, Peek NF, Parks NJ. Absorption and transport of nitrogen oxides. In: Nitrogen Oxides and Their Effects on Health (Lee SD, ed). Ann Arbor, MI:Ann Arbor Science, 1980;143–160. Miller FJ, Overton JH, Myers ET, Graham JA. Pulmonary dosimetry of nitrogen dioxide in animals and man. In: Air Pollution by Nitrogen Oxides (Schneider T, Grant L, eds). New York:Elsevier, 1982. Lowry T, Schuman LM. “Silo-filler’s disease”—a syndrome caused by nitrogen dioxide. JAMA 162:153–160 (1956). Gardner DE. Oxidant-induced enhanced sensitivity to infection in animal models and their extrapolations to man. J Toxicol Environ Health 13:423–439 (1984). Morrow PE. Toxicological data on NOx : an overview. J Toxicol Environ Health 13:205–227 (1984). Goings SA, Kulle TJ, Bascom R, Sauder LR, Green DJ, Hebel JR, Clements ML. Effect of nitrogen dioxide exposure on susceptibility to influenza A virus infection in healthy adults. Am Rev Respir Dis 139:1075–1081 (1989). Spengler JD, Ryan PB, Schwab M, Billick IH, Colome SD, Becker E. An overview of the Los Angeles personal monitoring study. In: Proceedings of the International Conference on Total Exposure Assessment Methodology: A New Horizon, Pittsburgh, PA:Air & Waste Management Association, 1990;66–85. Harlos DP. Acute exposure to nitrogen dioxide during cooking or commuting. Boston MA:Harvard School of Public Health, 1988. U.S. EPA. Air Quality Criteria for Lead. Research Triangle Park, NC:U.S. EPA, Environmental Criteria and Assessment Office, 1986.
• VOLUME 109 | SUPPLEMENT 2 | May 2001
70. U.S. EPA. The Potential Effects of Global Climate Change on the United States, Report to Congress. Washington, DC:U.S. EPA, Office of Policy, Planning, and Evaluation, 1989. 71. NRC. Rethinking the Ozone Problem in Urban and Regional Air Pollution. Washington, DC:National Academy Press, 1991;524. 72. Morris RE, Gery MS, Liu MK, Moore GE, Daly C, Greenfield SM. Sensitivity of a regional oxidant model to variations in climate parameters. In: The Potential Effects of Global Climate Change on the United States (Smith JB, Tirpak DA, eds). Washington, DC:U.S. EPA, Office of Policy, Planning and Evaluation, 1989. 73. Morris RE, Whitten GZ, Greenfield SM. Preliminary assessment of the effects of global climate change on tropospheric ozone concentrations. In: Proceedings of the Specialty Conference: Tropospheric Ozone and the Environment II. Pittsburgh, PA:Air & Waste Management Association, 1991;5–30. 74. Morris RE, Guthrie PD, Knopes CA. Photochemical modeling analysis under global warming conditions. In: Proceedings of the 88th Air & Waste Management Association Annual Meeting and Exhibition, Paper No. 95–WP-74B.02. Pittsburgh, PA:Air & Waste Management Association, 1995. 75. Kamens RM, Jeffries HE, Sexton G, Gerhardt AA. Smog Chamber Experiments to Test Oxidant-related Control Strategy Issues. EPA-600/3-82-014. Research Triangle Park, NC:U.S. Environmental Protection Agency, 1982. 76. Gery MW, Edmond RD, Whitten GZ. Tropospheric Ultraviolet Radiation: Assessment of Existing Data and Effect on Ozone Formation. EPA/600/3-87/047. Research Triangle Park, NC:U.S. Environmental Protection Agency, 1987. 77. Samson PJ. Unpublished data. 78. Hatakeyama S, Izumi K, Fukuyama T, Akimoto H, Washida N. Reactions of OH with alpha-pinene and beta-pinene in air: estimate of global CO production from the atmospheric oxidation of terpenes. J Geophy Res 96:947–958 (1991). 79. Lamb BK, Westber HH, Quarles T, Flyckt DL. Natural Hydrocarbon Emission Rate Measurements from Selected Forest Sites. EPA-600/3-84-001. Research Triangle Park, NC:U.S. Environmental Protection Agency, 1984. 80. Martin HC. The linkages between climate change and acid rain. In: Global Climate Change Linkages: Acid Rain, Air Quality, and Stratospheric Ozone (White JC, Wagner W, Beale CN, eds). New York:Elsevier, 1989. 81. Hales J. Untitled. In: Sensitivity of Urban/Regional Chemistry to Climate Change: Report of the Workshop (Wuebbles DJ, Penner JE, eds). Livermore, CA:Lawrence Livermore National Laboratory, 1988. 82. Working Group on Public Health and Fossil-Fuel Combustion. Short-term improvements in public health from global-climate policies on fossil-fuel combustion: an interim report. Lancet 350:1341–1349 (1997). 83. Epton MJ, Martin IR, Graham P, Healy PE, Smith H, Balasubramaniam R, Harvey IC, Fountain DW, Hedley J, Town GI. Climate and aeroallergen levels in asthma: a 12 month prospective study. Thorax 52:528–534 (1997). 84. Emberlin J. The effects of patterns in climate and pollen abundance on allergy. Allergy 49:15–20 (1994). 85. Conti Diaz IA. Epidemiology of sporotrichosis in Latin America. Mycopathologia 108:113–116 (1989). 86. Kirkland TN, Fierer J. Coccidioidomycosis: a reemerging infectious disease. Emerg Infect Dis 2:192–199 (1996). 87. Durry E, Pappagianis D, Werner SB, Hutwagner L, Sun RK, Maurer M, McNeil MM, Pinner RW. Coccidioidomycosis in Tulare County, California, 1991: reemergence of an endemic disease. J Med Vet Mycol 35:321–326 (1997). 88. Schneider E, Hajjeh RA, Spiegel RA, Jibson RW, Harp EL, Marshall GA, Gunn RA, McNeil MM, Pinner RW, Baron RC, et al. A coccidioidomycosis outbreak following the Northridge, Calif, earthquake. JAMA 277:904–908 (1997).
209