microelectrodes in rats performing attention-based tasks ... Rat brain sections ..... from the 4th edition of the Paxinos-Watson Atlas (Paxinos and Watson, 1998).
C H A P T E R
19 Organization of the Basal Forebrain Cholinergic Projection System: Specific or Diffuse? Laszlo Zaborszky1, Alvaro Duque2, Matthew Gielow1, Peter Gombkoto1, Zoltan Nadasdy3, Jozsef Somogyi1 1Center
for Molecular and Behavioral Neuroscience, Rutgers, The State University of New Jersey, Newark, NJ, USA; of Neurobiology, Yale University School of Medicine, New Haven, CT, USA; 3Seton Brain & Spine Institute and Department of Psychology University of Texas at Austin, Austin, TX, USA
2Department
O U T L I N E Introduction
Dendritic Growth and Plasticity in Cholinergic Neurons
491
Afferents in the Basal Forebrain Show Regionally Restricted Localization Cholinergic Cell Groups Show Regionally Selective Dendritic Orientation Digitization of Cholinergic Dendrites Dendritic Orientation Acquired from Sections Cut in the Coronal Plane Dendritic Orientation Acquired from Sections Cut in the Horizontal Plane Comparison of Regional Dendritic Orientation between Horizontal and Coronal Planes Three-Dimensional Dendritic Representation of Electrophysiologically Identified Cholinergic Neurons
493 494 494 496 496 496
500 500 500 500
Gross Organization of Cholinergic BF Cells
501
Cholinergic Cell Clusters and Overlapping Pools of Projection Neurons
501
Concluding Remarks
504
Acknowledgments
504
References
504
498
INTRODUCTION The basal forebrain (BF) contains a diverse population of neurons, including cortically projecting cholinergic and non-cholinergic neurons as well as various interneurons (Zaborszky et al., 2012). In Alzheimer’s and related neurodegenerative diseases, there is a severe loss of cholinergic neurons (Zaborszky et al., 2008, 2012). Although the original description of the cholinergic system in the early 1980s acknowledged that the BF corticopetal system shows topographic organization (Saper, 1984), the highly variable shape and distribution of cholinergic
The Rat Nervous System, Fourth Edition http://dx.doi.org/10.1016/B978-0-12-374245-2.00019-X
General Factors of Dendritic Growth Reelin Physical Constraints
cells across the rostro-caudal extent of the BF (Fig. 1), the difficulty to stain the terminal distribution of cholinergic axons in the cortex, and physiological features shared with other ascending corticopetal modulatory systems, including noradrenergic, serotoninergic, and dopaminergic axons, have contributed to lumping the cholinergic BF projection system as part of the “diffuse cortical projection systems” (Saper, 1987). This “diffuse” concept was seemingly supported by measurements of cortical acetylcholine (ACh) release using in vivo microdialysis techniques, which did not indicate differences between cholinergic activities in different cortical regions during
491 © 2015 Elsevier Inc. All rights reserved.
492
19. ORGANIZATION OF THE BASAL FOREBRAIN CHOLINERGIC PROJECTION SYSTEM: SPECIFIC OR DIFFUSE?
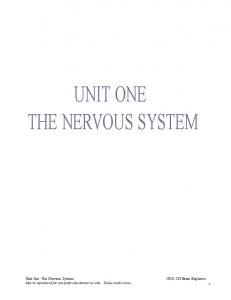
FIGURE 1 Distribution of cholinergic projection
(A)
(B)
(C)
(D)
(E)
neurons in the basal forebrain. Rat brain sections immunostained for choline acetyl transferase (sheep antiChAT) using fluorescent-tagged (Cy3-antisheep IgG) secondary antibodies were counterstained with Nissl after mapping cholinergic neurons (red dots). Images represent cholinergic neurons from 50 μm thick sections, 600 μm apart in a rostro-caudal order from upper left to lower right. Abbreviations: ac, anterior commissure; BLA, basolateral amygdaloid nucleus anterior part; EA, extension of the amygdala; EP, entopeduncular nucleus; GP, globus pallidus; HDB, horizontal limb of the diagonal band nucleus; ic, internal capsule; IPAC, interstitial nucleus of the posterior limb of the anterior commissure; LDB, lateral nucleus of the diagonal band; LOT, nucleus of the lateral olfactory tract; MS, medial septum; Pa, paraventricular hypothalamic nucleus; PLH, peduncular part of lateral hypothalamus; Rt, reticular thalamic nucleus; sm, stria medullaris; VP, ventral pallidum.
(F)
various behaviors (Sarter and Bruno, 1997). However, the microdialysis technique used to collect cortical ACh has poor temporal and spatial resolutions (Rasmusson, 2000). In contrast, recent studies using enzyme-selective microelectrodes in rats performing attention-based tasks demonstrated that cholinergic signals manifest at different timescales in various cortical areas to support specific cognitive operations. For example, selective cholinergic activation in the prefrontal cortex on the scale of seconds is associated with cue detection, while changes on the
scale of minutes may occur cortex-wide to support the more general arousal effect of ACh (Parikh et al., 2007). Measurements of the activity of choline acetyltransferase (ChAT), the enzyme that synthesizes ACh in the cortex of rodents and primates, indicate regional and laminar differences (Mesulam et al., 1986; Javoy-Agid et al., 1989) that have been confirmed using immunocytochemistry for ChAT and the vesicular acetylcholine transporter, VAChT (Lysakowski et al., 1989; Lewis, 1991; Mesulam et al., 1992; Avendaño et al., 1996; Schäfer et al., 1998; Mechawar et al., 2000; Descarries et al., 2004;
IV. DIENCEPHALON, BASAL GANGLIA, AMYGDALA, AND SEPTUM
AFFERENTS IN THE BASAL FOREBRAIN SHOW REGIONALLY RESTRICTED LOCALIZATION
Raghanti et al., 2008). Similarly, regional and laminar differences in the density of cholinergic axons are noted in the hippocampus of rodents (Aznavour et al., 2002). Cholinergic varicosities in the cortex are endowed with clearly identifiable symmetric or asymmetric synapses, although the percentage of varicosities with synapses is reported to range between 15–67% in different cortical areas and species (Umbriaco et al., 1994; Mrzljak et al., 1995; Smiley et al., 1997). Both pyramidal cells and GABAergic interneurons are targets of cholinergic innervation (Houser et al., 1985). Although cholinergic synapses can be seen in all cortical layers, there is a marked difference in the laminar distributions of cellular targets: cortical spines received cholinergic synapses most frequently in layer IV (23%) and least frequently in layers V–VI (3%). The proportion of GABA-positive postsynaptic elements is highest in layer IV (49%) and lowest in layers V–VI (14%) (Beaulie and Somogyi, 1991). Studies using juxtacellular labeling in combination with cortical EEG monitoring and post hoc immunocytochemistry supplemented with optogenetic stimulation of cholinergic axons in the neocortex have provided critical insight about the function of BF neuron types. Cholinergic neurons exhibit increased discharge during cortical activation (Duque et al., 2000; Lee et al., 2005; Kalmbach et al., 2012), whereas they almost cease firing during slow wave sleep. Thus, cholinergic cells can promote cortical activation, which underlies arousal, sensory processing and attention. The effect of ACh released through BF cholinergic axons in the cortex is complex due to: (1) the differential regional and laminar distribution of cholinergic axons; (2) different effects on various neuronal types and cellular sites of action (cell bodies, dendrites, axons); (3) ACh effects are mediated by synaptic and volume transmission at different time scales; and (4) ACh acts through a variety of muscarinic and nicotinic receptors (Levey et al., 1991; Mrzljak et al., 1996; Palomero-Gallagher and Zilles, 2004; Disney et al., 2007; Duffy et al., 2009; Parikh et al., 2010; Howe et al., 2010; Bell et al., 2011; Bennett et al., 2012) that are expressed differentially in pyramidal cells and in the various interneurons (Yamasaki et al., 2010). It seems that the complex effects of ACh fall in line with each specific neuronal cell type’s role in the information processing architecture of the cortex. In summary, ACh increases the amplitude and signal-to-noise ratio of evoked sensory responses, has a “filtering” role by amplifying relevant inputs while suppressing weak sensory inputs, and sharpens the tuning of specific cells in sensory cortex (Lawrence, 2008; Eggermann and Feldmeyer, 2009; Yamasaki et al., 2010; Bell et al., 2011; Ma and Luo, 2012). Moreover, ACh elicits different types of plasticity depending on the precise time of release in the target area (Gu and Yakel, 2011). Finally, cholinergic modulation contributes to the activity-dependent persistent firing of pyramidal neurons
493
in the prefrontal cortex, which has been proposed to be related to working memory (Dembrow et al., 2010). Our recent study, which used retrograde tracing of BF cholinergic and non-cholinergic neurons to various cortical areas that were compared in the same coordinate system, suggests not only that the BF corticopetal system has a remarkable inhomogeneous organization, but also that this organization is reflected in the corticocortical connections, so far unremarked upon and thus unexplained. Our studies suggest that the cholinergic and non-cholinergic projections to the neocortex are not diffuse, but instead, are organized into segregated and overlapping pools of neurons that may transmit information from specific locations in the BF to subsets of cortical areas that are themselves interconnected (Zaborszky et al., 2013). This specific efferent organization together with the regionally restricted distribution of various afferent axons, as reviewed earlier (Zaborszky et al., 2012) and briefly summarized here and the regionally selective dendritic orientation of cholinergic neurons, described in this chapter, constitute three architectural features that may enable the cholinergic system to participate in spatially and temporally selective actions that are necessary in sensory plasticity and attention. In this chapter, we detail our studies on the dendritic organization of the BF cholinergic neurons based upon single cell reconstructions and systematic analysis of dendritic arborizations of populations of cholinergic neurons acquired in coronal and horizontal planes.
AFFERENTS IN THE BASAL FOREBRAIN SHOW REGIONALLY RESTRICTED LOCALIZATION Using a double strategy of recording the location of putative contact sites between identified axons and cholinergic profiles, as well as identifying the presence of synapses in representative cases under the electron microscope, we get a fairly good idea about the extent of potential transmitter interactions in the BF (for references, see Zaborszky et al., 2012). Although noradrenergic and dopaminergic axons contact cholinergic neurons in extensive portions of the BF, most of the forebrain afferents (cortical, amygdaloid, striatal) and several peptide-containing axons appear to have a preferential distribution across cytoarchitectonically defined BF regions; thus a specific input can contact only a subset of neurons. For example, enkephalincontaining fibers are very rich in the ventral pallidum (VP), globus pallidus (GP), extension of the amygdala (EA) and peripallidal regions, but they are practically absent in the medial septum-vertical diagonal band (MS/VDB) and horizontal diagonal band (HDB) areas. β-endorphin, α-melanocyte-stimulating hormone
IV. DIENCEPHALON, BASAL GANGLIA, AMYGDALA, AND SEPTUM
494
19. ORGANIZATION OF THE BASAL FOREBRAIN CHOLINERGIC PROJECTION SYSTEM: SPECIFIC OR DIFFUSE?
(MSH), calcitonin-gene-related-peptide (CGRP) and corticotropin-releasing hormone fibers distribute in the EA and caudal peripallidal areas but are absent in other BF regions (for a more detailed description, see Zaborszky, 1989). In many cases examined, labeled terminal varicosities detected in the BF were related to both cholinergic and non-cholinergic postsynaptic elements. In fact, the detectability of synapses on cholinergic neurons was usually proportional to the density of terminals present in a given area. Thus, at first approximation, the probability of synapses between cholinergic neurons and various afferents may depend on the geometry of the dendritic arbor and axonal ramifications. For example, cholinergic dendrites and CGRP-containing axons in the internal capsule have the same prevailing orientation (see Figure 8 in Zaborszky et al., 2002), and indeed, electron microscopic studies confirmed abundant presence of CGRP in axon terminals synapsing with cholinergic neurons in this region (Csillik et al., 1998). On the other hand, knowing that prefrontal axons terminate exclusively on non-cholinergic neurons, despite many of these axons arborizing in the vicinity of cholinergic neurons (Zaborszky et al., 1997), a detailed EM study is required in each BF region. Unfortunately, no data are available on the gross orientation of various axons in the BF; nevertheless, it is tempting to speculate that the regionally selective cholinergic dendritic orientation (see below), if aligned with a similar orientation of specific afferents, may result in cholinergic cells in each BF subdivision receiving a unique combination of inputs. Based on electron microscopic studies, BF cholinergic neurons receive ascending brainstem input from adrenaline containing neurons of the medulla (Hajszán and Zaborszky, 2002), from the locus coeruleus (Zaborszky et al., 1993), and from the dopaminergic substantia nigra/ventral tegmental area (Zaborszky and Cullinan, 1996; Gaykema and Zaborszky, 1996). Forebrain afferents synapsing with BF cholinergic neurons originate in various hypothalamic nuclei (Zaborszky and Cullinan, 1989; Cullinan and Zaborszky, 1991; Wu et al., 2004), the nucleus accumbens (Zaborszky and Cullinan, 1992) and the amygdala (Zaborszky et al., 1984; Paré and Smith, 1994; Jolkkonen et al., 2002). In the rat, cortical inputs to the BF originate only in restricted portions of the cortex, including the medial, lateral (sulcal) and orbitofrontal parts of the prefrontal cortex, with a small contribution from the insular-piriform cortex. Interestingly, prefrontal axons have only been found to synapse with noncholinergic neurons, including parvalbumin-containing cells in the ventral pallidum (Zaborszky et al., 1997). Glutamatergic synapses onto cholinergic neurons have been recently described, visualizing both VGLUT-1 and VGLUT-2 transporters presynaptically (Hur et al., 2009). Additionally, GABA (Zaborszky et al., 1986), substance P (Bolam et al., 1986), enkephalin (Chang et al., 1987;
Martinez-Murillo et al., 1988), somatostatin (SS) and NPY synapses (Zaborszky and Duque, 2000) onto BF cholinergic neurons have been described. Cholinergic neurons in the septum receive and are excited by orexin/hypocretin terminals (Khateb et al., 1995; Eggermann et al., 2001; Wu et al., 2004). In the BF, synapses onto cholinergic neurons show cellular topography (see Figure 14 in Zaborszky et al., 1991), in the sense that GABAergic, glutamatergic, SS and NPY boutons are distributed around the cell body and proximal dendrites, while amygdaloid, hypothalamic and noradrenergic axons synapse with more distal dendrites. However, no study has investigated the convergence of two or more types of afferents, and the density of synapses on cholinergic neurons shows regional changes (Zaborszky, 1992). According to one of our studies (Hur et al., 2009), about 50% of the total synaptic input to BF cholinergic neurons in the ventral part of GP and EA area is glutamatergic, but other studies estimated that in the VP GABAergic synapses accounted for 86%, in the GP 72% and in the EA areas 65% of all synapses (Chang et al., 1995; Ingham et al., 1988).
CHOLINERGIC CELL GROUPS SHOW REGIONALLY SELECTIVE DENDRITIC ORIENTATION The dendrites of adjacent cholinergic neurons in the BF often constitute overlapping fields; according to our estimation one cholinergic cell dendritic domain might share its space with 50-80 other cholinergic neurons (Zaborszky et al., 2002). As such, the dendritic organization of the cholinergic BF neurons resembles that of the isodendritic type of neurons of the reticular formation (Valverde, 1961; Leontovich and Zhukova, 1963; Ramón-Moliner and Nauta, 1966). Although a particular orientation of cholinergic dendrites is noticeable upon inspection of areas where the density of dendrites is low, it is not possible to appreciate dendritic orientation with certainty in regions where the cell density is high, as can be judged from Fig. 2. Our systematic study, however, suggests that cholinergic dendrites possess regionally selective orientation.
Digitization of Cholinergic Dendrites The reconstruction and statistical analyses presented in this chapter were prepared from adult male Sprague-Dawley rats. Anesthetics, surgical procedures, juxtacellular recordings, labeling of single cholinergic neurons, bulk immunostaining for cholinergic neurons and processing of the rat tissue have been described earlier (Zaborszky et al., 2002; Duque et al., 2000, 2007). Experimental procedures for in vitro patch clamping and
IV. DIENCEPHALON, BASAL GANGLIA, AMYGDALA, AND SEPTUM
CHOLINERGIC CELL GROUPS SHOW REGIONALLY SELECTIVE DENDRITIC ORIENTATION
495
FIGURE 2 Dendritic orientation of cholinergic neurons acquired from coronal sections. (A) Low magnification maps of rostro-caudal series of coronal sections (six out of seven mapped 50 μm sections, immunostained for ChAT using DAB as chromogen and embedded into plastic). From the coronally cut brain in seven representative sections, all the labeled cell bodies (n=1300) and their initial dendrites were traced in the outlined areas, including the medial septum-vertical limb of the diagonal band (MS/VDB), horizontal limb of the diagonal band (HDB), lateral nucleus of the diagonal band (LDB), ventral pallidum (VP), globus pallidus (GP), extension of the amygdala (EA), and internal capsule (ic). (B) Coronal view of all traced dendrites; various colors represent dendrites in cytoarchitectonically defined regions: red: medial septum; dark blue: vertical limb of the diagonal band; green: horizontal limb of the diagonal band; orange: ventral pallidum (mostly covered by the more numerous green HDB dendritic profiles); purple: EA; light blue: internal capsule; black: globus pallidus. Scale: 0.5 mm. (C) Polar histogram of the distribution of lengths of dendritic segments of cholinergic neurons selected in 3-dimensional space defined by the vertical (left) and the horizontal box (right). Note the highly oriented dendritic field in the medial septum and the less oriented dendritic field in the volume representing the HDB and part of the VP. Numbers represent the radius (length of dendritic segments) of the respective polar histograms. Numbers (0, 180, 270) around the perimeter of the left histogram denote angular values.
biocytin labeling of cholinergic neurons in ChAT-eGFP mice were described in Unal et al. (2012). Neurons in the Neurolucida® (MBF Bioscience) database are represented by the X, Y and Z coordinates of the cell bodies. Based on the branching points, first, second, third and higher order dendritic segments were identified as stemming from a parent node. The hierarchical encoding system introduced by Neurolucida® allowed us to recursively represent the complexity of any dendritic tree in the database. Curvilinear dendrites were represented in the computer as a series of short straight lines giving a close fit to the original shape and length. For visual inspection of the statistical features of traced dendritic trees, we used polar histograms provided in the Neurolucida® software package. Polar histograms depict the angular distribution of dendritic fragments projected onto the plane of section over a range of angles. In essence, using only the X and Y coordinates of the traced dendritic segments, where individual segments
were composed of interconnected points, the algorithm pools together all the segments relative to the point of origin weighted by their length. The angle of the dendritic ray is drawn from the beginning of the branch to its node or ending projected into the XY plane, called the XY angle, starting along the X axis and moving counter clockwise. Using a right handed coordinate system, values in the first quadrant range from 0° to 90°. The value of the XY angle can extend from 0 to 360°. The complete 360° is divided into equal bins and the program calculates the sum of segments in each bin. The radial length of a filled bin is proportional to the total length of the dendritic branches of that specific orientation, thus the contributions of segment lengths and segment counts of that specific orientation are inseparable. In other words, a few long segments can add up to the length of many short dendrites. Depending on the choice of binning interval, the angle discrimination can be finer or broader. Our data was binned at 10° intervals (36 bins).
IV. DIENCEPHALON, BASAL GANGLIA, AMYGDALA, AND SEPTUM
496
19. ORGANIZATION OF THE BASAL FOREBRAIN CHOLINERGIC PROJECTION SYSTEM: SPECIFIC OR DIFFUSE?
The advantage of the polar histogram for viewing dendritic orientation is that it permits a quick and intuitive visualization of the overall dendritic tree orientation in the plane of the cut section.
Dendritic Orientation Acquired from Sections Cut in the Coronal Plane Figure 2A displays 6 out of 7 sections from a brain cut in the frontal plane with the reconstructed dendrites. Panel B shows all reconstructed dendrites of 1300 cholinergic neurons at higher magnification projected in the plane of the section. Dendrites in individual cytoarchitectonic compartments are differently colored. The left polar histogram in panel C shows dendritic orientation in the septal area and the right polar histogram illustrates dendritic orientation in a 3-dimensional space that encompasses cells in the horizontal limb of the diagonal band and the ventral pallidum. The difference in scales is due to the difference in the total dendritic length between these two selected spaces. Within the septum there is a pronounced orientation along the vertical axis, with slightly more dendrites oriented dorsally than ventrally (Fig. 2C left polar histogram). As compared to septal dendrites, in the HDB-VP space, the histogram suggests that dendrites are oriented in all directions, although their length is slightly larger medially than laterally (Fig. 2C, right histogram).
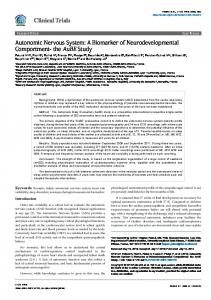
Dendritic Orientation Acquired from Sections Cut in the Horizontal Plane Figure 3 displays 7 out of 34 sections from a brain cut horizontally, showing cholinergic cells within their anatomical borders. Panel A in Fig. 4 shows all traced dendrites projected in a dorsal view; multiple outlines of the external capsule, anterior commissure and the third ventricle emphasize that this image contains the projected dendritic tracing from all sections. In panel B, four polar histograms indicate different orientations of dendrites in four arbitrarily chosen 3-dimensional regions. In box #1, containing cells from the medial septum/vertical limb of the diagonal band and the medial portion of the HDB, the dominant orientation is in the sagittal (YZ) plane. Similarly, there is a strong sagittal orientation of dendrites in the area labeled #2 that largely corresponds to the rostro-ventral extension of the VP. In area #3, which nearly encompasses the HDB, the dendrites show an oblique, medio-lateral orientation. Finally, in area #4, which includes the peripallidal region and the internal capsule, dendrites show oblique medio-lateral orientation, but the orientation here is more pronounced with longer dendrites coursing in the caudal direction.
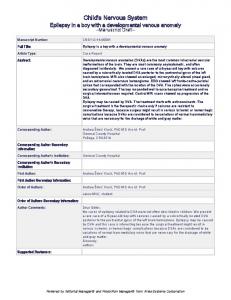
Comparison of Regional Dendritic Orientation between Horizontal and Coronal Planes Figure 5 summarizes the data from two brains, cut in horizontal and coronal planes, respectively. Dendrites in each cytoarchitectonically defined region show a characteristic polar histogram “fingerprint,” although the actual angles of orientation are relative values defined by the section plane and the registration in the Neurolucida® program. In the horizontal plane dendrites in the MS/VDB, show a larger maximum around 170–200 and a smaller maximum around 310–330°. In the HDB, dendritic segments distribute in all directions in both coronal and horizontal planes. Dendrites in the VP, globus pallidus, extension of the amygdala, and in internal capsule (IC) acquired from horizontal sections show preponderant orientation with maxima at 110–130 and around 290/300°. To confirm our visual observation of the non-uniform orientation of dendrites, we tested the null-hypothesis (H0) that the dendritic angle distributions are dispersed uniformly as opposed to the alternative hypothesis (Ha) that they are non-uniform. First, we analyzed the XY angle distribution that is reflected in the polar histogram, then the Z angle, which is a ray drawn from the beginning of the branch to its node or ending and the XY plane. This value can extend from −90 to +90°. A positive value indicates that the ray lies above the XY plane (in positive Z space) relative to its starting point. We applied Rao’s spacing test (Rao, 1969), which is more powerful than the popular Rayleigh test and Kuiper’s V test, particularly when the underlying distribution is multimodal (Kotz and Read, 1997). Using the dataset from the brain cut horizontally, Rao’s test using the XY angle values rejected the H0 in case of GP (p=0.001), EA (0.05) and VP (p=0.05), but not for dendrites in the internal capsule. Using the Z angles, except in HDB, all structures had p values of 0.001. In the case of the coronally cut brain only in EA was the H0 rejected using the XY angles. Using the Z angle, the GP, VP, EA and internal capsule data all showed significant deviations from the H0 (p= 0.001). Thus, statistical considerations suggest that dendrites in most BF structures display unimodal rather than uniform distributions. Moreover, for cases in which the null hypothesis was rejected, pairwise comparison of the means indicated statistically significant differences, suggesting that the two respective samples were drawn from different angular distributions. Despite its advantages, the polar histogram has a few pitfalls, mostly arising from the methodology itself. Since dendrites are disassembled into segments, the lengths and angles of those segments are preserved regardless of their real positional relationship to the dendritic tree. Second, there is an inherent foreshortening depth effect when the 3-dimensional segments are projected onto a 2-dimensional plane (see also Glaser et al.,
IV. DIENCEPHALON, BASAL GANGLIA, AMYGDALA, AND SEPTUM
497
CHOLINERGIC CELL GROUPS SHOW REGIONALLY SELECTIVE DENDRITIC ORIENTATION
VP
-8.60 mm
-6.80 mm
lo
LDB
aca MS
3V
HDB ot
f
CPu
ec
ec
ac Bst
GP VP LV
af
sm f 3V
ic
st ot
lo Hi
-8.30 mm
rf HDB
LDB
ec
3V
ot LV
ec
-6.10 mm lo
af
Bst sm f 3V
GP
VDB
VP
MS
LV
CPu
ic LV
-8.00 mm
ec
EA ot
LV
3V
rf
st ot
f
Hi
LV MS
CPu Hi lo
LV
sm ot st ic
3V
ic VP
ec
-7.40 mm
st
MS/VDB acp
Ce
f
ec
aca
EA
-5.10 mm
st
LV
fr
3V Hi
Hi fr
IC
2 mm
FIGURE 3 Low magnification view of 7 sections out of the stack of 34 (100 μm thick) horizontal sections immunostained for ChAT and embedded into plastic. Small red dots represent all cholinergic cell bodies, larger black filled circles neurons selected for dendritic reconstructions. Colors of structure contours are the same as used in the coronal series of Fig. 2. Numbers in the lower left corner of each section represent the dorsoventral horizontal coordinates from the 4th edition of the Paxinos-Watson Atlas (Paxinos and Watson, 1998). From the horizontal dataset, about 5% of cholinergic neurons were selected for dendritic reconstruction based on a random sampling of the total population. In order to achieve a sampling that reflects both the global shape of the entire cholinergic projection system and the local cluster-like organization, we used two, 3-dimensional grid systems (500 × 500 × 100 μm and 100 × 100 × 100 μm) for sampling. Then, the two samples were superimposed. The number of cells selected from each voxel was proportional to the logarithm of the total number of cells found within the voxel. Thus, using the 500 μm grid size we sampled cells, which reflected the main organization of the cells on a 500 μm scale. Likewise, the 100 μm sample size was applied to sample local densities at a 100 μm scale. As a result, the superimposed samples at the two scales provided a sample that reflected the global and local distribution of the cells. A custom written C++ program performed the partitioning, cell counting and selection of target cells for dendritic tracing. With this sampling scheme we marked 750 cells from the horizontal dataset (n = 15,776).The generated data file with selected cells, was inserted into the original Neurolucida® datafile for subsequent dendritic tracing. Abbreviations: 3V, third ventricle; ac, anterior commissure; aca, acp, anterior commissure anterior, posterior parts; af, amygdaloid fissure; Bst, bed nucleus of the stria terminalis; Ce, central amygdaloid nucleus; CPu, caudate-putamen; ec, external capsule; f, fornix; fr, fasciculus retroflexus; IC, inferior colliculus; GP, globus pallidus; Hi, hippocampus; lo, lateral olfactory tract; LV, lateral ventricle; ot, optic tract; rf, rhinal sulcus; st, stria terminalis. Additional abbreviations: see Figs. 1 and 2.
1979; McMullen et al., 1984; Cetas et al., 2003). Another problem pertains to the fact that dendrites are truncated perpendicular to the plane of sections, that is 50 μm from the coronal and 100 μm in the horizontal reconstructions, therefore the polar histogram may reflect
dendritic orientation only for dendrites that are distributed roughly in this narrow co-planar space. Analyzing fully reconstructed single cholinergic neurons (below) suggests that the first three dendritic orders contribute about 27% of the total dendritic length, while including
IV. DIENCEPHALON, BASAL GANGLIA, AMYGDALA, AND SEPTUM
498
19. ORGANIZATION OF THE BASAL FOREBRAIN CHOLINERGIC PROJECTION SYSTEM: SPECIFIC OR DIFFUSE?
FIGURE 4 Dendritic orientation of cholinergic neurons acquired from horizontal sections. (A) Low magnification view of all traced dendrites from the brain sectioned in the horizontal plane. For orientation, contours of the third ventricle (3V), outlines of the anterior commissure (ac, aca, acp) and the external capsule (ec) are indicated. In the background of the dendrites, small red dots represent all the plotted cholinergic cell bodies. (B) Dendritic orientation in four, arbitrary defined 3-dimensional volume labeled by numbered black boxes. The left part of this panel is the same view as in (A) without structure contours; filled black symbols represent selected neurons for dendritic reconstruction, small red dots: all cholinergic cell bodies. Box #1: largely representing the medial septum, VDB and medial portion of the HDB. The corresponding polar histogram is further right labeled with ×1. The large box marked #2 with a few scattered cells represents the extension of the ventral pallidum just above the olfactory tubercle. Box #3 largely represents the horizontal limb of the diagonal band and box #4 the internal capsule. Note the various orientations of the different polar histograms. The number under each histogram represents the radius of the histogram. The various sizes of the histograms are defined by the largest total lengths of the dendritic segments in each histogram. Abbreviations: aca, anterior commissure, pars anterior; ac, crossing fibers of the anterior commissure; acp, anterior commissure, pars posterior; ec, external capsule; 3V, third ventricle.
(A)
(B)
the first four order dendritic trees would contribute to 72% of the total dendritic trees. Although our reconstructions have up to seven dendritic orders, our data are skewed towards the first three dendritic orders and we do not know to what extent the direction of population dendritic growth would change if the distal dendrites were included in this analysis.
Three-Dimensional Dendritic Representation of Electrophysiologically Identified Cholinergic Neurons Our limited sample of single cholinergic cell reconstructions seems to be in general agreement with what
our findings are at the population level. Panels A–C in Fig. 6 show three juxtacellular filled cholinergic neurons with their dendritic distributions as rendered within a 3-dimensional box containing all dendritic branches. The relatively straight primary dendrites bifurcate in an iterative fashion, and the sum of the lengths of the daughter branches is usually larger than that of the mother branch (see Duque et al., 2007). The total length of the dendrites of individual cholinergic neurons in rats is about 4 mm, arborizing in a box of about 0.1 mm3 but filling only a fraction of its spatial domain. Cell 004R, which is located at the EA/GP/ IC border, fits into the largest box (0.167 mm3), and cell 062R, located in the EA, fits into a box of 0.073
IV. DIENCEPHALON, BASAL GANGLIA, AMYGDALA, AND SEPTUM
499
CHOLINERGIC CELL GROUPS SHOW REGIONALLY SELECTIVE DENDRITIC ORIENTATION
MSVDB
HDB
VP
EA
IC
horizontal
coronal
GP
FIGURE 5 Summary of dendritic segment analysis within each cytoarchitectonic area using brains cut in coronal and horizontal planes. The number of cells represented in this analysis follows their acronyms in parenthesis (first number from coronal, second number from horizontal series): MSVDB (278/111); HDB (563/396); VP (59/46); GP (111/29); EA (156/77); IC (137/56). A detailed dataset of the analysis is available upon request. Note the systematic change of major dendritic orientation in cytoarchitectonic volumes in the coronal and horizontal planes. Please note, when comparing Fig. 4 with Fig. 5: the polar histograms in Fig. 4 should be rotated 90° counterclockwise relative to those in Fig. 5 due to the special composition of Fig. 4.
(A)
(C)
(B)
ic
ic
ic
GP
GP CPu
GP
f
f f
-1.30 mm
EA
-0.92 mm
-1.88 mm
062R
116R
2 mm
004R
445 375
dorsal
med
ial
al
Coronal
150
Horizontal
caud
200
54
0
850
23 5
435
730 340 μm
835
200
500
FIGURE 6 Individual 3-dimensional reconstructed cholinergic neurons labeled with the juxtacellular method. (A) Cholinergic neuron 062R is located in the extension of the amygdala region (EA). (B) Cholinergic neuron 116R is located in the horizontal limb of the diagonal band. (C) Cholinergic neuron 004R is located at the border of internal capsule/globus pallidus/EA. Small numbers with negative values: distance behind bregma. In each case, the dendritic field is contained within the boundaries of the black box. The second row displays the projected images of the entire dendritic (black) and partial axonal (red) arbors of the individual cells; in each case within a box of dimensions representative of the dendritic expansion into the different coronal, sagittal and horizontal planes. For each case, these corresponding dimensions are indicated in microns. The third row displays the polar histograms in coronal and the last row in horizontal plane. Note that neurons 062R and 116R possess dendrites distributed in all directions in the coronal plane; neuron 116R and 004R are strongly oriented in the horizontal plane. Morphometric data of these neurons were published in Duque et al. (2007). Numbers at each histograms: radius of polar histrogram.
200
600
IV. DIENCEPHALON, BASAL GANGLIA, AMYGDALA, AND SEPTUM
500
19. ORGANIZATION OF THE BASAL FOREBRAIN CHOLINERGIC PROJECTION SYSTEM: SPECIFIC OR DIFFUSE?
mm3. Cell 116R, which is located in the HDB, fits into a medium-sized box (0.134 mm3). As the polar histograms suggest, the dendrites of cells 062R and 116R are less oriented in the coronal plane than those of 004R, and cell 116R is strongly oriented in both the horizontal and sagittal (not shown) planes. By rotating the individual cells and measuring their trees in the three cardinal planes confirms that dendrites of cell 062R stretch the longest in the sagittal plane (375 μm), although its dendritic tree directed towards the ventral surface of the brain has only a length of 270 μm in the sagittal plane. Similarly, the various individual trees of cell 116R fit into a smaller box of 100–225 μm along the YZ (sagittal) plane. Finally, cell 004R, despite having a large surface projection in the coronal plane, has some individual trees with sagittal depths of only 70–90 μm; hence this neuron has the narrowest slab in the sagittal plane. Whole cell recording from BF cholinergic neurons in transgenic mice expressing enhanced green fluorescent protein (eGFP) under the control of the ChAT promoter showed two electrophysiologically identifiable subtypes: early and late firing (LF) neurons (Unal et al., 2012). Early firing (EF) neurons (∼70%) are more excitable, show prominent spike frequency adaptation and are more susceptible to depolarization blockade, a phenomenon characterized by complete silencing of the neuron following initial action potentials. LF neurons (∼30%), despite being less excitable, could maintain a tonic discharge at low frequencies. A preliminary analysis of the morphological characteristics of these neurons shows that LF neurons have longer primary dendrites, and their first order dendrites show higher tortuosity. These two functionally distinct cell populations also show statistical differences in the number of intersections using the Sholl analysis (Nagy, Unal, Zaborszky, unpublished observations). These two cholinergic cell populations might be involved in distinct functions: the EF group being more suitable for phasic changes in cortical ACh release associated with attention while the late firing neurons could support general arousal by maintaining tonic ACh levels. Interestingly, the in vivo recorded cholinergic neuron 062R with its short first order dendritic branches (mean 17 μm) seems to fit morphologically with EF neurons, while cholinergic neurons 116R and 004R with their much longer first order dendritic branches (mean 120 μm) resemble LF neurons. It would be interesting to find out if differences in the dendritic length between EF and LF neurons can be confirmed also in vivo, since differences in the primary dendritic length should have consequences for dendritic information processing and global output (Duque and Zaborszky, 2006; Shepherd, 2008).
Dendritic Growth and Plasticity in Cholinergic Neurons General Factors of Dendritic Growth Dendritic patterning ultimately depends on factors controlling the activity and polymerization of the actin and microtubule cytoskeleton (Georges et al., 2008). Among these factors are various intracellular proteins, including microtubule associated proteins (MAPs), APC (adenomatosus polyposis coli protein), EB (plusend-binding), Shortstop, Abelson family of non-receptor tyrosine kinases, neurabin, doublecortin, Guanine nucleotide-binding proteins (Rho-GTPase family of proteins), cell cycle proteins (Cdc42), postsynaptic density proteins, and molecular motors. Also, there is an impressive list of extracellular signal/matrix proteins, including laminin, Tiam1, NGF, BDNF, NT3, reelin, agrin, that affect dendritic patterning (Georges et al., 2008). Because discussion of so many factors involved in dendritic growth, polarization, and patterning is beyond the scope of this chapter, we only elaborate briefly on reelin, which is involved in many developmental processes and has been detected in the developing forebrain. Reelin The reelin gene encodes an extracellular protein that is crucial for migration, positioning and directed dendritic growth of neurons in laminated brain structures, including the neocortex, hippocampus, cerebellum and spinal cord (O’Dell et al., 2012). Reelin is known to exert its function by binding to and activating its very lowdensity lipoprotein receptors and ApoER2 on the surface of nerve cells. Reelin expression was detected at embryonic day 10 in the septum anlage and in the prospective MS/VDB complex; however, it is unclear if reelin has a role in cell migration, cell positioning and dendritic development of BF cholinergic neurons (Alcántara et al., 1998). Physical Constraints It is unclear to what extent physical constraints, created by various forebrain fiber systems, influence the final positioning and dendritic arborization pattern of the cholinergic cell bodies. The dendritic arbor of the principal neurons (CA1 and CA3 pyramidal neurons and dentate granular cells) in the hippocampal compartments, with roughly similar volume as the cholinergic space (the volume containing the cell bodies of cortically projecting cholinergic neurons), is characterized by a remarkable intrinsic homeostatic control. For instance, fluctuations in dendritic size in one given portion of a neuron in the hippocampus are systematically counterbalanced by the remaining dendrites in the same cell (Samsonovich and Ascoli, 2006). If cholinergic projection neurons destined
IV. DIENCEPHALON, BASAL GANGLIA, AMYGDALA, AND SEPTUM
CHOLINERGIC CELL CLUSTERS AND OVERLAPPING POOLS OF PROJECTION NEURONS
to different cortical areas originate from different parts of the telencephalic anlage (Zaborszky et al., 2012) and our studies about selective regional dendritic orientation can be confirmed, one would expect that cell positioning and dendrite outgrowth in prospective cholinergic neurons are controlled by different factors along the rostrocaudal and transverse axes of the cholinergic space. DENDRITIC PLASTICITY IN CHOLINERGIC BF NEURONS
Mechanisms by which healthy neurons may respond dynamically to changes in their afferents have not been investigated in detail in BF cholinergic cells. However, removal of catecholaminergic afferents resulted in a significant decrease in ChAT activity in forebrain areas rich in cholinergic cell bodies (Zaborszky et al., 1993), and gross changes in not only cell density but also dendritic segmentation and length in MS/VDB and nucleus basalis neurons are known to accompany Alzheimer’s disease (Arendt et al., 1995). In vivo estradiol increases ChAT expression in a subregionally dependent and sexually dimorphic manner (Luine, 1985), and estrogen applied to newborn BF ChAT cell cultures encourages neurite outgrowth in female cells but not male cells, with the female effects blocked by extracellular signal-related kinase inhibitors (Dominguez et al., 2004). Furthermore, chronic administration of thyroid hormones during development produces filopodia-like protuberances from cell bodies and proximal processes from BF neurons similar to those seen in Alzheimer’s disease (Gould and Butcher, 1989; Woolf, 1991; Butcher and Woolf, 2004). These studies used the Golgi method, which non-specifically labels all types of neurons. Our population (this chapter) and single cell dendritic analysis (Duque et al., 2007) using specific markers for cholinergic neurons is the first attempt to systematically compare dendritic parameters across the entire BF against which alterations can be measured in pathological conditions.
GROSS ORGANIZATION OF CHOLINERGIC BF CELLS Cholinergic cell bodies in the septal region can be divided into rostromedial and caudolateral cell groups and an analysis, using horizontal sections, of the directional distribution of dendritic growth shows that these two cell groups possess different main orientations at various dorso-ventral levels (Fig. 7). A twisted connectional pattern in the ascending hypothalamic fibers approaching cholinergic cells in the septum was already illustrated and described in 1991 (see Figure 21 in Cullinan and Zaborszky, 1991) and a twisted arrangement of cortically projecting non-cholinergic neurons
501
was suggested based upon 3-dimensional computation models (Zaborszky, 2002). In addition, a combined rendering of voxels where the three calcium-binding protein containing neurons (calbindin, calretinin and parvalbumin) overlap with cholinergic neurons at a given threshold density clearly indicated that the largescale relationship among the four cell populations arises from a twisted banded pattern of specific cell types along the entire BF (Zaborszky, 2002; Zaborszky et al., 2005). In spite of these incident observations, no published developmental studies investigating migration or gene expression patterns in the forebrain can account for the observed cellular and connectional arrangements. If it could be independently confirmed that the cholinergic space consists of several cellular bands, then the multidirectional orientation of dendrites in the HDB as seen in the polar histogram might be explained by simply lumping together two bands of cells with opposite dendritic directionality.
CHOLINERGIC CELL CLUSTERS AND OVERLAPPING POOLS OF PROJECTION NEURONS Cholinergic neurons in the BF show inhomogeneous distribution, where dense clusters of neurons are interrupted by regions of low cellular density in humans (Halliday et al., 1993; Zaborszky et al., 2008) as well as in rodents and monkeys (Zaborszky et al., 1999). Although cell aggregates in the cholinergic forebrain has been recognized for more than 30 years (see Butcher, 1992), only by adopting and developing new visualization and analytical tools has it become possible for the first time to quantitatively characterize these cell clusters so that specific questions can be raised relating to the organizational principles of the BF cholinergic system. Using a novel “bubble clustering” method, clusters of cholinergic cells can be defined (Nadasdy et al., 2010), and the dendritic arborization within each cluster can be studied. As can be observed in Fig. 8, dendrites in the individual cholinergic clusters show similar orientation as the gross orientation of dendrites in the cytoarchitectonically defined spaces shown in Fig. 5. Although it has been suggested that single, putative cholinergic neurons innervate only a small slabs of the cortex (Price and Stern, 1983), observations such as nearby BF cells projecting to distant regions of the cortical mantle have apparently overlapping dendritic fields (Woolf, 1991) have been taken as evidence for a diffuse projection system (see Butcher, 1992). By mapping BF and cortical targets of retrograde tracers strategically deposited in different cortical areas of the rats, our study revealed that this projection has a complex topographic
IV. DIENCEPHALON, BASAL GANGLIA, AMYGDALA, AND SEPTUM
502
19. ORGANIZATION OF THE BASAL FOREBRAIN CHOLINERGIC PROJECTION SYSTEM: SPECIFIC OR DIFFUSE?
12 16
(A)
120
90 400
60
300
aca acp MS/VDB ec 3V
150
30
200 100
180
0
f LV
330
210
mt fr
Hi
*
240
MS/VDB
120
300 270
12 16
VP
90
150
(B)
60 30
200 100
EA
Ce
500 400 300
180
0
210
ic
330 240
300 270
(C)
17 20 120
90 800
60
600
ec st LV Hi
aca
150
30
400 200
sm f 3V
180
MS/VDB
f
*
0
210
FIGURE 7 Illustration of the “septal twist.” Cholinergic cells accumulate in two groups (columns) in the septum: an anteromedial (labeled with asterisk) and a caudolateral group. Panels A/B and C/D represent two slabs each consisting of 4 sections. A/B represent sections 12–16 (horizontal −7.50–7.10 mm), C/D represent sections 17–20b (horizontal −7.00–6.60 mm). Right columns show the polar histograms of the anteromedial (upper in each set) and caudolateral cell groups (lower histogram). To facilitate comparison of the major orientation of the dendritic segments in these two cell columns, the longest dendritic segment in the anteromedial histogram is marked red, and in the posterolateral column with black outline. Note the shift of the majority of dendritic segments in a clockwise direction (red arrow) in the anteromedial cell group (about 60°) when comparing the corresponding histograms between the ventral (panels A/B) and dorsal slabs (panels C/D). In the caudolateral group of cells, the orientation of the segments has about a 60° difference when comparing the histogram from the dorsal slab (C/D) with its counterpart in the more ventral slab (A/B). In this example the polar histogram is divided into 12 bins, each representing 30°. This arrangement is consistent with the idea of a “double helical twist” of dendritic orientation in the columns. Abbreviations: mt, mammillothalamic tract; st, stria terminalis; additional abbreviations, see previous Figs. Scale: 2.5 mm.
330 240
300 270
(D)
GP
Bst
17 20 120
90 300
60
200 30
150 100
ic
0
180
Ce
210
330 240
300 270
organization. This organization is characterized as: (1) BF projecting neurons constitute segregated or overlapping pool of neurons; and (2) the overlap of BF projecting cells correlates with the degree of connectivity between the cortical targets of the overlapping BF neurons (Zaborszky et al., 2013). These data corroborate published findings in the monkey (Ghashghaei and Barbas, 2001), suggesting that this organization may be a fundamental part of the BF corticopetal system in mammals. Preliminary analysis of the spatial relationship between cholinergic cell clusters and various BF neuronal populations whose cortical targets have been defined suggests that these cell clusters represent aggregate of cholinergic cells projecting to cortical targets that are themselves interconnected. If it can be shown that dendrites in overlapping population of neurons projecting
to interconnected cortical areas in a given cluster space show specific iso-orientation, this would be a powerful support for the notion put forward some 10 years ago (Zaborszky, 2002) that the clusters in the BF may serve as integrative modules that involves transmitting information from specific locations in the BF selectively to a small subset of associated cortical areas. It is assumed that cholinergic cells in a cluster receive the same input and/or are interconnected via local collaterals. Cholinergic neurons in slices inhibit each other largely through M2 receptors. ACh release by local collaterals of cholinergic neurons can reduce excitability and control each other’s output (Unal et al., 2011). At present, it is unknown whether cholinergic neurons that inhibit each other in the BF are located in the same or different clusters and what is the projection target of such locally
IV. DIENCEPHALON, BASAL GANGLIA, AMYGDALA, AND SEPTUM
CHOLINERGIC CELL CLUSTERS AND OVERLAPPING POOLS OF PROJECTION NEURONS
503
FIGURE 8 Dendritic orientation and the clustered organization of the BF cholinergic projection system. (A) All cholinergic neurons (small red dots) projected in a dorsal view of the horizontally cut brain, the same position as in Fig. 4A. For orientation, outlines of the anterior commissure and the 3rd ventricle (3V) from section #17 (middle of the stack) is overlaid on the cells. (B) The distribution of cholinergic cell bodies is inhomogeneous. We computed clusters by using a modified version of the bubble clustering algorithm (Nadasdy et al., 2010) implemented in Matlab (The MathWorks, Inc. Natick, MA). These clusters were defined based on the relative local cell-density. Non-overlapping clusters are labeled with different colors. (C) 3-Dimensional view of the cholinergic space from panel B; individual clusters are color-coded. Due to the high-resolution of the image, one can zoom-in and observe the traced dendrites in each cluster. Dendrites are colored according to cell’s cluster membership. Compare this 3-dimensional map with Fig. 2B that represent an anterior view of the model created from 7 coronal sections. Since the 3-dimensional map from the horizontal brain was slightly rotated medialwards, the two septal columns (see Fig. 7) can be recognized with a star labeled the small gap between these 2 columns. Antero-posterior (AP), dorso-ventral (DV) and medio-lateral (ML) coordinates are shown in micrometer according to the Euclidian space as determined by the Neurolucida program. Inset shows the polar histograms of four identified clusters. Cluster #6 is located in the septum; cluster #2 is in the globus pallidus (GP) and clusters 29 and 4 are located in the horizontal limb of the diagonal band (HDB). Note the dendritic orientation in these individual clusters is similar to that established in the specific cytoarchitectonic zones in which the appropriate cluster is located as shown in Fig. 5, in which polar histograms were created from cytoarchitectonically defined 3-dimensional spaces, rather than within computationally determined volumes. Dendrites in cluster #6 in the septum show medio-lateral orientation; cluster #2 in the globus pallidus displays an oblique orientation and dendrites in clusters #29 and #4, that are in the HDB, show diffuse orientation.
IV. DIENCEPHALON, BASAL GANGLIA, AMYGDALA, AND SEPTUM
504
19. ORGANIZATION OF THE BASAL FOREBRAIN CHOLINERGIC PROJECTION SYSTEM: SPECIFIC OR DIFFUSE?
interconnected cholinergic neurons. It is also unclear what the local packing density and dendritic arborization pattern of the two putative physiological types of cholinergic neurons are. Such studies will be important to define how much the input-output connections of cholinergic clusters fit into a functional network that might link subcortical and cortical mechanisms of attention (see a thorough discussion of how current concepts of BF organization may support attention in Parikh and Sarter, 2008; Sarter et al., 2009).
CONCLUDING REMARKS During the 30 years since its initial description (Mesulam et al., 1983a, 1983b; Armstrong et al., 1983; Rye et al., 1984; Saper, 1984), the BF cholinergic system went through a remarkable transformation from the supposed diffuse projection to a more specific system. Both behavioral-pharmacological investigations of its function in many laboratories and painstaking morphological studies revealed that this system, when viewed as a whole, has a Janus-face capable of participating in both global and more selective functions. It is hoped that the use of optogenetics in combination with identification of the projection pattern of the stimulated cholinergic cell clusters in awake-behaving animals will rapidly advance our understanding of the functional organization of basalocortical systems, which should help us to better understand the disturbed interactions in basalo-cortical networks in Alzheimer’s and related neurodegenerative disorders.
Acknowledgments The original research was supported by NIH Grant NS023945 to LZ. The authors are grateful to Dr. Candice Chavez in redesigning some of the Adobe Illustrator files for Figs. 2–4, originally prepared by Dr J. Somogyi. We wish to thank Mr. Jack R. Glaser, President, Mr. Paul Angstman, Vice President, Mr. Geoff Greene, Chief Scientific Application Officer at MBF Bioscience with whom and other stuff members of the company our interaction has been excellent over 20 years.
References Alcántara, S., Ruiz, M., D’Arcangelo, G., Ezan, F., De Lecea, L., Curran, T., et al. (1998). Regional and cellular patterns of reelin mRNA expression in the forebrain of the developing and adult mouse. Journal of Neuroscience, 18, 7779–7799. Arendt, T., Brückner, M. K., Bigl, V., & Marcova, L. (1995). Dendritic reorganisation in the basal forebrain under degenerative conditions and its defects in Alzheimer’s disease. III. The basal forebrain compared with other subcortical areas. Journal of Comparative Neurology, 351, 223–246. Armstrong, D. M., Saper, C. B., Levey, A. I., Wainer, B. H., & Terry, R. D. (1983). Distribution of cholinergic neurons in rat brain: demonstrated by the immunocytochemical localization of choline acetyltransferase. Journal of Comparative Neurology, 216, 53–68.
Avendaño, C., Umbriaco, D., Dykes, R. W., & Descarries, L. (1996). Acetylcholine innervation of sensory and motor neocortical areas in adult cat: a choline acetyltransferase immunohistochemical study. Journal of Chemical Neuroanatomy, 11, 113–130. Aznavour, N., Mechawar, N., & Descarries, L. (2002). Comparative analysis of cholinergic innervation in the dorsal hippocampus of adult mouse and rat: a quantitative immunocytochemical study. Hippocampus, 12, 206–217. Beaulieu, C., & Somogyi, P. (1991). Enrichment of cholinergic synaptic terminals on GABAergic neurons and coexistence of immunoreactive GABA and choline acetyltransferase in the same synaptic terminals in the striate cortex of the cat. Journal of Comparative Neurology, 304, 666–680. Bell, K., Shim, H., Chen, C.-K., & McQuiston, R. (2011). Nicotinic excitatory postsynaptic potentials in hippocampal CA1 interneurons are predominantly mediated by nicotinic receptors that contain α4 and β2 subunits. Neuropharmacology, 61, 1379–1388. Bennett, C., Arroyo, S., Berns, D., & Hestrin, S. (2012). Mechanisms generating dual-component nicotinic EPSCs in cortical interneurons. Journal of Neuroscience, 32, 17287–17296. Bolam, J. P., Ingham, C. A., Izzo, P. N., Levey, A. I., Rye, D. B., Smith, A. D., et al. (1986). Substance P-containing terminals in synaptic contact with cholinergic neurons in the neostriatum and basal forebrain: a double immunocytochemical study in the rat. Brain Research, 397, 279–289. Butcher, L. L. (1992). The cholinergic basal forebrain and its telencephalic targets: interrelations and implications for cognitive function. In E. D. Levin, M. W. Decker, & L. L. Butcher (Eds.), Neurotransmitter Interactions and Cognitive Function (pp. 15–26). Boston: Birkhauser. Butcher, L. L., & Woolf, N. J. (2004). Cholinergic neurons and networks revisited. In G. Paxinos (Ed.), The Rat Nervous System (pp. 1257– 1268). San Diego: Elsevier/Academic Press. Cetas, J. S., Price, R. O., Crowe, J., Velenovsky, D. S., & McMullen, N. T. (2003). Dendritic orientation and laminar architecture in the rabbit auditory thalamus. Journal of Comparative Neurology, 458, 307–317. Chang, H. T., Penny, G. R., & Kitai, S. T. (1987). Enkephalinergic-cholinergic interaction in the rat globus pallidus: a pre-embedding double-labeling immunocytochemistry study. Brain Research, 426, 197–203. Chang, H. T., Tian, Q., & Herron, P. (1995). GABAergic axons in the ventral forebrain of the rat: an electron microscopic study. Neuroscience, 68, 207–220. Csillik, B., Rakic, P., & Knyihár-Csillik, E. (1998). Peptidergic innervation and the nicotinic acetylcholine receptor in the primate basal nucleus. European Journal of Neuroscience, 10, 573–585. Cullinan, W. E., & Zaborszky, L. (1991). Organization of ascending hypothalamic projections to the rostral forebrain with special reference to the innervation of cholinergic projection neurons. Journal of Comparative Neurology, 306, 631–667. Dembrow, N. C., Chitwood, R., & Johnston, D. (2010). Projection-specific neuromodulation of medial prefrontal cortex neurons. Neuroscience, 30, 16922–16937. Descarries, L., Mechawar, N., Aznavour, N., & Watkins, K. C. (2004). Structural determinants of the roles of acetylcholine in cerebral cortex. Progress in Brain Research, 145, 45–58. Disney, A. A., Aoki, C., & Hawken, M. J. (2007). Gain modulation by nicotine in Macaque V1. Neuron, 56, 701–713. Dominguez, R., Jalali, C., & De Lacalle, S. (2004). Morphological effects of estrogen on cholinergic neurons in vitro involves activation of extracellular signal-regulated kinases. Journal of Neuroscience, 24, 982–990. Duffy, A. M., Zhou, P., Milner, T. A., & Pickel, V. M. (2009). Spatial and intracellular relationships between the alpha7 nicotinic acetylcholine transporter in the prefrontal cortex of rat and mouse. Neuroscience, 161, 1091–1103.
IV. DIENCEPHALON, BASAL GANGLIA, AMYGDALA, AND SEPTUM
REFERENCES
Duque, A., Balatoni, B., Détári, L., & Zaborszky, L. (2000). EEG correlation of the discharge properties of identified neurons in the basal forebrain. Journal of Neurophysiology, 84, 1627–1635. Duque, A., Tepper, J. M., Detari, L., Ascoli, G. A., & Zaborszky, L. (2007). Morphological characterization of electrophysiologically and immunohistochemically identified basal forebrain cholinergic and neuropeptide Y-containing neurons. Brain Structure & Function, 212, 55–73. Duque, A., & Zaborszky, L. (2006). Juxtacellular labeling of individual neurons in vivo: from electrophysiology to synaptology. In L. Zaborszky, F. Wouterloud, & J. Lanciego (Eds.), Neuroanatomical Tract-Tracing, 3, Molecules, Neurones, Systems (pp. 197–236). New York: Springer. Eggermann, E., & Feldmeyer, D. (2009). Cholinergic filtering in the recurrent excitatory microcircuit of cortical layer 4. Proceeding of the National Academy of Science in the United States of America, 106, 11753–11758. Eggermann, E., Serafin, M., Bayer, L., Machard, D., Saint-Mleux, B., Jones, B. E., et al. (2001). Orexins/hypocretins excite basal forebrain cholinergic neurones. Journal of Neuroscience, 108, 177–181. Gaykema, R. P., & Zaborszky, L. (1996). Direct catecholaminergiccholinergic interactions in the basal forebrain. II. Substantia nigra-ventral tegmental area projections to cholinergic neurons. Journal of Comparative Neurology, 374, 555–577. Georges, P. C., Hadzimichalis, N. M., & Sweet, E. S. (2008). The yinyang of dendrite morphology: unity of actin and microtubules. Molecular Neurobiology, 38, 270–284. Ghashghaei, H. T., & Barbas, H. (2001). Neural interaction between the basal forebrain and functionally distinct prefrontal cortices in the rhesus monkey. Neuroscience, 103, 593–614. Glaser, E. M., Van der Loos, H., & Gissler, M. (1979). Tangential orientation and spatial order in dendrites of cat auditory cortex: a computer microscope study of Golgi-impregnated material. Experimental Brain Research, 36, 411–431. Gould, E., & Butcher, L. L. (1989). Developing cholinergic basal forebrain neurons are sensitive to thyroid hormone. Journal of Neuroscience, 9, 3347–3358. Gu, Z., & Yakel, J. L. (2011). Timing-dependent septal cholinergic induction of dynamic hippocampal synaptic plasticity. Neuron, 71, 155–165. Hajszán, T., & Zaborszky, L. (2002). Direct catecholaminergic-cholinergic interactions in the basal forebrain. III. Adrenergic innervation of choline acetyltransferase-containing neurons in the rat. Journal of Comparative Neurology, 449, 141–157. Halliday, G. M., Cullen, K., & Cairns, M. J. (1993). Quantitation and three-dimensional reconstruction of Ch4 nucleus in the human basal forebrain. Synapse, 15, 1–16. Houser, C. R., Crawford, G. D., Salvaterra, P. M., & Vaughn, J. E. (1985). Immunocytochemical localization of choline acetyltransferase in rat cerebral cortex: a study of cholinergic neurons and synapses. Journal of Comparative Neurology, 234, 17–34. Howe, W. M., Parikh, J., Williams, S., Mocaer, E., & Trocme-Thibierge, C. (2010). Enhancement of attentional performance by selective stimulation of α4β2* nAChRs: Underlying cholinergic mechanisms. Neuropharmacology, 35, 1391–1401. Hur, E. E., Edwards, R. H., Rommer, E., & Zaborszky, L. (2009). Vesicular glutamate transporter 1 and vesicular glutamate transporter 2 synapses on cholinergic neurons in the sublenticular gray of the rat basal forebrain: a double-label electron microscopic study. Journal of Neuroscience, 164, 1721–1731. Ingham, C. A., Bolam, J. P., & Smith, A. D. (1988). GABA-immunoreactive synaptic boutons in the rat basal forebrain: comparison of neurons that project to the neocortex with pallidosubthalamic neurons. Journal of Comparative Neurology, 273, 263–282. Javoy-Agid, F., Scatton, B., Ruberg, M., L’Heureux, R., Cervera, P., Raisman, R., et al. (1989). Distribution of monoaminergic, cholinergic, and gabaergic markers in the human cerebral cortex. Neuroscience, 29, 251–259.
505
Jolkkonen, E., Miettinen, R., Pikkarainen, M., & Pitkänen, A. (2002). Projections from the amygdaloid complex to the magnocellular cholinergic basal forebrain in rat. Neuroscience, 111, 133–149. Kalmbach, A., Hedrick, T., & Waters, J. (2012). Selective optogenetic stimulation of cholinergic axons in neocortex. Journal of Neurophysiology, 107, 2008–2019. Khateb, A., Fort, P., Pegna, A., Jones, B. E., & Mühlethaler, M. (1995). Cholinergic nucleus basalis neurons are excited by histamine in vitro. Journal of Neuroscience, 69, 495–506. Kotz, S., & Read, C. B. (1997). Encyclopedia of Statistical Sciences. New York: John Wiley & Sons. Lawrence, J. J. (2008). Cholinergic control of GABA release: emerging parallels between neocortex and hippocampus. Trends in Neuroscience, 31, 317–327. Lee, M. G., Hassani, O. K., Alonso, A., & Jones, B. E. (2005). Cholinergic basal forebrain neurons burst with theta during waking and paradoxical sleep. Journal of Neuroscience, 25, 4365–4369. Leontovich, T. A., & Zhukova, G. P. (1963). The specificity of the neuronal structure and topography of the reticular formation in the brain and spinal cord of carnivora. Journal of Comparative Neurology, 121, 347–379. Levey, A. I., Kitt, C. A., Simonds, W. F., Price, D. L., & Brann, M. R. (1991). Identification and localization of muscarinic acetylcholine receptor proteins in brain with subtype-specific antibodies. J. Neurosci, 11, 3218–3226. Lewis, D. A. (1991). Distribution of choline acetyltransferase-immunoreactive axons in monkey frontal cortex. Neuroscience, 40, 363–374. Lysakowski, A., Wainer, B. H., Bruce, G., & Hersh, L. B. (1989). An atlas of the regional and laminar distribution of choline acetyltransferase immunoreactivity in rat cerebral cortex. Neuroscience, 28, 291–336. Luine, V. N. (1985). Estradiol increases choline acetyltransferase activity in specific basal forebrain nuclei and projection areas of female rats. Experimental Neurology, 89, 484–490. Martinez-Murillo, R., Blasco, I., Alvarez, F. J., Villalba, R., Solano, M. L., Montero-Caballero, M. I., et al. (1988). Distribution of enkephalin-immunoreactive nerve fibres and terminals in the region of the nucleus basalis magnocellularis of the rat: a light and electron microscopic study. Journal of Neurocytology, 17, 361–376. McMullen, N. T., Glaser, E. M., & Tagamets, M. (1984). Morphometry of spine-free nonpyramidal neurons in rabbit auditory cortex. Journal of Comparative Neurology, 222, 383–395. Mechawar, N., Cozzari, C., & Descarries, L. (2000). Cholinergic innervation in adult rat cerebral cortex: a quantitative immunocytochemical description. Journal of Comparative Neurology, 428, 305–318. Mesulam, M. M., Mufson, E. J., Levey, A. I., & Wainer, B. H. (1983a). Cholinergic innervation of cortex by the basal forebrain: cytochemistry and cortical connections of the septal area, diagonal band nuclei, nucleus basalis (substantia innominata), and hypothalamus in the rhesus monkey. Journal of Comparative Neurology, 214, 170–197. Mesulam, M. M., Mufson, E. J., Wainer, B. H., & Levey, A. I. (1983b). Central cholinergic pathways in the rat: an overview based on an alternative nomenclature (Ch1–Ch6). Neuroscience, 10, 1185–1201. Mesulam, M. M., Hersh, L. B., Mash, D. C., & Geula, C. (1992). Differential cholinergic innervation within functional subdivisions of the human cerebral cortex: a choline acetyltransferase study. Journal of Comparative Neurology, 318, 316–328. Mesulam, M. M., Volicer, L., Marquis, J. K., Mufson, E. J., & Green, C. R. (1986). Systematic regional differences in the cholinergic innervation of the primate cerebral cortex: distribution of enzyme activities and some behavioral implications. Annals of Neurology, 19, 144–151. Ma, M., & Luo, M. (2012). Optogenetic activation of basal forebrain cholinergic neurons modulates neuronal excitability and sensory responses in the main olfactory bulb. Neuroscience, 32, 10105–10116. Mrzljak, L., Levey, A. I., & Rakic, P. (1996). Selective expression of m2 muscarinic receptor in the parvocellular channel of the primate visual cortex. Proceedings of the National Academy of Science in the United States of America, 93, 7337–7340.
IV. DIENCEPHALON, BASAL GANGLIA, AMYGDALA, AND SEPTUM
506
19. ORGANIZATION OF THE BASAL FOREBRAIN CHOLINERGIC PROJECTION SYSTEM: SPECIFIC OR DIFFUSE?
Mrzljak, L., Pappy, M., Leranth, C., & Goldman-Rakic, P. S. (1995). Cholinergic synaptic circuitry in the macaque prefrontal cortex. Journal of Comparative Neurology, 357, 603–617. Nadasdy, Z., Varsanyi, P., & Zaborszky, L. (2010). Clustering of large cell populations: method and application to the basal forebrain cholinergic system. Journal of Neuroscience Methods, 194, 46–55. O’Dell, R. S., Ustine, C. J. M., Cameron, D. A., Lawless, S. M., Williams, R. M., Zipfel, W. R., et al. (2012). Layer 6 cortical neurons require Reelin-Dab1 signaling for cellular orientation, Golgi deployment, and directed neurite growth into the marginal zone. Neural Development, 7, 25. Palomero-Gallagher, N., & Zilles, K. (2004). Isocortex. In G. Paxinos (Ed.), The Rat Nervous System (3rd ed.) (pp. 729–757). Amsterdam: Elsevier/Academic Press. Paré, D., & Smith, Y. (1994). GABAergic projection from the intercalated cell masses of the amygdala to the basal forebrain in cats. Journal of Comparative Neurology, 344, 33–49. Parikh, V., Decker, J., & Sarter, M. (2010). Prefrontal β2 subunit-containing and α7 nicotinic acetylcholine receptors differentially control glutamateregic and cholinergic signaling. Journal of Neuroscience, 30, 3518–3530. Parikh, V., Kozak, R., Martinez, V., & Sarter, M. (2007). Prefrontal acetylcholine release controls cue detection on multiple timescales. Neuron, 56, 141–154. Parikh, V., & Sarter, M. (2008). Cholinergic mediation of attention: contributions of phasic and tonic increases in prefrontal cholinergic activity. Annals of the New York Academy of Sciences, 1129, 225–235. Paxinos, G., & Watson, C. (1998). The Rat Brain in Stereotaxic Coordinates (4th ed.). San Diego: Elsevier/Academic Press. Price, J. L., & Stern, R. (1983). Individual cells in the nucleus basalisdiagonal band complex have restricted axonal projections to the cerebral cortex in the rat. Brain Research, 269, 352–356. Ramón-Moliner, E., & Nauta, W. J. (1966). The isodendritic core of the brain stem. Journal of Comparative Neurology, 126, 311–335. Raghanti, M. A., Stimpson, C. D., Marcinkiewicz, J. L., Erwin, J. M., Hof, P. R., & Sherwood, C. C. (2008). Cholinergic innervations of the frontal cortex: differences among humans, chimpanzees, and macaque monkeys. Journal of Comparative Neurology, 506, 409–424. Rao, J. S. (1969). Some Contributions to the Analysis of Circular Data. PhD thesis. Calcutta: Indian Statistical Institute. Rasmusson, D. D. (2000). The role of acetylcholine in cortical synaptic plasticity. Behavioural Brain Research, 115, 205–218. Rye, D. B., Wainer, B. H., Mesulam, M. M., Mufson, E. J., & Saper, C. B. (1984). Cortical projections arising from the basal forebrain: a study of cholinergic and noncholinergic components employing combined retrograde tracing and immunohistochemical localization of choline acetyltransferase. Neuroscience, 13, 627–643. Samsonovich, A. V., & Ascoli, G. A. (2006). Morphological homeostasis in cortical dendrites. Proceedings of the National Academy of Science of the United States of America, 103, 1569–1574. Saper, C. B. (1984). Organization of cerebral cortical afferent systems in the rat. II. Magnocellular basal nucleus. Journal of Comparative Neurology, 222, 313–342. Saper, C. B. (1987). Diffuse cortical projection systems: anatomical organization and role in cortical function. In V. B. Mountcastle, F. Plum, & S. Geiger (Eds.), Handbook of Physiology: The Nervous System Part 1: Vol 5. (pp. 169–210). Bethesda, Maryland: American Physiological Society. Sarter, M., & Bruno, J. (1997). Cognitive functions of cortical acetylcholine: toward a unifying hypothesis. Brain Research Review, 23, 28–46. Sarter, M., Parikh, V., & Howe, W. M. (2009). Phasic acetylcholine release and the volume transmission hypothesis: time to move on. Nature Reviews Neuroscience, 10, 383–390. Schäfer, M. K., Eiden, L. E., & Weihe, E. (1998). Cholinergic neurons and terminal fields revealed by immunohistochemistry for the vesicular acetylcholine transporter. I. Central nervous system. Neuroscience, 84, 331–359.
Shepherd, G. M. (2008). Complex information processing in dendrites. In L. R. Squire, D. Berg, F. E. Bloom, S. du Lac, A. Ghosh, & N. C. Spitzer (Eds.), Fundamental Neuroscience (3rd ed.) (pp. 247–269). Amsterdam: Academic Press. Smiley, J. F., Morrell, F., & Mesulam, M. M. (1997). Cholinergic synapses in human cerebral cortex: an ultrastructural study in serial sections. Experimental Neurology, 144, 361–368. Umbriaco, D., Watkins, K. C., Descarries, L., Cozzari, C., & Hartman, B. K. (1994). Ultrastructural and morphometric features of the acetylcholine innervation in adult rat parietal cortex: an electron microscopic study in serial sections. Journal of Comparative Neurology, 348, 351–373. Unal, C. T., Golowasch, J. P., & Zaborszky, L. (2011). Local Synaptic Interactions within the Cholinergic Basal Forebrain. Neuroscience Meeting Planner. Washington, DC: Society for Neuroscience, Abstracts, 294.13. Unal, C. T., Golowasch, J. P., & Zaborszky, L. (2012). Adult mouse basal forebrain harbors two distinct cholinergic populations defined by their electrophysiology. Frontiers in Behavioral Neuroscience, 6, 1–14. Valverde, F. (1961). Reticular formation of the pons and medulla oblongata. A Golgi study. Journal of Comparative Neurology, 116, 71–99. Woolf, N. J. (1991). Cholinergic systems in mammalian brain and spinal cord. Progress in Neurobiology, 37, 475–524. Wu, M., Zaborszky, L., Hajszán, T., Van den Pol, A. N., & Alreja, M. (2004). Hypocretin/orexin innervation and excitation of identified septohippocampal cholinergic neurons. Journal of Neuroscience, 24, 3527–3536. Yamasaki, M., Matsui, M., & Watanabe, M. (2010). Preferential localization of muscarinic M1 receptor on dendritic shaft and spine of cortical pyramidal cells and its anatomical evidence for volume transmission. Journal of Neuroscience, 30, 4408–4418. Zaborszky, L. (1989). Peptidergic-cholinergic interactions in the basal forebrain. In R. J. Wurtman, S. H. Corkin, J. H. Growdon, & E. Ritter-Walker (Eds.), Proceedings of the Fifth Meeting of the International Study Group on the Treatment of Memory Disorders Associated with Aging (pp. 521–528). Cambridge: Center for Brain Sciences and Metabolism Charitable Trust. Zaborszky, L. (1992). Synaptic organization of basal forebrain cholinergic projection neurons. In E. Levin, M. Decker, & L. Butcher (Eds.), Neurotransmitter Interactions and Cognitive Function (pp. 27–65). Boston: Birkhauser. Zaborszky, L. (2002). The modular organization of brain systems. Basal forebrain: the last frontier. Progress in Brain Research, 136, 359–372. Zaborszky, L., Buhl, D. L., Pobalashingham, S., Bjaalie, J. G., & Nadasdy, Z. (2005). Three-dimensional chemoarchitecture of the basal forebrain: spatially specific association of cholinergic and calcium binding protein-containing neurons. Neuroscience, 136, 697–713. Zaborszky, L., & Cullinan, W. E. (1989). Hypothalamic axons terminate on forebrain cholinergic neurons: an ultrastructural double-labeling study using PHA-L tracing and ChAT immunocytochemistry. Brain Research, 479, 177–184. Zaborszky, L., & Cullinan, W. E. (1992). Projections from the nucleus accumbens to cholinergic neurons of the ventral pallidum: a correlated light and electron microscopic double-immunolabeling study in rat. Brain Research, 570, 92–101. Zaborszky, L., & Cullinan, W. E. (1996). Direct catecholaminergiccholinergic interactions in the basal forebrain. I. Dopaminebeta-hydroxylase- and tyrosine hydroxylase input to cholinergic neurons. Journal of Comparative Neurology, 374, 535–554. Zaborszky, L., Cullinan, W. E., & Braun, A. (1991). Afferents to basal forebrain cholinergic projection neurons: an update. Advances in Experimental Medicine and Biology, 295, 43–100. Zaborszky, L., Cullinan, W. E., & Luine, V. N. (1993). Catecholaminergic-cholinergic interaction in the basal forebrain. Progress in Brain Research, 98, 31–49.
IV. DIENCEPHALON, BASAL GANGLIA, AMYGDALA, AND SEPTUM
REFERENCES
Zaborszky, L., Csordas, A., Buhl, D. L., Duque, A., Somogyi, J., & Nadasdy, Z. (2002). Computational anatomical analysis of the basal forebrain corticopetal system. In G. A. Ascoli (Ed.), Computational Neuroanatomy: Principles and Methods (pp. 171–197). Totowa: Humana Press Inc. Zaborszky, L., Csordas, A., Mosca, K., Kim, J., Gielow, M. R., Vadasz, C., et al. (2013). Neurons in the basal forebrain project to the cortex in a complex topographic organization that reflects corticocortical connectivity patterns: An experimental study based on retrograde tracing and 3D reconstruction. Cerebral Cortex. http://dx.doi.org/10.1093/cercor/bht210. Zaborszky, L., & Duque, A. (2000). Local synaptic connections of basal forebrain neurons. Behavioural Brain Research, 115, 143–158. Zaborszky, L., Gaykema, R. P., Swanson, D. J., & Cullinan, W. E. (1997). Cortical input to the basal forebrain. Neuroscience, 79, 1051–1078. Zaborszky, L., Heimer, L., Eckenstein, F., & Leranth, C. (1986). GABAergic input to cholinergic forebrain neurons: an ultrastructural study using retrograde tracing of HRP and double immunolabeling. Journal of Comparative Neurology, 250, 282–295.
507
Zaborszky, L., Hoemke, L., Mohlberg, H., Schleicher, A., Amunts, K., & Zilles, K. (2008). Stereotaxic probabilistic maps of the magnocellular cell groups in human basal forebrain. NeuroImage, 42, 1127–1141. Zaborszky, L., Léránth, C., & Heimer, L. (1984). Ultrastructural evidence of amygdalofugal axons terminating on cholinergic cells of the rostral forebrain. Neuroscience Letters, 52, 219–225. Zaborszky, L., Pang, K., Somogyi, J., Nadasdy, Z., & Kallo, I. (1999). The basal forebrain corticopetal system revisited. Annals of the New York Academy of Sciences, 877, 339–367. Zaborszky, L., Van den Pol, A., & Gyengesi, E. (2012). The basal forebrain cholinergic projection system in mice. In C. Watson, G. Paxinos, & L. Puelles (Eds.), The Mouse Nervous System (pp. 684–718). San Diego: Elsevier.
IV. DIENCEPHALON, BASAL GANGLIA, AMYGDALA, AND SEPTUM


![Specific [3H]phencyclidine binding in rat central nervous system](https://m.moam.info/img/260x300/specific-3hphencyclidine-binding-in-rat-central-ne_5b733533097c474a338b468a.jpg)