The relationship between competition and programmatic diversification Mattia Cattaneo1,a,c, Hugo Hortab, Paolo Malighettia, Michele Meolia,c, Stefano Palearia,c
Forthcoming: Studies in Higher Education
Affiliation: a
Department of Management, Information and Production Engineering, University of Bergamo, via Pasubio 7b, 24044 Dalmine (BG), Italy. b
Division of Policy, Administration and Social Sciences Education, Faculty of Education, University of Hong Kong, Hong Kong, China. c
HERe (Higher Education Research), University of Bergamo, Dalmine (BG), Italy.
Acknowledgements We wish to thank Andrea Bonaccorsi, Giliberto Capano, Daniele Checchi, Cinzia Daraio and John Aubrey Douglas. The authors also thank the participants at the Regional Science Association European conference, 2015, in Piacenza, the participants at the 29th CHER Annual Conference, 2016, in Cambridge, and those attending the AiIG conference, 2016, in Bergamo.
1
Corresponding author:
[email protected]. Via Pasubio 7b, 24044 Dalmine (BG), Italy; Tel.: +39 035 2052094 1
The relationship between competition and programmatic diversification
Abstract In this study, we analyse the relationship between competition and programmatic diversification in 75 Italian universities from the academic years of 2003/04 to 2011/12. Results show that local competition, rather than national competition, influences programmatic diversification. The relationship between local competition and programmatic diversification is found to be quadratic such that when competition increases, diversification decreases and specialisation increases, and both relationships are reversed after a certain threshold. We argue that under moderate levels of competition, universities tend to respond to local competition for students by differentiating their programmatic offerings from their competitors. However, when the level of competition is minimum or extreme, universities tend to follow an isomorphic strategy. After the reduction in student demand and the reform of the higher education system in 2008/2009, the relationship was no longer curvilinear because universities operating in extremely competitive environments began to adopt more risk-taking behaviour by engaging in diversification strategies.
Keywords: University competition; diversification; specialisation; student demand; Italian higher education system.
2
Introduction In recent years, policymakers have been paying increasing attention to the relationship between competition and programmatic diversification in higher education systems (Mayo, 2009). The tension between competition and programmatic diversification is most apparent in countries in which universities face substantial cuts to their state-allocated funding and are forced to look for other income sources.2 The need to obtain additional income sources has led universities to compete more actively for students (Farhan, 2016), and university managers are expected to opt for either risk-taking or risk-averse market strategies in relation to their programmatic offerings (Teixeira et al., 2012; Rossi, 2009, 2010; Codling and Meek, 2006). Risk-taking strategies usually imply specialisation of the programmatic offerings because they typically entail differentiating the programmes from those of the competitors. Alternatively, imitating successful competitors (isomorphic strategies) is another commonly chosen strategy (DiMaggio and Powell, 1983). Notwithstanding the relevance of diversification to higher education policies (Reichert, 2009), empirical research on the topic is still relatively scarce (as argued by Huisman et al., 2007, 2015). Longitudinal research on the relationship between competition and programmatic diversification in higher education is even scarcer (Teixeira et al., 2012, 2014; Rossi, 2009, 2010). Although these studies identify risk-taking and risk-adverse strategies as responses to the environment and provide meaningful contributions to the field, they do not assess how the intensity of the competition affects the diversification and specialisation strategies over time. The aim of this study is to fill this gap in the literature. We examine the relationship between the competition and diversification strategies of universities in the Italian higher education system over the 2003/04 to 2011/12 period. Italy provides an appropriate context in which to examine this topic because, following the financial crisis, the public funding for universities (adjusted for the inflation rate) dropped by 19.6% from 2008 to 2015,3 which compelled Italian universities to consider new strategies and to adapt to the more uncertain times (Turri, 2016).4 During this time, a novel regulatory framework for course creation was introduced that constrained the ability of universities to establish new courses and required the universities to mobilise their internal resources (with the associated costs) while seeking to increase their income revenue from private sources (i.e. tuition fees). The implications of this are that Italian universities had to devise strategies to adapt and survive as their agency was stimulated by environmental conditions, but under
2
Source EUA: http://www.eua.be/activities-services/projects/eua-online-tools/public-funding-observatory-tool.aspx [accessed on 20 December 2016]. 3 Source MIUR: http://hubmiur.pubblica.istruzione.it/web/universita/home [accessed on 10 February 2017]. 4 This trend is similar to that of other countries (e.g. Farhan, 2017 for Ontario, Canada; Erhardt and Kotzebue, 2016 for Germany).
3
a regulatory stance from the government that placed constraints to this agency. This is a situation similar to that of other countries where educational markets are stimulated but under governmental policies that combine or interchange supervision and intervention stances concerning the universities programmatic supply for purposes of quality, macro-efficiency, and transparency (Antonowicz et al., 2016; Rasmussen, 2014; Enders et al., 2013). The remainder of this study is organised as follows. Section 2 provides a brief review of the literature on programmatic diversity and competition and describes the evolution of the Italian higher education system in the past decade. Section 3 specifies the research design, sample, sources, methods, and indices used to measure university diversity and competition. Section 4 reports the results while Section 5 corroborates them with a set of robustness checks. Section 6 presents the conclusions and the discussion of the results.
2. Literature review and context
2.1 Programmatic diversity, diversification, and competition Programmatic diversity is associated with the breadth, range, and form of the degree areas, including their mission and comprehensiveness, that are offered by higher education institutions in a given higher education system (van Vught, 2008). National-level analyses (the most frequently used) focus on external diversity (the differences between universities), whereas organisational case studies focus on internal diversity (the differences within universities) (Birnbaum, 1983). Programmatic diversity, although useful, mainly portrays the variety of programmes offered in a higher education system at a specific time, thus presenting a static perspective. For longitudinal analyses, the concept of programmatic diversification is more useful because it refers to a dynamic framework in which the programmatic diversity evolves over time as a result of the pressure from the environment and the institutional responses to it (Huisman, 1995). This means that the programmatic diversity in a higher education system can diminish, stabilise, or increase, although there is a relatively established consensus that a more-diversified higher education system offers more benefits than a less-diversified one (see van Vught, 2008). Although the rationale for having a diversified higher education system serves the purposes of fostering broader access to tertiary education and greater social mobility (Heitor and Horta, 2016), in globalised knowledge societies, the more pressing concerns are instrumental and focused on human capital. In practice, diversification relates to the need to meet the requirements of the riskier labour market resulting from increased computerisation while maintaining an educational system that can update, upgrade, and re-train the current labour force (Frey and Osborne, 2017). In this regard, 4
policymakers have expressed pressing concerns about increasing the competitiveness and attractiveness of national universities while striving to foster vertical and horizontal diversification in higher education systems (Buckner, 2016).5 However, although higher education systems continue to function as highly institutionalised quasi-markets, the state, a key institutional agent, has played more of a supervisory than an interventionist role in higher education (Ferlie et al., 2008). These roles are not often clear-cut, simplistic, nor unidirectional, as often governments apply interchanging and combining mechanisms of intervention and supervision, but they lean more towards an evaluative positioning (see Heitor and Horta, 2016; Antonowicz et al., 2016; Ferlie et al., 2008). This change implies that the market is playing an increasingly central role in steering the changes to higher education systems and thus fostering or constraining the trend towards diversification, which underlines the growing importance of student-consumer decisions based on student satisfaction, learning expectations, and the anticipated private returns of education (Nixon et al., 2016; Tavares and Cardoso, 2013). This change highlights the neoliberal reasoning that the market is more effective in fostering the diversification of higher education systems than the regulatory frameworks promoted by the state (Jongbloed, 2003). This view is based to a large extent on the idea that competition can drive universities to differentiate their programmatic offerings from their competitors (Scott and Blag, 2016). However, the idea that the market itself (and the increasing levels of competition associated with it) promotes greater levels of diversification is not entirely undisputed. Universities are organisations that assimilate and interpret policies and demands from the environment through the mixed filters of the institutional culture, governance structures, and normative frameworks (Pinheiro et al., 2016). When facing growing market pressure, universities are expected to assume the same stance in preserving their self-interests and moulding the external market pressures to internally accepted formats and rationales. From this perspective, rather than being simply passive actors that acquiesce to pressure, universities generally seek to re-invent themselves by adapting to change (Sahlin and Wedlin, 2008). However, this adaptation does not imply that market forces necessarily
5
The key issue is to know more about how diversity, diversification, and competition affect one another. On this topic, a consensus exists from the perspective of business and ecological systems concerning the association between diversity and competition. Most economic thinking suggests that moderate rather than intensive competitive dynamics can be more effective in improving the performance of businesses and markets. Assuring moderate competitive dynamics highlight the need to maintain balanced levels of economic diversity (also in terms of the market structure) and underline the key role of niches in stimulating diverse product and service offerings (e.g. Tisdell, 2013). Ecological systems literature is aligned mostly with this perspective in underlining the key role of ecosystems’ diversity in balancing competition for resources which equilibrates biodiversity and fosters complementary and synergetic inter-species dynamics, thus guaranteeing ecological stability and bio-sustainability in complex evolving ecosystems (Loreau and de Mazancourt, 2013). Further economic literature shows that while moderately competitive markets promote diversity, overly competitive markets dampen diversity because it constrains the actors to act in a similar fashion, offering products and services that assume similar characteristics, without necessarily adding value (van der Wurff and van Cuilenburg, 2009).
5
lead to greater diversification. In contrast, the market may lead to greater isomorphism in the higher education system. Thus far, the empirical literature has produced mixed results on this topic. Teixeira et al. (2014; 2012) showed in a descriptive analysis of the Portuguese higher education system that greater levels of competition stimulated private Portuguese universities to diversify their programmatic offerings, mainly towards medical disciplines. However, they suggested that Portuguese public universities did not appear to be influenced by market forces because strict regulatory frameworks were in place. Research on the Australian (Codling and Meek, 2006) and Italian higher education systems (Rossi, 2010; 2009) has shown that rather than opting for market niches, universities in competitive environments demonstrate risk-adverse behaviour and emulate what they perceive to be their successful competitors.
2.2 Change and competition for students in the Italian higher education system In recent years, the Italian higher education system has been characterised by the changing demand for higher education, an increasingly geographically competitive environment, and a more restrictive regulatory framework for teaching (Minelli et al., 2012).6 Despite declining enrolment rates (the total enrolment in 2012 was 10% lower than in 2004), the Ministry of Education Universities and Research (MIUR) has increasingly allocated funds proportional to the number of students enrolled (Rossi, 2010). The recent establishment of three new universities and 11 distant-learning-only institutions has also required universities to formulate new strategies to attract students. This has been further exacerbated by the repeated reductions in state-allocated funds (Fondo di Finanziamento Ordinario) relative to the universities’ total income (CNVSU, 2011). Whereas tuition fees used to account for only about 10% of the total income of universities, these changes have made student tuition fees a key income source for universities, even when restricted to a maximum value by national legislation (Agasisti and Haelermans, 2016). Concomitantly, costs of higher education transitioned slowly but steadily from the state to the families, as the average tuition fee per student charged by public universities increased by 35%, from 903.80 € a year in 2008/09 to 1,216.70 € in 2014/15, while the percentage of students who benefit from public scholarships/grants increased slightly from 7.6% to 8.8% with a growth in the average amount per student of 22% (far less than the increase incurred on the average value of tuition fees per student).
6
Minelli et al. (2012) describe the teaching environment in terms of freedoms. The form of freedom mostly affected by the recent reforms of the Italian teaching framework is the ‘freedom to specify the product’, given that all new degree courses have to respect a minimum number of ex-ante requisites, such as the number of teaching staff in each course and the number of seats in lecture halls (see also Rebora and Turri, 2011, 539).
6
The geographic competitive structure has also slightly changed over the past decade. The competition for students between universities has become less constrained to the regions where the universities are located, as the universities target an increasingly mobile population of students who choose the most attractive educational offerings from around the country (Cattaneo et al., 2017a). Between 2004 and 2012, the share of students who enrolled in an Italian university in a different province increased by about 10%. The capacity for students to travel long distances from the south to the universities in the north of Italy has been facilitated by the development of the country’s transportation infrastructure, but competition in Italy for students remains mostly focused at the local level (Cattaneo et al., 2017a). Finally, regulatory changes have reshaped the higher education system with regard to the introduction of new courses. For efficiency and teaching quality reasons, the Ministerial Decree 554/2007 implemented restrictive standards for universities to create new programmes (Minelli et al. 2012). The restrictions relate to the number of teaching staff per course and the number of students per lecture (Rebora and Turri, 2009). However, unless they do not satisfy the MIUR conditions, universities have not been prevented from creating new courses. On the contrary, the restrictions have forced universities to adjust their human resource policies to the teaching strategies required to meet the demands of the changing environment (Rebora and Turri, 2011). As a whole, while the higher mobility of students and the increasing societal requests have pushed universities towards more variety in their programmatic supply, regulatory changes have worked in contrary directions, with each university choosing its equilibrium level of diversification and specialisation. In these respects, this analysis aims to analyse what have been the determinants of such equilibrium, with a particular focus on how the competition dynamics have played a major role.
3. Research design 3.1.
Sample and data sources
Our analysis of the relationship between the competition for students and universities’ programmatic diversity is based on observations of 75 universities (public and private) from the 2003/04 to 2011/12 academic years.7 Although there is a total of 97 universities in the Italian higher education system, some universities were excluded from the analysis because they had unique characteristics that made them outliers in terms of their student selection, which could have biased the results. Specifically, 11 7
The analysis is limited to 2011/12 because it represents the last year from which disaggregated Ministerial data on the programmatic offerings of each university are available.
7
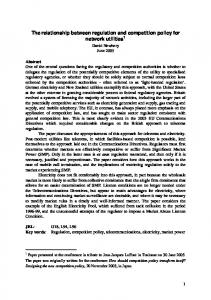
distance-learning institutions, six doctoral-only universities and three universities for foreigners (University of Foreigners of Perugia, Reggio Calabria, and Siena) were excluded from the sample. The Rome Link Campus University and the Humanitas University were also excluded because they were accredited as universities in the second half of 2011 (decree no. 374 of 21 September 2011) and the first half of 2014 (decree no. 141 of 20 June 2014), respectively. Figure 1 depicts the geographical distribution of the 75 selected universities in 2012 using the coordinates of each university’s legal administrative site. The Italian National Institute of Statistics (ISTAT) classification of macro-areas (NUTS1: North, Centre, and South) is used to highlight the regions in which universities are located. Thirty universities are situated in the North (dark-grey), 19 in the Centre (light grey), and 26 in the South, which includes Sicily and Sardinia (white).
Figure 1. Geographical distribution of Italian universities. Macro-areas are identified by different shades. Northern provinces are in dark grey, central provinces are in light grey and southern provinces are in white. Circles represent the 75 universities.
8
The data used in the analysis was gathered from different secondary sources. The information on the characteristics of universities was collected online through the MIUR website, data on the Italian provinces (NUTS3 regions) was collected from the datasets of the ISTAT and the Analisi Informatizzata delle Aziende Italiane (AIDA), a database powered by Bureau Van Dijk, which provides information about the economic structure of the provinces in which the universities are located. Additional province-level data was collected from Il Sole 24Ore, the main Italian financial newspaper, for the Quality of life indicator.
3.2.
Variables definitions
The operationalisation of the definitions of programmatic diversity and competition and the selection of the control variables used in the empirical analyses are based on the literature.
3.2.1. University programmatic diversification and specialisation Our analysis draws on the concepts of diversification and specialisation found in the literature and focuses on the programmatic diversification between universities (Lepori et al., 2014; Teixeira et al., 2012; Rossi, 2009, 2010; Huisman et al., 2007; Birnbaum, 1983). Although we acknowledge the definitional and measurement problems associated with the concept of diversity (see Salini and Turri, 2016; Huisman et al., 2007), our approach aims to capture the effects related to the changes in the diversity of the programmatic offerings within each university (diversification) and how each university has reacted over time relative to other universities regarding the mix of disciplines it offers to students (specialisation) (Huisman, 1995). A core issue in the measurement of these indices is to account for the differences between the universities within a system and to identify the relevant dimensions of this differentiation (Huisman et al., 2015). Following Rossi (2009, 2010), we focus exclusively on the programmatic diversification of Italian universities based on the ISCED narrowed version of the fields of education and training (see UNESCO, 2014). The diversification index (Equation 1) measures the number of ISCED narrow fields of education and training offered by a university, weighted by the number of enrolled students in each field. Although the use of enrolled students may include ‘phantom’ students and drop-outs (see Teixeira et al., 2012), this is the most reliable known proxy for the distribution of the student
9
population by fields of education and the related allocation of teaching resources by universities.8 Teaching resources are set a priori, that is, before assessing the extent to which students drop out or fail to come to class. The diversification index is calculated as the inverse of the Herfindahl index:
1
𝐷𝑗 =
(1)
∑𝑖(
𝑥𝑗𝑖 ) 𝑋𝑗
2
where xij is the number of students of university j in educational field i and Xj is the total number of students of university j. The index is further normalised by assuming values between 0 and 1, as follows:
𝐷𝑗∗ =
(2)
(𝐷𝑗 −1) (𝑛−1)
where n stands for the number of fields offered. A value of D*j closer to zero means that the university diversity in terms of fields of education is minimal, whilst a value closer to 1 indicates the maximum diversity. The specialisation index (Equation 2) is a relative measure based on the programmatic offerings of other universities. It indicates whether a university has more or less than the average number of students in a specific educational field compared to other universities. The index is defined as follows:
𝑆𝑗𝑖 =
(3)
𝑥 ( 𝑗𝑖⁄𝑋 ) 𝑗 𝑥𝑖 ( ⁄𝑋)
where xji is the number of students of university j in educational field i, Xj is the total number of students of university j, xi is the number of students in educational field i offered by all universities and X is the total number of students of such universities. The specialisation indices of university j in fields i are then aggregated per university and normalised (see Rossi, 2009; Brusoni and Geuna, 2004) and aggregated as follows: (4)
8
𝑆𝑗𝑖∗
=
𝑆 −1 ∑𝑛𝑖=0 ( 𝑗𝑖 ) 𝑆 +1
2
𝑗𝑖
Our results are robust when weighting the fields by the number of courses per field of education as in Rossi (2009).
10
A value of S*ji closer to zero implies that the university is poorly specialised in terms of fields of education, whereas values closer to one imply the opposite. The concept of competition for students used in this study considers the local and national competition to account for the increased mobility of students in recent decades (Hoxby, 1998; Sà et al., 2004; Cattaneo et al., 2017a). Therefore, two different specialisation indices are considered that differ with respect to the different sets of universities used in the formula: 1) the student rolls of all Italian universities (National Specialisation); and 2) the rolls of universities located within a radius of 50 km (or at least the three closest universities if there are no universities within a radius of 50 km) from university j (Local Specialisation).
3.2.2. University competition Due to the multifaceted nature of universities, the competition dimensions are varied and relate to the universities’ rivalry in attracting students, research funding, and other funding sources (Reitz, 2017; Farhan, 2016). This study focuses on the competition for students because it is a central concern for most universities in Italy (and elsewhere), while accounting for the environmental and institutional characteristics of the universities (which influence the ability of the universities to compete for students; Wong et al., 2016). The analysis relies on the competition index developed in Cattaneo et al. (2017a), which measures the specific student competition pressure of each university9 in relation to all other national competitors (destinations), using the sum of the weighted distances from one alternative to all others. The 𝐶𝑜𝑚𝑃𝐼𝑗,𝑡 accounts for the extent to which a university is distant in both physical and operative terms from its competitors. Physical distance has a negative effect, in that each competing university has a smaller impact on the index, the higher is the distance from the university i. As far as operating distance is concerned, each university is represented by a weight such that the higher the weight is of each competitor, the higher is the impact on the index value:
(5)
𝐶𝑜𝑚𝑃𝐼𝑗,𝑡 = ∑𝑁 𝑚=1(𝑈𝑛𝑖𝑣𝑚,𝑡 ) 𝑓(𝑑𝑗,𝑚 ) 𝑚≠𝑗
9
Although the coordinates of the official location of universities are used, some universities have campuses located elsewhere. The different campuses are, however, relatively close to the main campus (the average distance is less than 6 km). The only exception is the Catholic University of the Sacred Heart, which has the main campus in Milan and an additional four campuses in other cities in Italy.
11
𝐶𝑜𝑚𝑃𝐼𝑗,𝑡 is the competitors’ proximity index for university j in year t. N stands for all other universities m in the higher education system except for university j, Univm,t reflects the characteristics of the students’ attraction to the university of destination m, and f(dj,m) represents a decay function of the Euclidean distance between university j and university m. In our analysis, the measure of students’ attraction (Univj) is the size of each university, measured by the total number of students (as in Sá et al., 2004). Although university competition for students is slowly becoming national in scope (Donina et al. 2015), it has been - and continues to be - traditionally a local phenomenon (Gu, 2012; Hoxby, 1998). Nearby universities tend to pay close attention to each other’s strategies because they have been used to strongly compete with one another to attract local students (Cattaneo et al., 2017a). This competitive proximity may significantly influence the universities’ strategies, thereby making it relevant to test the behaviour of competing universities within a 50 km radius, as recommended by Rotaris et al. (2012). This variable is designated as Local competition. In this case, 𝐶𝑜𝑚𝑃𝐼𝑗,𝑡 (5) is calculated for each university by setting:
(6)
𝑓(𝑑𝑗,𝑚 ) = 0 𝑖𝑓 𝑑𝑗,𝑚 > 50𝑘𝑚.
3.2.3. Control variables Following the literature on diversity in higher education (e.g. Lepori et al., 2014; Teixeira et al.,
2012; Rossi, 2009), several control variables that may potentially influence the dependent variable both at the university and regional levels (NUTS3, i.e., Italian ‘province’) are used. At the university level, the following control variables are included: first, the size of the university (Univ size), measured as the total number of yearly registered students (bachelor and master students), given that larger universities are more likely to diversify their offerings. Second, the differences in university profiles are controlled by two measures of research and market orientation, given that different institutional objectives and profiles affect how the educational offering is designed. The research orientation is measured by the ratio of PhD students to the total number of registered students,10 whilst the market orientation is measured by the ratio of the total amount of tuition fees in one academic year to the sum of the total tuition fees and total state-allocated funding. Universities that are research oriented are more focused on the recruitment of postgraduate students and are more reliant on research funding, but at the same time, due to their research engagement 10
Two alternative measures for university research productivity were also tested: 1) the ratio between the total number of published articles collected from the Scopus dataset per university and 2) the ratio between the total number of published articles collected from the Scopus dataset by the total number of academic staff. The replacement of the current metric used for research orientation by either of the other measures did not alter the current findings (results are available upon request).
12
benefit from better positioning in global and national rankings, subsequently attracting undergraduate students as well (see Hazelkorn, 2014). Universities with greater market orientation, because of their dependence on tuition fees for survival, are expected to be much more sensible to the programmatic needs of employers and to consider students as customers (Bowl and Hughes, 2014). Two further dummy variables are included. The variable Has medical school is used to control universities with medical schools, which are known to influence tuition fees and the total budget, increase the prestige of the university, and allow the universities that have them to offer a range of programmes in healthrelated fields that other universities are unable to (Sweitzer and Volkwein, 2009). Lastly, a control for Private univ is used to distinguish public and private universities, with 1 equalling a private university, given the latter’s higher propensity to focus on fee-generating programmes. Private universities, due to their reliance on tuition fees, are more susceptible to market shifts as well as student’s and employer’s needs (Teixeira et al., 2014). At the ‘province’ level, we consider whether a university is located in a wealthy area (Value added per capita) and the quality of life in that province (Quality of life, calculated as the relative value of the position in the ranking issued by Il Sole 24 Ore, i.e., with a maximum value of 1). These variables matter since the cultural, social, and economic value of a region is a determinant for a student’s university choices, giving at the same time to the universities located in these regions more possibilities to expand the programmatic offer and relate it with the provincial cultural, social, and economic assets (see Cattaneo et al., 2017b). The heterogeneity in local industry sectors is also accounted for because greater heterogeneity of industrial sectors usually requires the presence of more (and more diverse) universities to address the more complex skilled demands of the industry, promoting opportunities for highly skilled employment at the same time (Cowan and Zinovyeva, 2013; Mendonça et al., 2011). To control for this, a Herfindahl-Hirschman Index (HHI) of employees in different NACE (Nomenclature of Economic Activities) sectors for each province is used (Industry concentration). A low value on the HHI implies that a province has a high level of industrial diversification (the largest university province, Rome, registers the lowest value). Finally, the resident population of a province in each year is calculated because a greater population implies more local students to be recruited (Population).
3.3.
Methods
To test the relationship between competition and diversification and specialisation, OLS panel regressions in which all of the independent variables are lagged by one period are estimated. Our preference for a random-effects model over a fixed-effects specification is supported by a Hausman
13
test ( = 11.19; p = 0.131).11 Each of the regressions includes the competition variables and their square term to assess whether a curvilinear relationship exists between the competitiveness of universities and their levels of diversification and specialisation.12 The presence of structural breaks in the timing of changes at the student demand and regulatory levels is also analysed at the national level by performing a Chow breakpoint test from 2003 to 2012 to calculate the F-statistic. The most likely date for a breakpoint (i.e. structural break) is the one that produces the highest F-statistic, which in the case of our data is 2009. This allows us to separate the sample into two sub-samples: 2003/04-2007/08 and 2008/09-2011/12. This result shows that the effects of Ministerial Decree 544/2007 (a regulatory shift) commenced in the academic year 2008/09, thus overlapping the effects of the financial crisis on Italian society and inevitably the ability of families to afford tertiary education (and therefore the demand for tertiary education) (Long, 2014).
3.4.
Descriptive statistics
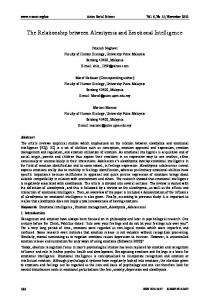
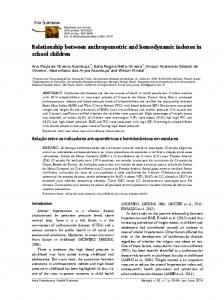
Figure 2 maps the average values of the diversification and specialisation indexes, with the latter calculated both at the national and local level (for descriptive statistics see Table 1).13 The figure shows that the indices computed at a local level indicate greater differentiation than those at the national level. Universities in the North-Western provinces show the broadest programmatic offerings, i.e., range of educational fields covered (Diversification Index). Universities located in the North-Western provinces are three times more diversified than those located in the North-Eastern provinces (15.3 vs. 5.5), two times more diversified than those located in the South (6.4) and only slightly more diversified than those located in the Centre (13.8). Universities located in the NorthWestern provinces are also more specialised than all other universities at the national level. Universities that operate in market niches, e.g., the Bra University of Gastronomic Sciences, which specialises in food culture and communication, and the Foro Italico University of Rome, which focuses solely on sport sciences, show the lowest values on the diversification index and the highest values for specialisation, which is attuned to their specialised disciplinary focus.
11
Fixed-effects estimations qualitatively support our results. The results are available on request. Due to the similarity of the results, the regressions that only test the linear relationship between competition and differentiation are not included in this study. Tables are available upon request. 13 Overall, Italian universities changed their programmatic offering during 2004-2012 by introducing a total of 85 new fields and withdrawing seven. For example, the University of Reggio Calabria introduced new courses in two different fields, art and social and behavioural science, and discontinued courses in business administration, while the University of Basilicata increased its programmatic offerings by adding courses in four different fields: business and administration, health, personal services, and education. 12
14
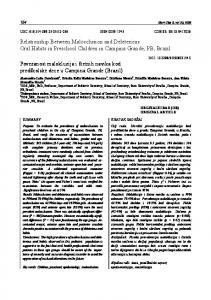
Figure 2. Maps of the diversification and specialisation indices. The figures respectively display the intensity of diversification and the national/local specialisation of each Italian university.
National specialisation
Diversification
Local specialisation
15
Considering the local specialisation of universities, clusters of specialised institutions are found in Milan, Turin, Venice, Rome, Naples, and Bari (the darker provinces in Figure 2c). The Bra University of Gastronomic Sciences is the most specialised, whilst the Foro Italico University of Rome is the least diversified university in Italy, because the neighbouring University of Rome, Tor Vergata, (within 50 km) offers a similar programme in sport and exercise sciences. The diversification and specialisation have not significantly changed over time at a national level (diversification decreased by 1% while specialisation increased by the same value). When considering only highly competitive frameworks, meaning the universities that are grouped in the most competitive dynamics (i.e. the 90% percentile), it is found that diversification decreased by 5% while specialisation increased by 8% from the pre-crisis to the post-crisis period. Table 1 reports the characteristics of the Italian universities in our sample, showing both the university-level and province-level control variables. Considering the 662 university-year observations, the average Italian university has, on average, 24,500 students, with a minimum of 127 students at the Bra University of Gastronomic Sciences in 2005 and a maximum of 147,866 students at the La Sapienza, University of Rome in 2004. PhD students represent 2% of the total number of enrolled students. Tuition fees account on average for 22% of each university’s total funding. Some universities rely mostly on state-allocated funding, such as the University of Aquila (0.651) in 2012 (the university introduced free tuition for students after the earthquake of 2009), whilst others rely almost exclusively on tuition fees, such as the University of Urbino in 2007 (99.55). Fifty-four percent of the universities have a medical school. The provincelevel variables indicate that the provinces have an average value added per capita of 23,427 €, almost 1.5 million inhabitants, and a 0.6 industrial concentration ratio.
Table 1. Descriptive statistics. The table reports the average values over the period 2003/04-2011/12 for each variable at the university and province levels. Variables
Obs.
Mean
S.D.
Min
Max
University-level variables National competition
662
19,691.73
24,672.91
2,773.648
135,549.2
Local competition
662
123. 359
183.595
0
662.756
University size (no. of students)
662
24,490.470
24,227.300
127
147,866
Private status (%)
662
17.194
37.762
0
100
Research orientation (%)
662
2.000
1.254
0
9.994
16
Market orientation (%)
662
21.926
19.138
0.651
99.553
Has medical school (%)
662
54.299
49.852
0
100
Industry concentration
662
0.638
1.012
0.056
11.774
Value added per capita
662
23,427.310
6,613.201
12,150.300
34,509.200
Population
662
1,432,718
1,303,570
126,620
3,995,250
Quality of life
662
48.787
33.316
1
107
Province-level variables
4. Results Table 2 reports the estimates of the OLS panel regressions for the four models, which model the effects of national competition (Model 1) and local competition (Model 2) on programmatic diversification, the effect of national competition on national specialisation (Model 3), and the effect of local competition on local specialisation (Model 4). Competition is included in all of the models with both its linear and square terms to account for possible curvilinear relationships.14 Potential concerns with multicollinearity are dispelled as the average variance inflation factor score is 2.9115. The most prominent finding is that no significant effect is found for national competition on either programmatic diversification or national specialisation, whilst local competition is found to be a determinant of both diversification (Model 2) and local specialisation (Model 4).16 This indicates that local competition dynamics, rather than changes measured at the national level, play a statistically significant role in programmatic diversification and specialisation. In Models 2 and 4, the effect is curvilinear, but the direction is the opposite. Specifically, the relationship between local competition and diversification is an inverted U-shape (concave), whilst the relationship between local competition and local specialisation is U-shaped (convex).
14
As the linear terms of competition are not significant, we do not report them in the Table. To test the roboustness of our specifications, we also run the model excluding the two variables having the highest VIF: Value added per capita (5.27) and Quality of life (7.94) even if these values are below the cut-off point of 10, a commonly known rule-of-thumb used in the literature (e.g. Craney and Surles, 2002; Dorman et al., 2013). All coefficients keep the same sign, and only a minimum impact on magnitude and significance is found. Therefore, the inclusion of the two variables, even if affecting slightly the model efficiency, does not change any of the outcomes, but contributes to better control for confounding effects related to potentially alternative explanations. 16 When using university diversification as a dependent variable, the local competition variable explains 13% of the variance (R-square of a reduced model with no control variables, which is 55% in the full model). When using local specialisation as a dependent variable, the variance explained is equal to 9% (51% in the full model). By contrast, - and considering the insignificance of the competition variables in the regressions - national competition only accounts for 3% of diversification variance and 2% of national specialisation variance. 15
17
Table 2. The effect of market competition on university diversification and specialisation. OLS panel model National competition National competition - square
Diversification (1) 0.014 (0.014) 0.014 (0.011)
Diversification (2)
Specialisation National (3) 0.072 (0.057) -0.032 (0.039)
Specialisation Local (4)
Local competition
-0.039*** 2.182*** (0.006) (0.525) Local competition - square 0.014** -0.553*** (0.006) (0.144) University size (ln) 0.035*** 0.037*** -0.088** -0.696*** (0.010) (0.007) (0.034) (0.121) Research orientation -0.247 -0.326 0.195 -2.795 (0.222) (0.317) (0.696) (2.870) Market orientation 0.009 0.004 0.038* 0.030 (0.009) (0.008) (0.022) (0.098) Has medical school 0.102*** 0.105*** -0.644*** -4.392*** (0.028) (0.007) (0.124) (1.039) Private university -0.071* -0.049*** 0.259* 3.873*** (0.037) (0.018) (0.135) (1.499) Industry concentration -2.746 -2.806*** -31.818 -69.382** (2.734) (0.232) (22.555) (31.136) Value added per capita -0.005*** -0.006*** -0.045 -0.039 (0.002) (0.000) (0.028) (0.046) Population -0.002* -0.002*** -0.005 0.062 (0.001) (0.001) (0.006) (0.049) Quality of life -0.103 -0.152** -0.469 -2.051 (0.183) (0.065) (0.455) (1.927) Constant 0.065 0.047 13.567*** 17.884*** (0.096) (0.058) (0.973) (1.945) R-square 0.5505 0.5729 0.4769 0.5121 Observations 662 662 662 662 Number of uni_id 75 75 75 75 Standard errors are in parentheses. ***, ** and * indicate significance at the less than 1%, 5% and 10% levels, respectively
Our analysis shows that larger universities are more diversified (less specialised), whilst private universities have, on average, higher levels of specialisation than the public universities (aligned with the results of Teixeira et al., 2014, 2012). Universities that rely more on tuition fees tend to be more specialised (at 10% significance), whilst a research orientation does not have a significant effect on the level of specialisation. In terms of the environment, higher industry concentration in a province decreases the range of educational fields offered and reduces the level of specialisation in relation to other nearby universities. Moreover, the level of diversification decreases when universities are situated in wealthier areas and in larger populations. The second analysis (Table 3) addresses whether the relationship between competition for students and university diversity changes before and after the structural break identified by implementing the Chow test (see Section 3.3). Models 1 through 4 report the results for 2003/04-2007/08, whilst Models 5 through 8 refer to 2008/09-2011/12. For both sub-periods, the relationships that were found to be
18
statistically significant in Table 2, that is, the effects of local competition on diversification and specialisation at the local level, are further analysed by period. The analysis of the 2003/04-2007/08 period shows weak evidence of a U-shaped relationship between local competition and the breadth of programmatic offerings (the coefficient for the linear term is negative, and the coefficient for the squared term is positive and statistically significant at the 10% level; Model 2), whilst the local competition effect on the specialisation index is significantly described by an inverted U-shape (Model 4). However, the results are different in the 2008/09-2011/12 period. In this case, the relationship between local competition and the diversification and specialisation indices is statistically significant and solely linear, indicating that the increasing levels of local competition led to less diversification (Model 5 and 6) and greater specialisation (Model 7).
19
5. Table 3. University diversity and competition before and after the structural changes 2004-2008 2004-2008 2009-2012 Diversification Specialisation Local Diversification (1) (2) (3) (4) (5) (6) Local competition -0.002 -0.033 0.040 1.553*** -0.030*** -0.068** (0.009) (0.020) (0.144) (0.505) (0.010) (0.027) Local competition - square 0.011* -0.418*** 0.022 (0.007) (0.134) (0.014) University size (ln) 0.032*** 0.032*** -0.402*** -0.398*** 0.056*** 0.052*** (0.008) (0.009) (0.137) (0.135) (0.012) (0.012) Research orientation -0.635** -0.710** -13.637*** -12.050*** -0.604 -0.695 (0.307) (0.289) (3.378) (3.362) (0.659) (0.681) Market orientation 0.012 0.013 -0.527 -0.516 0.065** 0.065** (0.008) (0.030) (0.344) (0.338) (0.028) (0.028) Has medical school 0.111*** 0.110*** -4.606*** -4.582*** 0.080*** 0.081*** (0.027) (0.025) (1.053) (1.058) (0.030) (0.030) Private university -0.077** -0.075* 4.712*** 4.394*** -0.049 -0.066* (0.033) (0.040) (1.533) (1.543) (0.034) (0.037) Industry concentration -2.628 -3.468 25.775 48.154 -3.431 -3.702 (2.741) (2.874) (38.186) (38.243) (4.339) (4.412) Value added per capita -0.014*** -0.014*** 0.035 0.028 -0.001 -0.001 (0.005) (0.004) (0.047) (0.046) (0.007) (0.007) Population -0.003** -0.002* 0.120** 0.088* -0.003*** -0.002* (0.001) (0.001) (0.049) (0.050) (0.001) (0.001) Quality of life -0.115 -0.135 -0.313 0.600 -0.188 -0.112 (0.207) (0.179) (2.303) (2.285) (0.289) (0.306) Constant 0.343** 0.338** 11.526*** 12.433*** -0.197 -0.192 (0.142) (0.131) (2.024) (2.027) (0.210) (0.204) R-square 0.5794 0.5970 0.5078 0.5042 0.6025 0.6003 Observations 365 365 365 365 297 297 Number of uni_id 74 74 74 74 75 75 Standard errors are in parentheses. ***, ** and * indicate significance at the less than 1%, 5% and 10% levels, respectively. OLS panel model
6.
2009-2012 Specialisation Local (7) (8) 0.814*** -0.468 (0.070) (0.921) 0.547 (0.335) -1.543*** -1.336*** (0.103) (0.237) -8.107* -5.797 (4.227) (6.273) -0.430** -0.512 (0.172) (0.482) -3.388*** -3.173*** (0.019) (0.969) 2.523*** 2.687** (0.733) (1.189) -29.508 -9.858 (62.064) (50.742) 0.005 0.009 (0.006) (0.029) 0.116*** 0.115*** (0.024) (0.036) 5.291*** 4.647* (1.359) (2.488) 22.752*** 20.042*** (1.104) (2.361) 0.5772 0.5980 297 297 75 75
20
7. Robustness checks Additional analyses were performed to test the robustness of our findings by using two alternative measures of students’ attraction (see Equation 5). This is done by relying on a measure of relative national recognition and research reputation. Considering that students’ selection of a university may include an evaluation of the image of a university to legitimate its appropriateness and acceptability to society (Suchman, 1995), the former is measured by considering its public endorsement in articles in national, regional, and local newspapers (Desai, 2008). The number of articles pertaining to each university for each year is collected from the Factiva news media database (Panel A, Table 4).17 The latter measure of students’ attraction is based instead on the number of publications of competing universities (relative to university m) collected from the Scopus dataset (Panel B, Table 4), and following the procedure recommended by Gómez et al. (2009). Potential issues concerning university identification were mitigated by considering all the different names of each university as reported in both Scopus and the EUMIDA (European University Data Collection) classification. In both cases, these alternative definitions of the competitors’ proximity index confirm our findings.
17
We rely on the Factiva news media database to collect the number of pieces published in each sample year using university name as search criterion. This number is then scaled by the maximum value (obtained by Sapienza University of Rome in 2008). This provides a measure of public endorsement from press citations in local, national, and international newspapers (Desai, 2008). Since some print articles may also discredit universities by reporting cases of corruption and scandals, we randomly select 10% of the university-year articles to have an idea of the frequency with which this occurs. On average, only 1% of this fraction reports unfavourable news.
21
Table 4. Robustness checks Panel A: University legitimacy
Competitiona Competition - square Other control variables Constant
Diversification Diversification National competition (1) -0.014* (0.007) -0.002 (0.002) YES 0.064 (0.105)
Local competition (2) -0.027*** (0.009) 0.005*** (0.000) YES 0.050 (0.059)
Specialisation National National competition (3) 0.005 (0.017) 0.001 (0.002) YES 13.207*** (0.898)
Specialisation Local Local competition (4) 2.260*** (0.729) -0.533*** (0.177) YES 9.127*** (0.717)
Panel B: University research performance Competition
-0.020 -0.018** 0.044 0.226*** (0.013) (0.007) (0.045) (0.017) Competition - square 0.002 0.002** -0.014 -0.098*** (0.002) (0.001) (0.016) (0.030) Other control variables YES YES YES YES Constant 0.045 0.078 13.296*** 17.053*** (0.081) (0.064) (0.901) (0.837) Observations 662 662 662 662 Number of uni_id 75 75 75 75 a Competition is measured at a national level in models 1 and 3, while at a local level in models 2 and 4. YES stands for the inclusion of all other control variables in all models as in Table 2. Standard errors are in parentheses. ***, ** and * indicate significance at the less than 1%, 5% and 10% levels, respectively.
8. Discussion and conclusion In recent years, universities in Italy have changed their educational offerings in response to the more complex and uncertain social and economic environments (as elsewhere in the world; Garrett-Jones and Turpin, 2012), even if doing so under constraining policy conditions that limited the establishing of new programmes. This study confirms this adaptation and its complexity. We empirically demonstrate that structural events that influence student demand, such as the financial crisis, and the actions of the state in assuming the role of regulator while transferring education costs to families have led universities to mould their strategic behaviour to the increasingly competitive environment. The phenomenon of universities adapting to the environment and adopting more risk-strategies is not new, because universities cannot afford the luxury of dismissing the effects of a fast-changing landscape that increasingly determines their survival (Barringer, 2016). In addition to confirming this phenomenon, this study adds to the literature that universities adaptively use risk-taking strategies when determining their educational offerings. Based on the findings on diversification and specialisation, one can argue that rather than simply becoming more risk-oriented in terms of their strategic offerings, universities shift from isomorphic to resource mobilisation strategies and back to
22
isomorphic strategies as they manage the uncertainty in an environment marked by its competitive intensity (see also Wilson and McKiernan, 2011). Before detailing this trend in strategic adaptability, we first focus on a key feature of competition that needs to be brought to light; namely, that it is not only the intensity of competition that influences university strategies, but also the geographical scope of the competition. The findings of this study show that from a comparative perspective, local competition, rather than national competition, affects diversification, that is, the breadth of a university’s programmatic offerings (using measures that look ‘inside’ the institution), and specialisation (using measures that look ‘outside’ the university). In addition to meeting the expectations of Rossi (2009, 2010) and Teixeira et al. (2012) concerning the existence of a relationship between competition and programmatic diversity, this finding serves to disentangle the effects of national and local competition on diversity and specialisation and contributes to a better understanding of these effects. The effect of local competition on the programmatic diversity and specialisation strategies of universities highlights the relevance of the local environment and supports the reasoning that the effects of individual institutional strategies on systemic diversity should be explored (Fumasoli and Huisman, 2013). This also provides an opportunity to extend this approach to the strategic interactions of nearby universities in competitive environments (see also Widiputera et al., 2017). With respect to the strategic adaptability of universities, in terms of the competitive environment, we find that the relationships between local competition and diversification and between local competition and specialisation show statistically significant and inverse correlations. Both phenomena – as we interpret it - reflect the strategic behaviour of universities in attempting to differentiate themselves when faced with strong competitive pressure from their rivals. This suggests that universities that follow a specialisation strategy opt to reduce the programmatic breadth of their offerings (thus avoiding internal diversification) and that the opposite strategy applies when they seek to broaden their programmatic offerings. This also indicates that universities that face greater exposure to competition can become flexible organisations, albeit not without tensions, in adapting to the changing competitive environment. In the process, the universities demonstrate multiple concurrent logics, which is typical of hybrid organisations (Upton and Warshaw, 2017). A second finding is that the relationships between local competition and differentiation and local competition and specialisation assume a U-shaped trend. Increasing local competition reduces the programmatic diversification of universities up to a threshold, after which competition has the reverse effect on differentiation. This result implies that low levels of local competition are associated with higher levels of diversification, moderate levels of local competition are associated with less diversification, and high levels of local competition lead to increasing diversification. The 23
relationship between local competition and specialisation assumes the opposite trend in that low levels of local competition are associated with lower levels of specialisation, moderate levels of local competition are associated with increasing specialisation, and high levels of local competition are associated with decreasing specialisation. It is important to note that rather than examining whether specialisation dominates diversification (or vice-versa), this study seeks to identify the turning points for both factors as a result of the pressure of competition. In this context, our analysis shows that the equilibria between local competition and diversification and local competition and specialisation change over time. We identify a break at the end of the first decade of the 21st century, which corresponds with the initial effects of the financial crisis and the concurrent effects of the change to the regulatory environment, showing that the homogenisation strategy with which universities had traditionally used to manage high levels of competition is being increasingly abandoned over time (as shown in Table 3). Italian universities now have less autonomy than in the past in creating new courses, due to the national policy (as argued by Donina et al., 2015). At the same time, the universities have been affected by the financial crisis, which has influenced students’ decision-making (Cattaneo et al., 2017b). Together, the two phenomena have led universities to specialise and differentiate more, so that they can aggregate their resources to satisfy the regulatory constraints while attempting to provide students with better quality programmes to make them more attractive to the labour market (the alignment between programme offerings and the labour market has become a policy priority and a ‘market’ opportunity for universities that rely on tuition fees as a source of revenue; see Chan and Lin, 2015). Our results have important implications for policy makers and university managers. The debate over the diversification of higher education remains critical given the societal need to respond to the complex modern challenges that require the knowledge and skills that a diversified higher education system seems better prepared to provide (Teixeira et al., 2014). Our analysis shows how universities respond strategically to the actions of other (competing) universities and the changing characteristics of the environment, thereby contributing to a better understanding of how diversity is influenced by competitive regimes and the relevance of the geographical scope of this competition. The findings of this study suggest that institutional competitive positioning is an important mechanism linking the organisational and systemic dimensions that is capable of influencing the programmatic diversity of higher education systems. In addition to responding to the pressure from the central government, which has changed its stance vis-à-vis universities (due to the increasing prevalence of neo-liberal thinking and reforms (Olssen, 2016)), universities are responsive to the actions of their competitors and shift their strategies according to the complex interaction between their capabilities (which may vary according to the type of university and reputation; see Thoenig and Paradeise, 2016) and the 24
dynamic and evolving market competition (even if this competition takes place in quasi-markets (Marginson, 2013)). This suggests that in dealing with the shifting environment, policy makers and university managers need to replace their reliance on universal formulas with adaptable strategies to cope with the changing dynamics of competitive markets and the related uncertainties while maintaining their institutional integrity (Heitor and Horta, 2016). As with all empirical studies, this study is not devoid of limitations. We acknowledge that the overlapping phenomena limit our ability to disentangle the ultimate causes of the effects under observation. Our analysis is unable to address whether and how the trends towards specialisation and diversification dominate one another at different levels of competition. Moreover, whilst there is evidence of the changing dynamics in the relationship between competition and diversification and specialisation, our analysis was unable to disentangle the effects that the Ministerial Decree 554/2007 and the financial crisis may have had on this relationship. Dealing with both issues would require using ad-hoc methods and a new, more complete dataset. We leave this for future research.
References Agasisti, T. and Haelermans, C. (2016). Comparing efficiency of public universities among European countries: Different incentives lead to different performances. Higher Education Quarterly 70(1): 81-104. Antonowicz, D., Kwiek, M. and Westerheijden, D.F. (2016). The government response to the private sector expansion in Poland. In de Boer, H., File, J., Huisman, J., Seeber, M., Vukasovic, M., and Westerheijden, D.F (Eds.) Policy Analysis of Structural Reforms in Higher Education. Palgrave. (pp. 119-138). Barringer, S.N. (2016). The changing finances of public higher education organizations: Diversity, change, and discontinuity. Research in the Sociology of Organizations 46: 223-263. Birnbaum, R. (1983). Maintaining diversity in higher education. San Francisco: Jossey-Bass. Bowl, M. and Hughes, J. (2014). Fair access and fee setting in English universities: what do institutional statements suggest about university strategies in a stratified quasi-market? Studies in Higher Education 41(2): 269-287. Brusoni, S. and Geuna, A. (2004). Specialisation and Integration: Combining Patents and Publications Data to Map the ‘Structure’ of Specialised Knowledge, in U. Schmoch (Ed.) Science and Technology Handbook, London: Kluwer, pp. 733–758. Buckner, E.S. (2016). The changing discourse on higher education and the nation-state, 1960– 2010. Higher Education, 1-17. DOI: 10.1007/s10734-016-0056-2 25
Cattaneo, M., Malighetti, P., Meoli, M. and Paleari, S. (2017a). University spatial competition for students: The Italian case. Regional Studies, 51(5): 750-764. Cattaneo, M., Horta, H., Malighetti, P., Meoli, M. and Paleari, S. (2017b). Effects of the financial crisis on university choice by gender. Higher Education 74(5): 775-798. Chan, S.J. and Lin, L.W. (2015). Massification of higher education in Taiwan: Shifting pressure from admission to employment. Higher Education Policy 28(1): 17-33. CNVSU.
(2011).
Undicesimo
Rapporto
sullo
Stato
del
Sistema.
See
http://www.cnvsu.it/_library/downloadfile.asp?id=11778 [accessed online on 17/10/2017].
Codling, A. and Meek, V.L. (2006). Twelve propositions on diversity in higher education. Higher Education Management and Policy, 18(3): 1-24. Cowan, R. and Zinovyeva, N. (2013). University effects on regional innovation. Research Policy 42(3): 788-800. Craney T.A. and Surles J. S. (2002) Model-Dependent Variance Inflation Factor Cutoff Values, Quality Engineering, 14(3): 391-403. Desai, V.M. (2008). Constrained growth: How experience, legitimacy, and age influence risk taking in organizations. Organization Science, 19(4): 594-608. DiMaggio, P.J. and Powell, W.W. (1983). The iron cage revisited: Institutional isomorphism and collective rationality in organizational fields. American Sociological Review 48(2): 147-160. Donina, D., Meoli, M. and Paleari, S. (2015). Higher education reform in Italy: Tightening regulation instead of steering at a distance. Higher Education Policy 28(2): 215-234. Dormann, C. F., Elith, J., Bacher, S., Buchmann, C., Carl, G., Carré, G., ... and Münkemüller, T. (2013). Collinearity: a review of methods to deal with it and a simulation study evaluating their performance. Ecography, 36(1), 27-46.Enders, J., de Boer, H. and Weyer, E. (2013). Regulatory autonomy and performance: the reform of higher education re-visited. Higher Education 65(1): 5-23. Erhardt, D. and von Kotzebue, A. (2016). Competition unleashed: Horizontal differentiation in German higher education. Tertiary Education and Management 22(4): 333-358. Farhan, B.Y. (2017). Examining competition in Ontario’s higher education market. Interchange 48(1): 71-95. Farhan, B.Y. (2016). Competitive behavior in publicly funded academic institutions. Interchange 47(4): 357-373. Ferlie, E., Musselin, C. and Andresani, G. (2008). The steering of higher education systems: A public management perspective. Higher Education 56(3): 325-348.
26
Frey, C.B. and Osborne, M.A. (2017). The future of employment: How susceptible are jobs to computerization? Technological Forecasting and Social Change 114: 254-280. Fumasoli, T. and Huisman, J. (2013). Strategic agency and system diversity: Conceptualizing institutional positioning in higher education. Minerva 51(2): 155-169. Garrett-Jones, S. and Turpin, T. (2012). Globalization and the changing functions of Australian universities. Science, Technology and Society 17(2): 233-274. Gómez, I., Bordons, M., Fernández, M. and Morillo, F. (2009). Structure and research performance of Spanish universities. Scientometrics, 79(1): 131-146. Gu, J. (2012). Spatial recruiting competition in Chinese higher education system. Higher Education 63: 165-85. Hazelkorn, E. (2014). Reflections on a decade of global rankings: What we’ve learned and outstanding issues, European Journal of Education 49(1): 12-28. Heitor, M.V. and Horta, H. (2016). Reforming higher education in Portugal in times of uncertainty: The importance of illities, as non-functional requirements. Technological Forecasting and Social Change 113(Part B): 146-156. Hoxby, C.M. (1998). The effects of geographic integration and increasing competition in the market for college education, Competitive new world: American colleges in the market. Princeton: Princeton University Press. Huisman, J. (1995). Differentiation, Diversity and Dependency in Higher Education. Utrecht: Lemma. Huisman, J., Meek, L. and Wood, F. (2007). Institutional diversity in higher education: A cross national and longitudinal analysis. Higher Education Quarterly 61(4): 563-577. Huisman, J., Lepori, B., Seeber, M., Frølich, N. and Scordato, L. (2015). Measuring institutional diversity across higher education systems. Research Evaluation 24 (4): 369-379. Jongbloed, B. (2003). Marketisation in higher education: Clark’s triangle and the essential ingredients of markets. Higher Education Quarterly 57(2): 110–135. Loreau, M. and de Mazancourt, C. (2013) Biodiversity and ecosystem stability: a synthesis of underlying mechanisms. Ecology Letters 16(s1): 106-115. Lepori, B., Huisman, J. and Seeber, M. (2014). Convergence and differentiation processes in Swiss higher education: an empirical analysis. Studies in Higher Education 39(2): 197-218. Long, B. (2014). The financial crisis and college enrollment: How have students and their families responded? In Brown, J. and Hoxby, C. (Eds.). How the great recession affected higher education. Chicago: University of Chicago Press.
27
Marginson, S. (2013). The impossibility of capitalist markets in higher education. Journal of Education Policy 28(3): 353-370. Mayo, P. (2009). Competitiveness, diversification and the international higher education cash flow: The EU’s higher education discourse amidst the challenges of globalization. International Studies in Sociology of Education 19(2): 87-103. Mendonça, J., Baptista, R. and Lima, F. (2011). Creation of higher education institutions and entry of knowledge based firms. Research Policy 40(5): 751-760. Minelli E., Rebora G. and Turri M. (2012). Waiting for the market: Where is the Italian university system heading? Higher Education Policy 25(1): 131-45. Nixon, E., Scullion, R. and Hearn, R. (2016). Her majesty the student: Marketized higher education and narcissistic (dis)satisfactions of the student-consumer. Studies in Higher Education, DOI: 10.1080/03075079.2016.1196353 Olssen, M. (2016). Neoliberal competition in higher education today: Research, accountability and impact. British Journal of Sociology of Education 37(1): 129-148. Pinheiro, R., Normann, R. and Johnsen, H.C. (2016). External engagement and the academic heartland: The case of a regionally-embedded university. Science and Public Policy 43(2): 787797. Rasmussen, P. (2014). Accreditation and expansion in Danish Higher Education. Nordic Studies in Education 34(3): 201-212. Rebora, G. and Turri, M. (2009). Governance in Higher Education: An Analysis of the Italian Experience. In Huisman, J. (Ed.) International Perspectives on the Governance of Higher Education. Alternative Frameworks for Coordination. Abingdon: Routledge, pp. 13-31. Rebora, G. and Turri, M. (2011). Critical factors in the use of evaluation in Italian Universities. Higher Education 61(5): 531–544. Reichert, S. (2009). Institutional diversity in European higher education. EUA, Brussels. See http://www.eua.be/Libraries/publications-homepage-list/EUA_Instit_Diversity_web.pdf?sfvrsn=6
[accessed online on 17/10/2017] Reitz, T. (2017). Academic hierarchies in neo-feudal capitalism: How status competition processes trust facilitates the appropriation of knowledge. Higher Education, DOI: 10.1007/s10734-0170115-3 Rossi, F. (2010). Massification, competition and organizational diversity in higher education: Evidence from Italy. Studies in Higher Education 35(3): 277-300. Rossi, F. (2009). Increased competition and diversity in higher education: An empirical analysis of the Italian university system. Higher Education Policy 22(4): 389-413.
28
Rotaris, L., Danielis, R. and Rosato, P. (2012). Value of travel time for university students: A revealed/stated preference analysis. Journal of Environmental Economics and Policy 1(2): 195215. Sà, C., Florax, R. J. and Rietveld, P. (2004). Determinants of the regional demand for higher education in the Netherlands: A gravity model approach. Regional Studies 38(4): 375-92. Sahlin, K. and Wedlin, L. (2008). Circulating ideas: Imitation, translation, editing. In Greenwood, R., Oliver, C., Suddaby, R. and Sahlin, K. (Eds). The SAGE Handbook of Organizational Institutionalism. 218–242. Thousand Oaks: SAGE Publications. Salini, S. and Turri, M. (2016). How to measure institutional diversity in higher education using revenue data. Quality and Quantity 50(3): 1165-1183. Scott, W.R. and Blag, M. (2016). The changing ecology of U.S. higher education: An organization field perspective. Research in the Sociology of Organizations 46: 25-51. Suchman, M.C. (1995). Managing legitimacy: Strategic and institutional approaches. Academy of Management Review, 20(3): 571–610. Sweitzer, K. and Volkwein, J.F. (2009). Prestige among graduate and professional schools: comparing the US news’ graduate school reputation ratings between disciplines. Research in Higher Education 50: 812-836. Tavares, O. and Cardoso, S. (2013). Enrolment choices in Portuguese higher education: Do students behave as rational consumers? Higher Education 66(3): 297-309. Teixeira, P., Rocha, V., Biscaia, R. NS Cardoso, M.F. (2014). Policy changes, marketisation trends and spatial dispersion in European higher education: Comparing public and private sectors. Cambridge Journal of Regions, Economy and Society 7(2): 271-288. Teixeira, P.N., Rocha, V., Biscaia, R. and Cardoso, M.F. (2012). Competition and diversity in higher education: An empirical approach to specialization patterns of Portuguese institutions. Higher Education 63(3): 337-352. Thoenig, J.C. and Paradeise, C. (2016). Strategic capacity and organizational capabilities: A challenge for universities. Minerva 54(3): 293-324. Tisdell, C.A. (2013). Competition, Diversity and Economic Performance. Cheltenham: Edward Elgar. Turri, M. (2016). The difficult transition of the Italian university system: Growth, underfunding and old reforms. Journal of Further and Higher Education 40(1): 83-106. Upton, S. and Warshaw, J.B. (2017). Evidence of hybrid institutional logics in the US public research university. Journal of Higher Education Policy and Management 39(1): 89-103.
29
UNESCO. (2014). ISCED Fields of Education and Training 2013. Montreal: UNESCO Institute of Statistics. van der Wurff, R. and van Cuilenburg, J. (2009). Impact of moderate and ruinous competition on diversity: the Dutch television market. Journal of Media Economics 14(4): 213-229. van Vught, F. (2008). Mission diversity and reputation in higher education. Higher Education Policy 21(2): 151-174. Widiputera, de Witte, K., Groot, W. and van den Brink, M. (2017). The attractiveness of programmes in higher education: An empirical approach. European Journal of Higher Education. dx.doi.org/10.1080/21568235.2016.1275976 Wilson, D. and McKiernan, P. (2011). Global mimicry: Putting strategic choice back on the business school agenda. British Journal of Management 22(3): 457-469. Wong, P., Ng, P.M.L., Mak, C.K.Y. and Chan, J.K.Y. (2016). Students’ choice of sub-degree programmes in self-financing higher education institutions in Hong Kong. Higher Education 71(4): 455-472.
30