WETLANDS, Vol. 23, No. 4, December 2003, pp. 701–708 q 2003, The Society of Wetland Scientists
THE RELIABILITY OF MIRE WATER pH MEASUREMENTS—A STANDARD SAMPLING PROTOCOL AND IMPLICATIONS TO ECOLOGICAL THEORY Teemu Tahvanainen and Teemu Tuomaala Department of Biology University of Joensuu P.O. Box 111 FIN-80101 Joensuu, Finland E-mail:
[email protected] Abstract: The frequency distributions of mire water pH are often bimodal in data sets covering the poorrich gradient in vegetation. Area-representative data sets of pH could indicate ecologically meaningful differences between regions, independent of differences in mire classification. Comparisons of pH results are, however, hindered by differences in water sampling methods. We conducted a field survey to assess variation of water pH related to the poor-rich gradient, the water-table-depth gradient, time of day, aeration of samples, and different methods of obtaining water samples. Considerable diurnal and fine-scale vertical and horizontal variation of pH was found in samples obtained by depressing from bryophyte capitula or directly from open water surfaces. A diurnal pattern of lower pH at night and higher at day was found, typically with a 0.5– 1.0 pH unit range. Open surface-water samples showed a wide range of fine-scale horizontal variation (pH 4.6–8.0) in Scorpidium-flarks, while pipe-well samples were less variable both in unaerated samples (pH 5.0–5.3) and in aerated samples (pH 6.6–7.3). The frequency distributions of pH of both unaerated and aerated pipe-well samples were bimodal in a data set covering the transition from rich to poor fen. The higher mode was located at pH 5.6 for unaerated samples and at pH 7.6 for aerated samples. The results conformed to the hypothesis of a bimodal frequency distribution of water pH along the poor-rich gradient. A combination of measurements from unaerated and aerated water samples obtained from pipe wells is suggested as a standard method for comparable pH measurements in mires. Key Words: bimodal frequency distribution of pH, bryophytes, diurnal variation, Finland, peatland, poorrich gradient, Sphagnum, water-table-depth gradient
from the minerogenous water flow, and the vegetation becomes dominated by ombrotrophic species. The transition between rich and poor fen vegetation is often distinctly short in duration, as indicated by the relatively transient existence of moderately poor (transitional) fen indicator species of plants in peat profiles (Gorham and Janssens 1992b, Kuhry et al. 1992, Kuhry et al. 1993). Also in the siliceous bedrock area of eastern Finland, similar peat profiles are found, although in some cases moderately poor fen vegetation has persisted for considerably long periods (Tolonen 1967). Chemical instability of intermediate pH (4.5– 6.5) is the key mechanism causing the relative rarity of moderately poor fen vegetation. The vertical development towards ombrogenous hydrology reduces the flushing rate and the mineral buffering capacity of the surface water, leading to acidification by dissolved organic matter and cation exchange by peat and plants. Organic acids are responsible for the extreme acidity of bog waters (Hemond 1980). Cation exchange contributes to the acidity as a primary source of protons, especially in poor fens (Vitt 2000). Comparable acid-
INTRODUCTION Frequency distributions of surface-water pH in mires (peatlands) with two distinctly separate modes are reported in several studies in North-America (Gorham et al. 1984, Gorham et al. 1985, Gorham et al. 1987, Gorham and Janssens 1992a, Vitt 2000), in the British Isles (Proctor 1995), and in Scandinavia (Økland et al. 2001b, Sjo¨rs and Gunnarsson 2002). The bimodality of water pH reflects the functioning of two separate buffer systems: organic acids (pH mode around 4) and bicarbonate alkalinity (pH mode around 7), while intermediate pH (4.5–6.5) is weakly buffered and therefore rarer. The bimodality of water pH in mires is ecologically correlated with the bipartition in the dominant bryophyte flora (Amblystegiaceae versus Sphagnum) and with the hydrotopographical division into minerogenous and ombrogenous hydrologic conditions (e.g., Gorham et al. 1985, Gorham and Janssens 1992a, Vitt 2000). In many peatlands, as peat accumulates vertically, the mire surface eventually becomes isolated 701
702 ification may also occur without the vertical isolation by downstream spatial succession when the mineral buffering capacity of the minerogenous water is weak (Tahvanainen et al. 2002). The shape of the pH frequency distribution histogram from any particular area is therefore dependent on the landscape-scale dominance patterns between the different developmental stages of mires and the quality of the water sources. A bimodal frequency distribution of pH is expected in data sets covering the poor-rich vegetation gradient in approximately equal proportions. Comparisons of pH results from different areas could contribute to mire ecological theory and classification. Recently, Wheeler and Proctor (2000) proposed that the division between acidic and near neutral conditions should be recognized as the natural bipartition between bogs and fens, instead of the hydrologic division to ombrogenous and minerogenous mires. Their argument was based on the bimodal frequency distribution of water pH. Økland et al. (2001a) criticized the new paradigm and argued that the pH frequency distributions in different data sets are not consistent. In some cases, the high pH mode is located near pH 6.0 (Gorham et al. 1984, Gorham et al. 1985, Gorham et al. 1987, Sjo¨rs and Gunnarsson 2002); in others it is closer to pH 7.0 (Gorham and Janssens 1992a, Proctor 1995, Vitt 2000). Økland et al. (2001b) found a bimodal frequency distribution of pH from Norwegian spruce swamp forests that depicted a high pH mode at pH 5.0. The differences between the studies are suggested to result from ecological differences between study areas, but comparisons are hindered by the lack of methodological comparability. The studies presenting the bimodal pH frequency distributions, as well as the discussions by Wheeler and Proctor (2000) and Økland et al. (2001a), have paid little attention to the possible effects of sampling methodology on water pH. This is surprising, as there has been very little of consistency in the water sampling methods among mire ecological studies. For example, Gorham et al. (1985) wrote: ‘‘In wetter sites along the transect, samples were taken from large pools and small puddles. . . In drier sites the water logged moss surface was depressed and the sample bottle was filled by water expressed from the moss. In still drier sites a pit was dug to beneath the water surface. . . ’’. Økland et al. (2001a), on the other hand, refer to a data set that was sampled from pipe wells (Økland et al. 2001b). Ideally, every sampling method should provide representative and comparable samples. This has been found difficult in the case of mire water sampling for pH measurements. Shotyk (1988) reviewed the long history of studies concerning mire water chemistry. He wrote: ‘‘Despite the apparent simplicity, meaningful pH measurements are difficult to
WETLANDS, Volume 23, No. 4, 2003 perform. Factors affecting the apparent pH of peatland waters include the presence of colloidal and dissolved organic materials, volatile acids and oxidizable substances, the time of day and temperature of the water at the time of sample collection, and the container used for storing samples. In too many studies of peatland water chemistry, not enough attention has been paid to analytical methodology.’’ Even though pH is frequently recognized as the single most important chemical factor in mires, attempts to compare different water sampling techniques are rare. We conducted a field survey to demonstrate effects of water sampling methodology on pH measurements along a vegetation gradient from moderately rich to extremely poor fen. We collected three separate data sets to address different aspects of variation in pH related to the degree of aeration of samples, time of day, and fine-scale vertical and horizontal gradients. The purpose of these analyses was to test the hypothetical bimodality of pH along the vegetational poor-rich continuum, to quantify the bias of pH measurements caused by variable sampling methods, and to provide background for a standard protocol for surface-water sampling in mires. The main question we try to answer is: The manner in which to collect comparable and representative samples for meaningful pH measurements of mire water. STUDY AREA The field work was conducted in the mire Ha¨rko¨suo (648 129 N, 308 269E, elevation 240 m above sea level) in north-eastern Finland. The study area is located in the southern aapa mire region in the middle-boreal climatic/phytogeographical zone. The mean annual rainfall is 600 mm, and the mean annual temperature is 11.2 8C. Detailed description of the study area, including detailed water chemistry data, is given by Tahvanainen et al. (2002). METHODS All pH measurements were performed with a Consort P501 pH meter and a Consort SP10B pH electrode. The meter was calibrated with pH 4.00 and pH 7.00 standards, and the pH of 3.00 standard was checked routinely (mean pH 3.04) (standards Reagecon). The nomenclature of bryophytes follows So¨derstro¨m and Hedena¨s (1998). Data Set I A special study area of 0.5 ha (50 3 100 m) was chosen that included vegetation transition from moderately rich to extremely poor fen. Some indicator spe-
Tahvanainen & Tuomaala, MIRE WATER pH cies that define the transition steps (as separated by . signs) are as follows (from rich to poor): Tomentypnum nitens (Hedw.) Loeske, Pseudocalliergon trifarium (Web. & Mohr) Loeske, . Scorpidium scorpioides (Hedw.) Limpr., Sphagnum warnstorfii Russ., . Loeskypnum badium (Hartm.) Paul, Warnstorfia sarmentosa (Wahlenb.) Hedena¨s, . Sphagnum platyphyllum (Braithw.) Warnst., Sphagnum subsecundum Nees, . Sphagnum annulatum Warnst., Sphagnum majus (Russ.) C. Jens. This area was supplied with a 10-m grid of sampling sites. It was supplemented with nine sites in a 20-m interval grid on the adjacent extremely poor fen area dominated by Sphagnum papillosum Lindb. and Sphagnum jensenii H. Lindb., to cover the whole poor-rich gradient found in the mire. Thus, the total number of samples was 75. At each site, a pipe well (diameter 20 mm, PVC) was inserted in surface peat in May 2001. The pipe wells were densely perforated (with 3 mm holes) for a 4-cm stretch that was located below the water-table level. The wells were emptied at least three times during the summer and two hours prior to sampling. The sampling was performed on 26 July 2001, at noon. Samples were taken with a vacuum syringe and stored in 30-ml plastic bottles, fully filled. The field measurements (unaerated) of pH were conducted within two hours at the camp, near the study area. The next day, the samples were taken to a laboratory and aerated with synthetic air containing 371 ppm CO2 for 10 minutes in 24 8C, after which pH was remeasured. Data Set II The effect of sampling method on pH and the finescale spatial variation of vegetation and pH were assessed using a 38-m transect across the string-flark patterns in the moderately rich fen. The transect was leveled with a leveling instrument. The variation in vegetation along the transect was described by use of 30 vegetation plots (25 x 25 cm) placed selectively at representative points to cover the whole range of vegetation and microtopographic variation. Ten pipe wells were inserted along the transect, every other on a hummock and every other on a hollow. Each well was supplied with a perforated 2-L plastic bottle that was located below the water-table level. Water samples were collected and treated as in data set I. In addition, pH was measured in the field from ‘superficial water samples’ (n 5 61). These samples were, in the case of hummock and lawn sites, taken by squeezing from the capitula of the dominant bryophyte species. In flarks, where bryophytes were floating or submerged, pH was measured directly in open surface water. Field estimates of percent cover of all species in all plots were analyzed by detrended correspondence
703 analysis (DCA; Hill and Gauch 1997). Standard options were used for detrending and rescaling of axes, and the option of downweighting of rare species was used. The DCA was performed with PC-ORD version 4.09 (McCune and Mefford 1999). The DCA scores were compared with Kendal correlation coefficients to position along the transect, superficial water pH, water-table depth (WTD), surface temperature, species richness, and the total covers of Sphagna, Bryidae, and vascular plants. Data Set III In our search for diurnal variation in pH, we sampled superficial water at 11 sites at 2-hour intervals for 52 hours on 24–26 July 2001 (286 samples). The sampling sites were four S. scorpioides flarks (sites 1 to 4), two S. platyphyllum flarks (sites 5 and 6), and a Sphagnum annulatum flark (site 7). In addition, water samples from capitula of S. annulatum (site 8), S. papillosum (site 9), S. warnstorfii (site 10), and Sphagnum fuscum (Schimp.) Klinggr. (site 11) were taken. Sites 1–4, 10, and 11 were located in the moderately rich fen around the end of the transect (data set II), and sites 5–9 were located at a moderately poor fen 100 meters apart. At sites 8–11, large homogenous monospecific stands were chosen, and a 20-ml water sample was taken by squeezing the capitula. On each sampling occasion, two previously undisturbed ‘handfuls’ of bryophyte capitula were used to get one composite sample. Samples were obtained from the flarks (sites 1–7) with a vacuum syringe through a 50-cm-long, flexible plastic tube. The tube head was carefully placed in water in between the loose bryophyte canopy, carefully avoiding any disturbance. Care was taken to avoid aeration of samples, and pH was measured within 30 minutes at the camp, near the study area. RESULTS Frequency Distributions of pH—Data Set I Unaerated, field-measured pH ranged from 3.67 to 6.32, while pH after aeration ranged from 3.99 to 7.79. In all cases, pH rose after aeration. The change was usually negligibly small at around pH 4.0 but very remarkable at higher pH. However, the three most acidic samples changed in pH from 3.7 to 4.1, corresponding to a 120 meq/l change in proton concentration. The change after aeration averaged 1.5 pH units when field measured pH was above 4.6. The maximum change in pH units was from 4.27 to 6.75 (54 meq/l change). The frequency distributions of both unaerated and aerated sample pH were distinctly bimodal (Figure 1).
704
WETLANDS, Volume 23, No. 4, 2003
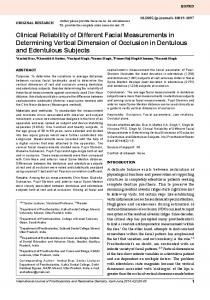
Figure 2. Two-hour monitoring of water pH in the moderately rich fen (sites 1–4, 10, 11) and the moderately poor fen (sites 5–9) on 24–26 July 2001 (data set III). At sites 1– 7, samples were obtained directly from open surface water, while at sites 8–11, samples were taken by squeezing from Spagnum capitula (*). The lower two parts of the graph represent weather observations connected to each sampling occasion. Duration of dark hours and rainfall are marked with two-head arrows.
Figure 1. Frequency distribution of mire water pH of (A) unaerated and (B) aerated samples, obtained from pipe wells along a gradient from rich to poor fen (data set I).
The lower mode was located at pH 4.2 in both unaerated and aerated pH frequency distributions. The antimode of unaerated pH was at pH 4.4, while in aerated pH, there was a wide gap with few observations around pH 5.4. The upper mode of the pH frequency distribution moved from pH 5.6 to pH 7.6 after aeration. Considering the frequency distribution of H1 concentration, there was only one dominant mode of low concentrations and a long tail towards high concentrations, both in cases of unaerated and aerated samples (data not shown). Fine-Scale Spatial Variation of pH and Vegetation— Data Set II The pipe-well samples showed very little variation in pH along the transect in both unaerated and aerated samples; ranges of pH were 5.01–5.31 for unaerated and 6.57–7.33 for aerated samples (Figure 2). The superficially collected water samples had extremely wide pH ranges: 4.94–7.96 for open water surface samples and 3.76–6.20 for samples depressed from bryophyte capitula. The first DCA-axis reflected the topographic transition from wet Scorpidium-flarks to high S. fuscumdominated hummocks (Table 1). Strong, significant
correlations (Kendal J) were found between the scores of the first DCA-axis and WTD (20.72), superficial water pH (0.59), the total cover of Sphagna (20.68), and the proportion of open surface as mud-bottom or litter (0.55). Also, species richness (20.44), temperature at 10-cm depth (20.38), and the total cover of vascular plants (20.33) correlated significantly with the first DCA-axis. The second DCA-axis separated the Sphagnum-dominated plots from the Bryidae-dominated at intermediate WTD levels. The second axis correlated significantly with the total cover of Sphagna (0.33) and the total cover of Bryidae (20.41). The position along the transect was not significantly correlatTable 1. Summary of DCA with Kendall (t) correlation coefficients between two first DCA axes and environmental variables, percent cover of the main functional species groups, and species richness. * 5 p , 0.05. Axis Eigenvalue Position along the transect Water-table depth Superficial-water pH Temperature, surface Temperature, 10-cm depth Sphagnum %-cover Bryidae %-cover Vascular-plant %-cover Open-surface %-cover Number of species
DCA1 0.86
DCA2 0.33
0.20 20.72* 0.59* 20.06 20.38* 20.68* 0.21 20.33* 0.55* 20.44*
0.17 0.12 0.04 0.22 0.16 0.33* 20.41* 0.15 20.22 20.02
Tahvanainen & Tuomaala, MIRE WATER pH
705 er, these explained on average 57 % (46–75 %) of the variation in pH at different sites in linear regressions. DISCUSSION
Figure 3. Variation of water pH along a transect in a moderately rich fen (data set II). Open circles represent pH of superficial water samples taken directly from open water or, in the case of drier surfaces, by squeezing water from bryophyte capitula. Solid symbols represent the pH of pipe-well water samples: circles, unaerated; squares, aerated; diamonds, unaerated, sampled on a separate occasion in July 1999. The lower part of the graph represents the elevation gradient of the water-table level (thick line) and the peat surface (thin line) along the transect.
ed with the first or second DCA-axes, indicating that there were no significant continuous trends in vegetation composition along the transect. Diurnal Variation—Data Set III There was considerable diurnal variation in pH at all sites (Figure 3). pH was consistently higher at day than at night. The start of pH monitoring was preceded by a cloudy morning, and the mean pH in the Scorpidium-flarks (sites 1 to 4) was 5.50 at 13:00. At the same hour, on the next day, following hours of clear sunshiny weather, the mean pH was 5.99. On the third day, pH rose in the morning but started to fall as rain commenced and was on average 5.34 at 13:00. In the three moderately poor fen flarks (sites 5 to 7), the daily mean pH values at 13:00 were 3.89, 4.64, and 4.29, respectively. The same pattern reappeared in the samples squeezed from bryophyte capitula. Of these, S. fuscum and S. annulatum samples had similar pH, and S. papillosum and S. warnstorfii had similar pH, distinctly higher than the former two. During the first night, mean pH in the Scorpidiumflarks (sites 1 to 4) fell to 4.76 at 7:00, and in the second night to 5.10 at 3:00. In the three moderately poor fen surface-water sampling sites (sites 5 to 7), the pH minima at night were 3.55 at 5:00 and 3.91 at 3: 00, respectively. No direct measurements of illumination were performed, but the variation in pH could be clearly connected with the observations of air and water temperature, cloudiness, and precipitation (Figure 3). Togeth-
The bimodality of pH in data set I conformed to the hypothetical expectation, as the data covered a distinct transition from moderately rich to extremely poor fen vegetation. In this case, both unaerated and aerated pH had lower modes at pH 4.2, while after aeration, the high pH mode moved from pH 5.6 to 7.6. The high pH mode of aerated samples conformed to the results from lake waters (Adams et al. 1991), where pH is rather constantly buffered to around 7.5 in the alkalinity range (150 to 350 meq/l) found in the moderately rich fen of the current study area by Tahvanainen et al. (2002). The wide gap of intermediate pH values (antimode) also exactly conformed to the steep change in pH between 4.5 and 6.5 in the alkalinity range from 225 to 125 meq/l in lake waters, where the bicarbonate buffer system collapses (Adams et al. 1991). The high modes of the bimodal frequency distributions of mire water pH reported in previous studies (Gorham et al. 1984, Gorham et al. 1985, Gorham et al. 1987, Gorham and Janssens 1992a, Proctor 1995, Vitt 2000, Økland et al. 2001b, Sjo¨rs and Gunnarsson 2002) are located at lower pH levels (5.0–7.0) than expected. The results indicate that the discrepancies between the pH frequency distributions from different studies may be, in part, affected by variation in the degree of sample aeration caused by differences in water sampling methods. Changes in mire water pH, due to loss of volatile acids, have been reported in several studies. The review by Shotyk (1988) shows that, while acidic bog waters are predominantly buffered by organic acids and do not change pH after bubbling with N2, less acidic fen waters, in many cases, change in pH due to the loss of dissolved CO2 (CO2 and H2CO3). Thus, Gorham (1956) found no appreciable change in pH of bog and poor fen water samples (pH 3.7–5.0), while rich fen samples with initial pH ranging from 6.4 to 7.5 rose more than 0.5 pH units after degassing with N2. The strongest pH changes after N2-degassing were found by Steinmann and Shotyk (1997), who reported a pH change from 5.1 to 7.9 (reproduced from a figure) in deep peat pore water, attributable to the loss of CO2. Aeration of water samples enhances comparability of pH results by excluding the effect of variation in CO2. In previous studies, degassing with N2 or CO2-free air has been used (e.g., Gorham 1956, Gorham 1960, Steinmann and Shotyk 1997), but the method may lead to anomalous results in waters with bicarbonate alkalinity. A known concentration of CO2 is needed to obtain a realistic equilibrium pH. It must be remembered,
706 though, that aeration also changes the redox conditions, which has influence on pH especially when inorganic sulphur concentrations are high (Shotyk 1988). In such cases, aeration can lower pH. Extremely low inorganic sulphur concentrations were found in the current study area by Tahvanainen et al. (2002), and the effects of redox change on pH were probably very small. The acidity caused by CO2 is potentially variable, both in time and space, as it is volatile and affected by photosynthesis and respiration. Diurnal pH fluctuations due to biologically induced CO2 fluctuations are well-documented in stream waters (Neal et al. 2002). One example of bryophyte-dominated wet habitats is given by Bain and Proctor (1980), who reported a rise of pH from 7.4 to 8.9 towards afternoon due to consumption of CO2 by the bryophyte Drepanocladus aduncus (Hedw.) Warnst. in a small pond. Diurnal variation of pH in mire waters has been left without noticeable attention in previous studies. However, photosynthesis and decomposition have diurnal effects on CO2 in mire surface waters as well. Changes in temperature, light, windiness, and precipitation may also have direct physical effects on CO2. In data set III, we found a diurnal cycle of lower pH at night and higher pH at day at all sites. For example, surface-water pH fluctuated between 5 and 6 in the Scorpidium-flarks, and the extremes at these sites were pH 4.6 at night and pH 6.4 at day. Aerated sample pH at adjacent, similar sites (data set II) was on average 7.2. Thus, the results indicated that surface water was supersaturated with CO2 throughout the sampling period at the Scorpidium-flarks. The Scorpidium-flarks were likely to be especially susceptible to diurnal variation of pH because 1) HCO32 dominates the anions in water, 2) decomposition is favored by the prevailing peat and water quality, 3) the open surface water is occupied by aquatic algae and bryophytes, 4) the volume of open surface water is comparably small, as there is only a few-cm film of free water, and 5) the open water is underlain by a deep peat layer (6 m). The diurnal pattern of pH at the acidic Sphagnumsites closely resembled that of the Scorpidium-flarks. The pH range of the most acidic (pH ,4.0) Sphagnumsamples was, however, too low to be influenced by CO2 in the same manner, as in the Scorpidium-sites. One possibility could be excretion of low molecular weight organic acids by Sphagnum that would accumulate during the night and evaporate during the day. There are no previously published records of diurnal fluctuation in comparable acidic situations, and the underlying mechanisms of diurnal pH variation in acidic Sphagnum-habitats remain unclear. More detailed analyses are required to unravel and quantify the causes of diurnal variation of pH in acidic mire waters.
WETLANDS, Volume 23, No. 4, 2003 Also, more work is needed to assess if the diurnal patterns found in this study apply to mire ecosystems in general. As demonstrated in data set II, the whole range of pH variation known in mire waters may be found within a few meters by sampling both from open water surfaces and by squeezing water from bryophyte capitula (Figure 2). In more comparable samples obtained from pipe wells, pH was almost constant in the same data set, irrespective of the hummock—hollow pattern. In another example, given by Bragazza et al. (1998), from an alpine bog, pH of pipe-well samples differed between hummocks (mean pH 4.17) and hollows (mean pH 4.36), however. Water chemistry at the water-table level may be considered as ‘environmental’ water chemistry, produced by the hydrogeological state of the habitat. Bryophytes are primarily influenced by the capillary water on the living capitula in the peat surface, whereas roots of vascular plants are located at varying depths of peat (Metsa¨vainio 1931). Depending on the species and the height above the water-table level, the capillary water on the living bryophyte capitula is influenced by a number of physical, chemical, and biological phenomena. Most importantly, bryophytes change the water chemistry around their living parts, an extreme example of which is the acidity of Sphagnum species (Clymo 1987). In such a case, pH may be considered as a biological response rather than an environmental variable. Furthermore, the samples taken by squeezing from Sphagnum capitula must be considered as composite samples of capillary water located in different capillary spaces, including internal spaces within hyaline cells and external spaces between stems and leaves. Essentially all of the variation in vegetation in data set II was due to the microtopographical transition from high hummocks to flarks with open water. This variation was correlated with the superficial water pH but independent of water pH at the water-table level. Thus, the water-table depth gradient in this case had some analogy with the poor-rich gradient. Vertical variation of water and peat chemistry along the watertable depth gradient was studied in detail by Karlin and Bliss (1984). The poor-rich gradient, however, separates by definition the range of mires from bogs to extremely rich fens and it is related to hydrology and water chemistry at the water-table level. Furthermore, the water-table depth gradient takes place at all parts of the poor-rich gradient and must thus be separated from it. Many mire ecological studies have included water samples taken variably from open water surfaces, by digging or depressing the surface peat, and by extracting water from peat or living bryophytes. In such cases, the poor-rich gradient related water chemistry is inevitably confounded to some de-
Tahvanainen & Tuomaala, MIRE WATER pH gree by the vertical water chemistry gradient. The use of pipe wells located at the water-table level is suggested for studies concerning the water chemistry relations of the poor-rich gradient. Pipe wells can also be used for sampling from different depths of peat (Vitt et al. 1995). The poor-rich gradient is recognised by Fennoscandian mire ecologists as a vegetation continuum, which is only loosely correlated with water chemistry (e.g., Sjo¨rs 1952, Tolonen and Hosiaisluoma 1978, Økland et al. 2001a, Sjo¨rs and Gunnarsson 2002). Correspondingly, classification based on water chemistry shows overlap in bryophyte species assemblages (Mullen et al. 2000). Our results indicate that a significant part of the overlap in pH between the poor-rich categories is probably caused by variable water sampling methods and transient variation of pH at open water surfaces that have predominantly been used for water sampling. New data sets using both unaerated and aerated pipewell samples might help in defining more distinct pH limits along the poor-rich gradient. Improved methodology could also contribute to the mire classification based on the bimodality of pH (Bridgham et al. 1996, Wheeler and Proctor 2000). Sjo¨rs and Gunnarsson (2002) suggested that the bimodality is more likely expected in regions with calcareous than siliceous terrain. Our results conformed to the hypothesis of a bimodal frequency distribution of pH along the poor-rich gradient in a siliceous region. Our data, however, are not representative in a larger regional scale. Rich fens are extremely rare in the southern half of Finland, comprising only about 0.4 % of the total mire area (Eurola et al. 1991). Thus, in an area-representative assessment, high pH would simply be extremely rare in southern Finland. From a Fennoscandian perspective, it remains more applicable to retain the definitions of ‘‘bog’’ and ‘‘fen,’’ as based on the hydrologic division into ombrogenous and minerogenous mires (Økland et al. 2001a, Sjo¨rs and Gunnarsson 2002), instead of the pH-based classification proposed by Wheeler and Proctor (2000). A Standard Protocol for Water Sampling in Mires We suggest that a combination of unaerated and aerated samples obtained from pipe wells be adopted as a standard protocol for comparable and representative sampling of mire water for pH measurements. Aeration can be conducted by bubbling air with a known, ‘‘ambient’’ CO2-concentration through the samples, until an equilibrium pH is achieved. The time required for the equilibrium will depend on several factors, including air flow rate, sample volume, and temperature. For surface-water sampling, the pipe wells should be perforated with 3–4 mm holes in an area maximally
707 10 cm high, that is located below the water-table level. The wells can be supplied with perforated plastic bottles, when large sample volumes are required (Tahvanainen et al. 2002). In all cases, the wells should be closed from the bottom. The pipe wells should be emptied on several occasions after establishment and shortly prior to sampling. More elaborate designs may be needed in some cases, for example to avoid any aeration completely. Especially in the case of water samples collected from open water surfaces or by squeezing from bryophyte capitula, pH should be carefully interpreted, taking into account the effects of weather and diurnal variation, as well as the vertical pH gradient. Furthermore, the use of pH as the only water chemical variable is not advisable. We hope that our work will help mire ecologists relate the reliability of pH measurements to the methodology used. ACKNOWLEDGMENTS The manuscript was improved significantly by constructive comments from Rune Økland and Tapani Sallantaus. Hugo Sjo¨rs, Raimo Heikkila¨, and Kimmo Tolonen are acknowledged for discussion on earlier drafts of the manuscript. Comments from two anonymous referees improved the final version of the manuscript. The work was supported by the Faculty of Science, University of Joensuu, and the Academy of Finland. LITERATURE CITED Adams, M. B., D. S. Nichols, C. A. Federer, K. F. Jensen, and H. Parrot. 1991. Screening procedure to evaluate effects of air pollution on Eastern Region wildernesses cited as Class I air quality areas. Department of Agriculture, Forest Service, Northeastern Forest Experiment Station. Radnor, PA, USA. General Technical Report NE-151. Bain, J. T. and M. C. F. Proctor. 1980. The requirement of aquatic bryophytes for free CO2 as an inorganic carbon source: some experimental evidence. New Phytologist 86:393–400. Bragazza, L., R. Alber, and R. Gerdol. 1998. Seasonal chemistry of pore water in hummocks and hollows in a poor mire in the southern Alps (Italy). Wetlands 18:320–328. Bridgham, S. D., J. Pastor, J. A. Janssens, C. Chapin, and T. J. Malterer. 1996. Multiple limiting gradients in peatlands: a call for a new paradigm. Wetlands 16:45–65. Clymo, R. S. 1987. Interactions of Sphagnum with water and air. p. 513–529. In T. C. Hutchinson and M. Havas (eds.) Effects of Atmospheric Pollutants on Forests, Wetlands and Agricultural Ecosystems. Springer-Verlag, Berlin, Germany. Eurola, S., K. Aapala, A. Kokko, and M. Nironen. 1991. Mire type statistics in the bog and southern aapa mire areas of Finland (60– 668N). Annales Botanici Fennici 28:15–36. Gorham, E. 1956. The ionic composition of some bog and fen waters in the English Lake District. Journal of Ecology 44:142–152. Gorham, E. 1960. The pH of fresh soils and soil solutions. Ecology 41:563. Gorham, E., S. E. Bayley, and D. W. Schindler. 1984. Ecological effects of acid deposition upon peatlands: a neglected field in ‘‘acid-rain’’ research. Canadian Journal of Fisheries and Aquatic Science 41:1256–1268.
708 Gorham, E., S. J. Eisenreich, J. Ford, and M. V. Santelmann. 1985. The chemistry of bog waters. p. 339–363. In W. Stumm (ed.) Chemical Processes in Lakes. John Wiley & Sons, New York, NY, USA. Gorham, E. and J. A. Janssens. 1992a. Concepts of fen and bog reexamined in relation to bryophyte cover and the acidity of surface waters. Acta Societatis Botanicorum Poloniae 61:7–20. Gorham, E. and J. A. Janssens. 1992b. The paleorecord of geochemistry and hydrology in northern peatlands and its relation to global change. Suo 43:117–126. Gorham, E., J. A. Janssens, G. A. Wheeler, and P. H. Glaser. 1987. The natural and anthropogenic acidification of peatlands. p. 493– 512. In T. C. Hutchinson and M. Havas (eds.) Effects of Atmospheric Pollutants on Forests, Wetlands and Agricultural Ecosystems. Springer-Verlag, Berlin, Germany. Hemond, H. F. 1980. Biogeochemistry of Thoreau’s Bog, Concord, Massachusetts. Ecological Monographs 50:507–526. Hill, M. O. and H. G. Gauch Jr. 1980. Detrended correspondence analysis: an improved ordination technique. Vegetatio 42:47–58. Karlin, E. F. and L. C. Bliss. 1984. Variation in substrate chemistry along microtopographical and water-chemistry gradients in peatlands. Canadian Journal of Botany 62:142–153. Kuhry, P., L. A. Halsey, S. E. Bayley, and D. H. Vitt. 1992. Peatland development in relation to Holocene climatic change in Manitoba and Saskatchewan (Canada). Canadian Journal of Earth Sciences 29:1070–1090. Kuhry, P., B. J. Nicholson, L. D. Gignac, D. H. Vitt, and S. E. Bayley. 1993. Development of Sphagnum-dominated peatlands in boreal continental Canada. Canadian Journal of Botany 71:10–22. McCune, B. and M. J. Mefford. 1999. Pcord. Multivariate analysis of ecological data, version 4.09. MjM Software Design, Gleneden Beach, OR, USA. Metsa¨vainio, K. 1931. Untersuchungen u¨ber das Wurtzelsystem der Moorpflanzen. Annales Botanici Societatis Zoologicae Botanicae Fennicae Vanamo 1:1–422. Mullen, S. F., J. A. Janssens, and E. Gorham. 2000. Acidity of and the concentrations of major and minor metals in the surface waters of bryophytes assemblages from 20 North American bogs and fens. Canadian Journal of Botany 78:718–727. Neal, C., C. Watts, R. J. Williams, M. Neal, L. Hill, and H. Wickham. 2002. Diurnal and longer term patterns in carbon dioxide and calcite saturation for the River Kennet, south-eastern England. The Science of the Total Environment 282–283:205–231.
WETLANDS, Volume 23, No. 4, 2003 Økland, R. H., T. Økland, and K. Rydgren. 2001a. A Scandinavian perspective on ecological gradients in north-west European mires: reply to Wheeler and Proctor. Journal of Ecology 89:481–486. Økland, R. H., T. Økland, and K. Rydgren. 2001b. Vegetation-environment relationships of boreal spruce swamp forests in Østmarka Nature Reserve, SE Norway. Sommerfeltia 29:1–190. Proctor, M. C. F. 1995. Hydrochemistry of the raised bog and fens at Malham Tarn National Nature Reserve, Yorkshire, UK. p. 273– 289. In J. M. R. Hughes and A. L. Heathwaite (eds.) Hydrology and Hydrochemistry of British Wetlands. John Wiley, Chichester, UK. Shotyk, W. 1988. Review of the inorganic geochemistry of peats and peatland waters. Earth-Science Reviews 25:95–176. Sjo¨rs, H. 1952. On the relation between vegetation and electrolytes in north Swedish mire waters. Oikos 2:241–258. Sjo¨rs, H. and U. Gunnarsson. 2002. Calcium and pH in north and central Swedish mire waters. Journal of Ecology 90:650–657. So¨derstro¨m, L. and L. Hedena¨s. 1998. Checklista o¨ver Sveriges mossor 1998. Myrinia 8:58–90. Steinmann, P. and W. Shotyk. 1997. Chemical composition, pH, and redox state of sulfur and iron in complete vertical porewater profiles from two Sphagnum peat bogs, Jura Mountains, Switzerland. Geochimica et Cosmochimica Acta 61:1143–1163. Tahvanainen, T., T. Sallantaus, R. Heikkila¨, and K. Tolonen. 2002. Spatial variation of mire surface water chemistry and vegetation in north-eastern Finland. Annales Botanici Fennici 39:235–251. ¨ ber die Entwicklung der Moore im finnischen Tolonen, K. 1967. U Nordkarelien. Annales Botanici Fennici 4:219–416. Tolonen, K. and V. Hosiaisluoma. 1978. Chemical properties of surface water in Finnish ombrotrophic mire complexes with special reference to algal growth. Annales Botanici Fennici 15:55–72. Vitt, D. H. 2000. Peatlands: ecosystems dominated by bryophytes. p. 312–343. In A. J. Shaw and B. Goffinet (eds.) Bryophyte Biology. Cambridge University Press, Cambridge, UK. Vitt, D., S. E. Bayley, and T. L. Jin. 1995. Seasonal variation in water chemistry over a bog-rich fen gradient in Continental Western Canada. Canadian Journal of Fisheries and Aquatic Sciences 52:587–606. Wheeler, R. D. and M. C. F. Proctor. 2000. Ecological gradients, subdivisions and terminology of north-west European mires. Journal of Ecology 88:187–203. Manuscript received 5 August 2002; revisions received 10 February 2003; accepted 4 August 2003.