DISCUSSION PAPER SERIES
No. 6547
THE RESOURCE CURSE: A CORPORATE TRANSPARENCY CHANNEL
Art Durnev and Sergei Guriev
DEVELOPMENT ECONOMICS, FINANCIAL ECONOMICS and PUBLIC POLICY
ABCD www.cepr.org Available online at:
www.cepr.org/pubs/dps/DP6547.asp www.ssrn.com/xxx/xxx/xxx
ISSN 0265-8003
THE RESOURCE CURSE: A CORPORATE TRANSPARENCY CHANNEL Art Durnev, McGill University Sergei Guriev, New Economic School, Moscow and CEPR Discussion Paper No. 6547 October 2007 Centre for Economic Policy Research 90–98 Goswell Rd, London EC1V 7RR, UK Tel: (44 20) 7878 2900, Fax: (44 20) 7878 2999 Email:
[email protected], Website: www.cepr.org This Discussion Paper is issued under the auspices of the Centre’s research programme in DEVELOPMENT ECONOMICS, FINANCIAL ECONOMICS and PUBLIC POLICY. Any opinions expressed here are those of the author(s) and not those of the Centre for Economic Policy Research. Research disseminated by CEPR may include views on policy, but the Centre itself takes no institutional policy positions. The Centre for Economic Policy Research was established in 1983 as a private educational charity, to promote independent analysis and public discussion of open economies and the relations among them. It is pluralist and non-partisan, bringing economic research to bear on the analysis of medium- and long-run policy questions. Institutional (core) finance for the Centre has been provided through major grants from the Economic and Social Research Council, under which an ESRC Resource Centre operates within CEPR; the Esmée Fairbairn Charitable Trust; and the Bank of England. These organizations do not give prior review to the Centre’s publications, nor do they necessarily endorse the views expressed therein. These Discussion Papers often represent preliminary or incomplete work, circulated to encourage discussion and comment. Citation and use of such a paper should take account of its provisional character. Copyright: Artyom Durnev and Sergei Guriev
CEPR Discussion Paper No. 6547 October 2007
ABSTRACT The Resource Curse: A Corporate Transparency Channel* We propose and investigate a new channel through which the resource curse - a stylized fact that countries rich in natural resources grow slower - operates. Predatory governments are more likely to expropriate corporate profits in natural-resource industries when the price of resources is higher. Corporations whose profits are more dependent on the price of resources can mitigate the risk of expropriation by reducing corporate transparency. Lower transparency, in turn, leads to inefficient capital allocation and slower economic growth. Using a panel of 72 industries from 51 countries over 16 years, we demonstrate that the negative effect of expropriation risk on corporate transparency is stronger for industries that are especially vulnerable to expropriation, in particular, for industries whose profits are highly correlated with oil prices. Controlling for country, year, and industry fixed effects, we find that corporate transparency is lower in more oil price-dependent industries when the price of oil is high and property rights are poorly protected. Furthermore, corporate growth is hampered in oil price-sensitive industries because of less efficient capital allocation driven by adverse effects of lower transparency. JEL Classification: G15, G18, K42, L7 and O43 Keywords: autocracy, expropriation, industry growth, investment efficiency, oil reserves, property rights, resource curse and transparency and disclosure Artyom Durnev Faculty of Management McGill University 1001 Sherbrooke Street West, Montreal, Quebec, H3A 1G5 Canada Email:
[email protected]
Sergei Guriev New Economic School (NES) Nakhimovsky pr. 47 Moscow 117418 RUSSIA Email:
[email protected]
For further Discussion Papers by this author see:
For further Discussion Papers by this author see:
www.cepr.org/pubs/new-dps/dplist.asp?authorid=156806
www.cepr.org/pubs/new-dps/dplist.asp?authorid=144054
* Art Durnev’s research is supported by the Institut de Finance Mathématique de Montréal (IFM2) and the Social Sciences & Humanities Research Council of Canada (SSHRC). We thank Pat Akey for superb research assistance. Submitted 10 October 2007
Introduction In those unfortunate countries, indeed, where men are continually afraid of the violence of their superiors, they frequently bury and conceal a great part of their [capital] stock. Adam Smith (1776). An Inquiry into the Nature and Causes of the Wealth of Nations.
Why are some nations rich and others poor? Why have some poor countries managed to catch up with rich countries within one generation’s lifetime, and others have lagged behind even further? Paradoxically, the most successful post‐war development examples have taken place in countries that were poor in natural resources (e.g., The Asian tigers) while most resource‐rich countries (e.g., those in Sub‐Saharan Africa, Middle East, and Latin America) have failed to close the gap with the OECD economies. The fact that resource abundance negatively affects economic growth in standard growth regressions was first documented by Sachs and Warner (1997) and has become known subsequently as the “resource curse”. Recent literature (Lane and Tornell, 1996, Ades and Di Tella, 1999, Auty, 2001, Robinson, Torvik, and Verdier, 2006, Mehlum, Moene, and Torvik, 2006, Caselli, 2006, Hodler, 2006, and Boschini et al., 2006) demonstrates that the resource curse is related to the deterioration of economic and political institutions. In particular, if resources are discovered in an economy with immature institutions, the resulting rent‐seeking slows down or even reverses institutional development, which in turn, negatively affects growth. This literature provides evidence on the interaction between resource abundance and institutions using country‐level data on economic growth. Nevertheless, it is hard to identify the specific channels through which this resource curse works. By definition, institutions change slowly so that isolating the effects of particular institutions requires very long‐term data. In order to understand the mechanism of the resource curse, one needs to use microeconomic data. In this paper, we study the effect of the resource abundance on corporate finance and corporate performance using industry‐level panel from 51 countries over the period of 1990‐2005. We argue that in countries with poor institutions, governments are more inclined to expropriate natural‐resource rents. This makes firms operating in natural resource sectors especially vulnerable to expropriation and provides them with incentives to withhold or
1
manipulate information about their performance. The lower transparency, in turn, leads to worse capital allocation and slower economic growth. We propose a simple theory based on the idea that, during the periods of high commodity prices, corporate profits in the natural resource industries represent rents that are relatively easy for governments to capture. Firms in such industries face a trade‐off. On the one hand, in order to attract external capital, they desire transparency. On the other hand, higher transparency involves a risk of expropriation by the government or other potential predators, such as rival companies.1 As argued by Watts and Zimmerman (1986), Friedman et al. (2000), and Stulz (2005), transparency with respect to corporate profits can attract scrutiny by politicians and various forms of government expropriation, such as the solicitation of bribes, overregulation, disregard of property rights, confiscatory taxation, and the outright seizure of firm assets. Transparency would therefore be lower in industries that are more vulnerable to expropriation, particularly in countries that have poor protection of property rights. Consistent with the existing resource curse literature, this argument is especially important for oil companies. The quintessential example is the story of Yukos, once Russia’s largest and most transparent oil company and once Russia’s richest person Mikhail Khodorkovsky. Khodorkovsky and his partners acquired their stake in a notorious loans‐for‐shares auction and then diluted the stakes of other shareholders including foreign investors and the government (Freeland, 2000, Boone and Rodionov, 2002). Once they assumed control over the majority of voting and cash flow rights, the firm’s transparency and corporate governance improved substantially. Khodorkovsky was the first of Russian oligarchs to disclose his personal stake in a major company and to invite reputable foreigners to join his corporate board. This raised Yukos market capitalization fifteen‐fold in less than four years but also eventually resulted in the full expropriation by the government and imprisonment and exile of the key owners and managers. While the official charges against Khodorkovsky were related to tax fraud, there is a widespread belief that the government’s assault was driven by a combination of his political ambitions and
1
Hereinafter we consider expropriation by a predatory government. However, our analysis goes through if expropriation is conducted by competitors or other private entities.
2
the firm’s openness about its high value. As a member of Russian parliament and a former colleague of Khodorkovsky said, ʺThe real threat that Khodorkovsky posed was that Khodorkovsky had become the most independent businessman in the country. He created what others had failed to create: a transparent, Western‐style‐of‐management company which already had a positive international image ... and if 20% of this new company would have been sold to a Western company, the independence of Khodorkovsky from the authorities would have been fortified to a very great degree. And itʹs clear the authorities were not comfortable with that idea.ʺ Aleksei Kondaurov, Los Angeles Times December 19, 2004
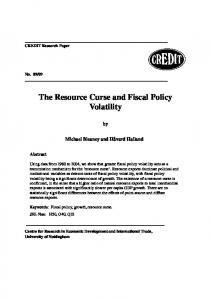
The lessons from the Yukos affair were immediately learned by other Russian oil companies. As one of the harshest critics of Khodorkovsky (William Browder, the head of the Hermitage Capital Mutual Fund in Russia) acknowledged in the aftermath of the Yukos affair: “… the threat of nationalization is forcing companies to go backward with their corporate governance.”2 Goriaev and Sonin (2006) document that investors perceived the attacks on YUKOS as a strong signal that the state would expropriate other companies as well. They show that the reaction to the Yukos affair was more negative for the stocks of more transparent companies than for those of less transparent ones. The Yukos affair was certainly not an isolated case and its relevance goes well beyond Russia. By studying 80 oil nationalizations that have occurred in 1955‐2003 around the world, Kolotilin (2007) shows that oil companies are more likely to be expropriated by governments in countries with imperfect institutions; the risk of nationalization is especially large when oil prices are high. Similar logic drove the famous expropriations of oil companies outside the 1959‐ 2003 period: Expropiación Petrolera in Mexico in 1935, and recent nationalizations in Venezuela, Bolivia Ecuador, and Russia As shown in Figure 1, companies around the world respond to government predation with lower corporate transparency. In Figure 1, we plot country‐level differential opacity of firms that belong to the oil and gas extraction industry versus country predation index (both variables defined in detail later). The differential opacity is defined as country median opacity of firms that belong to the oil and gas industry minus country median opacity of all other firms. In most
Russia Profile Magazine, March 2007, p. 37, quoting William Browder.
2
3
countries (26 out of 31), firms in the oil and gas industry are more opaque relative to all other firms (differential opacity is positive). More interestingly, differential opacity of oil and gas industries is generally larger in more predatory countries. The correlation coefficient between the two variables is 0.42 with p‐value = 0.02.
Argentina Malaysia Thailand
.05
Spain Singapore New Zealand Hong Kong Sweden Norway
0
UK
Greece TurkeyPhilippines India
Korea Japan
US Canada
China
Israel
South Africa
Pakistan Indonesia Russia
ChileTaiwan Belgium
Australia
Italy
France
Germany
-.05
differential opacity of oil and gas extraction industries
.1
0
2
4
6
8
country predation index
Figure 1: Differential opacity of oil and gas extraction industries relative to other industries plotted against country predation index. Differential aggregate opacity is the difference between median opacity (across firms and years from 1990 through 2005) of firms that belong to industries with SIC = 13 (oil and gas extraction) and the median aggregate opacity of all other firms. Opacity is defined in Table II. The intercept and the slope of the line are determined by the following OLS regression: Differential opacity = ‐ 0.0198 + 0.00579 × Predation index (p‐value = 0.02; R2 = 0.17; Number of countries = 31).
In order to provide econometric support for our argument, we apply the approach introduced by Rajan and Zingales (1998) who studied the effect of financial dependence on growth. Rajan and Zingales ranked industries by the degree of financial dependence (using data from the U.S., arguably the most developed financial market) and then studied growth of industries in different countries depending on countries’ financial development and industries’
4
financial dependence. Similarly, we test whether the industries that are more vulnerable to government expropriation have lower transparency levels in countries with worse institutional development. Since we include both country and industry fixed effects in all our regressions, we essentially focus on a within‐country variation in opacity induced by government rent‐seeking.3 This approach mitigates the bias induced by endogeneity, omitted variables, and model misspecification. In order to conduct this test, we need proxies for opacity, oil price sensitivity, and government predation. Let us first describe our approach to measuring opacity. Managers can use different strategies to influence the accuracy of information about their company’s performance. Profitable firms may limit the amount of information disclosed in their financial statements or simply disclose false information (see, e.g., Schipper, 1989, Shivakumar, 2000, and Chaney, Faccio, and Parsley, 2007). Alternatively, the managers can manipulate the precision of information through trading (Aggarwal and Wu, 2006). For example, the managers can depress stock prices of a profitable company by placing a large sell order of the company’s stock. Furthermore, the managers can obfuscate company true prospects by passing false information to investors and market professionals. In measuring corporate opacity, we thus try to account for different ways that information disclosure can be manipulated. The analysis in our paper requires the construction of opacity measures which vary through time, so, we rely on firm accounting and market data that provide such variation. Our main variable is the aggregate opacity index, which consists of three components: accounting opacity, insider opacity, and informational opacity. The accounting opacity component reflects the quality of reported earnings in firms’ financial statements since managers often manage reported earnings to hide or obscure information. The second component of the opacity index, insider opacity, is based on a dynamic return‐volume relationship, and it reflects the degree of informational asymmetry associated with a company. The third component, informational opacity, aims at tracking the aggregate amount of firm‐specific information contained in stock prices. The opacity variables
This approach also helps us interpret the impact of political variables, such as party orientation. For example, the policies of left parties in developed countries may be less predatory than the policies of right parties in developing countries. This does not cause problems in our statistical analysis because we compare the impact of political variables on opacity within countries.
3
5
are based on the accounting and financial data, and thus they do not reflect the exact mechanisms employed by the managers, but rather they can be viewed as aggregate opacity induced by information manipulation and withholding.4 In order to find a proxy for the vulnerability of an industry to expropriation, we disentangle industry profitability into two parts: a part driven by luck such as by oil prices and a part determined by skill, such as managerial foresight or efficient operations. We conjecture that it is easier for governments to expropriate from a company whose profits are related more to exogenous economic conditions, such as high oil prices, rather than managers’ expertise or effort. Thus we use the sensitivity of industry profits with respect to oil prices as a proxy for the expropriation risk. To measure the sensitivity to oil prices, we use the U.S. data (and then exclude the U.S. from further tests). As a check for robustness, we also use a dummy variable for the oil and gas extraction industry to proxy for the risk of expropriation. We assume that expropriation risk is larger for firms that belong to this industry. We use three indices for countries’ degree of predation. First, we construct a predation index that encompasses information on countries’ rule of law, risk of government expropriation, corruption in the government, quality of bureaucracy, regulation of competition, etc. Second, we use the autocracy and democracy indices to measure the political constraints imposed on governments. Buchanan and Tullock (1962), Botero et al. (2004), and Djankov et al. (2002) argue that members of autocratic governments are less constrained than the democratic ones, and thus they are more likely to pursue rent‐seeking. Third, we apply information on party orientation of government chief executives (left versus right). Botero et al. (2002) find that political power of the leftist governments is associated with more redistributive policies at the expense of public companies. Our main empirical finding is that more expropriation‐susceptible industries are less transparent when governments are more predatory. The adverse effect of predation is larger during periods of high oil prices or in countries abundant with oil reserves. We also observe that the constraints on chief government executives (measured by the degree of autocracy) and major
Using direct measures of information disclosure, such as the number of items disclosed in firms’ financial statements, is not suitable. There is no guarantee that companies disclose information truthfully.
4
6
party orientation (left versus right) matter. Specifically, opacity increases when a government is more autocratic or when it favors redistributive policies as measured by leftist party orientation. The opacity also increases during election years reflecting the increased uncertainty about future government policies.5 Next, we turn our attention to the economic growth implications of lower transparency. Economic growth requires efficient allocation of capital. There is growing empirical evidence that more developed and more informational‐rich financial markets are a necessary condition for efficient capital allocation (Durnev, Morck, Yeung (2004) and Wurgler, 2000). Following Wurgler (2000) we use the elasticity of investment with respect to value‐added as a measure of capital allocation efficiency. Consistent with the resource curse argument, capital allocation is indeed less efficient in oil‐sensitive industries located in countries with more predatory or autocratic governments. We also show that such industries grow slower. The paper proceeds as follows. Section I presents a simple model of disclosure under the threat of government’s expropriation and derives empirical predictions. In Section II, we describe the empirical methodology, the data, and the variables. Section III provides the analysis of how predation affects opacity of expropriation‐vulnerable industries. Section IV presents capital allocation and industry growth results. In Section V, we discuss alternative interpretations of our findings and provide robustness checks. In Section VI, we discuss related literature. Section VII concludes.
There might be a reverse causality problem between opacity and country predation. Using information on election years, which are exogenous in most countries, partially mitigates this concern. Dinç (2005) uses a similar approach to study the lending patterns of state‐owned banks during election years.
5
7
II. A Model of Disclosure under Government Expropriation To provide basic intuition behind our arguments, we present a stylized model of disclosure under a threat of government capture. A. The Setting We consider a simple illustrative model of disclosure along the lines of Verrecchia (2001). We assume that there is a distribution of firms, a government, and investors. Each firm has a project that generates earnings π. The earnings π are uniformly distributed on [π, π ] so that the cumulative distribution function is F(π)=(π–π)/( π –π). Each firm needs to raise I dollars to finance the project. Firms act in the interest of the original shareholders. Each firm may disclose its earnings at a fixed cost C. This cost covers the resources spent to verify the earnings to the outsiders, for example the cost of hiring auditors. Investors are perfectly competitive, their time preference is normalized to 1, and they price equity based on all relevant information. In particular, if the earnings π are disclosed then the firm should issue I/π shares to raise I dollars. If the earnings are not disclosed, investors calculate the expected earnings of the firm given the equilibrium decisions to disclose. For example, if investors know that all firms with π>π* disclose and others hide, the price of equity without disclosure is E(π|π