Biogeosciences, 11, 2857–2869, 2014 www.biogeosciences.net/11/2857/2014/ doi:10.5194/bg-11-2857-2014 © Author(s) 2014. CC Attribution 3.0 License.
The role of ocean acidification in Emiliania huxleyi coccolith thinning in the Mediterranean Sea K. J. S. Meier1,* , L. Beaufort1 , S. Heussner2,3 , and P. Ziveri4,5 1 CEREGE,
Aix-Marseille Université – CNRS, BP80 Cedex 4, 13545 Aix en Provence, France CEFREM, UMR5110, 66860 Perpignan, France 3 CEFREM, Univ Perpignan Via Domitia – CNRS, UMR5110, 66860 Perpignan, France 4 Institute of Environmental Science and Technology (ICTA), Universitat Autònoma de Barcelona (UAB), Bellaterra 08193, Spain 5 Cluster Earth & Climate, Department of Earth Sciences, FALW, VU Amsterdam, 1081HV Amsterdam, the Netherlands * now at: Christian-Albrechts-Universität zu Kiel, Institute of Geosciences, Ludewig-Meyn-Str. 10, 24118 Kiel, Germany 2 CNRS,
Correspondence to: K. J. S. Meier (
[email protected]) Received: 21 November 2013 – Published in Biogeosciences Discuss.: 16 December 2013 Revised: 7 April 2014 – Accepted: 16 April 2014 – Published: 28 May 2014
Abstract. Ocean acidification is a result of the uptake of anthropogenic CO2 from the atmosphere into the ocean and has been identified as a major environmental and economic threat. The release of several thousands of petagrams of carbon over a few hundred years will have an overwhelming effect on surface ocean carbon reservoirs. The recorded and anticipated changes in seawater carbonate chemistry will presumably affect global oceanic carbonate production. Coccolithophores as the primary calcifying phytoplankton group, and especially Emiliania huxleyi as the most abundant species have shown a reduction of calcification at increased CO2 concentrations for the majority of strains tested in culture experiments. A reduction of calcification is associated with a decrease in coccolith weight. However, the effect in monoclonal cultures is relatively small compared to the strong variability displayed in natural E. huxleyi communities, as these are a mix of genetically and sometimes morphologically distinct types. Average coccolith weight is likely influenced by the variability in seawater carbonate chemistry in different parts of the world’s oceans and on glacial/interglacial time scales due to both physiological effects and morphotype selectivity. An effect of the ongoing ocean acidification on E. huxleyi calcification has so far not been documented in situ. Here, we analyze E. huxleyi coccolith weight from the NW Mediterranean Sea in a 12-year sediment trap series, and surface sediment and sediment core samples using an automated recognition and analyzing soft-
ware. Our findings clearly show (1) a continuous decrease in the average coccolith weight of E. huxleyi from 1993 to 2005, reaching levels below pre-industrial (Holocene) and industrial (20th century) values recorded in the sedimentary record and (2) seasonal variability in coccolith weight that is linked to the coccolithophore productivity. The observed long-term decrease in coccolith weight is most likely a result of the changes in the surface ocean carbonate system. Our results provide the first indications of an in situ impact of ocean acidification on coccolithophore weight in a natural E. huxleyi population, even in the highly alkaline Mediterranean Sea.
1
Introduction
A key question in global climate change research is how the uptake of anthropogenic CO2 from the atmosphere into the ocean will affect the ocean ecosystem in the near future (Bindoff et al., 2007; Kleypas et al., 2006; Kroeker et al., 2013). Model projections have shown that the global carbonate system will undergo substantial changes with a drastic decline in pH and calcium carbonate saturation by the end of the century (Orr et al., 2005; Zeebe, 2012). Calcifying organisms are most likely to be negatively affected by the process commonly called ocean acidification (OA), and a series of studies have demonstrated the sensitivity of calcification
Published by Copernicus Publications on behalf of the European Geosciences Union.
2858
K. J. S. Meier et al.: Emiliania huxleyi coccolith thinning in the Mediterranean Sea
in response to OA for a variety of different organism groups (Kleypas, 1999; Lischka et al., 2011; Moy et al., 2009; Riebesell et al., 2000; van de Waal, 2013). Coccolithophores are the major calcifying phytoplankton group and a reduction in coccolithophore calcium carbonate production influences the global carbonate cycle and reduces organic carbon export (Gehlen et al., 2007; Wilson et al., 2012). Various culturing studies have demonstrated that the most abundant coccolithophore species Emiliania huxleyi reacts to increased CO2 with a decrease in calcification, but the response is highly variable between strains (De Bodt et al., 2010; Langer et al., 2009; Hoppe et al., 2011). The genetic diversity among E. huxleyi (Read et al., 2013) even contains a haplotype that can heavily calcify under elevated CO2 and is environmentally restricted to high latitudes and upwelling regions (Beaufort et al., 2011; Smith et al., 2012), but this has not been reported in the Mediterranean thus far (Beaufort et al., 2011). The in situ response to OA is more difficult to investigate, as physiological measurements on coccolithophore calcification are not feasible over extended time periods in the field. The degree of coccolith calcification is defined as the “primary variation in amount of biogenic calcite incorporated in a coccolith” (Young et al., 1997). Coccolith calcification is expressed by coccolith weight and increases under conditions that are favorable for coccolithophore calcification. Therefore it is an indicator for the calcification rate of the coccolithophore cell (Bach et al., 2012). A global study on the variations of coccolith weight over the natural range of CO2 concentrations in the world’s oceans has shown that coccolith weight decreases with increasing CO2 and this effect can also be traced back in sedimentary archives of the last glaciation under natural CO2 variations (Beaufort et al., 2011). However, the variability in the degree of coccolith calcification between E. huxleyi types is an important factor when investigating the response of average coccolith weight to OA events in natural assemblages (Berger et al., 2014), and previous reports on an increase in E. huxleyi weight in response to ocean acidification may be due to morphotype variability (Beaufort et al., 2011; Grelaud et al., 2009; IglesiasRodriguez et al., 2008). In summary, coccolith weight decreases in laboratory experiments mimicking future OA scenarios, it decreases during periods of natural CO2 increase during the last glacial termination, and it is currently lower in oceanic regions with naturally elevated CO2 concentrations. In this study we tested whether the ongoing ocean acidification has already affected the weight of E. huxleyi in the NW Mediterranean Sea. We carried out weight measurements on E. huxleyi coccoliths from a sediment trap series deployed in the Gulf of Lions from 1993 to 2005, and compared them to environmental data in order to determine which environmental factors may have driven changes in coccolithophore calcification. We also investigated sediment records from the region representing the 20th century and the Holocene in order to test if coccolith weight has decreased since the beginning of the industrial age. Biogeosciences, 11, 2857–2869, 2014
2
Site description
The Mediterranean Sea is known to be highly supersaturated with respect to carbonate throughout the entire basin from the surface to depth (Álvarez et al., 2014; Schneider et al., 2010, 2007). At the same time, it serves as a sink for anthropogenic CO2 , which is absorbed in the surface layers and transported into the deeper parts of the basin through mixing (Ait-Ameur and Goyet, 2006; Bethoux et al., 2005). The absolute values of anthropogenic carbon in the Mediterranean Sea are exceptionally high and a decrease in pH between 0.061 and 0.148 since the pre-industrial age has been suggested (Schneider et al., 2010; Touratier and Goyet, 2011; Touratier et al., 2012). These unique features make the Mediterranean an interesting subject for studying the effect of anthropogenic acidification on calcifying organisms. A key area that combines all of these aspects is the NW Mediterranean. A natural annual variation in pCO2 driven mainly by temperature can be observed in the surface water column with the highest values occurring in the upper 50 m in summer under well-stratified conditions (Copin-Montégut et al., 2004). In winter the water column becomes unstable at temperatures below ∼ 13 ◦ C and the surface water mixes with the underlying intermediate waters that are rich in dissolved inorganic carbon (DIC). This leads to an increase in pCO2 in surface waters in autumn and early winter when biological production is low. However, mixing also brings nutrients into the photic zone resulting in phytoplankton blooms beginning in late winter and early spring, which lead to a pCO2 decrease (Copin-Montégut and Bégovic, 2002; CopinMontégut et al., 2004). Long-term algal pigment observations at the Dynamics of Atmospheric Fluxes in the MEDiterranean Sea (DYFAMED) site in the NW Mediterranean Sea have shown that haptophytes (including coccolithophores) are generally the dominant algal class throughout the year (Marty and Chiaverini, 2010; Marty et al., 2002). Production of haptophytes is highest in February/March and mostly takes place between 20 and 50 m water depth (Marty et al., 2002). This annual cycle is controlled by a seasonal change between nitrate limitation during winter and phosphate limitation during summer (Marty et al., 2002). A prominent hydrological change was observed in the NW Mediterranean Sea in 2006, with a warming of the deeper water masses due to mixing of the entire water column during winter (Marty and Chiaverini, 2010). This event was presumably preconditioned by drought years from 2003 to 2005, leading to a salinity increase and subsequently more intense mixing in winter. After these intense mixing events, nutrient levels were higher than usual, leading to diatoms becoming more abundant during the following spring blooms (Marty and Chiaverini, 2010).
www.biogeosciences.net/11/2857/2014/
K. J. S. Meier et al.: Emiliania huxleyi coccolith thinning in the Mediterranean Sea Material and methods
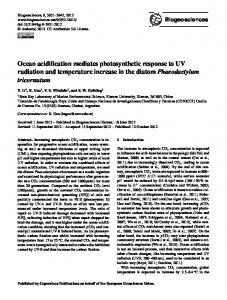
The sediment trap material investigated here originates from the Gulf of Lions, NW Mediterranean Sea (43◦ 020 N, 5◦ 110 E, 1030 m water depth, Fig. 1). A sediment trap was continuously deployed over 6-month periods from 1993 to 2005 in the Planier canyon at 500 m water depth and 530 m above the bottom. No samples were available for the periods February–April 1994, June 1996–January 1997, June– September 2000 and May–September 2004. The collected particles used here were filtered and picked to remove microzooplankton from the samples. The trap details and the description of the original sample processing have been published before (Heussner et al., 2006). Trap cups were filled with a formalin solution and neutralized with sodium borate, and pH was monitored before deployment and before processing to verify and ensure carbonate preservation. Splits of the original sediment trap samples were brought into homogenous suspension in water. An aliquot representing between 0.2 and 2 mg of trap particles was taken from the suspension with a glass pipette and placed on a 47 mm diameter and 0.45 µm pore size cellulose nitrate filter. The filter was oven dried at 50 ◦ C over night and embedded in Canada balsam on a glass slide to make the filter transparent. All slides were analyzed with a polarizing microscope (Leica DMRBE) with a 2 megapixel Spot Insight camera. Routine checks on the assemblage showed that E. huxleyi dominated the assemblage throughout the record. 40 fields of view were taken automatically and analyzed with the automated recognition software SYRACO (Beaufort and Dollfus, 2004). Image analysis was performed on the output files for Emiliania huxleyi to obtain length and weight of the individual coccoliths. In total 35 602 coccoliths were identified. Only those data points within the inner fence of a box and whisker plot of coccolith length and weight were included in the analysis (values larger than 4.22 µm length and 12.28 pg weight were eliminated – 1035 data points). For methodological details see previous studies (Beaufort, 2005; Beaufort et al., 2011, 2008). The selected surface and the Holocene sediment samples were collected during RV Meteor cruise M40/4 (1998). Multicorer station #82 from the Gulf of Lions (42◦ 18.510 N, 3◦ 46.40 E, 1078 m water depth, 0–1 cm) spans approximately the last 40 to 80 years, assuming approximate sedimentation rates of 0.1 to 0.15 cm yr−1 (Miralles et al., 2005) and a bioturbation depth of 5–8 cm for the position. The gravity core station #87 taken near the Balearic Islands (38◦ 59.280 N, 4◦ 1.380 E, 1913 m water depth, 0–30 cm, sampled every cm) covers the time span of about 200 to 10 800 years BP (Emeis et al., 2003). Smear slides were prepared using standard protocols and coccolith measurements were carried out as described above. Environmental data covering the time span of the analyzed trap samples were collected from the DYFAMED database (http://www.obs-vlfr.fr/dyfBase/index.php), the Ocean www.biogeosciences.net/11/2857/2014/
50 N Sediment Trap Dyfamed Site M40/4 #82 surface sediment M40/4 #87 gravity core
45 N LPC LG
TC
NBF
40 N AI S
AIS
35 N
30 N 10 W
Ocean Data View
3
2859
5W
0
5E
10 E
15 E
20 E
Figure 1. Map of the NW Mediterranean Sea. Location of trap, DYFAMED site, surface sediment sample, sediment core and the major oceanographical currents and fronts (LPC: Liguro–Provençal Current (Northern Current), LG: Lion Gyre, AIS: Atlantic–Ionian Stream, TC: Tyrrhenian Current, NBF: North Balearic Front). After Millot (1987) and Pinardi and Masetti (2000).
Productivity website (http://www.science.oregonstate.edu/ ocean.productivity/index.php) and the OceanColor website (http://oceancolor.gsfc.nasa.gov). Detailed carbonate system parameters, temperature, salinity and nutrient measurements are only available for the DYFAMED site, which is located about 200 km east of the trap position (43◦ 250 N, 7◦ 520 E), i.e., upstream with respect to the general E–W circulation of the Northern Current along the slope (Fig. 1). It has been shown before that this data can be used for comparison with the sediment trap data (Heussner et al., 2006). Carbonate system measurements (i.e., alkalinity and DIC) are only available for the years 1998 to 2000 and 2003 to 2005. Data were obtained for the upper 200 m of the water column. Missing measurements were replaced with values obtained from linear regression of the measurements from above and below. [CO2 ] and pH were calculated from the measured total alkalinity and dissolved inorganic carbon measurements with the CO2 SYS macro (Lewis and Wallace, 1998) using the CO2 dissociation constants by Mehrbach et al. (1973), refit by Dickson and Millero (1987), KHSO4 by Dickson (1990) and the seawater scale for pH. This data based on carbonate system measurements was then compared to theoretical carbonate system parameters calculated by the CO2 SYS macro as described above, by using atmospheric [CO2 ] and alkalinity calculated from salinity (Schneider et al., 2007) for the entire time span. Primary productivity (npp) (Behrenfeld and Falkowski, 1997) and particulate inorganic carbon data (PIC) are derived from SeaWiFS satellite ocean color measurements taken as Biogeosciences, 11, 2857–2869, 2014
close as possible to the trap location (43◦ N, 5◦ 100 E, 100 resolution). A singular spectrum analysis (SSA) was carried out on the coccolith weight and the environmental data sets using the software package R and following the method described in Golyandina and Korobeynikov (2012). For this, an evenly spaced time series without gaps (monthly values) was produced from the data. Monthly averages were calculated in those cases where traps were sampled twice in one month. Small gaps (less than 3 months) were filled by linear interpolation between the values before and after the gap. Longer gaps were filled using the monthly averages from all years, which were adjusted for the specific year. Gap filling methods are explained in detail in supplementary Fig. 1. The SSA decomposed the data into trends, seasonal signals and residuals. For analysis of the seasonality, the trends and 12-month frequencies were added and run through a principal component analysis (PCA) in order to determine which variables explain most of the variance in the data. Cross-correlation was calculated on the time-series and on the seasonal signals extracted by the SSA to determine if a lagged response of E. huxleyi coccolith weight to the environmental parameters is likely.
4
E. huxleyi average weight [pg]
K. J. S. Meier et al.: Emiliania huxleyi coccolith thinning in the Mediterranean Sea A
B Data FFT smooth Low counts
Data Spline fit
C
D Data FFT smooth Low counts
Data Spline fit
6.0
5.0
4.0
3.0
2.0 3.3
E. huxleyi average length [µm]
2860
3.2
3.1
3
2.9
2.8 94 95 96 97 98 99 00 01 02 03 04 05 06
Year
Jan FebMar Apr MayJun Jul Aug Sep Oct NovDec
Month
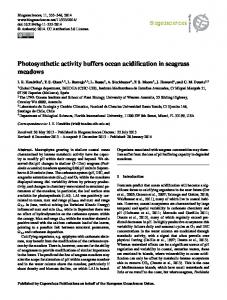
Figure 2. Emiliania huxleyi mean coccolith length and weight over the sediment trap deployment period (A, C) and on a composite year (B, D). Long-term trends, seasonal variability, periods with extremely low average weight (grey shade) and periods with reduced/changed seasonality (yellow shade) are shown.
Results and discussion
4.1 E. huxleyi coccolith weight and length Seasonality and long-term trends are clearly shown in the weight and length of E. huxleyi coccoliths collected by the sediment trap investigated here (Fig. 2). The mean weight of E. huxleyi coccoliths shows maxima from February to May and minima from August to November during most parts of the record. The annual amplitude in average weight is about 1 pg. There are two periods in the record during which maxima occur twice a year. From 2001 to 2002 and from late 2004 to late 2005 maxima occur around January and June (Fig. 2a, b). Average coccolith length shows little seasonal variability with an amplitude of about 0.1 µm (Fig. 2c, d). The inter-annual variability in weight and length of E. huxleyi is relatively small, but a long-term decrease can be observed from 1993 to 2005 (Fig. 2a, c), with a more pronounced decrease starting in 2001 and a further decrease only in weight from September 2004 onwards. Annual mean weight values decrease from about 5 pg in the first part of the record to less than 4 pg towards the end, equaling approximately a 20 % reduction in average weight (Fig. 2a, c). Annual mean length values show the same trend, but decrease only from 3.16 to 3.06 µm, which is a reduction of about 3 %. Theoretically, a reduction in length could be responsible for a decrease in weight without changing how well the coccolith is calcified. Coccolith weight has been shown to be approximately linearly correlated to the cube of coccolith length (Young and Ziveri, 2000). This means that a 3 % reduction Biogeosciences, 11, 2857–2869, 2014
in length (a reduction to 97 %) equals approximately a 9 % loss in weight (0.973 ≈ 0.91), which is considerably less than the observed weight decrease of about 20 %. Therefore, coccolith weight decreases more than can be expected based on the length reduction, indicating that coccoliths become less calcified. There are four intervals in the 1993–2005 trap deployment during which exceptionally low weight and length values of about 2 to 3 pg and less than 3 µm have been observed (Fig. 2). These are November 1993 to April 1994, June to November 2000, May to August 2004 and September to December 2005. As these extremely low measurements are not randomly spread over the record but last over periods of several months, it is likely that they represent a mechanism that leads to decreased coccolith weight. Carbonate dissolution during or after sample preparation is unlikely to have occurred, as all samples have been treated in the same way, and previous studies did not show a decrease in the carbonate content during these periods (Heussner et al., 2006). In most of these samples very few coccoliths were detected (Fig. 2), which suggests that E. huxleyi production could have been lower. The years 2000, 2004 and 2005 were characterized by intense mixing events during late winter (Marty and Chiaverini, 2010). In late winter and early spring of these years E. huxleyi is still abundant, but in the following months numbers decrease to a minimum (Fig. 2). As diatoms have a tendency to be more abundant during years following mixing events (Marty and Chiaverini, 2010), the decrease in www.biogeosciences.net/11/2857/2014/
E. huxleyi production may be related to a different phytoplankton community structure. In addition, in the years 2000 and 2004 coccolith weight changes from a one maximum per year to a two maxima per year signal after these coccolithpoor periods (Fig. 2). This may indicate, that the normal seasonal development of the E. huxleyi population was disturbed following intense winter mixing. The unusual seasonality can last for extended periods. After the change in late 2000 it took the system until 2003 before a normal seasonal signal established again in E. huxleyi weight (Fig. 2). The low weight period in winter 1993/1994 at the beginning of the trap record is different from the other events. Here, coccolith weight is already low during a moderate mixing event that is indicated by a sudden temperature drop measured at the trap (Heussner et al., 2006) and lasts exceptionally long. Coccolith numbers are exceptionally low only during part of this event (Fig. 2), indicating normal productivity. The exact mechanism leading to these periods with extremely low coccolith weight and length values remains unclear, but it seems very likely that they represent exceptional phases that are different from the normal seasonal signal in the record. Therefore, measurements from these periods have been excluded from all analyses. 4.2
Sediment transport
Seasonal changes in sediment resuspension plays an important role in particle transfer on the Gulf of Lions margin (Canals et al., 2006; Heussner et al., 2006). In a previous multi-sediment trap study, including the trap investigated here, a linear increase of the carbonate content in the sediment trap material with increasing mass flux was observed (Heussner et al., 2006). In the samples used here the influence of biological production on the sedimentation was shown to be highest compared to other settings in the Gulf of Lions (Heussner et al., 2006). This is likely because the trap was deployed in relatively shallow water (500 m water depth, mid-water column) and was located in the eastern part of the Gulf of Lions where the influence of resuspended material transport is smallest (Heussner et al., 2006). The lack of a linear relationship between total mass flux and the number of E. huxleyi coccoliths per gram of particles in our trap is shown in Fig. 3. This indicates that the majority of E. huxleyi coccoliths are likely to reflect the actual export production rather than resuspension, as has also been observed for silicoflagellates in the same trap (Rigual-Hernández et al., 2010).
www.biogeosciences.net/11/2857/2014/
109 coccoliths g-1 sediment
K. J. S. Meier et al.: Emiliania huxleyi coccolith thinning in the Mediterranean Sea
1.2
2861
Data
1
Mean with 95% confidence interval Intervals
0.8 0.6 0.4 0.2 0 1
1x10
2
1x10
mass flux [mg
3
1x10 m-2
4
1x10
d-1]
Figure 3. Emiliania huxleyi coccolith concentration in trap material versus total mass flux. Individual data points show an irregular scatter. Also the mean values within the mass flux intervals indicated by the grey bars show no increase with mass flux, indicating small influence of sediment transport and resuspension on coccolith concentration.
4.3
Environmental controls
Emiliania huxleyi coccolith weight and length have been shown to vary with different environmental parameters. Possible causes for the observed seasonal and long-term variations in E. huxleyi weight and length could be E. huxleyi morphotype selectivity related to environmental factors, or a physiological response to the changing environment, e.g., changes in E. huxleyi calcification due to natural environmental variability (seasonal) or global change (such as longterm ocean acidification, global warming). 4.3.1
Seasonal variation in temperature, nutrients, salinity and the carbonate system
The seasonal variability in temperature, salinity, nutrient concentration and the carbonate system parameters is clearly expressed in both the raw measurements and the SSA extraction of the seasonal signal (Figs. 4 and 5). The seasonal component of the signal is larger than the trend component in most of the parameters, except for coccolith weight, atmospheric CO2 and pH (Fig. 5). This is the reason why atmospheric CO2 and pH are the only parameters with a significant (but very low) correlation to coccolith weight (Table 1). However, when assuming a lagged response, significant correlations can also be found with temperature, nitrate, phosphate, alkalinity, [CO2 ], [CO2− 3 ] and Calcite but still low r values (Table 1). Regarding only the seasonal signals extracted with the SSA further improves the correlation (Table 2). The highest significant correlations were found with coccolith weight lagging two months behind temperature, Calcite , [CO2− 3 ] (r values around −0.7), [CO2 ] (r ∼ 0.7), Biogeosciences, 11, 2857–2869, 2014
2862
K. J. S. Meier et al.: Emiliania huxleyi coccolith thinning in the Mediterranean Sea
Table 1. Cross-correlation between E. huxleyi coccolith weight and time-series parameters, calculated for lags of 0 to 6 months. Significant correlations are set in bold. E. huxleyi coccolith weight Temperature Salinity Nitrate Phosphate Atm. CO2 Total Alkalinity pH [CO2 ] [CO2− 3 ] Calcite
No lag
Lag 1 month
Lag 2 months
Lag 3 months
Lag 4 months
Lag 5 months
Lag 6 months
−0.106 −0.024 0.074 0.132 −0.275 −0.035 0.285 0.009 −0.042 −0.04
−0.191 −0.05 0.113 0.16 −0.328 −0.087 0.349 0.065 −0.115 −0.114
−0.227 −0.09 0.167 0.202 −0.381 −0.127 0.404 0.077 −0.142 −0.142
−0.185 −0.194 0.133 0.215 −0.443 −0.24 0.446 0.019 −0.101 −0.099
−0.078 −0.16 0.159 0.18 −0.489 −0.194 0.484 −0.094 0.016 0.019
0.036 −0.172 0.053 0.181 −0.532 −0.168 0.514 −0.217 0.133 0.136
0.183 −0.231 −0.122 0.037 −0.552 −0.192 0.507 −0.359 0.272 0.275
Table 2. Cross-correlation between the seasonal signals extracted by an SSA analysis from E. huxleyi coccolith weight and time-series parameters, calculated for lags of 0 to 6 months. Maximum correlations are set in bold. E. huxleyi weight Temperature Calcite [CO2− 3 ] [CO2 ] Nitrate Phosphate Atm. CO2 pH Salinity Total Alkalinity
No lag
Lag 1 month
Lag 2 months
Lag 3 months
Lag 4 months
Lag 5 months
Lag 6 months
−0.384 −0.395 −0.393 0.448 0.209 0.239 0.698 −0.618 0.235 0.202
−0.63 −0.636 −0.635 0.662 0.387 0.401 0.593 −0.398 0.055 −0.046
−0.707 −0.706 −0.706 0.698 0.496 0.483 0.322 −0.061 −0.125 −0.277
−0.59 −0.583 −0.584 0.544 0.476 0.437 −0.033 0.287 −0.284 −0.441
−0.308 −0.295 −0.296 0.236 0.293 0.243 −0.376 0.546 −0.391 −0.498
0.067 0.083 0.081 −0.145 −0.015 −0.06 −0.624 0.657 −0.405 −0.422
0.435 0.448 0.447 −0.497 −0.337 −0.372 −0.717 0.606 −0.293 −0.222
nitrate and phosphate (r ∼ 0.5). Atmospheric CO2 and pH are best correlated to coccolith weight with no lag (r ∼ 0.7 and −0.6), while salinity and alkalinity show best correlations with coccolith weight lagging 4–5 months (r ∼-0.4 and −0.5). The results from the PCA analysis on the combined trend and seasonal signals from the SSA analysis summarize these findings (Fig. 6). The first PCA axis explains 62 % of the variance and represents temperature, Calcite , [CO2− 3 ], [CO2 ], nitrate and phosphate, i.e., those parameters in which the seasonal signal dominates and that show best correlations with coccolith weight assuming a lagged response of two months. The second PCA axis explains 31 % of the variance and is controlled by the parameters with a strong trend component, i.e., atmospheric CO2 and pH, but also picks up the seasonal signal in salinity and alkalinity, with the best correlation to coccolith weight at lag of 4–5 months. From this analysis, the normal seasonal succession in environmental variables and coccolith weight can be identified. In February, at the beginning of the spring bloom in the Gulf of Lions area, temperature and thus also Calcite and [CO2− 3 ] are lowest, but nutrients (nitrate and phosphate) reach their maximum. The spring bloom starts with diatoms, followed Biogeosciences, 11, 2857–2869, 2014
by haptophytes (including coccolithophores), which reach their maximum between February and May (Marty et al., 2002). During the course of the bloom, nutrients decrease while temperature increases. Coccolith weight increases during the bloom, reaching maximum values about 2 months after the onset. The causal relationships between the different variables and coccolith weight are difficult to determine statistically, as there is considerable covariation between the parameters. Comparison with earlier studies may help to identify which of the correlations found in our data set are meaningful. E. huxleyi morphotypes show a distinct temperature preference in the NW Pacific, with a morphotype below 4.1 µm length preferring warmer waters, and larger morphotypes characteristic of colder water masses (Hagino et al., 2005). In paleoceanographic studies, E. huxleyi coccoliths > 4 µm are frequently used as a cold-water indicator (Flores et al., 2010). In our record there is no detectable seasonal variability in E. huxleyi length and the vast majority of coccoliths measured here are below 4 µm, implying that the length variation observed in our data cannot result from E. huxleyi morphotype temperature selectivity. In addition, a direct influence of www.biogeosciences.net/11/2857/2014/
CO32- [µmol kg sea water-1]
200 180
5-50 m average 70-200 m average
17
CO2 [µmol kg sea water-1]
-1.0 2 1 0 -1
Nitrate [µmol/l] J
5-50 m calculated
F
M
A
M
J
J
A
S
O
N
D
0.00 -0.10 5
J
F
M
A
M
J
J
A
S
O
N
D
Figure 5. Seasonal signal extracted from the weight and environmental data in Fig. 4 by a single spectrum analysis (SSA). Monthly averages and the deviation from the average for every year (bars) are shown.
15 13 20
0.06
-2
-0.4
220
0
Salinity [psu]
0.0
ΩCalcite
0
-5
0.4
0.2 0.1
Total Alkalinity [µmol/kg]
0.3
240
0.0
CO2 [µmol/kg]
0.4 0.0 -15
PO4 [µmol l-1] 5-50 m average
5
0
0.5 0.4
-5
CO3 [µmol/kg]
15
4 2
0.00
+ 5-50 m x 70-200 m
NO3 [µmol l-1] 5-50 m average
6
-10
10 8
Phosphate [µmol/l]
1x10
-0.06
Temperature [°C]
no data
-4
-0.4
Coccolith weight [pg]
PIC [mol m3] 1x10⁻³
0.000
pH [seawater scale]
no data
-0.003
npp [mg C m-2 d-1]
2
3 1400 1200 1000 800 600 400 200
1
4
0
E. huxleyi average coccolith weight [pg]
5
-2
6
2863 1.0
K. J. S. Meier et al.: Emiliania huxleyi coccolith thinning in the Mediterranean Sea
Temperature [°C] 5-50 m average
18 16 14 38.6
Salinity [psu] 5-50 m average
38.4
04
05
Dec
03
Nov
02
Sep
01
Oct
00
Aug
99
Jul
98
Jun
97
Apr
96
May
95
Mar
94
Feb
38 37.8
Jan
38.2
Figure 4. Emiliania huxleyi coccolith weight versus environmental data. Left: time period from 1993 to 2005 during which additional data was available. Thin lines represent original data, bold colored lines are fast Fourier transform smoothed data. Right: data as on the left plotted on a composite year, indicating seasonal trends. Bold lines represent spline fits. Grey bars indicate the time period from February to May.
temperature on coccolith weight has not been found in culturing experiments (De Bodt et al., 2010) or to be statistically significant in a recently published global study (Beaufort et al., 2011). In our study, however, E. huxleyi coccolith weight has its maximum in February to May when temperatures are still relatively low and decreases during summer when temperatures reach a maximum of about 16 to 20 ◦ C in the upper 40 m (Figs. 4 and 5). Therefore, the possibility that the temperature increase during the year contributes to decreased average weight in E. huxleyi cannot be ruled out entirely, as the statistical support for temperature is highest. As mentioned above, the seasonal temperature variability also causes changes in the carbonate system (Copin-Montégut et al., 2004), which in turn could be responsible for coccolith calcification changes (see below).
www.biogeosciences.net/11/2857/2014/
Salinity has been suggested to influence E. huxleyi morphometry, which has been consequently proposed as an indicator for past sea surface salinity (Bollmann et al., 2009; Fielding et al., 2009). However, a recent global survey has shown that the calcification state of E. huxleyi is not related to salinity (Beaufort et al., 2011), which is confirmed by our data. The salinity variability is too small (Figs. 4 and 5) to account for a substantial change in coccolith length (Bollmann et al., 2009) and from all variables tested, the statistical support for salinity (and alkalinity) controlling coccolith weight is lowest. Therefore salinity is not one of the main factors controlling weight and length of E. huxleyi here. Nutrient availability influences calcification in E. huxleyi in two ways: increased coccolith weight has been observed in cells grown under higher nutrient conditions and produced during coccolithophore blooms (Beaufort et al., 2007), but also under phosphate limitation despite slower growth (Kayano and Shiraiwa, 2009; Müller et al., 2008; Satoh et al., 2009). At the trap site both effects may play a role. Satellitederived primary production data shows a seasonal productivity cycle with maxima occurring in late winter/early spring, and phosphate limitation occurring in summer (Figs. 4 and 5). Absolute nutrient values are highest in winter (December to February) with about 6 µmol L−1 nitrate and 0.2 µmol L−1 phosphate, and then decrease to extremely low values in summer. The lower part of the photic zone also shows little seasonal variability but generally slightly higher values, up to 8 µmol L−1 nitrate and 0.4 µmol L−1 phosphate (Figs. 4 and 5). Coccolith weight of E. huxleyi shows a seasonal cycle that Biogeosciences, 11, 2857–2869, 2014
2864
K. J. S. Meier et al.: Emiliania huxleyi coccolith thinning in the Mediterranean Sea -10
5
10
1
NOV84 120 108 96 60 72
2 2614 14650 62 74 38 134 86 110 122 98
OCT131 119 95 107 143 83 71 59
32 820 44 56 68 80 Salinity 102 92 114 7 43 140 90 128 31 126 54 55 104 66 78 42 6138 67 116 19 79 91 30 103 Alkalinity 127 18 115 139 JUL
MAY
JUN
0.00
0.05
136 112 416 124 100 88 76 28 64 52 40 Ehux weight MAR 113 101 125 137 89 565 53 Atm.77 CO2 41 29 17
APR
3.2
18 17
4.5
3.1
16
4
3.05
15
3.5
3
14
3
2.95
13
CO2
[µmol kg sea water-1]
pH
8.16
0
10
93-03
03-05
NO3
[µmol l-1]
2.9
0.6
93-03
03-05
PO4
[µmol l-1]
12
8.12
Figure 6. PCA of the combined seasonal and trend data from the SSA. The first PCA axis explains 62 % of the variance, the second axis 31 %. The data clusters in months (represented by grey numbers) and the arrows point in the direction of the maximum values. The main coccolithophore production season from February to May (Marty et al., 2002) is marked in green. At the beginning of the season, nutrients and [CO2 ] are highest, while temperature, [CO2− 3 ] and Calcite are lowest. A 2-month lag between these initial conditions and the maximum in coccolith weight is observed.
lags 2 months behind the nutrient and productivity pattern (Figs. 4 and 5), whereas coccolith length shows no prominent seasonality. This lagged response may be due to the presence of diatoms at the beginning of the spring bloom. The general productivity pattern in the Gulf of Lions seems therefore to be responsible for an increase of E. huxleyi coccolith weight in February to May. If the P-limitation in summer has an effect, it is not strong enough to level out the seasonal signal in E. huxleyi weight, but may be one of the reasons for the reduced seasonal signal in E. huxleyi coccolith length. A less pronounced seasonality in nitrate and phosphate concentrations in 2001 and 2002 is paralleled by a reduced seasonal signal of E. huxleyi coccolith weight (Fig. 4), further indication of the importance of nutrient supply for E. huxleyi calcification. Interestingly, the PIC data does not follow the productivity and coccolith weight trends (Fig. 4). As recently shown (Daniels et al., 2012) this may be due to suspended particles that are common in coastal regions. A recently published conceptual model on the effects of the carbonate chemistry on coccolithophore calcification describes calcification following an optimum curve response to gradients in pH and dissolved inorganic carbon (DIC) (Krug et al., 2011). Calcification will decrease outside the optimum
6
240
5.5
220
5
200
4.5
8.06 8.04 8.02
98-00
03-05
8
[mg C m-2 d-1]
180
98-00
03-05
PIC
10
4
98-00
03-05
98-00
Temperature
[µmol m-3]
[°C]
03-05
Salinity 39
[psu]
26 0.5
1200
0.4
1000
8
38.8
24
38.6
22
6
6 0.3
800
0.2
600
0.1
400
93-03
03-05
0
93-03
03-05
200
38.4
20 4
2
0.15
Calcite
260
8.1
npp
1400
CO332-
[µmol kg sea water-1]
[seawater scale]
8.14
4
Comp.1
Biogeosciences, 11, 2857–2869, 2014
19
3.15
0
0.10
[µm]
5
2.5
-5
0.00 -0.10
AUG
3.25
5.5
8
33 45 141 921 57 69 81 129 93 105 117
-0.05
[pg]
8.08
Phosphate, 3 Nitrate 15 27 135 111 123 75 39 FEB 87 51 63 99 CO2
142 130 94 34 82 46 70 118 106 2258 10 ΩCalcite CO3 Temperature
-0.10
JAN
5
47 35 23 11
10
DEC 25 6113 73 49 85 121 109 37 97 133 145
132 48 144 3612 24 pH
Weight Weight Length
-10
0.15
6
0.05
0.10
0
SEP
-0.05
Comp.2
-5
38.2
18 16
38
14
37.8
2
98-03
03-05
0
98-03
03-05
12
93-03
03-05
37.6
93-03
03-05
Figure 7. Comparison of data from time periods before August 2003 with August 2003 to December 2005. Environmental data shown in Fig. 4 have been used in the box and whisker plots showing the quartiles of the data, with the median represented by the horizontal lines inside the boxes. Open circles indicate outliers.
conditions, with decreasing pH and increasing DIC in the case of OA. An experimental design to test the effect of individual parameters of the carbonate system has confirmed 2− that pH, [HCO− 3 ] and [CO3 ] are the main factors controlling coccolith morphology and weight (Bach et al., 2012). [CO2− 3 ] was also the most statistically significant factor controlling coccolith weight in a global set of sediment and water samples (Beaufort et al., 2011). In the data presented here, the seasonal signal can be observed on the carbonate system (e.g., [CO2 ], pH, [CO2− 3 ], Calcite ) in the water column at the DYFAMED site (Figs. 4 and 5). The upper part (0–50 m depth) shows stronger seasonal variability with elevated [CO2 ] and decreased [CO2− 3 ] in late winter and early spring. The lower part (70–200 m depth) shows the opposite and a weaker signal (Fig. 4). The upper and lower parts of the water column have similar [CO2 ] and [CO2− 3 ] values during winter and early spring when the water column is well mixed (Fig. 4). The temperature increases only in the upper 50 m of the water column during the year (Fig. 4) indicating stratified conditions in summer and autumn. This leads to a decrease in [CO2 ] and an increase in [CO2− 3 ] in the upper 50 m of the water column (Copin-Montégut and Bégovic, 2002), whereas the lower part is relatively stable. Seasonal variations in carbonate chemistry such as Calcite , [CO2− 3 ] and [CO2 ] therefore strongly covary with temperature. The largest average coccolith weight of E. huxleyi over the year is reached in February to May despite the elevated [CO2 ] and low [CO2− 3 ] values. Therefore, the effect of the seasonal variation in the carbonate system parameters is smaller than the effect of the www.biogeosciences.net/11/2857/2014/
www.biogeosciences.net/11/2857/2014/
385 375 365
Atmospheric CO2 [ppm]
355 2560 2540 2520
Total Alkalinity [ mol/kg] pH [seawater scale]
8.080 8.090 8.100 230
CO32- [ mol/kg] Calcite
4.4
4.8
5.2
190
210
5.0 4.0 3.0 19 17 15
Temperature [°C]
13 38.6 38.3
Salinity [psu]
38.0 6 4 2
Nitrate [ mol/l]
0 0.20 0.10
1994
1996
1998
2000
2002
2004
2006
1994
1996
1998
2000
2002
2004
2006
5.5
Figure 8. Long-term trends in the environmental data from single spectrum analysis (SSA). Black lines show the evenly spaced data set produced from the environmental measurements (see methods). Red lines indicate the trends from the SSA.
pre-industrial Holocene range Balears
4.5
5.0
Sediment trap SSA trend
4.0
20th century surface sediment average Gulf of Lions
3.5
The Mediterranean Sea has undergone acidification since the onset of industrialization and the effect is largest in the NW Mediterranean Sea (up to 0.14 pH units, Touratier and Goyet, 2011; Touratier et al., 2012). Between the two time periods for which direct measurements of the carbonate system are available, [CO2 ] increases about 1 µmol kg−1 , pH drops by −1 about 0.02, [CO2− 3 ] decreases by 7 µmol kg , and the calcite saturation decreases by 0.14 units when comparing the time periods from 1998 to 2000 and 2003 to 2005 (Fig. 7). The calculated carbonate system parameters for the entire record are in the same range and show the same seasonal amplitude as the direct measurements (Fig. 4). The SSA analysis conducted on this data, coccolith weight and other environmental data reveals significant trends only for coccolith weight and pH, whereas temperature, nutrients, salinity and other carbonate system parameters present limited variability (Fig. 8). Therefore, the most likely cause for the observed mass loss of E. huxleyi coccoliths is the observed change in surface water pH. However, also other parameters for which no data is available may have an additional influence, such as irradiance and turbidity (e.g., Charalampopoulou et al., 2011). Further support for a reduction of coccolithophore calcification due to the influence of ocean acidification comes from the comparison of pre-industrial Holocene and industrial 20th century records of coccolith weight with the sediment trap data. From 1994 to 2000, the scale of the observed weight variability in E. huxleyi coccoliths from the sediment trap is within the range of that recorded in pre-industrial Holocene sediments (Fig. 9). From 2001, annual averages lie in the range of the 20th century surface sediments of the Gulf of Lions, that cover an approximate range of about 40–80 years before the sampling in 1998. From 2004 they fall below these 20th century average weight values (Fig. 9). Even if long-term sediment records that average over a considerable amount of time (40–80 years in the 20th century surface sediment, and a few hundred years in the Holocene record) may not be directly comparable to the interannual trend from the sediment trap, two conclusions can be drawn: (1) coccolith
Phosphate [ mol/l]
Long-term trends
2865
0.00
4.3.2
E. huxleyi average weight [pg]
increase in coccolithophore production shown above (Figs. 4 and 5), in agreement with a recently published global survey (Beaufort et al., 2011). In summary, temperature, nutrients and carbonate chemistry are statistically the most likely candidates for controlling the seasonal changes in coccolith weight. Due to the strong covariation between the parameters, it is difficult to identify the significance of single parameters. The combined effect of all parameters seems to control the phytoplankton succession during the spring bloom. Emiliania huxleyi weight is highest from February to May, which is during the maximum in production of haptophytes. This follows earlier observations, that optimum growth conditions favor calcification in coccolithophores.
Average weight [pg]
K. J. S. Meier et al.: Emiliania huxleyi coccolith thinning in the Mediterranean Sea
1994
1996
1998
2000
2002
2004
2006
Year
Figure 9. Comparison of sediment trap with sediment data. Emiliania huxleyi SSA trend in coccolith weight values from the sediment trap in the Gulf of Lions in comparison with sediments from a 20th century sediment surface (dashed lines indicating 95 % confidence interval), and a pre-industrial Holocene sediment record (blue shaded area indicating range of average weight values) from the NW Mediterranean.
Biogeosciences, 11, 2857–2869, 2014
2866
K. J. S. Meier et al.: Emiliania huxleyi coccolith thinning in the Mediterranean Sea
weight is lower in sediments from the 20th century than in the pre-industrial Holocene and (2) during recent years the average weight of E. huxleyi coccoliths has sunk to values unprecedented in the last 10 000 years. 4.4
Physiological vs. morphotype selectivity
Recent evidence suggests resilience to lower pH environments for a genetically distinct type of the common species E. huxleyi (Beaufort et al., 2011; Read et al., 2013), indicating that the community response of coccolithophores to OA may be different from what can be observed in laboratory experiments on just one strain. Our study examines a natural assemblage and it is very likely that the coccoliths measured here represent more than just one genetic type within E. huxleyi (Read et al., 2013). This natural E. huxleyi assemblage shows a response to OA, which may be due to both physiological responses, e.g., a decrease in calcification, and morphotype selectivity within E. huxleyi. This gives two possible explanations for the observed discrepancy between field and laboratory studies: (1) strains tested in culture are unusual in their response to OA and only display small changes in calcification compared to the majority of types in natural populations. There are, however, different types that have been tested in culture and while the response is variable, it is still within a similar order of magnitude (Hoppe et al., 2011). (2) Therefore, the observed weight decrease in the natural assemblage is probably due to a change in relative abundance of types, with lightly calcifying types become more abundant over time. Likewise, the seasonal variation may be due to alternating populations over the year. This has been demonstrated in a different part of the Mediterranean Sea, where winter/early spring populations are dominated by a heavily calcifying E. huxleyi morphotype, while lighter-calcifying types are present during summer (Triantaphyllou et al., 2010). Our data also shows stronger calcified coccoliths during late winter and spring. This seems to be more likely due to a population change as the magnitude in weight change would be difficult to explain by physiological responses. Alternating populations may also explain the periods of extremely low weights that occur over the record. These occur after strong mixing events, when the phytoplankton community is dominated by diatoms. Only few coccolithophores are found during these periods and they probably represent lightly calcifying types. As these mixing events become more frequent towards the end of the record, they may also be responsible in part for the coccolith weight decrease. The mechanism would then rather be a regime shift towards a diatom-dominated spring bloom that prevents the proliferation of heavily calcified E. huxleyi morphotypes.
Biogeosciences, 11, 2857–2869, 2014
5
Conclusions
Our study demonstrates that long-term and seasonal variability in the average weight of E. huxleyi coccoliths in the Gulf of Lions has different causes. In the long-term the seawater carbonate system displays the strongest change of all environmental parameters. Change in the surface water pH is the parameter most likely to have caused the decrease of E. huxleyi coccolith average weight below Holocene and 20th century values in the western Mediterranean Sea. Productivity has a large influence on E. huxleyi weight on the seasonal scale and future changes in the nutrient regime may have additional influence on the CaCO3 quota in coccolithophores. Still, this study is only a first step in understanding what the effects of ocean acidification on coccolithophore calcification will be in the future. As the physiological response to the changing environment may be smaller than the ecological response, future work should try to disentangle these two processes of coccolithophore community calcification response to ocean acidification for reliable projections of the future global carbonate production. The Supplement related to this article is available online at doi:10.5194/bg-11-2857-2014-supplement.
Acknowledgements. We thank N. Buchet and N. Delsaut for sample preparation. We thank two anonymous reviewers and Jorijntje Henderiks for the helpful reviews. This work has been made possible thanks to partial support from the European Science Foundation (ESF) under the EUROCORES Programme EuroCLIMATE, through contract No. ERAS-CT-2003-980409 of the European Commission, DG Research, FP6 (project MERF), from the Agence Nationale de la Recherche under project ANR-12-B06−0007 (CALHIS) and from the European Community’s Seventh Framework programme under grant agreement 265103 (Project MedSeA). Edited by: J. Bijma
References Ait-Ameur, N. and Goyet, C.: Distribution and transport of natural and anthropogenic CO2 in the Gulf of Cadiz, Deep-Sea Res. Pt. II, 53, 1329–1343, doi:10.1016/j.dsr2.2006.04.003, 2006. Álvarez, M., Sanleón-Bartolomé, H., Tanhua, T., Mintrop, L., Luchetta, A., Cantoni, C., Schroeder, K., and Civitarese, G.: The CO2 system in the Mediterranean Sea: a basin wide perspective, Ocean Sci., 10, 69–92, doi:10.5194/os-10-69-2014, 2014. Bach, L. T., Bauke, C., Meier, K. J. S., Riebesell, U., and Schulz, K. G.: Influence of changing carbonate chemistry on morphology and weight of coccoliths formed by Emiliania huxleyi, Biogeosciences, 9, 3449–3463, doi:10.5194/bg-9-3449-2012, 2012. Beaufort, L.: Weight estimates of coccoliths using the optical properties (birefringence) of calcite, Micropaleontology, 51, 289– 297, doi:10.2113/gsmicropal.51.4.289, 2005.
www.biogeosciences.net/11/2857/2014/
K. J. S. Meier et al.: Emiliania huxleyi coccolith thinning in the Mediterranean Sea Beaufort, L. and Dollfus, D.: Automatic recognition of coccoliths by dynamical neural networks, Mar. Micropaleontol., 51, 57–73, doi:10.1016/j.marmicro.2003.09.003, 2004. Beaufort, L., Probert, I., and Buchet, N.: Effects of acidification and primary production on coccolith weight: Implications for carbonate transfer from the surface to the deep ocean, Geochem. Geophy. Geosy., 8, Q08011, doi:10.1029/2006GC001493, 2007. Beaufort, L., Couapel, M., Buchet, N., Claustre, H., and Goyet, C.: Calcite production by coccolithophores in the south east Pacific Ocean, Biogeosciences, 5, 1101–1117, doi:10.5194/bg-5-11012008, 2008. Beaufort, L., Probert, I., de Garidel-Thoron, T., Bendif, E. M., RuizPino, D., Metzl, N., Goyet, C., Buchet, N., Coupel, P., Grelaud, M., Rost, B., Rickaby, R. E. M., and de Vargas, C.: Sensitivity of coccolithophores to carbonate chemistry and ocean acidification, Nature, 476, 80–83, doi:10.1038/nature10295, 2011. Behrenfeld, M. and Falkowski, P.: Photosynthetic rates derived from satellite-based chlorophyll concentration, Limnol. Oceanogr., 42, 1–20, 1997. Berger, C., Meier, K. J. S., Kinkel, H., and Baumann, K.H.: Changes in calcification of coccoliths under stable atmospheric CO2 , Biogeosciences, 11, 929–944, doi:10.5194/bg-11929-2014, 2014. Bethoux, J. P., Boukhary, El, M. S., Ruiz-Pino, D., Morin, P., and Copin-Montégut, C.: Nutrient, oxygen and carbon ratios, CO2 sequestration and anthropogenic forcing in the Mediterranean Sea, in The Mediterranean Sea, Hdb. Environ. Chem., 5, 67–86, doi:10.1007/b107144, Springer Berlin Heidelberg, 2005. Bindoff, N. L., Willebrand, J., Artale, V., Cazenave, A., Gregory, J., Gulev, S., Hanawa, K., LeQuéré, C., Levitus, S., Nojiri, Y., Shum, C. K., Talley, L. D., and Unnikrishnan, A.: Observations: Oceanic Climate Change and Sea Level, Climate Change 2007: The Physical Science Basis. Contribution of Working Group I to the Fourth Assessment Report of the Intergovernmental Panel on Climate Change, edited by: Solomon, S., Qin, D., Manning, M., Chen, Z., Marquis, M., Averyt, K. B., Tignor, M., and Miller, H. L., Cambridge University Press, Cambridge, United Kingdom and New York, NY, USA, 2007. Bollmann, J., Herrle, J. O., Cortés, M. Y., and Fielding, S. R.: The effect of sea water salinity on the morphology of Emiliania huxleyi in plankton and sediment samples, Earth Planet. Sci. Lett., 284, 320–328, doi:10.1016/j.epsl.2009.05.003, 2009. Canals, M., Puig, P., de Madron, X. D., Heussner, S., Palanques, A., and Fabres, J.: Flushing submarine canyons, Nature, 444, 354– 357, doi:10.1038/nature05271, 2006. Charalampopoulou, A., Poulton, A. J., Tyrrell, T., and Lucas, M. I.: Irradiance and pH affect coccolithophore community composition on a transect between the North Sea and the Arctic Ocean, Mar. Ecol.-Prog. Ser., 431, 25–43, doi:10.3354/meps09140, 2011. Copin-Montégut, C. and Bégovic, M.: Distributions of carbonate properties and oxygen along the water column (0–2000 m) in the central part of the NW Mediterranean Sea (Dyfamed site): influence of winter vertical mixing on air-sea CO2 and O2 exchanges, Deep-Sea Res. Pt. II, 49, 2049–2066, 2002. Copin-Montégut, C., Bégovic, M., and Merlivat, L.: Variability of the partial pressure of CO2 on diel to annual time scales in the Northwestern Mediterranean Sea, Mar. Chem., 85, 169–189, 2004.
www.biogeosciences.net/11/2857/2014/
2867
Daniels, C. J., Tyrrell, T., Poulton, A. J., and Pettit, L.: The influence of lithogenic material on particulate inorganic carbon measurements of coccolithophores in the Bay of Biscay, Limnol. Oceanogr., 57, 145–153, doi:10.4319/lo.2012.57.1.0145, 2012. De Bodt, C., Van Oostende, N., Harlay, J., Sabbe, K., and Chou, L.: Individual and interacting effects of pCO2 and temperature on Emiliania huxleyi calcification: study of the calcite production, the coccolith morphology and the coccosphere size, Biogeosciences, 7, 1401–1412, doi:10.5194/bg-7-1401-2010, 2010. Dickson, A. and Millero, F.: A comparison of the equilibrium constants for the dissociation of carbonic acid in seawater media, Deep-Sea Res., 34, 1733–1743, 1987. Dickson, A. G.: Standard potential of the reaction: AgCl(s) + 12H2 (g) = Ag(s) + HCl(aq), and the standard acidity constant of the ion HSO− 4 in synthetic sea water from 273.15 to 318.15 K, J. Chem. Thermodyn., 22, 113–127, 1990. Emeis, K.-C., Schulz, H., Struck, U., Rossignol-Strick, M., Erlenkeuser, H., Howell, M., Kroon, D., Mackensen, A., Ishizuka, S., Oba, T., Sakamoto, T., and Koizumi, I.: Eastern Mediterranean surface water temperatures and δ 18 O composition during deposition of sapropels in the late Quaternary, Paleoceanography, 18, 1005, doi:10.1029/2000PA000617, 2003. Fielding, S., Herrle, J., and Bollmann, J.: Assessing the applicability of Emiliania huxleyi coccolith morphology as a sea-surface salinity proxy, Limnol. Oceanogr., 54, 1475–1480, 2009. Flores, J.-A., Colmenero-Hidalgo, E., Mejia-Molina, A. E., Baumann, K.-H., Henderiks, J., Larsson, K., Prabhu, C. N., Sierro, F. J., and Rodrigues, T.: Distribution of large Emiliania huxleyi in the Central and Northeast Atlantic as a tracer of surface ocean dynamics during the last 25,000 years, Mar. Micropaleontol., 76, 53–66, doi:10.1016/j.marmicro.2010.05.001, 2010. Gehlen, M., Gangstø, R., Schneider, B., Bopp, L., Aumont, O., and Ethe, C.: The fate of pelagic CaCO3 production in a high CO2 ocean: a model study, Biogeosciences, 4, 505–519, doi:10.5194/bg-4-505-2007, 2007. Golyandina, N. and Korobeynikov, A.: Basic Singular Spectrum Analysis and Forecasting with R, Computational Statistics and Data Analysis, 71, 934–954, doi:10.1016/j.csda.2013.04.009, 2014. Grelaud, M., Beaufort, L., Cuven, S., and Buchet, N.: Glacial to interglacial primary production and El Nino-Southern Oscillation dynamics inferred from coccolithophores of the Santa Barbara Basin, Paleoceanography, 24, PA1203, doi:10.1029/2007PA001578, 2009. Hagino, K., Okada, H., and Matsuoka, H.: Coccolithophore assemblages and morphotypes of Emiliania huxleyi in the boundary zone between the cold Oyashio and warm Kuroshio currents off the coast of Japan, Mar. Micropaleontol., 55, 19-47, 2005. Heussner, S., Durrieu de Madron, X., Calafat, A., Canals, M., Carbonne, J., Delsaut, N., and Saragoni, G.: Spatial and temporal variability of downward particle fluxes on a continental slope: Lessons from an 8-yr experiment in the Gulf of Lions (NW Mediterranean), Mar. Geol., 234, 63–92, 2006. Hoppe, C., Langer, G., and Rost, B.: Emiliania huxleyi shows identical responses to elevated pCO2 in TA and DIC manipulations, J. Exp. Mar. Biol. Ecol., 406, 54–62, 2011. Iglesias-Rodriguez, M. D., Halloran, P. R., Rickaby, R. E. M., Hall, I. R., Colmenero-Hidalgo, E., Gittins, J. R., Green, D. R. H., Tyrrell, T., Gibbs, S. J., Dassow, von, P., Rehm,
Biogeosciences, 11, 2857–2869, 2014
2868
K. J. S. Meier et al.: Emiliania huxleyi coccolith thinning in the Mediterranean Sea
E., Armbrust, E. V., and Boessenkool, K. P.: Phytoplankton calcification in a high-CO2 world, Science, 320, 336–340, doi:10.1126/science.1154122, 2008. Kayano, K. and Shiraiwa, Y.: Physiological regulation of coccolith polysaccharide production by phosphate availability in the coccolithophorid Emiliania huxleyi, Plant Cell Physiol., 50, 1522– 1531, doi:10.1093/pcp/pcp097, 2009. Kleypas, J. A.: Geochemical consequences of increased atmospheric carbon dioxide on coral reefs, Science, 284, 118–120, doi:10.1126/science.284.5411.118, 1999. Kleypas, J. A., Feely, R. A., Fabry, V. J., Langdon, C., Sabine, C. L., and Robbins, L. L.: Impacts of ocean acidification on coral reefs and other marine calcifiers. A Guide for Future Research. Report of a workshop sponsored by NSF, NOAA & USGS., 88 pp., 2006. Kroeker, K. J., Kordas, R. L., Crim, R., Hendriks, I. E., Ramajo, L., Singh, G. S., Duarte, C. M., and Gattuso, J. P.: Impacts of ocean acidification on marine organisms: quantifying sensitivities and interaction with warming, Glob. Change Biol., 19, 1884–1896, doi:10.1111/gcb.12179, 2013. Krug, S. A., Schulz, K. G., and Riebesell, U.: Effects of changes in carbonate chemistry speciation on Coccolithus braarudii: a discussion of coccolithophorid sensitivities, Biogeosciences, 8, 771–777, doi:10.5194/bg-8-771-2011, 2011. Langer, G., Nehrke, G., Probert, I., Ly, J., and Ziveri, P.: Strain-specific responses of Emiliania huxleyi to changing seawater carbonate chemistry, Biogeosciences, 6, 2637–2646, doi:10.5194/bg-6-2637-2009, 2009. Lewis, E. and Wallace, D.: Program developed for CO2 System Calculations, ORNL/CDIAC-105, http://cdiac.ornl.gov/oceans/ co2rprt.html, Carbon Dioxide Inf. Anal. Cent., Oak Ridge Natl. Lab., US Dep. of Energy, Oak Ridge, Tenn., 1998. Lischka, S., Büdenbender, J., Boxhammer, T., and Riebesell, U.: Impact of ocean acidification and elevated temperatures on early juveniles of the polar shelled pteropod Limacina helicina: mortality, shell degradation, and shell growth, Biogeosciences, 8, 919–932, doi:10.5194/bg-8-919-2011, 2011. Marty, J. C. and Chiavérini, J.: Hydrological changes in the Ligurian Sea (NW Mediterranean, DYFAMED site) during 1995–2007 and biogeochemical consequences, Biogeosciences, 7, 2117– 2128, doi:10.5194/bg-7-2117-2010, 2010. Marty, J., Chiaverini, J., Pizay, M., and Avril, B.: Seasonal and interannual dynamics of nutrients and phytoplankton pigments in the western Mediterranean Sea at the DYFAMED time-series station (1991–1999), Deep-Sea Res. Pt. II, 49, 1965–1985, 2002. Mehrbach, C., Culberson, C., Hawley, J., and Pytcowicz, R.: Measurement of the apparent dissociation constants of carbonic acid in seawater at atmospheric pressure, Limnol. Oceanogr., 18, 897– 907, 1973. Millot, C.: Circulation in the Western Mediterranean Sea, Oceanol. Acta, 10, 143–149, 1987. Miralles, J., Radakovitch, O., and Aloisi, J.-C.: 210 Pb sedimentation rates from the Northwestern Mediterranean margin, Mar. Geol., 216, 155– 167, 2005. Moy, A. D., Howard, W. R., Bray, S. G., and Trull, T. W.: Reduced calcification in modern Southern Ocean planktonic foraminifera, Nat. Geosci., 2, 276–280, doi:10.1038/ngeo460, 2009.
Biogeosciences, 11, 2857–2869, 2014
Müller, M. N., Antia, A. N., and LaRoche, J.: Influence of cell cycle phase on calcification in the coccolithophore Emiliania huxleyi, Limnol. Oceanogr., 53, 506–512, 2008. Orr, J. C., Fabry, V. J., Aumont, O., Bopp, L., Doney, S. C., Feely, R. A., Gnanadesikan, A., Gruber, N., Ishida, A., Joos, F., Key, R. M., Lindsay, K., Maier-Reimer, E., Matear, R., Monfray, P., Mouchet, A., Najjar, R. G., Plattner, G.-K., Rodgers, K. B., Sabine, C. L., Sarmiento, J. L., Schlitzer, R., Slater, R. D., Totterdell, I. J., Weirig, M.-F., Yamanaka, Y., and Yool, A.: Anthropogenic ocean acidification over the twenty-first century and its impact on calcifying organisms, Nature, 437, 681–686, doi:10.1038/nature04095, 2005. Pinardi, N. and Masetti, E.: Variability of the large scale general circulation of the Mediterranean Sea from observations and modelling: a review, Palaeogeogr. Palaeocl., 158, 153–174, 2000. Read, B. A., Kegel, J., Klute, M. J., Kuo, A., Lefebvre, S. C., Maumus, F., Mayer, C., Miller, J., Monier, A., Salamov, A., Young, J., Aguilar, M., Claverie, J.-M., Frickenhaus, S., Gonzalez, K., Herman, E. K., Lin, Y.-C., Napier, J., Ogata, H., Sarno, A. F., Shmutz, J., Schroeder, D., de Vargas, C., Verret, F., Dassow, von, P., Valentin, K., Van de Peer, Y., Wheeler, G., Allen, A. E., Bidle, K., Borodovsky, M., Bowler, C., Brownlee, C., Mark Cock, J., Elias, M., Gladyshev, V. N., Groth, M., Guda, C., Hadaegh, A., Debora Iglesias-Rodriguez, M., Jenkins, J., Jones, B. M., Lawson, T., Leese, F., Lindquist, E., Lobanov, A., Lomsadze, A., Malik, S.-B., Marsh, M. E., Mackinder, L., Mock, T., Mueller-Roeber, B., Pagarete, A., Parker, M., Probert, I., Quesneville, H., Raines, C., Rensing, S. A., Riaño-Pachón, D. M., Richier, S., Rokitta, S., Shiraiwa, Y., Soanes, D. M., van der Giezen, M., Wahlund, T. M., Williams, B., Wilson, W., Wolfe, G., Wurch, L. L., Dacks, J. B., Delwiche, C. F., Dyhrman, S. T., Glöckner, G., John, U., Richards, T., Worden, A. Z., Zhang, X., and Grigoriev, I. V.: Pan genome of the phytoplankton Emiliania underpins its global distribution, Nature, 499, 209–213, doi:10.1038/nature12221, 2013. Riebesell, U., Zondervan, I., Rost, B., Tortell, P., Zeebe, R. E., and Morel, F.: Reduced calcification of marine plankton in response to increased atmospheric CO2 , Nature, 407, 364–367, 2000. Rigual-Hernández, A., Bárcena, M., Sierro, F., Flores, J., Hernández-Almeida, I., Sanchez-Vidal, A., Palanques, A., and Heussner, S.: Seasonal to interannual variability and geographic distribution of the silicoflagellate fluxes in the Western Mediterranean, Mar. Micropalaeontol., 77, 46–57, 2010. Satoh, M., Iwamoto, K., Suzuki, I., and Shiraiwa, Y.: Cold stress stimulates intracellular calcification by the coccolithophore, Emiliania huxleyi (Haptophyceae) under phosphate-deficient conditions, Mar. Biotechnol., 11, 327–333, doi:10.1007/s10126008-9147-0, 2009. Schneider, A., Tanhua, T., Körtzinger, A., and Wallace, D. W. R.: High anthropogenic carbon content in the eastern Mediterranean, J. Geophys. Res., 115, C12050, doi:10.1029/2010JC006171, 2010. Schneider, A., Wallace, D. W. R., and Körtzinger, A.: Alkalinity of the Mediterranean Sea, Geophys. Res. Lett., 34, 1–5, doi:10.1029/2006GL028842, 2007. Smith, H. E. K., Tyrrell, T., Charalampopoulou, A., Dumousseaud, C., Legge, O. J., Birchenough, S., Pettit, L. R., Garley, R., Hartman, S. E., Hartman, M. C., Sagoo, N., Daniels, C. J., Achterberg, E. P., and Hydes, D. J.: Predominance of heavily calcified
www.biogeosciences.net/11/2857/2014/
K. J. S. Meier et al.: Emiliania huxleyi coccolith thinning in the Mediterranean Sea coccolithophores at low CaCO3 saturation during winter in the Bay of Biscay, P. Natl. Acad. Sci., 109, 8845–8849, 2012. Touratier, F. and Goyet, C.: Impact of the Eastern Mediterranean Transient on the distribution of anthropogenic CO2 and first estimate of acidification for the Mediterranean Sea, Deep-Sea Res. Pt. I, 58, 1–15, doi:10.1016/j.dsr.2010.10.002, 2011. Touratier, F., Guglielmi, V., Goyet, C., Prieur, L., Pujo-Pay, M., Conan, P., and Falco, C.: Distributions of the carbonate system properties, anthropogenic CO2 , and acidification during the 2008 BOUM cruise (Mediterranean Sea), Biogeosciences Discuss., 9, 2709–2753, doi:10.5194/bgd-9-2709-2012, 2012. Triantaphyllou, M., Dimiza, M., Krasakopoulou, E., Malinverno, E., Lianou, V., and Souvermezoglou, E.: Seasonal variation in Emiliania huxleyi coccolith morphology and calcification in the Aegean Sea (Eastern Mediterranean), Geobios-Lyon, 43, 99– 110, doi:10.1016/j.geobios.2009.09.002, 2010.
www.biogeosciences.net/11/2857/2014/
2869
Van de Waal, D. B., John, U., Ziveri, P., and Reichart, G. J.: Ocean acidification reduces growth and calcification in a marine dinoflagellate, PLoS One, 8, e65987, doi:10.1371/journal.pone.0065987, 2013. Wilson, J. D., Barker, S., and Ridgwell, A.: Assessment of the spatial variability in particulate organic matter and mineral sinking fluxes in the ocean interior: Implications for the ballast hypothesis, Global Biogeochem. Cy., 26, GB4011, doi:10.1029/2012GB004398, 2012. Young, J. R., Bergen, J. A., Bown, P. R., Burnett, J. A., Fiorentino, A., Jordan, R. W., Kleijne, A., van Niel, B. E., Romein, A. J. T., and Salis, von, K.: Guidelines for coccolith and calcareous nannofossil terminology, Palaeontology, 40, 875–912, 1997. Young, J. and Ziveri, P.: Calculation of coccolith volume and its use in calibration of carbonate flux estimates, Deep-Sea Res. Pt. II, 47, 1679–1700, 2000. Zeebe, R. E.: History of seawater carbonate chemistry, atmospheric CO2 , and ocean acidification, Annu. Rev. Earth Planet. Sci., 40, 141–165, doi:10.1146/annurev-earth-042711-105521, 2012.
Biogeosciences, 11, 2857–2869, 2014
2.5 measurements in a year with gap
Theoretical environmental variable
12-year average of measurements Δbefore gap and Δafter gap
2
slope of Δbefore gap and Δafter gap filled gap = 12-year average + slope gap filled by linear interpolation
Δafter gap = measuredAUG - averageAUG
1.5
1
Δbefore gap = measuredAPR - averageAPR
0.5
0
-0.5 JAN FEB MAR APR MAY JUN JUL AUG SEP OCT NOV DEC
Months 1 2 3
Supplementary Figure 1. Gap filling methods. A theoretical environmental variable over the
4
course of a year with two gaps (May to June and October) is shown (blue line with squares).
5
Short gaps were filled by linear interpolation (green dashed line). Where a linear interpolation
6
would be inappropriate, the 12-year average (red line with circles) was used and adjusted for
7
the specific year. The difference between the measurements and the 12-year averages were
8
calculated for the months before and after the gap (Δbefore gap, Δafter gap, orange triangles). The
9
slope between these values was used to calculate correction values for the values in the gap
10
(open triangles). These were added to the 12-year average values in order to obtain the gap
11
filling (green line and diamonds).
12
1