The State Corporate Income Tax: Recent Trends for a Troubled Tax David Brunori Research Professor of Public Policy George Washington Institute of Public Policy The George Washington University 9816 Bridleridge Ct. Vienna, VA 22181 703-533-4676
[email protected] Joseph J. Cordes Professor of Economics and Associate Director School of Public Policy and Public Administration MPA Building 623 George Washington University Washington, DC 20052 202-994-5826
[email protected]
Submitted to the American Institute of Tax Policy August 15, 2005
ABSTRACT The state corporate income tax (CIT) has been declining for years. This paper examines the trends in state CIT revenue between 1980 and 2000. The authors construct a state corporate tax performance index and find that between 1980 and 1995 the problems with the state CIT mirrored those faced by federal corporate taxes. But in the period 1995-2000, serious independent problems developed with the state tax. The paper finds that the failure to require combined reporting and the use of single factor apportionment can have negative effects on state corporate income tax revenue.
Introduction The state corporate income tax produces a relatively small amount of revenue for state governments. Indeed, the states currently raise about five percent of their total tax revenue from corporate income taxes, and corporate tax receipts have declined steadily as a percentage of total state tax revenue over time. Most observers agree that, under the current system, the percentage of revenue raised from the corporate income tax is unlikely to increase, and may decrease even further (Pomp 1998, Brunori 2002). Although the corporate income tax raises relatively little state revenue, it poses a number of nettlesome policy issues for the states. States are under political pressure to structure their business tax systems in a manner that promotes economic development. This has led to the adoption of single and double weighted apportionment formulas, the granting of tax incentives, and the reluctance to adopt combined unitary reporting. In addition, complying with and administering the tax consume an inordinate amount of intellectual and financial capital so that the compliance and administrative costs of the state corporate income tax are the highest per dollar raised of any other source of tax revenue. Even though state corporate taxes generate large political and administrative headaches in relation to the amount of revenue raised, few political or policy leaders advocate either eliminating it or reforming it to make the tax more effective. This paper examines the state corporate income system in the United States. The next section discusses the current status of the tax (as of 2004), as well as the historical underpinnings of the tax. Section 3 explores the decline of the corporate income tax by examining the patterns and trends in state corporate income taxation between the years 1980 and 2001. Section 4 provides a statistical analysis of state corporate tax receipts to examine the effects of certain factors such as apportionment formulas on the decline of the tax. Section 5 provides a description 1
of the common arguments for state corporate taxation. And Section 5 discusses what policies can or should be taken to strengthen the state corporate income tax.
2. State Corporate Income Tax Today Forty-seven states tax corporate net income, including traditionally anti-income tax jurisdictions such as Tennessee, New Hampshire, and Florida. In 2004, the tax accounted for about $30 billion in tax revenue for the states, according to the U.S. Census Bureau. Only Nevada, Washington, and Wyoming do not impose any taxes on corporate income. Corporate income taxes make up a surprisingly small portion of state revenues in most states. The relative importance of the state corporate income tax has steadily declined for decades. From its high of about 9.7 percent in 1977, the state corporate income tax had dropped to 5.7 percent in 2001, and to about five percent of total state tax revenue in 2004. And the tax accounts for less than two percent of total state revenue (tax and non-tax revenue). The corporate income tax’s importance is dwarfed by the much larger amount of revenue collected from personal income, consumption, and excise taxes. Table 1 presents data on the percentage of revenue raised by the state corporate income tax in 2001, along with the actual amounts of revenue raised. Even in states with long traditions of progressive taxation, which would seem most likely to rely on the tax, the revenue gained from corporate taxes is minimal. For example, Oregon, historically one of the most progressive states in terms of taxation, has no sales tax and a history of relatively high personal income taxes. The state raised only 5.7 percent of its tax revenue from corporate levies in 2001. Oregon raised more than twice the amount from sales and gross receipts taxes ($ 660 million) than it did from
2
State Alaska New Hampshire Illinois Delaware Michigan Tennessee Indiana California New York Massachusetts Montana New Jersey Arizona Florida West Virginia Pennsylvania Idaho Oregon Minnesota North Dakota Georgia New Mexico Kansas Maryland North Carolina Kentucky Nebraska Colorado South Dakota Mississippi Wisconsin Louisiana Utah Connecticut Arkansas Maine Rhode Island Ohio Iowa South Carolina Vermont Virginia Alabama Missouri Oklahoma Hawaii
Table 1: Relative Importance of State Corporate Taxes: 2001 Corporate Revenue Collected State Corporate Tax as a % of Total State Taxes (2001) ($Millions) More Than 10% 28.0% $400,442 19.7% $350,363 5% to 10% 9.6% $2,216,842 9.5% $207,320 9.4% $2,102,093 8.6% $673,465 8.1% $825,017 7.6% $6,899,302 7.1% $3,199,483 7.0% $1,211,584 6.9% $103,670 6.8% $1,300,785 6.4% $541,174 6.4% $1,591,473 6.3% $214,297 6.2% $1,401,299 5.6% $141,986 5.5% $322,651 5.4% $732,004 5.1% $63,390 Less than 5% 4.8% $691,473 4.8% $190,673 4.7% $236,723 4.6% $501,365 4.6% $723,635 4.6% $361,390 4.6% $138,040 4.5% $340,039 4.4% $43,387 4.4% $210,786 4.2% $495,449 4.1% $293,056 4.0% $162,754 3.9% $413,109 3.8% $186,277 3.6% $96,283 3.5% $77,998 3.4% $663,376 3.2% $166,745 3.1% $192,070 2.9% $44,606 2.8% $363,757 2.7% $174,069 2.7% $236,261 2.6% $167,222 1.7% $60,499
3
its corporate income tax ($322 million). Montana, another state with a progressive tax history, raised only $102 million from corporate income taxes in 2001 compared to over $450 million from sales and gross receipts taxes. Table 1 also shows that while the corporate tax is a modest source of revenue for many students, its importance varies. Two states, Alaska and New Hampshire derived more than 10 percent of total state revenue from corporate income states. An additional eight states: Illinois, Delaware, Michigan, Tennesee, Indiana, California, New York, and Massachusetts derived between 7 percent and 10 percent. It should be noted, however, that Alaska and New Hampshire do not tax personal income, while Alaska, New Hampshire, and Delaware do not impose statewide sales tax. Historical Underpinnings Although states have imposed taxes on various business activities since the nation’s start, today’s corporate net income tax can be traced to Wisconsin’s Income Tax Law of 1911. The tax proved successful in progressive Wisconsin, and its success quickly led to adoption of the corporate income tax by five other states. By 1930, 17 more states had adopted the tax; by 1940, an additional 17 states had begun taxing corporate income. The relatively rapid spread of state corporate taxation is attributable to a number of political and economic factors. Progressive and populist political leaders with a skeptical view of corporations controlled many states in the early part of the 20th century. The opportunity to raise revenue from corporations fit naturally with their political philosophies. These same leaders fought successfully to implement progressive personal income taxes at the federal and state levels.
4
The growth of the corporate tax in the mid-1900s also reflected a developing movement in most states to diversify their tax systems (Brunori 2001). Throughout the 19th century, state governments financed their operations mainly through excise and some form of property taxes. These financing systems, however, did not raise enough revenue to meet growing public service demands. The early and mid-20th century saw the adoption of personal income taxes as well as sales and use taxes throughout the country. The tax on corporate income was part of the expansion to diversify the overall tax base. These fundamental changes to how states collect revenue have persisted into the start of this century. Like other levies, the state corporate income tax was developed for a far different economy. The tax was designed at a time when most corporations manufactured tangible personal property. It was also designed to function in an environment in which interstate tax competition was not nearly as intense as it is today. Although that economy no longer dominates, the tax has largely remained the same.
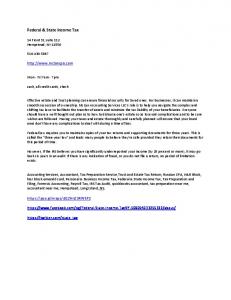
3. Patterns and Trends in State Corporate Tax Receipts The state corporate income tax has been declining in importance for several decades. This decline has generated substantial academic study and political debate on various aspects of state taxation of business in general and of corporate profits in particular (see Cornia, et. al., 2005 and sources cited therein; Brunori 2002). Table 1, which shows how the relative importance of federal and state corporate income has changed between 1980 and 2000, illustrates the decline of the state corporate tax as a revenue source. The state corporate tax data track the share of net corporate income taxes
5
reported in the Census of Governments as a percentage of total state tax revenue; and the federal corporate tax data track the share of the federal corporate income tax as a share of federal tax revenue. The simple trends shown in Table 1 reveal three patterns. First, for much of the period from 1980 to 2001, the ebbs and flows in the relative importance of the state corporate tax have corresponded to similar ebbs and flows in the relative importance of the federal corporate tax. Second, as shown by the two trend lines, there appears to have been a stronger secular decline in the importance of the state corporate income tax compared with the federal corporate income tax.
Figure 1: Trends in Federal and State Corporate Tax Shares: 1980-2000 16.0% % .9 13
14.0% % .1 12
% .5 11
% .3
10
% .4
10
% .5
% .5 10
11
% .7 12
% .7 12
% .6 12
% .1 12
% .2
% .4 11
% .2 11
6.0%
5. 7%
6. 0%
6. 2%
6. 6%
6. 9%
7. 0%
7. 3%
6. 8%
6. 6%
7. 2%
8. 4%
10
11
8. 2%
7. 9%
7. 7%
8. 6%
8.0%
10
% .4
8. 4%
8% 9.
9. 4%
10.0%
9. 7%
Share of Total Taxes
10
% .9 10
% .4
8. 1%
12.0%
% .6 11
% .7
6. 8%
2%
8. 2%
. 12
4.0%
2.0%
Federal Corporate Tax
State Corporate Tax
Linear (Federal Corporate Tax)
20 00
19 99
19 98
19 97
19 96
19 95
19 94
19 93
19 92
19 91
19 90
19 89
19 88
19 87
19 86
19 85
19 84
19 83
19 82
19 81
19 80
0.0%
Linear (State Corporate Tax)
Lastly, there appears to be decoupling of state and federal trends during the period 1995-2000 when federal corporate taxes rebound and state corporate taxes continue to decline. 6
The data suggests that there are common factors affecting both federal and state taxes. But as will be demonstrated below, the performance of the state corporate tax toward the end of the 1990s suggests that there may also be factors specific to the state corporate tax that have contributed to its decline in importance as a revenue source. Table 2 which compares the growth in corporate profits before taxes with growth in both federal and state corporate tax collections provides some additional insight into this issue. In 1980-84, corporate profits grew at an annual average rate of 1.4 percent, federal corporate income tax receipts grew at an annual average rate of 0.6 percent, and state corporate income tax receipts grew at an annual average rate of 3.9 percent. In 1985-89, corporate profits grew at an annual average rate of 10.2 percent, federal corporate income taxes grew at an annual average rate of 8.6 percent, and state corporate income tax receipts grew at an annual average rate of 7.8.3 percent. In 1990-1994, corporate profits grew at an annual average rate of 9.3 percent, federal corporate income tax receipts at an annual average rate of 6.9%, and state corporate income taxes at a rate of 7.5 percent. In 1995-2000, corporate profits grew at an annual average rate of 3.2 percent, federal corporate income tax revenues grew at a rate of 6.2% percent and state corporate income tax receipts grew at an annual average rate of 2.3 percent.
7
Figure 2: Average Annual Growth Rates: Corporate Profits Before Tax and Federal and State Corporate Taxes 12.0%
10.2%
Average Annual Growth Rate
10.0%
9.3% 8.6% 7.8%
8.0%
7.5% 6.9% 6.2%
6.0%
3.9%
4.0%
3.2% 2.3% 2.0%
1.4% 0.6%
0.0% 1980-84
1985-89 Corporate Profits
1990-94
Federal Corporate Tax
1995-2000
State Corporate Tax
Again, these data paint a picture similar to that shown in Figure 1. Namely, periods of higher revenue growth in the federal corporate income tax (e.g. 1985-89 and 1990-94 vs. 198084) were accompanied by similar periods of higher revenue growth in state corporate taxes, and lower revenue growth in federal corporate taxes in 1995-2000 relative to 1990-1994 was accompanied by lower revenue growth in state corporate income taxes. Note however, that in 1995-2000, annual growth in the state corporate income tax dropped by almost seventy percent from 7.5% per year to 2.3% per year, while the drop in the annual growth rate in the federal corporate revenue was just over ten percent. Elasticity of State Tax Collections With Respect to Federal Corporate Collections Another way of comparing trends in state and federal corporate income tax revenue is to estimate the statistical relationship between state and federal corporate tax collections. One
8
measure of the extent to which the revenue performance of the state corporation tax mirrors that of the federal corporate income tax is the elasticity of state corporate revenues with respect to federal corporate tax revenue. This elasticity, which we denote as β, is the ratio of the percentage change in state corporate tax revenue to the percentage change in federal tax revenue. If the elasticity is 1.0, then the percentage change in state corporate tax revenue equals the percentage change in federal corporate revenue, which could, for example, mean that a doubling in corporate tax receipts would be accompanied by a doubling in state corporate tax receipt, or that state corporate tax collections moved proportionately with federal corporate tax collections. If the elasticity was less than 1.0, then the percentage change in state corporate tax revenue would be less than the percentage change in federal corporate revenue, which would mean that state corporate tax collections moved less than proportionately with federal corporate tax collections. If the elasticity was greater than 1.0, the implication would be that state corporate tax collections moved more than proportionately with federal corporate taxes. The elasticity can be estimated from the following equation: (1) log StateCorp t = β 0 + β 1 log FedCorpt + ε t where logStateCorp is the logarithm of total state net corporate income tax collections in year t, and logFedCorp is the logarithm of federal corporate tax collections in year t. The estimated value of the coefficient β1 is the estimated elasticity of state corporate tax collections with respect to federal corporate tax collections. The results of estimating equation (1) are presented below in Table 1. The equation is estimated for the entire time period 1980-2001, and for the following subperiods: 1980-1989, 1990-2001, 1980-1984, 1985-1989, 1990-1994, and 1995-2001. Estimates are presented both for
9
the “point” estimate of the elasticity, and also for the 95% confidence interval of the estimate. Several patterns are evident in Table 2. First, for the ten year period from 1980 to 89, the estimated elasticity of state corporate tax collections with respect to federal corporate tax collections is .94, and with 95% confidence, we cannot reject the hypothesis that is 1.0. In contrast, from 1990 to 2001, the estimated elasticity is only .60, and its confidence interval is generally outside of (e.g. has lower values than) the confidence interval for the elasticity estimate for 1980-89 and is less than 1.0. In other words, state corporate tax collections moved roughly proportionately with federal corporate tax collections in the 1980s, but less than proportionately in the 1990s. The estimates for the shorter sub-intervals presented in Table 1 need to be interpreted carefully because of the small number of annual observations in each time period. Nonetheless, although the point estimates of the elasticity are imprecise, their pattern – e.g. an estimated elasticity of .29 for 1995-2001 vs. .63 for for 1990-94-- results suggest that the “decoupling” of state and corporate revenue patterns that is suggested by the lower estimated elasticity for the 1990s compared with the 1980s was more a phenomenon of the period from 1995 onward than for the first part of the 1990s. We provide further evidence on this point in the next section.
10
Table 2: Estimated Elasticity of State Corporate Tax Collections with Respect to Federal Tax Collections Point Estimate of Elasticity
95% Confidence Interval
1980-2001 (N=22)
.69
(.62 to .76)
1980-1989 (N=10)
.94
(.68 to 1.19)
1990-2001 (N=12)
.60
(.50 to .70)
1980-1984 (N=5)
.49
(-.70 to 1.67)
1985-1989 (N=5)
.64
(.36 to .92)
1990-1994 (N=5)
.63
(.16 to 1.09)
1995-2001 (N=7)
.29
(0.02 to .59)
Explanation of Trends There has been much speculation and research as to the causes of the state corporate tax decline that are documented in Figures 1 and 2. One of the most complete studies of recent trends in state corporate income taxes was recently completed by Cornia, Edmiston, Sjoquist, and Wallace (2005). That research studied alternative explanations for the decline of the state corporate income tax relative to the economy. The authors used a variety of methods included surveys of state tax administrators, tax return information from Utah and Georgia, and panel data. Effect of Federal Tax Changes. Cornia (et. al.) examined changes in federal taxable income that have affected state corporate income taxes. The authors found that the adjusted effective federal tax rate declined from 40 to 20 percent between 1960 and 1982. Between 1982 and 1987 the effective tax rate increased to 42 percent. But by 2002, the effective rate had fallen to 25 percent. The authors concluded that because the effective federal tax rate did not fall between 1980 and 2002 (it actually increased), changes in federal corporate tax policy (which largely occurred in
11
the late 1980s) did not appear to be the cause of the decrease in state corporate income taxes (120). Survey of Tax Administrators The authors conducted a survey of state tax administrators to solicit their views on the decline of the corporate tax. The survey results indicated that no one factor contributed to the decline of the tax, but rather many factors had a small negative effect on corporate tax revenue. (122). The most cited factors contributing to the decline were aggressive tax planning, creation of pass through entities, and continuing pressures on states to provide business tax incentives. Case Studies of Georgia and Utah The authors also examined the performance of state corporate taxes in two states in some detail to determine what factors influenced the decline in the tax. In the case of Georgia creation of pass through entities (132), changes in apportionment factors (i.e., the amount of payroll, property, and sales), and the use of tax incentives were identified as the primary factors in the decline of the tax. In the case of Utah, the authors examined the changing economy and found that the growth of industries with low corporate tax burdens (specifically smaller profit per employee -- thus reducing the effect of the payroll factor) were major contributing factors.
4. Statistical Analysis of State Corporate Tax Receipts In order to develop greater insight into the broad patterns and trends highlighted above, we assembled data on state government finances, state economic activity as measured by Gross State Product, and various state corporate tax policy variables. These data were organized into a panel consisting of observations for these variables by state for each year between 1980 and
12
2001.1 Measuring State Corporate Income Tax Performance The data are first used to “look behind” the declining share of the net corporate income tax in state revenues. There are several reasons why any given tax might become either relatively more or less important as a source of state revenue. One is due to changing performance in the tax itself. Other factors, however, would be changes in other revenue sources. In other words a declining share of the state corporate income in state revenue could be due to sluggish growth in corporate tax revenue, but it could also be consistent with a scenario in which state corporate tax revenues were growing “adequately” by some reasonable standard, but other tax revenue were growing even more rapidly. For this reason, it is useful to develop a measure of state corporate income tax performance that is not affected by the performance of other taxes. To create such a measure we first divided our data in to the following sub-period of analysis: 1980-85, 1985-1990, 19901995, and 1997-2000.2 We then calculated annual average rates of growth in state corporate tax receipts for each state in each subperiod. These average annual growth rates were then compared with annual average growth rates in each subperiod for a measure of state economic activity. The ratio of these two growth rates was then formed and used to gauge how well the state corporate income tax was doing in “keeping up” with its “potential tax base” as measured by changes in state economic activity.
1
The panel does not include data from the state of Texas. Because Texas levies a franchise tax rather than a net income tax, revenue from this tax are grouped together in the “other revenue category in Government Finances, and cannot be separately identified. 2
We do not include 1996 in the analysis because the Census Bureau recommends that researchers avoid combining data on Gross State Product from periods before 1997, with data on Gross State Product from 1997 forward.
13
Gross State Product (GSP) is used as the measure of state economic activity because it is both a reasonable indicator of changes in the potential base of the state corporate income tax, and because the Census Bureau has created time series of this measure for each state going back to 1980. The main limitation of GSP as a measure of changes in the potential state corporate income tax base is that it is a broader measure than corporate profits that would be the ideal measure. Nonetheless gross state product has been used as a measure of state economic activity by others studying state corporate tax decline as a “crude but reasonable measure of state economic activity”(Cornia, et. al., 2005, 117). Constructing the State Corporate Tax Performance Index (SCTI) We construct a State Corporate Tax Performance Index (SCTI) as follows. First, for each state that has a corporate income tax, we calculate the average annual growth rate in state corporate tax revenue for the following time periods: 1980-84, 1985-1989, 1990-94, and 19972000. Denote this rate as %ΔTi. We then calculate the comparable average annual growth rates in gross state product (GSP) for each state, which we denote as %ΔGSPi. We then construct a “state corporate tax performance index” (SCTPi) by taking the ratio of these two average annual growth rates: (3) SCPTi =
%ΔTi %GSPi
A value of SCTPIi that is greater than or equal to 1.0 means that over the relevant period (e.g. 1985-84, 1985-89, etc) state corporate tax revenue grew than GSP, while values less than one would indicate that state corporate tax revenues grew more slowly than GSP. The average of these individual ratios calculated for the states equaled .82 for 1980-85, .61 for 1985-90, 1.11 for 1990-95, and .40 for 1997-2000. 14
We then used values of SCTPIi calculated for each state as a rough gauge of state corporate income tax performance. Specifically, we designates a state’s corporate income tax performance as “high” in each subperiod if SCTPIi > .95; as “middle” if SCTPIi falls between .70 and .95; and as “low” if SCTPIi < .70 The detailed results of applying this classification system to the state corporate income tax are presented in Table 4. Figure 3 summarizes the main finding which is that on a state-bystate basis the decline in performance of the state corporate income tax is a recent phenomenon -starting in the mid 1990s. Indeed, more surprising, the number of states with high performing corporate income taxes was actually increasing between 1980 and 1995. Beginning in 1995, however, most states corporate income tax systems moved from high or middle performing to low performing status.
Figure 3: Performance of State Corporate Income Taxes 35 32 30 30
Number of States
25 21 20 18 17 15 15 12 11 10
10 10 6 5
2 0 1980-84
1985-89
1990-94 High
15
Middle
Low
1997-2000
Table 4: Performance of State Corporate Income Taxes
State
1980-85
1985-90
1990-95
1997-2000
Connecticut
High
Middle
Low
Low
Maine
Low
Middle
Low
High
Massachusetts
Middle
Middle
High
Low
New Hampshire
Middle
Middle
Middle
High
New Jersey
High
Low
Low
Low
New York
Middle
Low
High
Low
Pennsylvania
Low
Low
High
Low
Rhode Island
Low
Low
High
Low
Vermont
High
Low
High
Low
Number High Performing
3
0
5
2
Number Middle Performing
3
4
1
0
Number Low Performing
3
5
3
7
Illinois
Middle
High
High
High
Indiana
Low
High
High
Low
Iowa
Low
High
Low
Low
Kansas
Low
High
High
Low
Michigan
High
High
Low
Low
Minnesota
Low
Middle
High
Middle
Missouri
Low
High
High
Low
Nebraska
Low
High
High
Low
No. Dakota
High
High
High
Low
Ohio
Low
High
Low
Low
So. Dakota
High
High
Middle
High
Wisconsin
Middle
Low
High
Low
Number High Performing
3
10
8
2
Number Middle Performing
2
1
1
1
Number Low Performing
7
1
3
9
Northeast
Midwest
16
Table 4 (ct).: Performance of State Corporate Income Taxes South Alabama
High
Low
Middle
Low
Arkansas
High
Low
High
Low
Delaware
High
Middle
High
High
Florida
Low
High
High
Low
Georgia
High
Low
Middle
Low
Kentucky
Middle
High
Low
Low
Louisiana
Low
High
Low
Low
Maryland
Middle
Low
High
High
Mississippi
High
Low
High
Low
No. Carolina
High
Low
High
Middle
Oklahoma
Low
Low
High
Low
So. Carolina
Low
Low
High
Low
Tennessee
Low
Middle
High
High
Virginia
Middle
Low
Middle
High
W. Virginia
High
High
Low
Low
Number High Performing
7
4
9
4
Number Middle Performing
3
2
3
1
Number Low Performing
5
9
3
10
Alaska
Low
High
High
High
Arizona
High
Low
High
Low
California
Middle
Middle
High
Low
Colorado
Low
Middle
High
High
Hawaii
Low
Middle
Low
High
Idaho
Low
Middle
High
Low
Montana
High
High
Middle
High
New Mexico
Middle
High
High
Low
Oregon
Low
Low
High
Low
Utah
Low
High
High
Low
West
Number High Performing
2
4
8
4
Number Middle Performing
2
4
1
0
Number Low Performing
6
2
1
6
Number High Performing
15
18
30
12
Number Middle Performing
10
11
6
2
Number Low Performing
21
17
10
32
Totals
17
The reasons for the stark decline in state corporate tax performance in the late 1990s are not clear. Fox and Luna (2003) found that the increase in the number of pass through entities, particularly limited liability companies had a substantial and negative effect on corporate tax revenue; and limited liability companies gained popularity in the mid 1990s. Plesko (2004) hypothesized that the growth in book-tax difference in the 1990s may have also changed corporate tax planning behavior. The patterns of declining performance in individual state corporate income taxes shown in Table 4 are consistent with these analyses. Effect of Policy Variables We also use the data to explore the role of certain key tax policy parameters in affecting the performance of the tax. The policy parameters that we consider are: (a) whether a state requires consolidated reported, and (b) the formula that is used to apportion taxable corporate income to the states. Combined (Consolidated) Reporting Combined reporting is a legal requirement that all related corporations that are operated as a single business enterprise, any part of which is being conducted in the state, be treated as a single taxpayer for apportionment purposes. For example, if a parent corporation owns a manufacturing plant in Wisconsin, a mail-order subsidiary in South Dakota that sells the product, and a subsidiary that operates retail stores throughout the United States that also sell the product, the profits of all three related corporations would be added together and apportioned to Wisconsin using its normal apportionment formula if Wisconsin required combined reporting. If one or more of these corporations owned a holding company or passive investment company, those entities would be included in the combined report as well.
18
Commentators and public finance scholars have long asserted that requiring corporations to use a combined reporting system would strengthen the state corporate income tax (Brunori 2002, Pomp 1998). One way of assessing whether adoption of combined reporting improves the performance of corporate state taxes is to see whether the state corporate income tax performance of states that required combined reporting that is reported in Table 4 differs from that of states that do not. The result of this making this comparison, which are presented in Table 5 indicate that Table 5: Performance of State Taxes in States With Consolidated Reporting State
1980-85
1985-90
1990-95
1995-2000
Alaska
Low
High
High
High
Arizona
High
Low
High
Low
California
Middle
Middle
High
Low
Colorado
Low
Middle
High
High
Hawaii
Low
Middle
Low
High
Idaho
Low
Middle
High
Low
Illinois
Middle
High
High
High
Kansas
Low
High
High
Low
Maine
Low
Middle
Low
High
Minnesota
Low
Middle
High
Middle
Montana
High
High
Middle
High
Nebraska
Low
High
High
Low
New Hampshire
Middle
Middle
Middle
High
No. Dakota
High
High
High
Low
Oregon
Low
Low
High
Low
Utah
Low
High
High
Low
Number High
3
7
12
7
Number Middle
3
7
2
1
Number Low
10
2
2
8
the group of states that required combined reporting had state corporate taxes whose performance was “high” in 45 percent of the possible “trials”, and “low” in 35 percent of the possible trials. While these data may seem to indicate that consolidated reported does not have 19
much effect, when the performance of states with combined reporting is compared with that of states without this requirement, we find that the latter group of states had high performing state corporate taxes in 37 percent of the possible trials, and low performing state corporate taxes in 50 percent of the possible trials. Although this evidence is at least suggestive that consolidated reporting may improve the performance of the state corporate income tax. A more direct “test” of the effect of consolidated reporting can be undertaken by estimating the simple statistical model shown in (4) (4) Rit = θ 0 + θ1Tit GSPit + θ 2 GSPit * C it + θ 3GSPit * Dit + θ 4 GSPit * S it + η it
where Tit is the state corporate tax rate, GSPit is Gross State Produce, and Cit, Dit, and Sit, are dummy or indicator variables for state tax policy, with Cit = 0 if state i requires combined reporting and 1 otherwise, Dit =1 if the apportionment formula is double weighted-sales, and 0 otherwise, and Sit =1 if the apportionment formula is single-factor sales, and 0 otherwise. In (4) the term θ1TitGSPit, which can be rewritten as Tit θ1GSPit can be interpreted as representing the fraction of state GSP that is taxable corporate income -- θ1GSPit – multiplied by the state corporate tax rate, Tit. Since it is possible to calculate Tit * GSPit for each state, the model in essence estimates the (average) share of state GSP that is taxed by state corporate taxes (θ1). The coefficients θ2, θ3, and θ4 then show whether, and by how much, the share of GSP that is taxed is affected by consolidated reporting, and choice of apportionment formula. We use observations by state from 1980 to 2000 to estimate estimate separate regressions for the periods 1980 to 1996, and 1997 t0 2000.3 The results from estimating (4) are presented in
3
Separate regressions were estimated to account for the fact that time series data for GSP for years prior to 1997 should not be combined with time series from 1997 onward. See footnote 1.
20
Table 6. 4 5 Table 6: Dependent Variable: State Corporate Income Tax Revenue Variable
Estimate
Panel Corrected Standard Error
P Value
95% Confidence Interval
Constant
56.50
21.89
0.000
(13.179 to 99.41)
Tit*GSPit
.0739
.0035
0.000
(.067 to .0807)
Combined Reporting Dummy
-.0209
.0032
0.000
(-.0273 to -.0145)
Double Weight Sales Dummy
-.0099
.0070
0.160
(-.0236 to .0039)
Single Factor Dummy
-.0317
.00032
0.000
(-.038 to -.025)
1980-1996
No. of Observations 2
R
765 .925
1997 to 2000 Constant
63.57
22.84
0.005
(18.80 to 108.34)
Tit*GSPit
.0590
.00256
0.000
(,0539 to .0640)
Combined Reporting Dummy
-.0124
.00155
0.000
(-.0015 to -.0009)
Double Weight Sales Dummy
.000244
.00106
0.818
(-.001 to .002
-.0295
.00139
0.000
(-.0032 to -.026
Single Factor Dummy No. of Observations 2
R
180 .987
Along with the more qualitative results presented in Table 5, the estimates in Table 6 imply that requiring consolidated can have a substantial effect on the size of the state corporate tax base. The coefficient of θ2 in both regressions implies that requiring combined reporting increase the share of GSP that is subject to tax by roughly one fourth.
4
In addition to not including data from Texas because these data are tabulated in Government Finances, we also omitted data from Michigan from the analysis because, according to the Federation of Tax Administrators, Michigan does not levy a net income tax. Thus, the panel in our analysis is best though as examining the effects of combined reporting, and the use of various apportionment formulas on the revenue raised by corporate net income tax in the 45 states that levy such taxes. 5 The regressions in Table 6 are estimated using the panel corrected standard errors estimator available in STATA. Standard errors are also corrected for autocorrelation.
21
Apportionment Formulas Another important policy parameter is the formula used by the state to apportion taxable income of corporations with multi state locations. As is well known, the most common formula used for this purpose is the so-called three-factor formula shown in equation (5). As noted by Strauss (2005), initially most states adopted the formula in (5) which effectively gives equal weight to: the fraction of total corporate payroll located within a state; the fraction of total corporate property in a state; and the fraction of corporate sales in a state, in allocating a corporation's total taxable income for taxation by a given state. However, as Strauss and others have observed, over time, many states have moved away from this formula, to the point where presently only 13 states still rely on the traditional three factor formula in (5), while 29 states utilize apportionment formulae that place more weight on sales (typically double weighting sales in the formula), and 4 states apportion entirely on the basis of sales.
(5) Taxable Income j =
1 ⎛⎜ Payroll j Pr operty j Sales j ⎞⎟ • Taxable Income + + Sales ⎟⎟ 3 ⎜⎜ Payroll Pr operty ⎠ ⎝
Critics of moving away from the three-factor formula have argued that doing so has weakened the corporate tax. The estimates presented in Table 6 provide some insight into this controversy. Effects of Double-Weighting Sales. With regard to double-weighting of sales, based on the estimated coefficients in Table 6, we cannot reject the hypothesis that, compared to using the three-factor formula, double-weighting has no effect on revenue. Effects of Using a Single Factor (Sales) Formula) The estimates of coefficient of the singlefactor dummy variable in Equation (6) do, however, indicate that using the single-weighted sales
22
formula has a negative and statistically significant impact on state corporate tax collections. The magnitude of the coefficients implies that using a single-factor apportionment formula lowers the share of GSP that is subject to tax by more than one-half. These estimates, however, are based on only a few observations of states that used the single-factor formula, and hence need to be interpreted with caution. Revenue Estimates Based on the results presented above, some tentative conclusions can be drawn about measures that might be used for increasing the revenue that could be raised from the corporate income tax. First, to the extent that our results, along with those of Luna and Fox, suggest that a large portion of the recent decline in state corporate tax revenue may be attributable to increased use of limited liability corporations and other forms of pass-through entities, it should be noted that although shifting of corporate form to these entities will of necessity reduce state corporate tax collections, some of this “lost” corporate revenue will be taxed on individual income tax returns. The question is what is the “net revenue” that is foregone?Second, the results reported above provide empirical support for adopting combined filing as a means of improving the revenue performance of the state corporate tax. With regard to moving away from the threefactor apportionment formula, we do not find statistical evidence that use of the doubleweighted sales formula has a negative effect on revenue, although there is at least suggestive evidence that use of the single factor may have such effects.
5. Arguments for state taxation of corporate income
The state corporate income tax has been justified on a number of grounds. One rationale is that it compensates for deficiencies in the property tax (Brunori 2000). The property tax does
23
not take into account that businesses require varying degrees of property inputs to produce the same level of profit. Consequently, capital-intensive operations (e.g., manufacturing companies) are taxed more heavily by the property tax than are labor-intensive companies, including knowledge-based enterprises such as high-technology companies. This inequity is compounded by the difficulties in assessing property taxes for intangible property. Instead of relying entirely on taxing business inputs, states, in the interest of greater equity, have included a corporate income tax in their mix of revenue sources (Brunori 2000). A more common rationale for the corporate income tax is that it protects the much more significant (in terms of revenue) personal income tax. Without a levy on corporate income, taxpayers might have an incentive to shelter personal income in corporate holdings. For example, business owners seeking to avoid personal income tax would incorporate their operations; the corporation itself would then accumulate the dividends or salary that normally would be paid out to the individual. This rationale—that the corporate income tax helps protect the personal income tax—makes sense intuitively. However, the personal income tax revenue has grown dramatically in the last decade, a period when corporations increasingly avoided state taxation of income. It is difficult to see how the personal income tax could receive protection from a tax that has proved quite ineffectual in the past quarter-century. Indeed the corporate income tax is badly in need of reform if it is to become a viable source of income for the states. The most compelling, indeed for some commentators the only, rationale for imposing tax on corporate profits is that such levies reimburse the states for the significant services provided to the business community (Brunori 1999a, McLure 2005, Brunori 2002). Requiring corporations to pay for services provided by the community satisfies the benefits theory of taxation—that is, that tax liabilities are imposed to compensate for the benefits received.
24
Corporations use public services provided by the state as much as individuals and unincorporated businesses. They benefit from a state’s transportation infrastructure—the roads, railways, airports, and harbors used to receive materials and to move products to market. Corporations also benefit from public safety operations, including police, fire, and medical emergency services. In addition, the state judicial system protects their contractual, intellectual property, and other legal rights. Corporations also depend on the state’s school system to produce an educated workforce—an especially important role in this highly specialized age of electronic commerce. High-quality school systems also help attract qualified employees. A corporation’s success depends on the adequate provision of these services. In numerous cases, businesses have opposed state tax cuts (or, less frequently, advocated tax increases) to protect public services deemed vital to companies’ operations (Brunori 2004, Brunori 1999b). Many studies have shown that corporations make decisions on where to expand (or relocate) largely based on the availability of adequate public services (Bartik 1991; Lynch 1996). Finally, an important justification for the corporate tax is that it eases—to some extent— the regressivity of state tax systems. The corporate income tax generally has a progressive effect on the state’s overall public finance system. While a broader segment of the population owns corporate stock than ever before, most of the corporate wealth remains in the hands of the wealthy. Along with the personal income tax, the corporate income tax offsets the regressive effects of the sales and use taxes as well as the excise taxes imposed by many states.
6. Conclusion and Recommendations for strengthening the tax
How can states make the corporate income tax a more significant source of income? 25
Commentators have offered a variety of suggestions on strengthening the corporate income tax. Some have argued that curbing tax shelter abuses is paramount in the effort to strengthen the tax (Multistate Tax Commission 2003). Fisher (2002) argued that the proliferation of tax incentives to spur economic development has played a major role in the decline of the tax. Others have argued that curtailing the use of tax incentives will strengthen the tax (see Brunori 1997 and Brunori 2001 and sources cited therein.) Our research shows that requiring combined reporting would help the corporate income tax become a more significant source of revenue. Under this requirement, all related corporations would apportion their respective state tax returns as a single business. The combined reporting requirement would severely limit the ability of corporations to use tax planning techniques such as creating nowhere income and establishing passive investment companies to avoid state corporate tax liability (Mazerov 2002). It would also add substantial dollars to state revenue (Pomp 1998). Public finance experts have recently reiterated the need to require combined reporting (Fox, et. al., 2005). Although we did not find evidence that moving to double-weighted sales formula has had significant negative effects on state corporate tax revenue, we did find some evidence that adopting a single factor apportionment formula could have negative effects. This finding is consistent with that of Edmiston (2002). To the extent that these findings are confirmed in subsequent research, they suggest that states should be wary about moving to replace either the three-factor or the double-weighted sales formula with single factor apportionment. The most effective way to strengthen the tax base is for the states to adhere to the principles set forth in the Multistate Tax Compact, which emphasizes uniformity among and cooperation between the states. Moreover, the states imposing corporate income tax should work 26
with the Multistate Tax Commission to develop uniform rules that will benefit the states as well as corporate taxpayers. Uniformity in the tax base and apportionment formulas would reduce compliance and administrative costs. It would also remove the incentive to develop expensive tactics that take advantage of the myriad rules and regulations across states. Uniformity would ease the problems of double taxation and, most important, limit the opportunity of corporations to avoid their obligations of paying for the government services they receive.
27
References
Bartik, Timothy. 1991. Who Benefits from State and Local Economic Development Policies? Kalamazoo, Mich.: W.E. Upjohn Institute for Employment Research. Brunori, David. 2002. “The Politics of State Taxation: Stop Taxing Corporate Income.” State Tax Notes (July 1): 47-50. _______. 2001. State Tax Policy: A Federalist Perspective. Washington, DC: Urban Institute Press. ______. 2000. “Interview with Dan Bucks of the Multistate Tax Commission.” State Tax Notes (July 31): 303–309. ———. 1999a. “Interview: CBPP’s Iris Lav on Fairness, Progressivity, and the Net.” State Tax Notes (October 25): 1103–1108. ———. 1999b. “Business Makes Its Case for Higher Taxes.” State Tax Notes (September 13): 683–686. _______. 1997. “Principles of Tax Policy and Targeted Tax Incentives.” State and Local Government Review 29 (1, winter): 50–61. Cornia, Gary, Kelly Edmiston, David Sjoquist, and Sally Wallace. 2005. “The Disappearing State Corporate Income Tax.” National Tax Journal Vol. LVIII, No. 1: 115-138. Edmiston, Kelly. 2002. “Strategic Apportionment of State Corporate Income Tax.” National Tax Journal Vol. LV, no. 2: 239-260. Fisher, Peter. 2002. “Tax Incentives and the Disappearing State Corporate Income Tax.” State Tax Notes (March 4): 767-773. Fox, William and LeAnn Luna. 2002. “State Corporate Tax Revenue Trends: Causes and Possible Solutions.” 55 National Tax Journal: 491-508. ______. 2003. “Does the Advent of LLCs Explain Declining State Corporate Tax Revenue?” Working Paper. Knoxville, TN: University of Tennessee (January 16). Fox, William, Matthew Murray, and LeAnn Luna. 2005. “How Should a Subnational Corporate Income Tax on Multistate Business be Structured?” National Tax Journal Vol. LVIII, No. 1: 139-159. Lynch, Robert. 1996. “Do State and Local Tax Incentives Work?” Washington, D.C.: Economic Policy Institute. Mazerov, Michael. 2002. “Closing Three Common Loopholes Could Raise Additional Revenue for Many States.” State Tax Notes (April 29): 421-433. McLure, Charles. 2005. “How and How Not to Tax Business.” State Tax Notes (April 4): 29-34. Multistate Tax Commission. 2003. “Corporate Tax Sheltering and the Impact on State Corporate Income Tax Revenue Collection.” State Tax Notes (237-244). Plesko, George. 2004. “Corporate Tax Avoidance and the Properties of Corporate Earnings.” 28
National Tax Journal Vol. LVII, No. 3: 729-734. Pomp, Richard. 1998. “The Future of the State Corporate Income Tax: Reflections (and Confessions) of a State Tax Lawyer.” In The Future of State Taxation, edited by David Brunori (49–72). Washington, D.C.: Urban Institute Press. Strauss, Robert. In press. “Apportionment.” In The Encyclopedia of Taxation and Tax Policy (2nd edition), edited by Joseph Cordes, Robert Ebel, and Jane Gravel. Washington D.C. Urban Institute Press.
29