Oct 30, 2014 - various book series (a Research Series and a Text Book Series) and the .... stake-on-Migration-and-for-IOM-at-COP20.pdf) ...... Commission, stated that, âclimate change is real, the consequences are real and it's ... studies, carry out pilot projects, and scale up initiatives to decrease water wastage and.
International Organization for Migration (IOM)
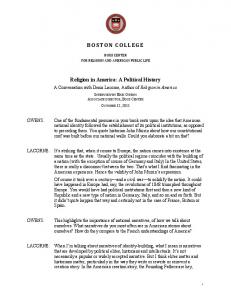
The State of Environmental Migration 2015 A Review of 2014 Edited by François Gemenne Caroline Zickgraf Dina Ionesco With the support of
Bosnia and Herzegovina Russia Floods Infrastructure projects Pakistan Drought
Mexico Tropical storm Columbia Industrial development
Chad Lake depletion
China Pollution
Bangladesh Floods
Nigeria Growing environmental vulnerability
Indonesia Floods Fiji Sea-level rise
Contents Introduction 5
Africa A Shrinking Lake and a Rising Insurgency
13
Violence and Displacement in Northern Nigeria
31
Asia-Pacific Floods and Rural-Urban Migration in Bangladesh
51
Drought in Tharparkar: From Seasonal to Forced Migration
65
Cancer Villages in China
77
Displacement and Resettlement Following the Ludian Earthquake in China
89
The Jakarta floods of Early 2014: Rising Risks in one of the World’s Fastest Sinking Cities
103
From Vunidogoloa to Kenani: An Insight into Successful Relocation
121
The Americas When Mining Moves People: Development-Induced Displacement and Resettlement in La Guajira, Colombia
145
The Correlation between Environmental Disasters and Migration Trends in Chiapas, Mexico
169
Europe The May 2014 Floods in Bosnia and Herzegovina
187
2014 Winter Olympics in Sochi: An Environmental and Human-Rights Disaster
203
Biographies 221
With the support of IMISCOE and of the European project EDGE: Environmental Diplomacy and Geopolitics
IMISCOE is Europe’s largest network of scholars in the area of migration and integration. The network involves 36 member institutes and over 500 scholars from all over Europe and focuses on comparative research, publications, the organization of events, PhD training and awards and communication. The network supports more than 30 research clusters and the IMISCOE annual conferences have become a key item in the agenda of most scholars in our field. Furthermore, the network publishes various book series (a Research Series and a Text Book Series) and the journal Comparative Migration Studies.
The EDGE project is supported by the Horizon 2020 EU Framework Programme for Research and Innovation.
Disclaimer – IOM The opinions expressed in the report are those of the authors and do not necessarily reflect the views of the International Organization for Migration (IOM). The designations employed and the presentation of material throughout the report do not imply the expression of any opinion whatsoever on the part of IOM concerning the legal status of any country, territory, city or area, or of its authorities, or concerning its frontiers or boundaries. IOM is committed to the principle that humane and orderly migration benefits migrants and society. As an intergovernmental organization, IOM acts with its partners in the international community to: assist in meeting the operational challenges of migration; advance understanding of migration issues; encourage social and economic development through migration; and uphold the human dignity and well-being of migrants. www.iom.int All rights reserved. No part of this publication may be reproduced, stored in a retrieval system, or transmitted in any form or by any means, electronic, mechanical, photocopying, recording, or otherwise without the prior written permission of the publisher.
SEM 2015 4
DINA IONESCO, FRANÇOIS GEMENNE, CAROLINE ZICKGRAF
Introduction
O
ur fifth annual publication, The State of Environmental Migration 2015: Review of the Year 2014, highlights once again the growing importance of environmental changes as migration drivers. The State of Environmental Migration is an opportunity for Masters students to explore research on the topic, analyze current trends and to propose policy recommendations. As in previous years, this issue seeks to document both the major and uncovered environmental events that have induced migration and displacement in the year 2014. The case studies presented, from both developed and developing countries across the world, shed light on the relationship between climate change, the environment and human mobility. The State of Environmental Migration series is produced by graduate students enrolled in the “Environment and Migration” course at the Paris School of International Affairs (PSIA) of Sciences Po, taught by François Gemenne and Caroline Zickgraf. Through the student-selected case studies, this issue presents empirical evidence that provides insights into the analysis of the changing dynamics of environment and climate change-related migration and displacement.
THE YEAR 2014: RESEARCH AND POLICY DEVELOPMENTS IN REVIEW Increased Evidence Linking Human Mobility and Climate Change
The Intergovernmental Panel on Climate Change (IPCC) 2014 Report1 stated once again that climate change is projected to increase the displacement of people. Yet the year 2014 showed once again that such displacements were already a present reality, and not just a future risk. Particularly vulnerable populations are those that lack the resources for planned migration and experience higher exposure to extreme weather events, especially in developing countries with low income. Rural areas are expected to experience major impacts on water availability and supply, food security, infrastructure and agricultural incomes, including shifts in the production areas of food and non-food crops around the world. Expanding opportunities for mobility can reduce vulnerability for affected populations. Changes in migration patterns can be responses to both extreme weather events and longer-term climate variability and change, and migration can also be, in some cases, an effective adaptation strategy.
1. Intergovernmental Panel on Climate Change (IPCC) Climate Change 2014 Synthesis Report
SEM 2015 5
DINA IONESCO, FRANÇOIS GEMENNE, CAROLINE ZICKGRAF INTRODUCTION
New Data on Displacement due to Natural Disasters in 2014
The Global Estimates Report2 released in July 2015 by the Internal Displacement Monitoring Centre (IDMC) offers evidence that 19.3 million people were displaced in 2014 by natural disasters worldwide. Of that 19.3 million, 17.5 million people were displaced by disasters related to weather hazards, primarily typhoons and floods. The remaining 1.7 million people were displaced by disasters related to geophysical hazards, mainly earthquakes and volcanic eruptions. Approximately 700 events were recorded during the year, 33 of which caused the displacement of over 100,000 people. In 2014, the likelihood of being displaced by a disaster was 60% higher than it was merely four decades ago. Displacement levels between 2008-2014 have been highest in the middleincome countries of Asia and the Pacific. The urban population boom in middleincome countries means that rapidly increasing numbers of people are exposed to hazards, and many of them remain vulnerable. Lower middle-income countries make up 36% of the world’s population, but account for 61% of displacement in 2014, highlighting how such countries are disproportionately affected by disaster displacement. Overall in 2014, Asia was worst affected by displacement associated with disasters, with 16.7 million people forced to flee their homes in the region. Countries with the highest levels of displacement in 2014 were the Philippines (5.79 million), China (3.61 million), and India (3.43 million.) Disasters related to floods, storms, earthquakes, and volcanic eruptions in these three countries accounted for 15 of the 20 largest displacement evens in 2014. Typhoon Rammasun (locally known as Glenda) displaced just short of 3.5 million people across the Philippines, China, and Vietnam. Typhoon Hagupit (locally known as Ruby) displaced 1.8 million in the Philippines. And, the Odisha floods displaced just over 1 million in India.
Future Estimates of Slow-onset Environmental Degradation’s Effect on Human Mobility
While there is available data presented on sudden-onset natural disasters and displacement, there is a lack of quantitative, empirical evidence showing how slow onset environmental disasters affect human mobility in the year 2014. However, there are links being studied and some projected future estimates available. For example, land degradation has been exacerbated by climate change and is becoming a relevant trigger of displacement. The UNCCD 2014 Desertification Report3 estimates that by 2020 about 60 million people could move from the desertified areas of sub-Saharan African towards North Africa and Europe. Also, UN Water estimates that by 2025, 1.8 billion people will be living in countries or regions with absolute water scarcity, while two-thirds of the global population could be experiencing water stress, which could in turn lead to voluntary or forced migration.
Policy developments
The relationship between human mobility, climate change and the environment has seen increasing relevance in the international policy sphere in 2014. “Climate induced migration, displacement and unplanned relocation” have been previously recognized in the Decision on Adaptation4 adopted in Cancun in 2010 and the Decision on Loss and Damage5 adopted in Doha in 2012. In 2014, policies have continued to build on these agreements and increased attention has been paid to the issue, as witnessed across policy sectors and political levels.
2. IDMC 2015 Global Estimates 3. UNCCD 2014: Desertification, the Invisible Frontline 4. Cancun Adaptation Framework (CAF) 2010, decision 1.CP/16 paragraph 14 (f) 5. Doha Climate Gateway 2012, decision 3.CP/18 paragraph 7 (a) (vi)
SEM 2015 6
Advances in International Climate Policy
The UN Secretary General Climate Summit in New York took place in September 2014. There was a specific event on Climate Change, Displacement and Migration: Ensuring Effective Adaptation Policies and Solutions, which highlighted the increasing relevance of the topic. In December 2014, the 20th Session of the Conference of the Parties to the United Nations Framework Convention on Climate Change (UNFCCC), COP20, was held in Lima, Peru. Notably in regards to human mobility and climate change within the Loss and Damage Agenda, the Least Developed Countries (LDC) put forth a text on the establishment of an “international climate change displacement coordination support mechanism,” for “assistance in providing organized migration and planned relocation” for those displaced by the impacts of climate change. The text of the Paris Agreement, negotiated at COP21 in December 2015, builds upon this proposal.
Developments in Disaster Risk Reduction (DRR) Policy
Migration, displacement and relocations received increased attention throughout the draft negotiation process leading up to the Sendai World Conference on Disaster Risk Reduction in March 2015. A number of paragraphs in the approved text of the Sendai Framework for Disaster Risk Reduction 2015-2030 include references to human mobility. Migrants, both voluntary and forced, are highlighted as DRR stakeholders and human mobility is regarded as one of the main consequences of disasters. Further articulated throughout the text is the need to manage disaster-induced population movements to reduce the impact of hazards and prevent long-lasting vulnerabilities, and to foster migrants’ potential to build the resilience of home and host communities by involving them in disaster risk reduction and disaster risk management efforts.
Increased Attention Paid to Migration, Environment and Climate Change Policy at the Regional Level
In the European Union (EU), the relationship between climate change, the environment and human mobility received increasing attention in the year 2014. In July, the European Commission held a roundtable discussion in Brussels entitled, “Integrating the Migration into Development Strategies and the Post-2015 Agenda.” The event addressed the links between climate change, environmental degradation and migration, and aimed to better target climate change adaptation and disaster risk reduction strategies to reduce displacement, and to promote the potential of migration as an adaptation strategy. In October 2014, the workshop, “Integrating Migration into Development: Diaspora as a Development Enabler” was held in Rome. The event was organized in the framework of the Italian Presidency of the Council of the European Union, by the Italian Ministry of Foreign Affairs and the International Organization for Migration. There was a session on migrants’ initiatives for climate change adaptation and mitigation, and a session on facilitating migrants and diasporas contributions for land-based adaptation and resilience. Also, in November 2014 the European Parliament passed a Resolution6 concerning COP20 and COP21 mentioning that climate change is projected to increase displacement of people. Due to the increased attention and importance given to the nexus of human mobility, climate change and the environment, the European Commission has funded a project entitled Migration, Environment and Climate Change: Evidence for Policy (MECLEP.) Beginning in January 2014, the three-year project aims to contribute to the global knowledge base on the relationship between migration and the environment,
6. IOM Paper on COP20, December 2014 (http://www.iom.int/sites/default/files/press_release/file/What-is-atstake-on-Migration-and-for-IOM-at-COP20.pdf)
SEM 2015 7
DINA IONESCO, FRANÇOIS GEMENNE, CAROLINE ZICKGRAF INTRODUCTION
including climate change. The innovative research will seek to formulate policy options on how migration can benefit adaptation strategies to environmental and climate change. The project is implemented by the International Organization for Migration (IOM) with a group of six research partners.
Advances in State-led Policy Initiatives on Climate Change and Human Mobility
Since 2012, the Nansen Initiative has been the primary leader in working towards a protection agenda for people displaced across borders in the context of disasters from the effects of climate change. To date in 2014, the Nansen Initiative has held regional consultations in Central America, the Greater Horn of Africa, the Pacific, and Southeast Asia. Nansen stresses the importance of integrating voluntary migration, forced displacement, and planned relocation within national laws and policies, such as National Adaptation Plans, Joint National Action Plans, and National Disaster Management Plans. Beginning in 2009, the Climate Vulnerable Forum (CVF) fosters international partnerships of countries that are highly vulnerable to global warming. The Forum serves as a South-South cooperation platform for participating governments to act together to deal with global climate change. In 2013, the CVF launched an Action Plan for the 2013-2015 period that mandates new research focused on six multi-lateral sectors, one of them being migration. This highlights the importance of human mobility in the context of climate change for the most vulnerable countries. In November 2014, IOM joined a group of international agencies participating in the CVF Trust Fund by signing the Memorandum of Understanding. This partnership aims to increase the capacity of affected communities to deal with migration and displacement linked to the impact of climate change and environmental pressures. Migration, environment, and climate change was also a focus at the Third UN Conference on Small Island Developing States (SIDS.) One event in particular was focused on “Migration Partnerships and Sustainable Development in SIDS,” with participation from IOM, the Asian Development Bank, and various SIDS state representatives. The final document from the conference, entitled the “Somoa Pathway,” recognizes the positive role that migrants and diaspora play in development, the value of remittances and the importance of planning for and responding to displacement.
An Increased Focus on Environmental Migration across Various Policy Sectors
Climate change has been a topic of growing importance in the health sector for several years. In August 2014, the Word Health Organization (WHO) held a conference specifically on Health and Climate, and the IOM provided a statement addressing health in the context of environmental migration. The climate change and security nexus has also been of increasing relevance in 2014. In July, the Organization for Security and Co-operation in Europe (OSCE) held a conference entitled “Enhancing Security through Water Diplomacy: the Role of the OSCE.” This event highlighted that the issue of water is closely linked to the concept of human security and analyzes of “water-related” migration should take into account connected factors such as climate change, land degradation, socio-economic development and conflicts. In 2014 there were several briefings put on by various organizations that focused on the MECC nexus. In March, a Consultation on “Planned Relocations, Natural Disasters and Climate Change: Consolidating Good Practices and Preparing for the Future” was held in Sanremo, Italy, which was co-organized by UNHCR, the Brookings Institution, and Georgetown University. In July, the Heinrich-Böll-Stiftung’s study “TIME TO ACT – How the EU can lead on climate change and migration” was presented over a lunch debate and workshop in Brussels.
SEM 2015 8
Specifically at IOM, major attention was paid to the climate change, environment and human mobility nexus in 2014, which culminated in the implementation of the new division of Migration, Environment, and Climate Change (MECC) in January 2015. In recognition of the increasing significance of the issue, as highlighted through the interest shown by IOM member states, the IOM 105th Council Session in November 2014 included a special focus on climate and the environment. Within the framework of the Council, a number of high-level events were dedicated to examining the linkages between migration, environment and climate change with a double objective to i) bring climate and environment to the forefront of IOM’s institutional agenda, and ii) contribute to relevant global policy processes. IOM also completed two Capacity Building Trainings on MECC in 2014, in Moshi, Tanzania, and Santiago, Chile. Overall, 2014 saw environmental migration being addressed through various policy angles, paving the way for significant developments in 2015, related to both the conclusion of the Nansen Initiative and the COP21. Once again, this edition sheds light on some of the most insightful cases of migration and displacement related to various environmental changes, from natural disasters to development projects, highlighting the diversity of the phenomenon across the world.
SEM 2015 9
Africa
JASON RIZZO
A Shrinking Lake and a Rising Insurgency Migratory Responses to Environmental Degradation and Violence in the Lake Chad Basin
T
he slow-onset environmental change occurring in the Lake Chad Basin (LCB) region of the Sahel is not a recent phenomenon, nor is it one that observers have only now begun to take note of. A bulletin published in June 1936 in The New York Times by the Associated Press reported on the efforts of French General J.M. Tilho to save Lake Chad, which had gradually decreased in size since Europeans had first discovered it 112 years previously (Associated Press, 1936). Despite Tilho’s efforts to change the course of a nearby tributary, this shared vital resource has continued to dwindle over the years and today the issue has now become more pertinent than ever. The increased struggle for the lake’s natural resources has had economic, social, and health-related ramifications on a growing local population. The emergence of conflict since 2009 due to violent extremist groups such as Boko Haram can, at least in part, be seen as a result of this slow-onset environmental degradation. It is the convergence of several underlying drivers—the deterioration of Lake Chad, demographic pressure, poor governance, a high degree of social diversity, and the rise of violent extremism—that have accelerated and exacerbated already complex migration patterns in 2014. This paper seeks to examine the contraction of Lake Chad and the effects this has produced on the local population with regard to both conflict and migration. Section one explains the gradual evolution of the lake over the past 40 years and the underlying causes for this change. Section two will analyse the direct impacts of the lake’s deterioration and the repercussions on poverty, resource conflicts, and ultimately violence and migration. Section three deals with past policy responses that have sought to address environmental degradation, the refugee crisis, and the security threat. The final section will take into account lessons from the past and current challenges to provide policy recommendations that seek to address both the symptoms and underlying causes of the crisis. This paper draws on information from a variety of sources, including numerous reports, studies, conference proceedings, news articles, and online media, as well as on phone and e-mail interviews with field-based personnel at IOM and other humanitarian organisations. Efforts have been made to crosscheck these different data and, when necessary, point out any inconsistencies or flaws.
1. SLOW-ONSET ENVIRONMENTAL DEGRADATION IN THE LAKE CHAD BASIN The Lake Chad Basin is a geographic expanse covering 2,434,000 km2 in the Sahel and spread across eight different countries. At the centre of the basin lies Lake Chad
SEM 2015 13
AFRICA
JASON RIZZO A SHRINKING LAKE AND A RISING INSURGENCY
itself, a shallow, freshwater lake shared between Cameroon, Chad, Niger, and Nigeria. It provides a vital source of water for both human and animal life in the region, and forms the basis of several economic activities that depend heavily on its resources, particularly fishing, agriculture, hunting and pastoralism (Onuoha, 2010). Because it rarely reaches a depth of over seven meters, the overall surface area of Lake Chad is extremely sensitive to short and long-term climate variations as well anthropologic interventions. It is believed that in the 4th millennium BC, Lake Chad covered an estimated expanse of 400,000 km2 (Onuoha, 2010). In the 1950s and early 60s however, its surface area covered approximately 26,000 km2 and has since declined by over 90%, reaching it’s lowest point of 532 km2 in 2004 (Onuoha, 2010). The northern portion of the lake is particularly sensitive and has completely dried up several times since 1975 (Lemoalle, Bader, Leblanc & Sedick, 2012). Today, Lake Chad has partially recovered from 2004 levels, now measuring around 2,500 km2 (BGR, 2014; Essono, 2014). In addition to declining surface area, lake level depth has become more volatile in recent decades. Seasonal lake level variations averaged as low as half a metre and as high as one metre in the 1970s and 80s, whereas today variations can be as high as two metres (Geerken, Vassolo & Bila, 2010). The Inter-Governmental Panel on Climate Change (IPCC) states that the two principle determinants of reductions in lake size are decreasing levels of precipitation and/or human interference (Onuoha, 2010). In the case of Lake Chad, both factors have played a major role in recent decades. Coe and Foley (2001) show that surface area decline in from 1950s to the mid-1970s was due primarily to reduced rainfall, whereas in the subsequent period, human activity nearly doubled the extent to which the lake would have otherwise declined. A long-term drought period from 1973-1984 not only directly reduced inflows from the lake’s primary sources, but also forced agricultural communities who had depended on rainwater for crop feeding to increasingly turn to irrigation, further depleting lake inflows (Lemoalle et al., 2012). In the following years, irrigation activity increased four-fold when compared to the previous two decades (Coe & Foley, 2001). Human activity and climate conditions have thus become equal contributors to the lake’s decline. Since the 1990s, anthropologic intervention has continued to escalate. The region has seen a gradual rebound in rainfall levels and thus increased inflows into Lake Chad, yet the lake has continued to decrease in size due to misuse and overuse of irrigation practices and groundwater extraction (Okonkwo, Demoz & Gebremariam, 2014). Geerken et al. (2010) further show that groundwater extraction, in particular, has negatively altered the lake’s hydrologic characteristics and has contributed to poor biomass recovery rates which should have otherwise benefited from the higher precipitation of recent years. The anthropologic factors driving the changes in Lake Chad cannot be fully understood without examining the population dynamics in the region. In 1960, the population was estimated to number around 13 million. By 2013, it had grown to 47 million (BGR, 2015), and is expected to increase to 80 million by 2030 (Okonkwo & Demoz, 2014). In conjunction with this increase, a significant rise in livestock numbers has occurred in order to feed the population, which has put a further strain on lake use (Onuoha, 2010). The northeast region of Nigeria is the most densely populated area in the LCB. It is also highly diverse, and accounts for nearly half of Nigeria’s 300 different ethnic groups (Onuoha, 2010). Here, population density corresponds to excessive degrees of groundwater extraction (Geerken et al., 2010). The city with by far the largest population in the region, Kano, has been identified as an “anthropologic hotspot”, where the detrimental effects of human interaction on Lake Chad are the highest in the LCB (Okonkwo & Demoz, 2014).
SEM 2015 14
A NOTE ON EXISTING FACTS, FIGURES, AND RESEARCH The above figures relating to the surface area reductions in Lake Chad are those most prominently reported in the media. While they are effective in adequately showing the dramatic size decline over the years, it is worth noting that researchers and environmental experts who study this region consider the size of the lake in the 1950s and 60s to have been abnormally large—an observation often absent from reports in the media. Four generally accepted classifications exist to express the size of Lake Chad, ranging from Large, Normal, Small, and Dry Small (Lemoalle et al., 2012). The 26,000 km2 figure noted above easily falls into the “Large” classification, whereas 18,000 km2 is considered the size at which the lake is at a Normal state and which was last observed in 1973-1975 (Lemoalle et al., 2012). Further overlooked in news articles is the fact that Lake Chad’s shallow characteristics mean dramatic fluctuations in size are not uncommon. Odada, Oyebande and Oguntola (2005) note, for example, that Lake Chad completely dried out four times between the years 1400 and 1901. The tendency for some media outlets and environmentalists to downplay certain elements of the story is noted to give as accurate a portrayal of this slow-onset event as possible. A thorough perspective of this nature is helpful in determining the extent to which polices and corrective measures must be employed to stabilise the lake’s condition and restore it to a Normal state. The origins of the information behind widely circulated reports are also important to consider. One of the most often cited studies, in UN documentation and elsewhere, is Coe and Foley’s Human and natural impacts on the water resources of the Lake Chad basin, published in the Journal of Geophysical Research in February 2001. Some researchers, however, believe this study to be flawed in certain aspects, even if its main findings are widely accepted and reported upon. Lemoalle et al. (2012) note that Coe and Foley’s satellite data analysis is insufficiently documented, but suggest that their work has endured due to lack of ground-based observational research. Additionally, their argument linking overgrazing to the shrinking of Lake Chad is, according to a recent FAO/LCBC conference, “difficult to substantiate” (De Young, Sheridan, Davies & Hjort, 2011). This suggests the importance of careful interpretations of existing data and the need for more high-quality research in the years ahead.
High vulnerability in the Lake Chad Basin
Vulnerability to the impacts of environmental change in the Lake Chad Basin is extremely high. All of the region’s major economic sectors are engaged in climatesensitive activities, and several of them, including fishing, agriculture, and livestock production, rely directly on the resources of Lake Chad itself (Okonkwo & Demoz, 2014). Moreover, the local population is dependent on the lake as a source of drinking water, sanitation, and as a means of carrying out religious or cultural activities (Onuoha, 2010). Yet, the capacity to respond to threats posed by the shrinking of Lake Chad are extremely limited due to conditions of poverty, low levels of economic and political stability, weak institutions, and inadequate information (FAO, 2014). Low amounts of human, social, and technical capital in the region compound and exacerbate downward pressure on environmental capital. Poor education, health, and income are reflected in Human Development Index ratings in the four Lake Chad countries that are among the lowest in the world. Out of the 187 countries ranked in the 2014 UNDP Human Development Report, both Cameroon and Nigeria ranked 152, Chad 184, and Niger, at 187, was ranked the poorest nation in the world (Malik, 2014). The problem is particularly severe in northeast Nigeria, where in 2007 an estimated 72% of the population lived in poverty (Onuoha, 2010)
. This has left inhabitants with limited capacity to respond to the impacts of environmental change. Social capital in the form of institutions is severely lacking as well. World Bank governance indicators for 2013, which include measurements of accountability,
SEM 2015 15
AFRICA
JASON RIZZO A SHRINKING LAKE AND A RISING INSURGENCY
government effectiveness, regulatory quality, rule of law, and corruption control, show that the four Lake Chad countries rank lower than the Sub-Saharan African average in nearly every category (Kaufmann, Kraay & Mastruzzi, 2014). Particularly relevant to the region is the Political Stability and Absence of Violence/Terrorism indicator, where Nigeria and Niger rank very low, 9th and 22nd worst in the world, respectively. In terms of regional institutions created specifically to oversee Lake Chad and other water resources in the LCB, the Lake Chad Basin Commission (LCBC) was established in 1964 by the governments of Cameroon, Chad, Niger and Nigeria following the signing of the Fort-Lamy Convention. The Central African Republic and Libya have subsequently joined the LCBC. Despite a mandate to sustainably manage Lake Chad and other trans-border water and ecological resources while promoting peace and security within the region, the commission continues to lack funding, data, and a strategic approach to carry out its objectives (Odada, Oyebande & Oguntola, 2005). Finally, even if effective institutions in the region are established, huge coordination challenges result in a failure to align the activities and objectives of local, state, national, and regional stakeholders (FAO/LCBC, 2009; Odada et al., 2005). As a consequence of these weak institutions and impediments to effective collaboration, populations in the LCB are at a greater risk of being negatively impacted by the effects of environmental degradation.
2. IMPACTS OF ENVIRONMENTAL DEGRADATION: A CONVERGENCE OF FACTORS The environmental degradation of the LCB region, particularly the shrinking of Lake Chad, has impeded development and contributed to conditions of poverty (Okonkwo & Demoz, 2014) for several reasons. All of the region’s major economic activities have been adversely affected, leading to complex migration patterns in the past (Odada et al., 2005), which have carried through to 2014 where they have taken on a new, conflict-related dimension. Food and water scarcity that have resulted from a decline in lake size have become major and chronic issues—among the worst in Africa. Not only must a growing population make do with lower water quantities, but the quality of water has deteriorated as a result of people defecating or washing clothes in the lake (Onuoha, 2010). Irrigation schemes developed in the 1970s in Nigeria that would have produced only a marginal negative impact on Lake Chad inflows can no longer operate as their intakes were designed for Normal lake conditions and not the Small or Dry Small states that have persisted in recent decades (Lemoalle et al., 2012). As a result, agricultural activity has become less feasible in the areas where these irrigation projects were to be utilised. Reduced surface area and lake level mean that transportation and navigation along the lake has, to an extent, been affected as well with the emergence of a scattering of small islands and a wide-spanning ridge that was previously underwater. Known as the Great Barrier, the ridge now divides Lake Chad into a northern pool and southern pool. Prolonged separation of the two pools may have further implications for the ecological development and migration patterns of fish (Lemoalle et al., 2012). Between five and eight species of fish have died out in the region, and in one part of the LCB, fishing yields were reduced by up to 90% (Odada et al., 2005). In a part of the Sahel were 80% of the poor depend on fish as a regular and cheap source of protein, this development has profound implications for food security (De Young et al., 2011) as well as economic activity. Despite a decrease in fish stocks over the years, 150,000 fishermen still depended on the lake for their livelihoods as of 2010 (Onuoha, 2010).
SEM 2015 16
Migration: Economic, Social, Demographic, Political, and Conflict-Related Drivers
Some of the local population have shifted their economic activities over the years as a way to adapt to the progressively smaller lake. Fishermen in particular, have migrated in search of better fishing grounds, either temporarily, such as on a seasonal basis, or permanently, as near-shore stocks are depleted (De Young et al., 2011). Some have been attracted to the small islands that have emerged in recent years, which now host to several fishing communities (Coly, 2015). In many cases, this leads to lengthening the distance fishermen must travel between their homes, fishing grounds, and the marketplaces where they sell their catch. Alternatively, these people may decide to exit the industry entirely to become farmers. Those who do often move to the fertile lands where the lake has receded in order to plant their crops (NASA/Goddard Space Flight Center--EOS Project Science Office, 2001). Likewise, environmental changes in other areas of the LCB have drawn many farming households to the vicinity around Lake Chad in order to sustain their livelihoods. For example, decreased rainfall since the 1970s has resulted in once arable land in the northern areas of the LCB becoming unsuitable for millet cultivation. As a result, farmers have turned to the more fertile soil around Lake Chad, moving there in order to grow a different variety of crops (Lemoalle et al., 2012). Similar to fishermen, a large portion of farmers and pastoralists alike migrate on a seasonal basis in search of land better suited for agriculture or grazing (De Young et al., 2011). Fluctuations in the size of Lake Chad have undoubtedly impacted where they settle and how long they must travel in any particular season. Additionally, fishermen, farmers, pastoralists or others struggling to maintain their livelihoods based on the lake’s resources may decide to leave it altogether and migrate to a city in search of better opportunities. Often, it is the younger population who moves away and settles in urban slums where, according to an ICG report, they are more prone to lawlessness and violence (International Crisis Group, 2010). Figure 1. Fatalities in Nigeria from Social Violence, by Category, 1998-2014 10 000 8 000 6 000 4 000 2 000 0 1998
2000
2002
2004
State (Non Boko Haram)
H-F
Comunal (Non Boko Haram)
Political
2006
2008
2010
2012
2014
Boko Haram
Herder-Farmer violence. We have distinguished a separate category of violence between herders (pastoralists) and farmers, witch is analytically distinct from other types of communal violence and separate from tre Boko Haram insurgency. Other category include : State-related violence apart fromthe Boko Haram insurgency; Communal Conflict (between ethnic /religious/local groups) apart from the insurgency; Political violence (i.c. attributed to partisan actors); Boko Haram, violence bymilitants or state actors linked to the insurgency
Source: Nigeria Social Violence Project, 2014 http://www.connectsaisafrica.org/research/african-studiespublications/social-violence-nigeria/
As a result of the adverse effects of environmental degradation on the region’s major economic activities, domestic and cross-border international migration has escalated in recent years (Onuoha, 2010). With this occurring in the context of a
SEM 2015 17
AFRICA
JASON RIZZO A SHRINKING LAKE AND A RISING INSURGENCY
highly vulnerable, diverse population facing major threats of food and water insecurity, it should come as little surprise that conflict in the region has swelled in recent years, beginning in 2009 and reaching unprecedented proportions in 2014. According to a project at Johns Hopkins University which tracks social violence in Nigeria, fatalities jumped by over 50% in 2014 and were highly concentrated in the northeast – the region depending most heavily on Lake Chad and its resources (Nigeria Social Violence Project, 2014). The overwhelming majority of these deaths came at the hands of Boko Haram, the insurgency seeking to overthrow the Nigerian government and establish an Islamic state. By some accounts, Boko Haram was responsible for just under 8,000 deaths in 2014 (Nigeria Social Violence Project, 2014), while other sources place the number closer to half that amount (Barna, 2014). At first glance, it may seem far-fetched to link environmental degradation in the LCB to the violence that has erupted since 2009. However, if the underlying determinants of this violence are closely examined on the one hand, and the implications of the deterioration of Lake Chad on the other, several ways in which the two are interconnected become clearly apparent. Onuoha (2010), argues that conflict as a result of environmental degradation can occur for two reasons: “First, by intensifying the frequency of contact between and among the major livelihood systems, thereby making them more competitive rather than complementary. Second, it intensifies the pattern of migration as a response to the contraction of the lake” (p. 32). Figure 2. Convergence of Environmental Degradation, Violence Inflicted by Boko Haram, and Migration in the Lake Chad Basin Environnemental Degradation and its Implications Reduced economic output Food Scarcity Water Scarcity Reduced biodivercity and vegetation Great Barrier : Reduduced transportation and trade
Climate Change
Human Intervention
Violence and Terrorism (Boko Haram)
Migration
Demographic Pressure
Social factors: Cultural/Religious/Ethnic Diversity
Poor Governance, Public Goods Mismanagement, Corruption
Ressource Conflicts
Poverty and Inegality
Source: Jason Rizzo
In the diagram above, competition among livelihood systems is represented by the two green arrows leading from the “Environmental Degradation and its Implications” section, on the left, to the “resource conflicts” and “poverty and inequality” boxes on the lower right. These factors, in turn, make up two of the four conditions under which Boko Haram and the violence it has inflicted have emerged. In northeast Nigeria, where resources are scarce and not equally distributed by the State, competition for control of these resources is fierce (Agbiboa & Maiangwa, 2013; International Crisis Group, 2010), all the more so with nearly three-quarters of the population living in poverty and barely able to survive on what little they are currently able to secure. Noting the struggle for public resources in all areas of Nigeria, an excerpt from a report by the International Crisis Group (2010) states: Tensions have been exacerbated by policies favouring indigenous groups. In all parts of Nigeria, those who can claim to be original inhabitants have a disproportionate share of public resources, an exclusive right to buy and sell land and various other privileges. This generates a huge number of disputes and often
SEM 2015 18
violent conflicts over competing claims, as well as over the validity of the “indigeneity certificates” issued by local government authorities, especially in the context of internal migrations (p. 11). Poverty in and of itself is a condition Boko Haram has found complementary to its empowerment; many of its recruits are poor, young and have little in the way of employment opportunities that would serve as effective alternatives to joining the insurgent group (Agbiboa, 2014; Barna, 2014). Moreover, the group has used funding to provide “alms to the poor and needy” (in line with the practice of zakat, one of the Five Pillars of Islam), and to extend basic services that the government has failed to adequately offer (Onuoha, 2012, p. 3). Conditions of poverty, therefore, have not only helped Boko Haram increase its membership base, but have also assisted the group in positioning itself as an organisation that is sensitive to the needs of the local population, especially in comparison to the government. To visually represent Onuoha’s second point, namely that environmental degradation “intensifies the pattern of migration as a response to the contraction of the lake”, the red lines along the top of the diagram show the corresponding connections. In this respect, environmental change is seen as both a direct driver of migration as well as an indirect driver of violence by way of this migration. Thus, in the LCB, migration is not only a consequence of violence, it is also a driving factor of violence. In 2014, however, causality seems predominantly to have moved in the direction of violence impacting migration, reflected in the fact that communal violence unrelated to Boko Haram was relatively minor (Nigeria Social Violence Project, 2014). Also apparent from the diagram is the fact that three other factors that have already been observed through their relation to environmental degradation and the vulnerability of the local populations have also played a role, either directly or indirectly, in creating the necessary conditions for Boko Haram’s emergence. Firstly, demographic pressures play an obvious role in exacerbating resource conflicts— more people translates to less finite resources to share among them—and thus indirectly contributes to increasing levels of violence. Secondly, the social make-up of the local population, in this case high levels of ethnic diversity and a growing divide between Muslim and Christian groups, is also a factor that potentially serves to accelerate violence directly while also providing the necessary backdrop to facilitate the role of the other drivers. Collier (2009) notes that in poverty-stricken, resource-limited settings, people are incentivised to remain loyal to their ethnic group as a form of insurance. This has violent ramifications for regions like northeast Nigeria and the LCB as a whole, where political power is not always aligned with perceptions of ethnic or religious identity. As noted above, resources are not distributed in an equitable manner, thus the struggle to control them has become more prominent. In this light, it is apparent that social factors alone are likely exerting only limited influence on conflict in the region. Rather, it is through their interaction with poor governance and conflict over resources that ethnic and religious diversity provides, as noted by Agbiboa and Maiangwa (2013), “the fault line along which inter-group competition for power and resources occurs”. It is worth briefly noting that this social dimension is also most certainly contributing to coordination failures that have aggravated problems of increasing anthropologic impact on Lake Chad. Collier (2009) argues that the provision of public goods, such as the management of water wells in rural villages is often better conducted in homogenous settings, or where efforts have been made by local governments to downplay social divisions and instead emphasise shared commonalities and a national identity. In the absence of such unifying policy measures in northeast Nigeria, this effect is likely contributing to the swelling anthropologic interference on the lake. For simplicity’s sake, this connection linking social factors to human intervention and thus environmental degradation has been left out of the diagram above.
SEM 2015 19
AFRICA
JASON RIZZO A SHRINKING LAKE AND A RISING INSURGENCY
A third driver of violence is the central role of poor governance, weak political institutions, and corruption. As has been discussed above, poor governance can be linked to environmental degradation, and the resulting impacts set the stage for increased levels of conflict. The Nigerian government, however, can also be more directly linked to violence due to its failure to address issues of poverty and resource scarcity, and its unwillingness to reign in a provocative, violent, and hugely unpopular military and police force. Both these points can be seen when examining Boko Haram’s emergence and in its eventual turn toward violence in 2009. The group was initially founded as a peaceful movement in response to growing levels of corruption and poor public services (Barna, 2014). Its objective was to establish such services itself, including “mortality police” and a welfare system. In 2009, following increased tension with the Borno state government, Nigerian security forces extrajudicially killed the group’s highly popular founder and leader, Mohammed Yusuf, along with a large number of his followers (Barna, 2014; International Crisis Group, 2014). The military crackdown no doubt triggered support for the group and provoked its shift toward violence. Photo 1. Refugees arriving to small islands in Lake Chad following violence in Nigeria.
© Copyright IRC
The impact of violence on migration due to the underlying drivers of environmental degradation, a growing population, poor governance, and social factors, reached a critical point in 2014, which was by some distance Boko Haram’s most violent year to date. Huge flows of forced migration were triggered in the northeast and contributed to Nigeria having one of the highest amounts of internally displaced people in the world (Barna, 2014). Cross-border international migration has also accelerated due to the violence. Initial reports in May 2014 estimated that 61,000 refugees had left the country for Cameroon, Chad, or Niger (UNHCR, 2014a). Of this figure, only 22,000 are thought to be Nigerian, with the remainder being mainly Niger nationals. In July, more than 15,000 people fled when Boko Haram entered and took control of the city of Damboa—the first time the group had succeeded in such an undertaking (Barna, 2014). By the end of 2014, IOM estimated that approximately 120,000 refugees had fled Nigeria for neighbouring countries (International Organization for Migration, n.d.). The degree of internal displacement within Nigeria as a result of the violence was found to be even greater. In July, IOM implemented its Displacement Tracking
SEM 2015 20
Matrix (DTM) tool in order to more effectively gather and monitor information on internally displaced populations within the country (International Organization for Migration, n.d.). When figures were tallied at the end of December 2014, they were starkly different from initial estimates. Data gathered by the DTM in five of the northeast states affected by the violence placed the number of IDPs at 389,281. Borno, the state bordering Lake Chad where Boko Haram activity is concentrated, was not included in this first DTM report due to security constraints. Here, however, the Nigerian National Emergency Management Agency estimated 522,523 IDPs. Taking the two previous figures in combination with IOM’s estimate of 120,000 cross-border refugees, the total number of displaced people was thought to be over 1 million (International Organization for Migration, n.d.) in 2014. IOM has since released five subsequent DTM reports using a unified system of data collection with the Nigerian government that now includes limited coverage of Borno state (Daviot, 2015). The latest figures are staggering. The DTM Round VI Report issued in October 2015 indicates that the number of IDPs in Nigeria alone has swelled to over 2.2 million (IOM & NEMA, 2015). 72% come from Borno state, and there are most probably many tens of thousands that are still unaccounted for given the limited access IOM and government officials have to this region. Overall, children make up 57% (approximately 1.25 million) of the IDP population (IOM & NEMA, 2015). To put this figure in perspective, the number of displaced children in Nigeria is more than 50% higher than the entire refugee or migrant population accounted for in the on-going European crisis (UNHCR, 2015).
3. POLICY RESPONSES Policy responses designed to address the combined effects of environmental degradation, the refugee crisis, and the security threat have been slow to emerge, though awareness of the problem grew significantly in 2014 amid the escalating violence. Given the interconnected and multifaceted nature of the problem, no silver bullet will exist to tackle all of these challenges in a simple manner. Stemming the violence and providing humanitarian relief to the large number of refugees is of immediate concern, though long-term actions to address the underlying drivers of these problems must be streamlined and prioritised as well. This study will now examine the conditions facing refugees and IDPs, and the policy actions that have been enacted to respond to the crisis in terms of migration, violence, and environmental degradation. Many refugees find themselves separated from their families and in highly precarious situations, in which the need to provide them humanitarian assistance is especially great. Emilie Poisson (2015), Africa Regional Director of External Relations & Advocacy at ACTED, a French NGO operating in the region and working in partnership with the UN, indicated that many refugees arriving in Chad are in poor physical condition following days with little or no access to food. Furthermore, their psychosocial state is often fragile after having experienced acute violence, death of family members, and loss of homes and livelihoods, yet access to even basic assistance and services in these areas is lacking (Poisson, 2015). A large portion of the refugee population in the region consists of unaccompanied minors or separated children. Women and girls are especially vulnerable to sexual and other forms of gender-based violence as arriving refugees. In Cameroon, Chad, and Niger, there have been several documented incidents of refugees having to move more than once as a result of unsafe or unsuitable initial destinations. In an effort to avoid harbouring members of Boko Haram and other terrorist organisations, Niger had originally forbidden the establishment of refugee camps along the country’s southern boarder (Barna, 2014). This forced many newly arriving refugees to seek temporary shelter in abandoned homes that were
SEM 2015 21
AFRICA
JASON RIZZO A SHRINKING LAKE AND A RISING INSURGENCY
susceptible to flooding during the rainy season (UNHCR, 2014a). It was not until early 2015, following attacks in Niger’s Diffa region, that the government allowed camps to be set up for refugees, returnees, and IDPs (Poisson, 2015). In the far north of Cameroon, initial settlement communities have also been subjected to Boko Haram attacks, forcing refugees to flee an additional 150km to less-volatile areas (UNHCR, 2014a). In yet another example, several large refugee movements headed to the small fishing islands in Lake Chad, putting enormous pressure on host populations in terms of hygiene, space, and community life (Coly, 2015). According to Ibrahima Coly, Regional Coordinator for West and Central Africa at IEDA Relief, a UNHCR and IOM partner organisation, the government of Chad made concerted efforts in 2014 to relocate refugees from the islands to areas inland that are safer and where access to humanitarian assistance can be provided more easily (Coly, 2015). Nevertheless, the islands still serve as a layover point and several refugees are tempted to stay to practice fishing (Coly, 2015). As a result, Poisson (2015) notes “competition for land and natural resources between communities could potentially intensify.” The above events suggest that in all destination countries, humanitarian protection and information related to safe areas of refuge were lacking in 2014. The provision of assistance and services to IDPs in Nigeria was also scarce in 2014. The Internal Displacement Monitoring Centre (IDMC) noted that state emergency management agencies have limited capacities and no clear regulatory framework dictating their role in providing support to IDPs after their initial displacement (Rushing & Reed, 2014). As a result, the majority of IDPs first find assistance through host communities before any relief that may come from state or humanitarian actors. Indeed, over 92% of IDPs were living with host families while only 7.6% where living in camps at the end of 2014, with this ratio remaining largely unchanged throughout 2015 (IOM & NEMA, 2014; IOM & NEMA, 2015). Coly (2015) notes, that many host communities find themselves in desperate and poor conditions even before the arrival of IDPs, explaining why they are often unable to administer adequate humanitarian services to incoming people. Despite Nigeria’s ratification of the Kampala Convention in 2012, there appears to be little political will to push through IDP policy reform (Rushing & Reed, 2014), although this may change with the election of Muhammadu Buhari as the country’s new president. There are some signs of hope on the policy and intervention front with regard to the refugee crisis. Efforts to overcome issues of coordination among national and international agencies are reflected in the 2013 publication of a joint humanitarian action plan by Nigeria’s National Emergency Management Agency (NEMA), which entails improved data collection and overall response efforts (Rushing & Reed, 2014). Ms. Poisson (2015) of ACTED noted that international agencies are working “to strengthen collaboration with local authorities to ensure access to asylum, reduce the risk of refoulement and facilitate freedom of movement”. Similarly, inter-agency assessments of refugee areas in Cameroon, Chad, and Niger were carried out in 2014 to identify needs and vulnerabilities of displaced populations. Child protection, gender-based violence, preservation of family unity, and the provision of services such as education and social protection were issues that were found to be most in need of improvement (UNHCR, 2014b). Regarding the security threat posed by Boko Haram, actions have been implemented to stem the violence and address its underlying causes. Attacks on villages in all of the Lake Chad countries have prompted the governments of Cameroon, Chad, and Niger to intervene militarily in conjunction with the Nigerian army to more effectively fight insurgent forces (Coly, 2015). To confront the major issues of government and military accountability in Nigeria, the National Human Rights Commission has started to become more active in recent years, and in December 2013 succeeded for the first time in summoning some of the nation’s top military generals to testify regarding allegations of unlawful violence and extrajudicial killings (Associated
SEM 2015 22
Press, 2014). Several development projects are seeking to rectify the underlying problems of poverty and poor public services. One such example is a $100 million joint program between the government, the UN, the African Development Bank, and Nigerian business leaders that was established in May of 2014 to create safer community and educational-based facilities in the north (Rushing & Reed, 2014). A proposal for a more comprehensive and long-term development programme is discussed in further detail in the following section. Table 1. National and international agencies are continuing to engage in the following activities to respond to the needs of refugees. Border monitoring to enhance access to asylum and prevent refoulement
Creation of mechanisms to allow for family tracking and reunification
Maintenance of civilian character of asylum
Enhancement of procedures to identify newborn children before or upon camp arrival
Refugee relocation from insecure areas
Identify and manage at risk children, including girls subjected to early marriage
Awareness campaigns to encourage refugees reluctant to move from insecure areas
Working with local authorities to establish Standard Operating Procedures (SOPs) in the interest of children
Piloting biometrics registration
Establish SOPs to provide aid and community support to people with specific needs
Provision of refugee and civilian documentation
Establish SOPs to prevent and respond to gender and other forms of sexual-based violence (GSBV)
Training and support of worker and refugee communities
Enhance provision of support to victims of GSBV
Enhancement of refugee camp safety through establishment of vigilance committees
Training of women in conflict prevention and mediation leadership roles
Support of social cohesion activities and women peace committees
Training of humanitarian and security personnel, especially in women’s protection
Counseling to provide psycho-social support Source: Emilie Poisson, Africa Regional Director of External relations & Advocacy, ACTED (2015)
With regards to environmental degradation, indications are starting to emerge that policymakers in the LCB have begun to realise the gravity of the problem and its implications for future migration, violence, and socio-economic development. Last year, Chidi Anselm Odinkalu, chairman of Nigeria’s National Human Rights Commission, stated that, “climate change is real, the consequences are real and it’s got a serious national security consequence,” though he further noted that Nigerians “don’t take it seriously” (Associated Press, 2014). There have been several initiatives launched in recent years by the LCBC in conjunction with partner organisations. In 2008, a Strategic Action Programme (SAP) was passed by all LCBC member States, encompassing both short and long-term initiatives to reverse the environmental trends of the past half-century (LCBC, 2008). One of the most significant and relevant of these for 2014 is the Five-Year Investment Plan 2013-2017. In April, funding for the Plan was still in the process of being secured (LCBC, 2014), but part of the Plan will apparently include an inter-basin water transfer project (Premium Times, 2014) that would more than triple the size of the lake from current levels (LCBC, n.d.).
SEM 2015 23
AFRICA
JASON RIZZO A SHRINKING LAKE AND A RISING INSURGENCY
4. POLICY RECOMMENDATIONS Despite some of the noted policy progress in recent years, political commitment and concrete policy interventions still have a long way to go. Momentum must therefore continue to grow and future policy design should address the complex web of challenges in a holistic way. In this light, the following section details four key policy recommendations and the necessary preconditions that must exist for the desired outcomes to transpire. They should be considered as a joint package, as any of the following measures taken individually will have a limited impact on a problem that has several root causes. As a prerequisite to all policy recommendations, it should be noted that significant effort must be made to ensure active stakeholder engagement at all levels. This issue was underscored in March 2014 by Jonathan Kamkwalala, World Bank Manager for Water Resources and Disaster Risk Management, who said, “the issues are challenging at the sectorial, national and regional levels. As such, they require a variety of stakeholders to cooperate on solutions. The ministers of water, environment and agriculture will have to work together to ensure coordination of policies that affect the lake resources” (World Bank, 2014). This implies political will and a commitment to inclusivity on the part of all governments. As such, the new leadership in Nigeria would do well to finally establish the National Climate Change Commission, which was approved and passed by the National Assembly in 2010, yet has been pending presidential approval ever since (Onemola, 2014). In terms of the specific policies aimed at environmental restoration and preservation, it is important to note that we are only now starting to learn of certain hydrologic characteristics of Lake Chad and the manner in which they are affected by human activity. The research conducted on the lake’s relationship with groundwater and underwater aquifers, for example, is just a few years old. Greater awareness, better data, and further research along these lines is needed in order to make informed policy decisions about proper resource management, especially in areas of dense human population that are prone to act as anthropologic hotspots. To its credit, the LCBC’s Five-Year Investment Plan calls for several studies that aim to improve understanding in the areas of water pollution controls, ground and surface water observation, water control for sustainable agricultural production, and exploitation and protection of the lake’s biological resources (LCBC, 2014). The ultimate impact of the proposed research, however, is contingent on sufficient provision of funds and proper implementation on the part of national governments and international partners. The current reality is a vivid, if disappointing, case in point. Nearly three years into the LCBC’s Five-Year Investment Plan, its current capacity to monitor real-time hydrologic indicators is severely restricted due to underfunded and unmaintained national monitoring networks, particularly in Nigeria and Cameroon (Walbadet, Moutadé, Ndara & Lawan, 2015).
Policy Recommendation #1 (Environment) – Improve water efficiency
As noted in the previous section, several projects are now being carried out or considered as a part of the LCBC’s SAP to stem the shrinking and degradation of Lake Chad. One topic area that should receive more attention is water-use efficiency. In order to enhance water and food security in the region, LCB countries must commission studies, carry out pilot projects, and scale up initiatives to decrease water wastage and improve the means by which water is used and transported. Odada et al. (2005) state that water-use efficiency in the region’s irrigation systems is very low, around 11%. With smallholder farmers accounting for 75 to 80% of the overall farming population (FAO/LCBC, 2009), the difficulty will reside in designing policies and programmes that appeal to and are adopted by a wide selection of farmers. Small-scale irrigation technologies have been successfully implemented in some areas (FAO/LCBC, 2009).
SEM 2015 24
Additional small-scale irrigation options and pilot projects should be considered and then scaled up so that they are made widely available to all segments of the population. Appropriate marketing and educational materials that are flexible and tailored to the needs of individual communities should be incorporated into these initiatives to ensure their success. Additionally, future large-scale irrigation schemes must take into account anticipated water level changes. Ideally they can be designed to allow for intake at various lake water levels and surface area dimensions. As previously mentioned, projects such as the one carried out in Nigeria in the 1970s have become irrelevant because their water intake was designed for Normal or Large lake conditions and not the Small or Small Dry conditions that have persisted since then.
Policy Recommendation #2 (Security) – Reign in the military and hold them accountable
This recommendation is specific to Nigeria and aims to tackle one of the main drivers of violence in the region. The military must be reigned in and held accountable for their actions. To this end, the National Human Rights Commission must not only continue to be supported by the country’s new leadership, but it must also be given the power to enforce decisions based on its findings. Information on efforts to bring the military and police forces to justice should be made widely available, especially to the population in the northeast of the country. One way of accomplishing this would be for the government to create a transparency and local feedback initiative, where people can easily receive the latest information regarding human rights abuses and further voice their grievances and/or contribute to public dialogue on security-related issues. Such a programme would also foster a gradual restoration of trust between locals and the government.
Policy Recommendation #3 (Migration) – Streamline passage of migrant rights legal framework
To address some of the largest challenges presented by the refugee crisis, clear indications must be established around the rights of refugees, whether they are internally displaced, foreign refugees, or returnees. Agencies and ministries must also be given clear and distinct roles so that the provision of aid and humanitarian assistance is carried out in an effective and timely manner. These institutions must also be allocated the resources they need to carry out their work. Adequately trained personnel, funding, and access to accurate data and supplies are all obvious examples. While Nigeria is the most conspicuous case in which a policy of this nature is needed (particularly with regard to IDPs), it would be to the benefit of all migrants and LCB host countries alike for governments to align as best as possible the legal protections and regulatory frameworks necessary to respond to emergencies. As has been demonstrated above, cross-border international migration as a result of both environmental degradation and violence is always to another LCB country. With this in mind, Cameroon, Chad, Niger, and Nigeria should consider the establishment of a new regional body, similar in concept to the LCBC, but designed with the specific objectives of aligning migration policy, gathering and disseminating data, establishing and maintaining a rapid-response fund, and better coordinating humanitarian efforts among national bodies. Even in non-crisis situations, this regional institution would play a vital role in monitoring voluntary and seasonal migration, and offering policy guidance to local governments to ensure equitable rights and services for all migrant groups. Doing so would not only help reduce the likelihood of migration-induced conflict between nomadic or semi-nomadic populations, but it would also provide an opportunity to identify in advance areas of potential resource or social dispute and then pre-emptively organise mitigation and response efforts.
SEM 2015 25
AFRICA
JASON RIZZO A SHRINKING LAKE AND A RISING INSURGENCY
Policy Recommendation #4 (Cross-cutting) – Improve education and employment opportunities, particularly among women
The above three recommendations can been seen as priority interventions to be carried out in the short and medium terms in order to address present-day failures in the LCB. Here, a fourth and final recommendation is considered as a long-term initiative designed to tackle several of the underlying and interlinked causes found at the nexus between environmental degradation, migration, and violence in the LCB. This recommendation calls for a comprehensive development programme to improve access to and quality of educational and employment opportunities in the region, particularly among poor women. Conditional cash transfer initiatives for mothers with school-aged children, teacher training, construction and renovation of schools, micro-credit schemes, adult training and education, and the establishment of women’s employment associations are all examples of different components that could be included in the wider development programme. If properly funded, designed and implemented, a programme of this nature is likely to produce several positive outcomes. The most obvious is an increase in the level of income among poor families, which would serve to reduce poverty as well as vulnerability to climate change and environmental degradation. It has already been discussed how Boko Haram was born out of and continues to thrive in conditions of poverty, poor public services, and weak governance. A major poverty reduction programme that produces higher income through better provision of education and employment opportunities would greatly diminish Boko Haram’s rationale and motivational influence. At the same time, increased income levels can allow families to choose from a wider range of available migratory options in the event of violence, extreme weather events, or other life-threatening circumstances. While these are all positive developments in their own right, several additional indicators key to economic and social development could be expected to improve as well. Past studies, for example, have found that higher levels of women’s education and labour force participation are two of the most effective determinants in producing lower fertility rates (Sen, 1999). In the LCB, lower fertility and reduced demographic pressure would help to correct problems of resource conflict, humaninduced environmental degradation, and migration. Higher overall educational achievement would also improve awareness on issues such as climate change, sustainable resource management, and environmentally friendly practices across different livelihoods. Employment initiatives that specifically target women, who often bear the greatest burden in situations of poverty, will also serve to reduce income inequality. Wilkinson and Pickett (2009), among others, have convincingly demonstrated that lower inequality has wide ranging positive implications on measures such as social trust, mental and physical health, life expectancy, and violence in both developed and developing nations. It can be further argued that increasing educational and economic activity among women would result in more inclusive social and cultural attitudes, which, in a region as diverse as the LCB, is essential in contributing to peaceful and cooperative co-existence among different ethnic and religious groups. Similar programmes in the LCB that have been attempted in past were too shortterm and narrowly focused to produce any lasting results. Nigeria recently concluded a one-year conditional cash transfer programme that, while temporarily improving income and educational enrolment, did little to address structural problems within the education system (Akinola, 2014). It is therefore important to emphasise that this recommendation calls for a long-term comprehensive package consisting of multiple component projects to address shortcomings at each stage in both the education and employment chains.
SEM 2015 26
CONCLUSIONS Displacement of populations in the Lake Chad region in 2014 can be explained by five underlying and inter-related determinants. The slow-onset degradation of Lake Chad due to climate change and greater degrees of human activity that have interfered with the lake’s natural characteristics is one key driver that has produced knock-on effects contributing to resource conflict and poverty in the region. These implications, in turn, when combined with poor governance (including corruption, and weak provision of public goods) and an ethnically and religiously charged setting have fuelled the rise of violent extremism, which can be seen as another key driver of migration in 2014. Demographic, political, and social factors are all strongly intertwined with environmental degradation and violence, and can also be viewed as direct drivers of migration in their own right. Additionally, a feedback loop can be observed between violence and migration. While violence contributed greatly to forced migration in 2014, migration itself as a response to reduced lake levels led to increased conflict as livelihood systems compete over resources. Over 1 million people were displaced in the region following the events of 2014, a figure that more than doubled throughout 2015. Governments and aid agencies have had no choice but to begin to respond to the refugee crisis and its underlying causes. While important first steps have been taken, refugees and IDPs remain vulnerable and underserved, particularly in the areas of child protection, gender-based violence, family unification, education, and social protection. Likewise, current policy actions to address the root-cause issues of environmental degradation and violence are headed in the right directions, but are insufficient to reverse the current trends and ensure sustainable outcomes. As such, a comprehensive policy package should be considered to improve water-use efficiency, reform Nigeria’s military, establish a clear and unified legal framework for migrant, refugee, and IDP rights, and enhance educational and employment opportunities among women. Success in both the short and long-term in any of these areas will require strong political will and a commitment to engage all stakeholders at local, state, national, and regional levels.
SEM 2015 27
AFRICA
JASON RIZZO A SHRINKING LAKE AND A RISING INSURGENCY
REFERENCES –– Agbiboa, D. (2014). Boko-Haram and the Global Jihad: ‘Do Not Think Jihad is Over. Rather Jihad Has Just Begun’. Australian Journal Of International Affairs, 68(4), 400-417. doi:10.1080/10357 718.2014.891564 –– Agbiboa, D., & Maiangwa, B. (2013). Boko Haram, Religious Violence, and the Crisis of National Identity in Nigeria: Towards a Non-killing Approach. Journal Of Developing Societies, 29(4), 379-403. doi:10.1177/0169796x13503198 –– Akinola, O. (2014). Nigeria’s COPE CCT programme and its ‘premature’ graduation strategy, any hope for participants’ human capital development?. [Blog] Povertics. Available at: http:// vulnerabilityandpoverty.blogspot. fr/2014/05/nigerias-cope-cctprogramme-and-its.html –– Associated Press, (1936). France May Divert River to Save Big African Lake. The New York Times. Retrieved from http://timesmachine.nytimes.com/ timesmachine/1936/06/30/93522684. html?pageNumber=13 –– Associated Press, (2014). Nigeria Human Rights Advocate Hails Progress. The New York Times. Retrieved from http://www.nytimes. com/aponline/2014/04/09/world/ africa/ap-af-nigeria-human-rights.html –– Barna, J. (2014). Insecurity in Context: The Rise of Boko Haram in Nigeria. Brussels: European Parliament Think Tank. Retrieved from http://www. europarl.europa.eu/thinktank/en/ document.html?reference=EXPOAFET_NT(2014)536393 –– BGR, (2014). Supraregional Africa: Groundwater Management of Lake Chad Basin. Bundesanstalt für Geowissenschaften und Rohstoffe (BGR). Retrieved 15 April 2015, from http://www.bgr.bund.de/ EN/Themen/Zusammenarbeit/ TechnZusammenarb/Projekte/ Laufend/Afrika/1073_2010-2274-8_ Tschad_Grundwasserberatung_ Tschadseebeckenkommission_en.html
SEM 2015 28
–– BGR, (2015). TC Lake Chad Basin: Groundwater Management. Bundesanstalt für Geowissenschaften und Rohstoffe (BGR). Retrieved 17 April 2015, from http://www.bgr.bund. de/EN/Themen/Wasser/Projekte/ laufend/TZ/Tschad/tschad-II_fb_ en.html –– Coe, M., & Foley, J. (2001). Human and natural impacts on the water resources of the Lake Chad basin. Journal Of Geophysical Research, 106(D4), 33493356. doi:10.1029/2000jd900587 –– Collier, P. (2009). Wars, guns, and votes (pp. 52-53). New York: Harper. –– Coly, I. (2015). Phone Interview with Ibrahima Coly, Regional Coordinator for West and Central Africa at IEDA Relief Senegal. Dhakar/Paris. –– Daviot, S. (2015). RE: Requisition for information concerning SEM 2015 Information on DTM Nigeria needed. [email]. –– De Young, C., Sheridan, S., Davies, S., & Hjort, A. (2011). Climate change implications for fishing communities in the Lake Chad Basin: What have we learned and what can we do better?. In Workshop on climate change implications for fishing communities in the Lake Chad Basin (pp.3-64). Rome: Food and Agriculture Organization of the United Nations. Retrieved from http:// www.fao.org/docrep/017/i3037e/ i3037e.pdf –– Essono, I. (2014). Interview: H.E. Issoufou Mahamadou. LCBC News Magazine, p. 12. Retrieved from http:// www.cblt.org/sites/default/files/ maquette_cblt_mag_va_13.pdf –– FAO, (2014). The State of World Fisheries and Aquaculture (pp. 181-194). Rome: Food and Agriculture Organization of the United Nations. Retrieved from http://www.fao.org/3/a-i3720e.pdf –– FAO/LCBC, (2009). Adaptive Water Management in the Lake Chad Basin (pp. 5-25). Stockholm: Food and Agriculture Organization of the United Nations/ Lake Chad Basin Commission. Retrieved from http://www.fao.org/ nr/water/docs/ChadWWW09.pdf
–– Geerken, R., Vassolo, S., & Bila, M. (2010). Impacts of climate variability and population pressure on water resources in the Lake Chad Basin. In Global Water System Project Conference of the Global Catchment Initiative (GCI) (pp. 116-124). Bonn: The Global Water System Project. Retrieved from http://www.gwsp.org/fileadmin/ GCI_conference/Products/GWSPGCI%20conference%202010%20 Proceedings.pdf –– International Crisis Group, (2010). Northern Nigeria: Background to Conflict (pp. 11-22). Dakar/Brussels: International Crisis Group. Retrieved from http://www.crisisgroup. org/~/media/Files/africa/westafrica/nigeria/168%20Northern%20 Nigeria%20-%20Background%20to%20 Conflict.pdf –– International Crisis Group, (2014). Curbing Violence in Nigeria (II): The Boko Haram Insurgency (p. 13). Abuja/Dakar/Nairobi/Brussels: International Crisis Group. Retrieved from http://www.crisisgroup.org/~/ media/Files/africa/west-africa/ nigeria/216-curbing-violencein-nigeria-ii-the-boko-haraminsurgency.pdf –– International Organization for Migration, Boko Haram May Have Displaced Over a Million in Nigeria. International Organization for Migration (IOM). Retrieved 10 April 2015, from http://www.iomnederland.nl/en/405-boko-harammay-have-displaced-over-a-millionin-nigeria-iom –– IOM, & NEMA, (2014). The IDP Situation in North-Eastern Nigeria (DTM Round I Report). IOM. Retrieved from https://nigeria.iom.int/sites/ default/files/dtm/DTM%20Nigeria_ December%202014.pdf –– IOM, & NEMA, (2015). DTM Nigeria Round VI Report. Retrieved from http://nigeria.iom.int/sites/ default/files/dtm/01_IOM%20 DTM%20Nigeria_Round%20VI%20 Report_20151031.pdf
–– Kaufmann, D., Kraay, A., & Mastruzzi, M. (2014). The Worldwide Governance Indicators (WGI) project. Worldwide Governance Indicators. Retrieved 19 April 2015, from http://info.worldbank. org/governance/wgi/index.aspx#home –– LCBC, Interbasin Water Transfer Project (IBWTP). Lake Chad Basin Commission. Retrieved 19 April 2015, from http:// www.cblt.org/en/interbasin-watertransfer-project-ibwtp –– LCBC, (2008). Strategic Action Programme for the Lake Chad Basin: Agreed by the LCBC Member States of Cameroon, Central African Republic, Chad, Niger, and Nigeria. Lake Chad Basin Commission. –– LCBC, (2014). Inaugural meeting of the international Scientific Committee. Lake Chad Basin Commission. Retrieved 19 April 2015, from http://www.cblt.org/ en/node/68 –– Lemoalle, J., Bader, J., Leblanc, M., & Sedick, A. (2012). Recent changes in Lake Chad: Observations, simulations and management options (1973-2011). Global And Planetary Change, 80-81, 247254. doi:10.1016/j.gloplacha.2011.07.004 –– Malik, K. (2014). Sustaining Human Progress: Reducing Vulnerabilities and Building Resilience. United Nations Development Programme. –– NASA/Goddard Space Flight Center-EOS Project Science Office, (2001). Africa’s Lake Chad Shrinks By 20 Times Due To Irrigation Demands, Climate Change. ScienceDaily. Retrieved May 9, 2015 from www.sciencedaily.com/ releases/2001/02/010228080245.htm –– Nigeria Social Violence Project, (2014). Social Violence in Nigeria. Connect SAIS Africa. Retrieved 19 April 2015, from http://www.connectsaisafrica.org/ research/african-studies-publications/ social-violence-nigeria/ –– Odada, E., Oyebande, L., & Oguntola, A. (2005). Lake Chad: Experience and lessons learned brief. International Lake Environment Committee. Retrieved from http://www. worldlakes.org/uploads/06_Lake_ Chad_27February2006.pdf
–– Okonkwo, C., & Demoz, B. (2014). Identifying anthropogenic “hotspots” and management of water resources in Lake Chad Basin using GIS. Journal Of Natural Resources Policy Research, 6(2-3), 135-149. doi:10.1080/19390459.2 014.920581 –– Okonkwo, C., Demoz, B., & Gebremariam, S. (2014). Characteristics of Lake Chad Level Variability and Links to ENSO, Precipitation, and River Discharge. The Scientific World Journal, 2014, 1-13. doi:10.1155/2014/145893 –– Onemola, O. (2014). Why Nigeria Must Act on Climate Change. Applause Africa. Retrieved from http://www. applauseafrica.com/magazine/313why-nigeria-must-act-on-climatechange –– Onuoha, F. (2010). Climate change, population surge and resource overuse in the Lake Chad area: Implications for human security in the north-east zone of Nigeria. In D. Mwiturubani, J. van Wyk, R. Mwebaza & T. Kabanda, Climate change and natural resources conflicts in Africa (1st ed., pp. 23-44). Institute for Security Studies. Retrieved from http://www.issafrica.org/ publications/monographs/climatechange-and-natural-resourcesconflicts-in-africa –– Onuoha, F. (2012). Boko Haram: Nigeria’s Extremist Islamic Sect. Al Jazeera Centre for Studies. Retrieved from http://studies.aljazeera.net/ ResourceGallery/media/Document s/2012/2/29/2012229113341793734BO KO%20HARAM%20NIGERIAS%20 EXTREMIST%20ISLAMIC%20SECT. pdf
–– Rushing, E., & Reed, J. (2014). Nigeria: multiple displacement crises overshadowed by Boko Haram. Geneva: Internal Displacement Monitoring Centre. Retrieved from http:// www.internal-displacement.org/ sub-saharan-africa/nigeria/2014/ nigeria-multiple-displacement-crisesovershadowed-by-boko-haram –– Sen, A. (1999). Development as freedom (pp. 189-203). New York: Knopf. –– UNHCR, (2014a). Refugees fleeing attacks in north eastern Nigeria, UNHCR watching for new displacement. Retrieved from http://www.unhcr. org/536ca0f79.html –– UNHCR, (2014b). Nigeria Regional Refugee Response Plan. UNHCR. Retrieved from http://www.unhcr. org/541836c69.html –– UNHCR, (2015). UNHCR Refugees/ Migrants Emergency Response Mediterranean. UNHCR Refugees/ Migrants Emergency Response Mediterranean. Retrieved 9 November 2015, from http://data.unhcr.org/ mediterranean/regional.php –– Walbadet, A., Moutadé, E., Ndara, R., & Lawan, A. (2015). Hydrometeo, 2nd quarter 2015. LCBC. Retrieved from http://www.cblt.org/sites/default/ files/bull_hydromet_avril_mai_ juin_2015_en.pdf –– Wilkinson, R., & Pickett, K. (2010). The spirit level. London: Penguin Books. –– World Bank, (2014). Restoring a Disappearing Giant: Lake Chad. Retrieved from http:// www.worldbank.org/en/news/ feature/2014/03/27/restoring-adisappearing-giant-lake-chad
–– Poisson, E. (2015). RE: Nigeria Refugee Inquiry. [email] –– Premium Times, (2014). Chad: Restoration of Lake Chad Will Stem Security Challenges in Northeast Nigeria - Committee. Retrieved from http://www.premiumtimesng. com/news/154102-restoration-lakechad-will-stem-security-challengesnortheast-nigeria-committee.html
SEM 2015 29
SEM 2015 30
CLÉMENT MÉTIVIER
Violence and Displacement in Northern Nigeria Identifying Environmental Factors in the Recent Eruption of Violence and the Associated Displacement Movements
O
ver the past few decades, scholars have been paying more and more attention to the role of environmental factors in conflicts, revealing that the environment should be carefully considered when analysing the root causes and consequences of wars. Some authors have even gone farther; Jared Diamond has for instance argued that environmental hazards and climate-related changes, among other factors, were responsible for the decline and collapse of entire societies. Recently, it has been shown that environmental changes played a significant part in the build-up of the ongoing conflict that has been devastating Syria for more than 4 years: following unprecedented drought from 2006 to 2010, rural populations dependent on agriculture saw a substantial deterioration in their living conditions. 1.5 million of them fled to cities (Pandey, 2015), which contributed to the destabilisation of the political order and fuelled tensions. The example of Syria is interesting to consider, since it also highlights the impact of migration movements on States. Analysing the relationship between conflicts, migration and the environment will be a guiding principle of the following case study, which will not focus on Syria, but will rather examine the situation in northern Nigeria. Nigeria is a developing country that is now the largest economy on the African continent in terms of gross domestic product (GDP) (Caulderwood, 2014), with economic growth of more than 6% in 2014 (World Bank, 2015), and the largest producer of oil in Africa. Nigeria is a diverse country, with more than 250 ethnic groups and languages. The country gained independence in 1960, and after several decades of political instability, with numerous military coups, civilian rule was eventually established in 1999. Nigeria is a federal structure, with 36 states (See Annex 1), and around 800 Local Government Areas (LGAs) (IDMC, 2012). In addition to the numerous economic, political and social challenges it has to cope with, Nigeria is facing environmental risks that are going to become more pervasive in the years and decades to come as a result of climate change. According to the Intergovernmental Panel on Climate Change, the whole African continent will become increasingly exposed to the negative impacts of climate change (Ferris & Stark, 2012), notably including population movements. The United Nations Environment Programme has stated that by 2060, there will be around 50 million environmental migrants in Africa (Afifi, 2011). The International Organization for Migration (IOM) defines environmental migrants as people who choose or are obliged to leave their homes because of sudden or progressive modifications in the environment, which negatively impact the living conditions of those people being displaced within their country or abroad (IOM, 2014). The notion of environmental migrants and the projections made concerning the future number of environmental migrants are,
SEM 2015 31
AFRICA
CLÉMENT MÉTIVIER VIOLENCE AND DISPLACEMENT IN NORTHERN NIGERIA
Figure 1: Nigeria and its 36 states
Source: Higazi & Brisset-Foucault, 2013
however, questioned. Indeed, migration movements cannot be understood solely through an environmental lens. The decision to migrate involves a wide range of factors, which can be environmental, as well as economic, social or political. It is thus important not to overestimate the significance of environmental issues when formulating projections of future migration movements. At the same time, underestimating the impact of environmental factors on other processes may lead to misunderstandings and misrepresentations. Northern Nigeria has attracted considerable attention over the past few years because of the conflict opposing the national authorities and the Islamist movement Boko Haram. This conflict has led to considerable population displacements, which intensified in 2014. But the focus on Boko Haram has tended to hide other phenomena, especially environmental factors, which are also responsible for displacement in northern Nigeria. The following case study will examine the migration movements that occurred in 2014 in northern Nigeria, a year that witnessed a spectacular rise in the level of violence in the area. Its goal is to analyse the role of environmental parameters in conflict dynamics and the decision to migrate in order to uncover the influence of the environment on violence and displacement. For the purposes of the case study, northern Nigeria will be defined as the Muslim-majority area of Nigeria, consisting of the 12 states ruled by Sharia law, as well as the states of Plateau, Adamawa and Taraba (See Annex 2). The first section of the case study will show that northern Nigeria is a highly vulnerable zone because of poverty, underdevelopment and violence, as well as climate hazards and progressive environmental changes. The second part of the case study will focus on the year 2014, which saw large migration movements in northern Nigeria. The study will assess the humanitarian situation in the area and the policy responses implemented by the local, national and international authorities. The fourth section of the case study will analyze the 2014 migration movements in northern Nigeria using the environment – migration – conflict nexus, a very
SEM 2015 32
interesting tool that helps to grasp the root causes and implications of the current events in northern Nigeria. The last section of the paper will identify several challenges that have to be addressed, and will propose a series of recommendations that could improve the situation in northern Nigeria.
1. NORTHERN NIGERIA, A ZONE EXPOSED TO A WIDE RANGE OF PROBLEMS 1.1. Poverty, underdevelopment and growing socioeconomic inequality
Despite the tremendous revenues brought by oil production, which is concentrated in the south of Nigeria, especially in the Niger Delta, Nigerians’ quality of life has not significantly improved over the past decades (Werz & Conley, 2012). Corruption is widespread and prevents the fair redistribution of wealth in the country. As a result, socioeconomic inequalities are growing between the south of Nigeria, which is relatively wealthy and predominantly Christian, and the north, highly disadvantaged with a majority of Muslims (Higazi & Brisset-Foucault, 2013). Today, Nigeria is one of the most unequal countries in the world in terms of income and access to social and economic opportunities (UNDP, 2009). The north-south divide has led to underdevelopment of the northern states, where poverty rates are extremely high. Indeed, 75 to 90% of the population lives on less than US$1 a day in the northwest and northeast of the country (BBC News, 2012). Illiteracy levels are as high as 85% in some parts of the north (MacCauley, 2014), and many children find themselves outside of the school system. In addition, unemployment rates are very high in northern Nigeria, especially among young people.
1.2. A situation of generalised violence
Since the democratic transition and the establishment of a civilian government in 1999, northern Nigeria has experienced more violence than the rest of the national territory (MacCauley, 2014). Recurrent conflicts have occurred in northern Nigeria for decades because of religious, ethnic and social tensions. Clashes between farmers and pastoralists have been consistently fuelling violence (Conroy, 2014). But since 2009, the emergence of Boko Haram has radically changed the conflict landscape of northern Nigeria. Boko Haram was created in northeastern Nigeria in the early 2000s, and was initially defined as a sect. Boko Haram is frontally opposed to Western civilisation, and to the secularisation of the Nigerian state. It also aims to establish an Islamic state (caliphate) in northern Nigeria (Adibe 2014). In 2009, it radicalised its actions (Adibe, 2014) and by 2011 had become a powerful insurgent organisation carrying out violent attacks against civilian populations (Assessment Capacities Project, 2015). Boko Haram differs from other organisations insofar as it indiscriminately targets Christian and Muslim populations, whereas in the past, conflicts in northern Nigeria were based on ethnic and religious divides (Kimenyi & al, 2014). In its discourse, Boko Haram has publicly required Christians to leave northern Nigeria, while also attacking Muslim leaders who condemn the radical Islamists’ tactics (IDMC, 2014). Since the radicalisation of Boko Haram in 2009, attacks against civilians have been increasingly deadly. Between 2009 and 2011, the actions carried out by Boko Haram militants have led to the death of over 1,000 individuals in northern Nigeria (Integrated Regional Information Networks, 2012). The conflict accelerated after the declaration of a state of emergency in 2012 in Yobe, Borno, and Adamawa (IDMC, 2014), which form the northeastern part of Nigeria (See Annex 3). The state of emergency was later confirmed in May 2013, in the same three states (Kimenyi & al, 2014). Despite the arrival of armed governmental forces in the region, Boko Haram killed around 2,000 people in 2012 (Kimenyi & al, 2014). It then managed to take control
SEM 2015 33
AFRICA
CLÉMENT MÉTIVIER VIOLENCE AND DISPLACEMENT IN NORTHERN NIGERIA
of some parts of Borno state in 2013 (Assessment Capacities Project, 2015). In 2014, the conflict accelerated once again (See Annex 4), with Boko Haram multipliying large-scale abductions from the start of the year. The Islamist organisation proclaimed an Islamic caliphate in August 2014 in a territory including ten large cities in Yobe, Borno and Adamawa states (IDMC, 2014). In the second half of the year, attacks multiplied, with Boko Haram believed to have killed more than 10,000 people in 2014, most of them massacred during raids carried out in the rural northeastern region (Alfred, 2015). This means that during 2014 alone, the Boko Haram killed more people than during the five previous years (IDMC, 2014). Violence is also now threatening to spill over into neighbouring countries such as Cameroon (Alfred, 2015). Despite the rise of Boko Haram, other forms of violence have not disappeared. Clashes between herdsmen and farmers also occurred in 2014, and in some cases, herdsmen have been suspected of collaborating with Boko Haram, thus blurring the distinction between the new conflict, and the more traditional ethno-religious tensions (Kimenyi & al, 2014).
1.3. Growing environmental vulnerability
Northern Nigeria is exposed to several environmental challenges, which put a great amount of pressure on local ecosystems and on people’s livelihoods.
1.3.1. Desertification
Desertification is likely to be the biggest environmental problem for northern Nigeria. Desertification has been defined by the United Nations as a process of land degradation in dry areas resulting from various factors, including human activities and climate variations (MacCauley, 2014). Desertification, which is sometimes called desert encroachment, has led to the disappearance of entire villages (Werz & Conley, 2012). It has a marked adverse effect on crop and livestock production, and is recognised as a driver of migration in northern Nigeria (IDMC, 2014). It is estimated that because of desertification, Nigeria is losing between 2,000 and 3,500 square kilometres of land each year (Mohammed, 2015, Werz & Conley, 2012). The Sahara desert currently already covers a third of the national territory, and is advancing at a rate of 0.6 kilometres per year (Conroy, 2014). Over the past two decades, sand dunes have expanded by 400% (Conroy, 2014), and have started to cover large portions of farmland in agriculturally productive regions (Mohammed, 2015). Desertification affects in particular the states of Sokoto, Yobe, Borno, and Kebbi (Ibimilua & Ibimilua, 2014). This century, two-thirds of the 11 following states could become desert areas: Sokoto, Yobe, Kebbi, Zamfara, Katsina, Kaduna, Kano, Jigawa, Gombe, Borno and Bauchi (Conroy, 2014).
1.3.2. Deforestation and decreasing yields
Northern Nigeria has experienced a continuous decrease in the percentage of forest areas, from 70% in the early 1960s to 35% today, while the surface area used for cropland and pasture has increased at the same time (MacCauley, 2014). The relationship between forests and agricultural fields is important: some studies have indeed revealed that the absence of vegetation cover was leading to a decrease in soil nutrients in the Sahel region, which was in turn threatening soil productivity. Insufficient levels of soil nutrients pose a serious risk to crop productivity, comparable to decreasing rainfall levels (MacCauley, 2014). In northern Nigeria the soil has traditionally been suitable for the cultivation of numerous crops, such as sorghum, rice, corn, millet, cowpeas and soybeans. But with less and less iron in the soil, crop production will be affected. In the Sahel region of Nigeria, crop yields have reduced on average by 20% over the past three decades (Conroy, 2014).
SEM 2015 34
1.3.3. Degrading weather conditions
The north of Nigeria is a semi arid zone consisting mostly of savannah, with low rainfall levels (Mohammed, 2015). Since the start of the 19th century, the Sahel region of Nigeria has witnessed a 3 to 4% drop in rainfall per decade (Conroy, 2014). Some studies have reported that the rain episodes in West Africa were sensitive to deforestation (MacCauley, 2014). Following that analysis, the decline in rainfall levels is likely to be related to the decrease in forest surface in northern Nigeria. The steady decline in annual rainfall has been accompanied by a shortening of the rainy season, which lasted 5 months 30 years ago, and lasts only 4 months nowadays (Conroy, 2014). The distinction between the dry and the rainy season is becoming more and more blurred, thereby destabilising agricultural cycles (Werz & Conley, 2012). Moreover, northern Nigeria is a drought-prone territory where water is scarce in many areas (Werz & Conley, 2012). Droughts are more frequent in the states of Kebbi, Kastina, Sokoto, Jigawa, Kano, Borno and Yobe (Ibimilua & Ibimilua, 2014). Throughout the whole Sahel region, overall temperatures have been on the rise over the past decades (See Annex 5) (United Nations Environment Programme, 2011).
1.3.4. Exposure to floods
While desertification, deforestation, decreasing yields and degrading weather conditions can be labelled as slow-onset events, floods can be qualified as sudden disasters. In Nigeria at least 20% of the population is at risk from flooding (Etuonovbe, 2011), and floods occur frequently. Flood episodes result in the destruction of roads, bridges, farmlands and infrastructure (Etuonovbe, 2011), and also provoke largescale population displacements. In 2009, floods displaced around 140,000 Nigerians, and at least 500,000 in 2011 (IDMC, 2012). In northern Nigeria more specifically, floods have been more frequent and more intense (United Nations Environment Programme, 2011). In September 2010, heavy rainfall pushed local authorities to open the Challawa and Tiga dams in the state of Kano, in order to relieve the water pressure put on them. The subsequent flooding displaced two million people (Ferris & Stark, 2012). In the state of Sokoto in the same month, a massive flood submerged around 50 villages, and forced over 130,000 Nigerians to flee (Etuonovbe, 2011). In 2014, flooding was limited in northern Nigeria, only affecting southern states (IDMC, 2014). Northern Nigeria is a region characterised by endemic poverty and underdevelopment. Furthermore, the gap between the north and the south of the country is widening. Violence is widespread in northern Nigeria, in particular because of the conflict between governmental authorities and the insurgent group Boko Haram. In addition, the region is becoming increasingly vulnerable to climate change and environmental hazards. In 2014, the explosion of violence in northern Nigeria, associated with underlying economic, political and environmental problems, led to massive population movements.
2. 2014: A SPECTACULAR RISE IN VIOLENCE CAUSING LARGE MIGRATION MOVEMENTS IN NORTHERN NIGERIA This section does not aim at studying seasonal migration movements, which are traditional adaptation strategies, very common in West Africa. The following section will neither focus on the traditional conflicts fueled by religious, ethnic or regional divisions and tensions, which have regularly caused displacement movements across Nigeria (IDMC, 2012). Rather, the purpose of the following analysis is to assess the exceptional migrations that occurred in 2014 in Northern Nigeria.
SEM 2015 35
AFRICA
CLÉMENT MÉTIVIER VIOLENCE AND DISPLACEMENT IN NORTHERN NIGERIA
Figure 2. The 12 states ruled by Sharia law in Nigeria
Source: Bowie, Nile. 2012 “Nigeria: Fertile Ground for Balkanization”. Infowars.com
2.1. The difficulty of obtaining reliable and accurate information on displacement
At the local and national levels, there is little capacity to collect data on displacement movements within Nigeria (IDMC, 2012). Functioning monitoring institutions are lacking in Nigeria, and no accurate figures are released regarding levels of displacement in the country (IDMC, 2012). From state to state, the expertise in data collection regarding internally displaced persons (IDPs) varies greatly (IDMC, 2014). Independent estimates provided by international organisations are generally lacking (IDMC, 2014). When data is collected, the quality of information is limited, because data on displacement is only occasionally disaggregated by sex, age or location (IDMC, 2014). Quite often, the numbers provided by non-governmental organisations (NGOs) and government agencies are rough estimates, which only take into account people living in temporary camps and shelters, or refer to very localised displacements without looking at the big picture (Ferris & Stark, 2012). The Nigerian Red Cross Society, for example, collects information through volunteers and its local branches, but is not able to maintain a national and centralised database (IDMC, 2014). Only considering the people who are living in camps after being displaced is problematic in northern Nigeria, because most migrants are hosted by friends or family (Ferris & Stark, 2012). Even though they constitute the vast majority of IDPs, individuals living in host communities (with relatives) are not counted, and there is almost no available data concerning them (IDMC, 2014). In addition, the methodology
SEM 2015 36
Annex 3: Intensity of the conflict against Boko Haram across Nigeria
Source: Kimenyi & al, 2014
of estimates can be criticised, given that the estimates provided by governmental agencies are sometimes obtained by simply looking at the number of damaged or destroyed homes in areas from where people have escaped (IDMC, 2014). Moreover, estimates rarely collect information on return movements, when migrants come back to their homes (IDMC, 2014). In the absence of comprehensive and consistent data, key patterns of displacement cannot be identified and understood (IDMC, 2012). As a result, the right policy responses cannot be designed and implemented (IDMC, 2014).
2.2. Quantifying the number of IDPs in Northern Nigeria in 2014
Despite all of the aforementioned limitations, there is some available information circulating on how many Nigerians were displaced in the northern part of the country in 2014. Data has to be carefully considered, and cannot be entirely trusted. However, numbers are useful to give an order of magnitude of what happened in the north of Nigeria in 2014. The number of Nigerians who had to flee is considerable: the National Emergency Agency of Nigeria (NEMA), which is the state agency in charge of disaster management in Nigeria, estimates that 250,000 people had to flee their homes during the first three months of 2014 in the northeast of the country. The number of people being displaced seems to have steadily increased in 2014. During the first nine months of the year, NEMA reported around 1.5 million IDPs in the three northeastern states of Borno, Adamawa and Yobe (Assessment Capacities Project, 2015). Christos Stylianides, who is charge of humanitarian aid and crisis management at the European Commission, said in December 2014 that 1.6 million Nigerians had been displaced because of the ongoing conflict with Boko Haram in 2014 (Alfred, 2015). The migration crisis is not only internal, and has spilled over to neighbouring countries: Cameroon, Niger, and Chad (IOM, 2015). The Zinder and Diffa regions of Niger, the Lake Chad area, and the extreme North of Cameroon have faced a massive arrival of refugees and stranded migrants in 2014 (IOM, 2015). It is believed that between 90,000 and 160,000 fled to Niger in 2014 (Alfred, 2015, Assessment Capacities
SEM 2015 37
AFRICA
CLÉMENT MÉTIVIER VIOLENCE AND DISPLACEMENT IN NORTHERN NIGERIA
Figure 4. Geographic impacts of Boko Haram attacks in 2014
Source: Assessment Capacities Project, 2015
Project, 2015). At the same time, at least 10,000 people migrated to Chad, and at least 35,000 to Cameroon (Assessment Capacities Project, 2015). As a result, at least 135,000 Nigerians sought asylum in neighbouring countries. And this trend seems to have continued, with more than 10,000 migrants arriving in Western Chad from Nigeria during the first two weeks of January 2015 (Alfred, 2015). Faced with huge information gaps and unreliable data, IOM has used a tool called the “Displacement Tracking Matrix”11 (DTM) in northern Nigeria, in order to improve data collection. Originally implemented in six northern states, the DTM was then extended to the whole Nigerian territory at the end of 2014 (IOM, 2015). From July to December 2014, the DTM identified around 400,000 IDPs in five states: Adamawa, Bauchi, Gombe, Taraba, and Yobe (IOM, 2015). NEMA then used the DTM in Borno, Nasarawa, Kaduna, Kano, Plateau, and Zamfara, and discovered an additional 500,000 IDPs (IOM, 2015). As a result, and following the IOM methodology, there were around 900,000 IDPs in Nigeria at the end of 2014 (See Annex 6). Yet once again, the scale of displacement movements is likely to have been largely underestimated. For instance, Monique Barbut, the current Executive Secretary of the United Nations Convention to Combat Desertification, has stated22 that in 2012 alone, migration movements in northern Nigeria accounted for around 7 million people, mostly migrating east towards the Lake Chad region. With that number in mind, it is likely that significantly more than 1 million, or even 1.5 million people were displaced in 2014, given the eruption of violence that rocked northern Nigeria.
1. Displacement Tracking Matrix – Tracking and Monitoring System for Displaced Populations http://www.iom.int/ files/live/sites/iom/files/What-We-Do/docs/DOE-Infosheet-DTM-v2-1.pdf 2. Speech made during the “COP21, J-200: 200 décideurs d’aujourd’hui et de demain s’engagent” conference in Paris on May 4, 2015
SEM 2015 38
Figure 5. Seasonal evolution of temperatures in the Sahel region, from 1970 to 2006
Source: United Nations Environment Programme, 2011
2.3. Assessing displacement patterns in Northern Nigeria
Even though data collection is difficult, which may prevent an in-depth analysis of the recent displacement patterns in northern Nigeria, a few trends can be discerned: –– The vast majority of migrants (probably more than 90%) sought refuge in host communities, with family, friends, or other relatives, rather than going to camps or other institutions (IOM, 2015). There are currently no official camps for displaced populations in Nigeria (Ferris & Stark, 2012) –– Many families split up, with men staying in dangerous areas, while women and children were being sent to safer regions in the south. Such a trend is not new, and has been observed during previous conflicts, for instance when religious clashes occurred in 2000 (IDMC, 2012). –– Migrants seemed to be moving from rural to urban areas (Assessment Capacities Project, 2015) –– IDPs migrated from the northeastern region to the states of Gombe, Taraba and Bauchi, and to central Nigeria (IDMC, 2014). But many IDPs stayed in the same area, and families simply fled throughout northeastern Nigeria (IDMC, 2014) –– Displacements directly induced by Boko Haram have tended to be of a longer duration than displacements induced by sudden climate hazards, which are generally temporary (IDMC, 2012) –– Migrants from Chad and Niger, who were seeking asylum in northern Nigeria, had to return to their country of origin (IDMC, 2012) –– Boko Haram’s establishment of a caliphate has trapped populations in areas under the strict control of the radical Islamist organisation. Several reports have revealed that people seeking to flee the newly established caliphate were executed (IDMC, 2014)
SEM 2015 39
AFRICA
CLÉMENT MÉTIVIER VIOLENCE AND DISPLACEMENT IN NORTHERN NIGERIA
–– In the northwestern part of Nigeria, where Boko Haram is less active, state authorities recognised that thousands had been displaced because of desertification (IDMC, 2014) –– Displacement resulted from attacks carried out by Boko Haram, but also from the counterinsurgency action led by the Nigerian military (IDMC, 2012). Indeed, many civilians pre-emptively fled the areas likely to be disputed both by insurgents and by the military (IDMC, 2014) –– Since both Islamist militants and government soldiers are trying to control roads, many migrants chose to avoid those roads, and were forced into forests, where some of them lost their way, and suffered from hunger and thirst. Furthermore, in some cases, the military targeted migrants, taking them for Islamist insurgents on the move (IDMC, 2014) Despite the difficulty of obtaining accurate data on recent displacements in Nigeria, it appears that 2014 was marked by massive population movements in northern Nigeria and in the Lake Chad region. Migration patterns cannot be assessed in detail due to the lack of reliable information, however some key trends have been identified, in particular the importance of host communities, the rural-urban nature of movements, the existence of trapped populations, and the significant role played by the Nigerian counterinsurgency. Such massive population displacements have led to a situation of humanitarian emergency, with very limited policy responses.
3. INSUFFICIENT POLICY RESPONSES AND THE BUILD-UP OF A HUMANITARIAN EMERGENCY 3.1. Inability of national, local and international institutions to address the current migration crisis
NEMA is the federal institution in charge of responding to the immediate needs of displaced groups (IDMC, 2012). It only started to work on a plan preparing for future displacements in June 2014, with the looming perspective of the 2015 presidential elections (IDMC, 2014). The initiative is laudable, yet it might have come too late regarding the current crisis. NEMA is usually assisted by the National Commission for Refugees (NCFR), which oversees all refugee issues in Nigeria. In 2002, its mandate was expanded in order to include IDPs. The NCFR created a promising Plan of Action for resettlement and reintegration, which has still to be translated into concrete programmes and projects (IDMC, 2012). Nigeria ratified the Kampala Convention in 2012, which is the Convention for the Protection and Assistance of Internally Displaced Persons in Africa (IDMC, 2014). Nevertheless, the federal government has yet to implement the Convention (IDMC, 2014). More generally, national responses to displacements tend to be uncoordinated and inadequate. Ministries, agencies, and departments involved in displacement policies tend to compete with each other for the same pools of money, which are moreover very limited (IDMC, 2014). At the state level, State Emergency Management Agencies (SEMAs) are fulfilling the prerogatives that NEMA pursues at the federal level. The SEMAs have varying capabilities, and responses to displacement differ significantly from state to state, with an absence of coordination (IDMC, 2012). International NGOs are not really present in the field, given the risks in the region, and the difficulty of ensuring access to IDPs (IDMC, 2014). Lastly, foreign donors have been reluctant to contribute to the financing effort of migration policies, given the size and growth of the phenomenon but also the corruption characterising Nigeria. As a result, foreign financial contributions targeting the displacement crisis remain low (IDMC, 2014).
SEM 2015 40
Figure 6. Displacement crisis in Northeastern Nigeria according to the IOM methodology
Source: International Organization for Migration, 2015
Figure 7. Conceptual framework describing the environment-migration-conflict nexus
CLIMATE CHANGE
IMPACTS
(temporite, rainfall, drought flood, sea-level rise)
Threat multiplier
NON CLIMATE FACTORS Economic Social Politacal Demographic pressure Land degradation
Vulnerability Food Security Water security Health issues
Natural resource availability
Possible responses/outcomes Migration Ressource competition Political destabilization Conflict
Source: United Nations Environment Programme, 2011
SEM 2015 41
AFRICA
CLÉMENT MÉTIVIER VIOLENCE AND DISPLACEMENT IN NORTHERN NIGERIA
3.2. Underlying problems hampering the efficiency of migration policies
Local, national and international responses to migration movements within Nigeria have generally proved insufficient and inadequate for several reasons. Assistance has tended to be based on short-term perspectives, and has not targeted the medium to long-term reconstruction of livelihoods among impacted populations, which is nevertheless a necessary step to consider (IDMC, 2012). Both the international community and the Nigerian authorities have focused almost exclusively on northeastern Nigeria, with an emphasis on emergency response. Such a short-term approach has prevented a precise understanding of the root causes of displacement, which is a necessary step in order to design and implement durable solutions for IDPs (IDMC, 2014). In addition, the Nigerian government has focused its responses on disaster management mechanisms, which do not address all aspects of the issue of recent displacements in northern Nigeria. Many tools implemented by the government target migrants living in camps, but that response is inadequate, given that the vast majority of IDPs live in host communities (IDMC, 2012). Migration policies are also affected by the militarisation of the crisis, given that government counterinsurgency operations have led to further instability and displacement in the northeastern part of Nigeria (IDMC, 2014). General government policies have reinforced the vulnerability of migrants and aggravated tensions, especially with the principle of “indigenisation”, which discriminates against those unable to prove their ties to the original populations of a given area. Those “non-indigenes”, who are likely to be migrants, are excluded from already limited resources, such as land, education, public sector jobs, and participation in political affairs (IDMC, 2014).
3.3. A situation of humanitarian emergency that is worsening
The northeastern region of Nigeria, which hosts the largest number of IDPs, is in desperate need of additional support given the dire humanitarian situation. NEMA has recently stated that 3 million Nigerians are affected by serious humanitarian problems (MacGroarty & Akingbule, 2014) . These problems are multidimensional, with several overlapping crises: –– Food crisis: food security is a crucial concern for migrants. Given that federal and state authorities have restricted access to roads and have implemented many security measures, rural transport and markets have been disrupted, which has exacerbated food insecurity (IDMC, 2014). In some areas of northern Nigeria, there has been no harvest and no planting for the past 3 years (Alfred, 2015). Cases of malnutrition have increased in zones affected by displacement (IDMC, 2014). Without substantial humanitarian support, it is believed that up to 3 million people will have to cope with food insecurity in Nigeria in July 2015 (Assessment Capacities Project, 2015) –– Disease outbreaks: diseases have proliferated in areas where IDPs are concentrated. Cholera cases among migrants and host populations in northeastern Nigeria reached 26,000 cases and led to more than 400 deaths between January and July 2014, which can be compared to less than 200 cases over the same period of time the previous year (IDMC, 2014). In addition, most healthcare facilities located in the northeastern region were closed in mid-2014, because of the ongoing conflict (IDMC, 2014) –– Education crisis: displaced children are often unable to pursue their education, especially since many schools throughout the north of Nigeria are used as shelters for IDPs, and also because schools are a favoured target for Boko Haram. Many schools have been shut down (around 100 schools in Taraba state, for example), and those schools that remain open are quite empty, since many children do not go to school any more, for fear of attacks and abductions (IDMC, 2014) –– Housing crisis: displaced populations often stay with family, friends, or people they pay. But some IDPs seek shelter in camp-like places such as stadiums, schools,
SEM 2015 42
mosques, churches and university campuses. Makeshift camps are quickly overcrowded and become inadequate. In some extreme cases, migrants with no access to safe shelter have to take refuge outside, in the bush (IDMC, 2014). In other situations, Nigerian soldiers have expelled migrants from public buildings and used the facilities for military purposes (IDMC, 2014). At the same time, the homes of displaced populations are at risk of being damaged, occupied by other people, or destroyed (IDMC, 2014) –– Safety issues: displaced populations mostly consist of women and children, who are the most vulnerable groups. Their physical safety is endangered on a daily basis, with risks of various types of violence, including sexual violence. A significant number of women, and even girls, have been forced to resort to prostitution to meet their basic needs (IDMC, 2014) –– Assistance crisis: given that the majority of migrants are hosted by relatives, those migrants do not receive humanitarian assistance. Therefore, their resources and those of the host communities have to be shared, which makes both the IDPs and their hosts more vulnerable (IDMC, 2012). Migrants are highly exposed to further shocks. They often have to sell their belongings, reduce their food intake, and accumulate debts in order to survive (Assessment Capacities Project, 2015). They cannot rely on their past livelihoods, because migration implies a loss of farmland, livestock and tools (IDMC, 2014). As a result, IDPs and their host communities are sometimes forced into further displacement, because of sustained violence and a lack of basic resources. Community resources tend to deplete over time, and coping strategies are adversely impacted with each displacement cycle (IDMC, 2014). The current humanitarian crisis in northern Nigeria is multidimensional and extremely serious. Local, national, and international institutions have thus far been unable to resolve the problems faced by IDPs, and have established ineffective policies that do not target the root causes of the crisis. In order to better understand how and why violence erupted in 2014, followed by associated migration movements, it is necessary to examine the crucial but underestimated impact of environmental factors in this complex process.
4. EXPLAINING THE 2014 CRISIS USING THE ENVIRONMENTMIGRATION-CONFLICT NEXUS The environment-migration-conflict nexus is highly relevant in order to analyze the contemporary dynamics characterising West Africa (Werz & Conley, 2012). Climate change, migration and security are three issues that intersect in northern Nigeria, and the next section will reveal how the recent migration movements have to be considered in light of the links between these three phenomena.
4.1. A theoretical approach that has garnered attention
The root causes of population displacement are complex, multi-faceted, and often overlapping (IDMC, 2014). Researchers have been working on the connection between migration, conflict and climate change for years (Conroy, 2014), and there is growing evidence that these three phenomena are interrelated (Werz & Conley, 2012). Climate change and environmental factors have been increasingly taken into account when analysing wars and population displacement. It is now widely recognised that environmental factors play a significant role in conflicts and migration, along with social, cultural, economic and political parameters (Conroy, 2014). Of course, climate change and environmental factors do not act as a single and isolated cause of conflicts and migration movements, and causal relationships cannot be highlighted with certainty between these three processes (United Nations Environment
SEM 2015 43
AFRICA
CLÉMENT MÉTIVIER VIOLENCE AND DISPLACEMENT IN NORTHERN NIGERIA
Programme, 2011). However, the connections between these issues suggest that the approach of analysing and addressing them as separate topics is no longer relevant (Werz & Conley, 2012). Furthermore, climate change, conflict and migration are embedded in a web of factors with environmental, economic, social and political dimensions (See Annex 7). In 2015, the importance of climate change impacts on other domains goes well beyond the academic sphere. The U.S. administration itself has called climate change a “threat multiplier” (USDOD, 2014) with broad impacts on security and global affairs. In 2010, the Nigerian government labelled climate change as the “greatest environmental and humanitarian challenge facing the country” for the 21st century (Werz & Conley, 2012).
4.2. An agricultural sector at risk of collapse
Nigeria’s agricultural sector is concentrated in the north of the country, and accounts for a significant share of national GDP, estimated between 20 and 40% (Caulderwood, 2014, Werz & Conley, 2012). At the national level, agriculture employs around 70% of the workforce (Kimenyi & al, 2014). In northern Nigeria, the figure rises to 80% (MacCauley, 2014). The vast majority of this area consists of rural communities involved in pastoral farming, crop production and nomadic pastoralism, who are thus highly dependent on the use of the land (MacCauley, 2014). Today, Nigeria’s agriculture is seriously endangered by a combination of factors: firstly, climate change and environmental hazards such as desertification, soil degradation and low rainfall have a direct impact on natural resources, and threaten the livelihoods of all Nigerians using those resources in the agricultural sector. It appears that climate change intensifies the risks posed by environmental hazards, which gives rise to major employment and food security concerns (Mohammed, 2015). Climate change does not have a uniform impact on local populations, and tends to have a more pronounced influence on groups who are already highly dependent on resources, and who are economically and socially marginalised (Conroy, 2014). Climate change does not only affect natural resources, but also threatens infrastructure, such as water supply (Conroy, 2014). Secondly, environmental risks facing the agricultural sector have been exacerbated by the negative impacts of Boko Haram’s activity in northern Nigeria (Alfred, 2015). The whole agricultural value chain is under the threat of attacks by insurgents (Caulderwood, 2014). As a result, many people have been pushed outside of the conflict zone, therefore reducing agricultural labour availability (Kimenyi & al, 2014); it is harder to find people ready to work in the fields due to the fear of attacks, leading to improperly timed harvesting (Kimenyi & al, 2014). Insurgents have destroyed the production of some farmers, attacked livestock markets, and seized food supplies and livestock (Alfred, 2015). Widespread insecurity has led to the shutting of many farms and markets. Suppliers of pharmaceuticals for animals have closed their operations in the northeast (Kimenyi & al, 2014), and transportation costs have also significantly increased. As a result, the combination of environmental and security factors led to huge increases in food prices in 2014 (Caulderwood, 2014). When comparing current price levels to the levels at the end of the 2000s (just before Boko Haram started to carry out large scale attacks on civilians), a 45 to 130% difference can be observed (Kimenyi & al, 2014). Yields have also suffered, and in 2014, many areas were undercultivated or not harvested at all (Assessment Capacities Project, 2015). Poverty and unemployment have risen, which is quite worrying, given that those two factors have been associated with higher recruitment opportunities for radical movements such as Boko Haram (Higazi & Brisset-Foucault, 2013). In addition, demographic factors reinforce the pressure on both the agricultural sector and the environment. The median age in the country is only 19, and Nigeria’s population will probably double by 2040 (Werz & Conley, 2012). Food security is thus gravely threatened, with a population growing at a rate of 3% per year, while food production has so far increased at a rate around 1.5% (Mohammed, 2015).
SEM 2015 44
4.3. Rising migratory pressure: the role of environmental factors
In 2014, the eruption of violence in northern Nigeria caused massive population displacement. Displacement appears to be a result of widespread insecurity, yet the environmental dimension of the phenomenon must be taken into account. It is possible to argue that the conflict has precipitated migration movements, which were also triggered by environmental factors, and would have probably occurred even without the influence of Boko Haram’s activities. In northern Nigeria, decisions to migrate are often linked to visible economic and social elements such as poverty and unemployment. However, when examining the root causes of migration, environmental factors are often present in the decision to migrate (Afifi, 2011). Environmental factors play a role in the decision to migrate, since environmental degradation threatens the livelihoods of people relying on natural resources in their everyday life, such as cattle herders and farmers, who form the majority of people living in northern Nigeria (Afifi, 2011). Desertification, deforestation, and unfavourable weather patterns lead to soil depletion, crop failure and the death of animals, which in turn cause impoverishment and then displacement (Ibimilua & Ibimilua, 2014). In northeastern Nigeria, herdsmen have been forced to move further south in order to graze their cattle (Conroy, 2014). Many poor farmers and pastoralists respond to diminishing land fertility by moving to another piece of land for grazing and cultivation, and by expanding the surface of land they use (MacCauley, 2014). Many herders and farmers have also been driven into cities (Werz & Conley, 2012). This urbanisation process is highly challenging, because peri-urban areas tend to expand into traditional agricultural zones, with the process of urban sprawling (Conroy, 2014). The arrival of people in cities puts more pressure on urban centres, and especially on the social services that the authorities are supposed to provide (Conroy, 2014). Farmers are crucial for Nigeria’s stability, thus the migration of farmers poses a significant risk for the national food supply (MacGroarty & Akingbule, 2014). NEMA underlined in 2012 that the displacements of thousands of farmers could lead to a massive food crisis (IDMC, 2012). Of course, migration is only one response for people whose living conditions are threatened by climate change, and environmental dimensions are unlikely to constitute the only “push factor” that encourages the decision to migrate (Conroy, 2014). However, environmental issues represent a key factor in that decision.
4.4. Growing tensions over increasingly scarce resources
The connection between environmental issues, migration and conflict is deeply related to a process of increased competition over resources (Conroy, 2014). As has been underlined above, climate change and natural hazards reinforce existing vulnerabilities, lead to greater water and food insecurity, and modify the availability of natural resources. These impacts increase migratory pressure, but they also give rise to greater competition for resources, growing tensions, and levels of conflict (United Nations Environment Programme, 2011). It has been shown that in Sub-Saharan Africa, a proportional modification of 5% in rainfall compared to the previous year increased the likelihood of conflict the following year by 50% (Kimenyi & al, 2014). Climate change and environmental risks intensify resource scarcity for everyone, and deplete natural capital (Conroy, 2014). In northern Nigeria, more and more people are seeking access to land and natural resources (Olufemi & Samson, 2012). In that perspective, it is especially relevant to focus on the pastoralist-farmer tensions in northern Nigeria: herders migrate to the south, and some of them are even adopting a sedentary lifestyle, resulting in competition between herders andlocal farmers for local resources and farmlands, which result in violent conflicts (United Nations Environment Programme, 2011). Because of changing weather patterns, cattle are now migrating not only during the dry season, but also throughout the whole year. Farmers accuse herdsmen of trampling recently planted seeds, preventing them from germinating,
SEM 2015 45
AFRICA
CLÉMENT MÉTIVIER VIOLENCE AND DISPLACEMENT IN NORTHERN NIGERIA
causing significant losses (Conroy, 2014). At the same time, pastoralists lack access to grazing lands, especially because farms are getting bigger and grazing routes are not protected (Conroy, 2014). As a result, land degradation and land expansion are leading to conflicts between farmers and pastoralists in northern Nigeria, who are fighting for the same pool of resources: pasture, land, livestock routes, cropresidue, and water points (MacCauley, 2014). Fair resource management is more and more difficult, and land use is becoming a highly disputed space. Migration driven by environmental and security issues is exacerbating tensions in northern Nigeria (Werz & Conley, 2012). Large-scale movements of people fuelled by resource scarcity, population growth, and socioeconomic inequalities are likely to increase the risk of violence in host communities and in cities (Conroy, 2014). Increased displacement movements have been recognised as triggers for ethnoreligious violence among communities (Werz & Conley, 2012). And it is extremely interesting to highlight that some of those communities are proving susceptible to the arguments put forward by Boko Haram (Werz & Conley, 2012). This is an important point, as it shows that in northern Nigeria conflicts are often misrepresented as religious or ethnic clashes, whereas their root causes are related to struggles over the control of land and to the tensions created by population displacement (Conroy, 2014). When addressing the issue of the 2014 migration movements in northern Nigeria, land is a parameter that cannot be underestimated. Using the environment-migration-conflict nexus to analyse the 2014 migration movements in northern Nigeria is very instructive, since it reveals certain key elements that would not otherwise be obvious, especially regarding the role played by environmental factors. Climate change and natural risks have a visible and direct impact on the agricultural sector and on the livelihoods of the majority of the population. However, their influence on stability and security is more distant, even though it exists (Conroy, 2014). In northern Nigeria, environmental issues exacerbate violence and cause migration movements, underlining the fact that natural factors have massive consequences in terms of security, and have to be taken into account when addressing violence and migration in northern Nigeria in 2014.
5. IMPROVING THE SITUATION IN NORTHERN NIGERIA: CHALLENGES AND RECOMMENDATIONS FOR POLICYMAKERS The number of migrants in northern Nigeria continued to increase in 2015 (IOM, 2015). In the same year it was also estimated that 9 million people were affected by violence, with 3 million in urgent need of humanitarian assistance (Assessment Capacities Project, 2015). The adverse effects of climate change became more pronounced, and environmental degradation worsened. At the same time, Boko Haram does not seem to be collapsing, and continues to carry out deadly attacks in the region. With an increasing population, massive urbanisation, growing climate change impacts, and the persistence of violence and migration, the Nigerian government will be called upon to provide more social services, despite its limited capabilities (Werz & Conley, 2012). As a result, improving the humanitarian situation in northern Nigeria represents a daunting task for the Nigerian authorities. In this perspective, a few suggestions could be considered: –– Given the gravity of the humanitarian crisis, basic services have to be provided in northern Nigeria as soon as possible: food, water, healthcare, and education. Education is necessary, especially given that children and young adults who are not educated are more likely to be recruited by violent groups (Assessment Capacities Project, 2015). Education is also key in terms of raising awareness about environmental issues (Afifi, 2011)
SEM 2015 46
–– Displacement has to be addressed in a more holistic manner, which targets among other aspects host communities (IOM, 2015). Supporting host communities could be especially helpful in preventing further displacement, and reducing the possibility of conflict between migrants and host populations. Improved data collection is crucial in order to better understand displacement patterns and to design appropriate policy responses (IOM, 2015). More durable approaches that do not solely focus on the short term are necessary in order to promote the sustainable reintegration of displaced groups. Moreover, more dialogue has to take place with neighbouring countries at the regional level, given that displacement movements in northern Nigeria cross national borders (United Nations Environment Programme, 2011). Lastly, the potential positive role of migration must be recognised, especially as a climate change adaptation strategy. –– The socioeconomic development of the north should become an absolute priority for the newly elected Nigerian government. Alleviating poverty, providing jobs, and building infrastructure is essential. There is a sizeable opportunity for the government in northern Nigeria to implement green growth programmes (United Nations Environment Programme, 2011). Green growth implies a comprehensive framework, where economic growth, the reduction of socioeconomic inequalities, human well-being, and the protection of the environment are reconciled. In this perspective, climate change adaptation can be used as a programme to favour socioeconomic development –– Climate change adaptation should not only be a policy priority, but should also be translated into concrete programmes and projects. Disaster risk reduction programmes must be implemented, given the extent to which disaster preparedness is lacking in Nigeria (Werz & Conley, 2012). The Nigerian Ministry of Environment has, for example, promoted the Great Green Wall project, an initiative proposed by the African Union, aiming to limit desertification through the planting of 1,500 kilometres of vegetation in the Sahel region (Conroy, 2014). The project seems promising, however only a fraction of the funds pledged have been delivered thus far (IDMC, 2014). Climate change adaptation strategies have to be conflict and migration-sensitive, which means that adaptation programs have to mitigate the drivers of conflict and migration (United Nations Environment Programme, 2011) –– Climate change adaptation, migration policies, and conflict management programmes require increased funding. At the national level, better redistribution of oil revenues is necessary, with a reduction of corruption in order to free up additional funding. At the international level, Nigeria could appeal to financing mechanisms such as the Green Climate Fund, which is supposed to be endowed with $100 billion per year starting in 2020, in order to finance climate change adaptation in developing countries, among other elements.
SEM 2015 47
AFRICA
CLÉMENT MÉTIVIER VIOLENCE AND DISPLACEMENT IN NORTHERN NIGERIA
REFERENCES –– Diamond, Jared. 2011. Collapse: How
–– United Nations Development
–– Mohammed, Ngozi Thelma. 2015.
Societies Choose to Fail or Succeed.
Programme. 2009. Human
Desertification in northern Nigeria:
Penguin Books, Revised Edition.
Development Report Nigeria 2008-
Causes and implications for national
London.
2009: Achieving growth with equity.
food security. Peak Journal of Social
REPORTS –– Assessment Capacities Project. 2015. Nigeria: Boko Haram Insurgency. ACAPS Briefing Note. Geneva. –– Conroy, Stone. 2014. Land conflicts and Lethal Violence in Nigeria: Patterns, Mapping and Evolution (2006 – 2014). IFRA-Nigeria Working Papers Series 38. –– Etuonovbe, Angela Kesiena. 2011. The Devastating Effect of Flooding in Nigeria. FIG Working Week 2011. Marrakech. –– Ferris, Elizabeth & Stark, Chareen. 2012. Internal Displacement in West Africa: A Snapshot. Brookings-LSE Project on Internal Displacement. Washington, DC. –– Gemenne, François, Brücker, Pauline & Ionesco, Dina. 2014. The State of Environmental Migration 2014 – A Review of 2013. International Organization for Migration. Geneva. –– Internal Displacement Monitoring Centre. 2014. Multiple displacement crises overshadowed by Boko Haram. Geneva. –– Internal Displacement Monitoring Centre. 2012. NIGERIA: Increasing violence continues to cause internal displacement. Geneva. –– International Organization for Migration. 2014. IOM Outlook on Migration, Environment and Climate Change. Geneva. –– Kimenyi, Mwangi & al. 2014. “The
New York. –– United States Department of Defense. 2014. Climate Change
Adejobi. 2012. Climate Change,
Adaptation Roadmap. Washington
Environment and Conflicts in Nigeria.
DC.
British Journal of Arts and Social Sciences
–– Werz, Michael & Conley, Laura. 2012. Climate Change, Migration, and Conflict – Addressing complex crisis scenarios in the 21st century. Center for American Progress. Washington DC. –– Werz, Michael & Conley, Laura. 2012. Climate Change, Migration, and Conflict in Northwest Africa – Rising Dangers and Policy Options Across the Arc of Tension. Center for American Progress. Washington, DC. SCHOLARLY ARTICLES –– Adibe, Jideofor. 2014. “Explaining
–– Alfred, Charlotte. 2015. “How Boko Haram Has Left Northeast Nigeria In Ruins.” In The Huffington Post. New York. –– BBC News. 2012. “Nigerians living in poverty rise to nearly 61%.” London –– Caulderwood, Kathleen. 2014. “Boko Haram And Nigeria’s Economy: Why The Poorest Suffer Most.” In International Business Times. New York –– Integrated Regional Information Boko Haram violence await aid.”
Washington, DC. –– Afifi, Tamer. 2011. Economic or
Nairobi. –– International Organization for
Environmental Migration? The
Migration. 2015. “Boko Haram May
Push Factors in Niger. International
Have Displaced Over a Million in
Migration 49 (S1): 95-124
Nigeria: IOM.” Geneva.
–– Higazi, Adam & Brisset-Foucault,
–– International Organization for
Florence. 2013. Les origines et la
Migration. 2015 “IOM Highlights Need
transformation de l’insurrection
for Regional Response to Boko Haram
de Boko Haram dans le Nord du
Displacement”. Geneva
Nigeria. Politique Africaine. 130 (S2): 137-164 –– Ibimilua, Fokeye Omoboye &
–– MacGroarty, Patrick & Akingbule, Gbenga. 2014. “Hundreds of Thousands of Nigerians Flee Boko
Ibimilua, Adewale Festus. 2014.
Haram, Seek Sanctuary.” In The Wall
Environmental Challenges
Street Journal. New York.
in Nigeria: Typology, Spatial Distribution, Repercussions and Journal of Social Science 3 (S2): 246-253 –– MacCauley, Babajide. 2014. Land degradation in Northern Nigeria: The impacts and implications of
Programme. 2011. Livelihood Security
human-related and climatic factors.
– Climate Change, Migration and
African Journal of Environmental
Conflict in the Sahel. Geneva.
Science and Technology 8 (S5): 267-273
SEM 2015 48
RELEASES
Networks. 2012. “Migrants fleeing
instability on agricultural investments
–– United Nations Environment
PRESS ARTICLES AND PRESS
In Africa in Focus, Brookings.
Way Forward. American International
Growth Initiative Working Paper 17.
6 (S1): 11-20
the Emergence of Boko Haram”.
impact of conflict and political in Mali and Nigeria.” Brookings, Africa
Sciences and Humanities 3 (S2): 22-31 –– Olufemi, Fatile Jacob & Samson,
–– Pandey, Avaneesh. 2015. “Syrian Drought, Triggered By Man-Made Climate Change, Spurred Civil War : Study”. In International Business Times. New York
AsiaPacific
PIERRE WALTER
Floods and Rural-Urban Migration in Bangladesh
I
n Bangladesh, about 3.5 million people were affected by major floods in August and September 2014, among whom more than 325,000 people were displaced (IFRC 2014). The country is highly vulnerable to natural hazards of all types – cyclones, tornadoes, storm surges, droughts, floods, earthquakes, riverbank erosion, and landslides. Floods are the most common natural hazard affecting Bangladesh, with about 20 million people present in zones subject to flooding (Gemenne et al. 2011, p.59). Indeed, the majority of Bangladesh is made up of low-lying floodplains, and the country is crossed by more than 230 waterways which bring water from the Himalayas in the north to the Bay of Bengal in the south. Natural hazards and extreme climatic events are becoming more and more frequent as a result of climate change, making Bangladesh an “impact hotspot” (IDMC 2015). For instance sea-level rise, caused by global warming, is already threatening major urban areas, infrastructure, livelihoods, food production and access to drinking water (PIK 2013). Combined with the country’s political and socio-economic challenges, this high exposure to natural disasters makes Bangladesh particularly vulnerable to the long-term effects of climate change, including migration (IDMC 2015). As this study will examine, environmental factors – natural disasters and slow onset events – are a major cause of migration from rural to urban areas, which can be qualified as a coping strategy in a context of high economic hardship in rural Bangladesh. When taking into account climate change and the growing urban economy in the country, continued rural-urban migration – both temporary and permanent – seems inevitable (Walsham 2010, p.20). Today, Bangladesh has one of the highest rates of urbanization and rural-urban migration is the most important factor behind it (Uddin and Firoj 2013, p. 90). Massive migration to urban areas leads to rapid and unplanned urbanization in cities such as the capital Dhaka, and has emerged as an important subject of concern because of its negative economic, social, environmental and human health impacts. This paper aims to analyse the phenomenon of rural-urban migration in Bangladesh, using the 2014 floods as a case study. The objective is first to describe the floods that occurred in August and September 2014 in the country, and to examine their consequences, notably in terms of rural-urban migration. The paper will subsequently evaluate the features of rural-urban migration in Bangladesh, the impacts it triggers and the policies that could be implemented to cope with this phenomenon.
1. THE AUGUST-SEPTEMBER 2014 FLOODS IN BANGLADESH 1.1. A brief overview of floods in Bangladesh
On average, at least one fifth of Bangladesh’s territory is flooded every year, and this proportion may increase to almost three quarters in the event of catastrophic floods (Agarwala et al. 2003) (table 1). Flooding is the result of a complex series of factors, the two most important of which are the increased inflow of water from upstream catchment areas caused by heavy monsoon rainfall, and the low floodplain gradient. In addition, the congestion of drainage channels, tides and storm surges in coastal
SEM 2015 51
PIERRE WALTER FLOODS AND RURAL-URBAN MIGRATION IN BANGLADESH
ASIA-PACIFIC
areas, and polders – land reclaimed from a body of water, such as a lake or the seabed – increase the intensity of floods outside protected areas. Different combinations of these factors give rise to different types of flooding (Ahmed and Mirza, 2000). Table 1. Major floods in Bangladesh and their impacts (1974-2014) Area inundated (square kilometers)
Proportion of total area (%)
Cost of damage (million Taka)
Population affected (million persons)
Deaths (number of persons)
1974
52,720
35
28,490
30
1,987
1984
28,314
19
4,500
20
553
1987
57,491
38
35,000
30
1,657
1988
89,970
62
> 100,000
47
2,379
1998
> 100,000
74
> 120,000
55
1,050
2004
> 58,000
40
> 200,000
36
750
2007
32,000
21
> 75,000
14
649
Sources: Choudhury et al. 2003; Government of Bangladesh 2008; Dewan 2015.
Flooding usually begins in flashy rivers – rivers which respond “very quickly to rainfall, the flow of water rising rapidly to a high peak before receding similarly” (Scottish Natural Heritage 2015) – in the hilly areas during the pre-monsoon months of April and May. Called “flash floods”, they may occur several times a year and are caused by waters from the hilly upstream rushing to the plains with high velocity. These flash floods are sudden and last only from a few hours to a few days. On a slightly longer time scale, when local rainwater is increasingly accumulated on the land by the rising water levels in adjoining rivers, so-called “rainwater floods” may occur. They typically occur between June and August, and vary from year to year depending on the water levels in the rivers that control drainage from the land. For instance, the major flood in 1987 in northwest Bangladesh was mainly caused by excessive rainfall occurring throughout the monsoon season, and was aggravated at times by flash floods passing down the Teesta River as well as other rivers entering Bangladesh from the northwest (Ahmed, A.U. 2006). According to projections, climate change is very likely to increase the level of rainfall during the monsoon season (IPCC 2014). Such an increase will undoubtedly lead to more frequent and more severe flooding (Ahmed, A.U. 2006). In addition, more frequent flooding will aggravate already existing drainage problems, including the diminution of river gradients over time, as more and more sediments are brought down and accumulate. Consequently, the conveyance capacity of these rivers will diminish significantly, this in turn increasing the frequency and duration of flooding. According to Ahmed (2006, p.23), “[t]he ‘best-estimate’ scenario for the year 2030 is that monsoon rainfall could increase by 10 to 15 per cent. For the scenario year 2075 the average rainfall in monsoon will increase by about 27 per cent with respect to the base year. In the coastal areas there will be stronger-than-usual backwater effect due to sea level rise induced high oceanic stage, resulting into retardation of discharge flow, particularly along the confluence points of the major rivers. As a consequence, the risk of riverine and rainfall-induced high intensity floods with prolonged duration, as in the case of flood 1998, will increase significantly”.
SEM 2015 52
Map 1. North western part of Bangladesh on August 29, 2014
Source: http://earthobservatory.nasa.gov/IOTD/view.php?id=84299
Map 2. North western part of Bangladesh on September 8, 2012
Source: http://earthobservatory.nasa.gov/IOTD/view.php?id=84299
SEM 2015 53
ASIA-PACIFIC
PIERRE WALTER FLOODS AND RURAL-URBAN MIGRATION IN BANGLADESH
1.2. Description of the August-September 2014 floods
From the middle of August 2014, a combination of the arrival of meltwater from the Himalayas and heavy monsoon rainfall in the country’s main river basins triggered severe flooding in north-western Bangladesh. The districts of Lalmonirhat, Kurigram, Nilphamari, Rangpur, Gaibandha, Bogra, Sirajganj, Jamalpur, and Sherpur were affected. This was followed some days later by another episode of heavy rain, which provoked flooding in the districts of Sunamganj, Sylhet and Netrokona in the northeast of the country, and later in districts in the centre of the country (Munshiganj, Tangail, Faridpur, Manikganj, Rajbari). The Moderate Resolution Imaging Spectroradiometer (MODIS) of NASA’s Terra satellite captured map 1 on 29 August. It shows flooding along the Brahmaputra River and Tanquar Haor, a large wetland region in the north-western part of the country. For comparison, map 2 shows the same area on 8 September 2012, a more typical year (NASA 2014). Between 19 September and the end of the month additional flooding hit several districts in the country, affecting 400,000 more people and increasing the plight of the people already affected by floods in August (IFRC 2014) (map 3). Map 3. Areas affected by the August-September 2014 floods
Source: http://reliefweb.int/sites/reliefweb.int/files/resources/MDRBD014OU1.pdf
1.3. Policy response
In Bangladesh, managing such natural disasters is the responsibility of the Ministry of Disaster Management and Relief. Within the Ministry, the Department for Disaster Management (DDM) has a policy and advisory role. When the government declares an emergency, the Local Consultative Group Mechanism (LCG) is one of the key the structures through which the government engages in dialogue with development partners, which are able to provide a humanitarian response (The JNA Consolidation Project 2014). In addition to the LCG Plenary, there are eighteen thematic LCG Working Groups, including the Disaster and Emergency Relief (DER). The DER, which is co-chaired by the UN Resident Coordinator and the Ministry of Disaster Management, is mandated to ensure the effective coordination of national and international stakeholders around all aspects of the disaster management process. DER membership consists of senior decision makers from UN agencies, donors, and NGO representatives. Within the DER, the Humanitarian Coordination Task Team (HCTT) is a working group that provides an operational level forum for coordinated disaster preparedness, response, and recovery across sectors. Clusters have been constituted, with government approval, to address disaster preparedness. They bring together international organisations, NGOs, and donor organisations. There are currently eight different clusters, which are coordinated
SEM 2015 54
by the HCTT: WASH (Water Sanitation and Hygiene), food security, early recovery, health, nutrition, education, logistics, and shelter. Graph 1: Disaster management coordination in Bangladesh
Disaster Coordination Bangladesh
Links to Gob Bodies: NDMC, IMDMCC, NDRC, LGIs
LCGs plenary
STRATEGIC / DEVELOPMENT DER
Ag. & Food
HCTT HCTT composition - Co-Chairs - DDM and RCD - 7 Cluster leads - 3 INGO representatives - 1 NGO representatives - 2 Donor representative
Food Security Logistics
Education
Health
WATSAN
Poverty
Nutrition Health
WASH
Early Recovery
Education Sheiter HUMANITARIAN WORK
Source: The JNA Consolidation Project 2014
In response to the August-September 2014 floods, the HCTT conducted a Joint Needs Assessment (JNA) in the nine districts that were the most affected (Kurigram, Sirajgonj, Gaibandha, Jamalpur, Bogra, Lalmonirhat, Rangpur, Sherpur and Nilphamari). This JNA consisted of an initial assessment of the number of people affected and the relative accessibility of water, food, sanitation, education, markets and health facilities. It mobilised 183 staff from 28 organisations, who visited about 300 locations in four days (from 25-28 August). Assessment teams in the field transmitted data to the team in Dhaka, which established a 50-page report by 8 September. This report established the scale of the disaster, the number of people affected and the worst affected areas, as well as their immediate and ongoing needs. Due to its time frame, many limitations could be found in this report, which were highlighted in the document itself: “While it does provide an overall quantitative picture of the disaster and the key priorities as identified by Union officials, it does not give voice to affected communities” (p.5). Following the release of the JNA, a coordinated emergency response plan was implemented by the UN and the different clusters, in support of the Government of Bangladesh’s relief operations. Responding agencies reached approximately 75,000 households with emergency cash and food assistance, in addition to the 4,650 metric tonnes of food and over 10 million Taka of assistance provided by the Government in the five worst affected districts (Bogra, Gaibandah, Jamalpur, Kurigram and Sirajgonj).
1.4. Impacts
According to Government reports and the IFRC, in total about 3.5 million people were affected by the August-September floods across the country, of whom more than 325,000 people were displaced (IFRC 2014). A total of 56 people were reported dead and more than 100 people injured. About 34,000 homes were destroyed and approximately 200,000 damaged. The climatic situation was returned to normal at the beginning of October, but it has been described as “the worst flooding since the ‘mega floods’ in 2007”, when more than 10 million people were affected (IRFC 2014). The socio-economic impacts of these floods were significant, particularly because they struck poor and rural regions of the north-western and central-northern parts of the country. Populations in these areas are especially vulnerable to the effects
SEM 2015 55
PIERRE WALTER FLOODS AND RURAL-URBAN MIGRATION IN BANGLADESH
ASIA-PACIFIC
of infrastructure destruction and crop losses, and will therefore take longer to recover. The floods caused widespread damage to croplands and destroyed much of the in-ground rice harvest in the five most affected districts (Bogra, Gaibandah, Jamalpur, Kurigram and Sirajgonj). The Government has estimated that over 86,000 ha of cropland and seedbed were been damaged across the five districts (Bangladesh Food Security Cluster 2015), with significant implications for the concerned districts’ food security. These impacts were aggravated by the fact that the same regions were hit by floods during both the 2012 and 2013 cropping seasons, and by the relatively high domestic rice prices that have limited access to food for the poorest people (FAO 2014). In addition, the decline in agricultural production has caused a drop in agricultural employment opportunities and wages (Bangladesh Food Security Cluster 2015). The combination of declining wages and lack of employment meant that for several months the average monthly income was below the average monthly food expenditure. Many households decided to take out loans in order to cope with the situation, therefore increasing their debt; for instance, in Bogra district, average loans reached almost 8000 Taka (ibid). Indebted households are even more vulnerable since their capacity to invest in livelihood recovery or to cope with unforeseen shocks is significantly reduced. According to a survey conducted in the districts of Bogra, Gaibandah, Jamalpur, Kurigram and Sirajgonj, other coping strategies consisted of livelihood change, support from relatives, selling of advanced labour or of households assets, and recourse to savings (ibid). Migration (to both surrounding areas and further afield) was only cited as a coping strategy by 4 per cent of households (table 2). However, according to the report, “men were increasingly migrating to seek employment opportunities elsewhere”. Also, it is possible that the combination of debt levels and sustained economic hardship will cause more migration, particularly rural-urban migration, as demonstrated by previous cases (see section 2.1). Table 2: Coping strategies adopted by 324 households surveyed in affected areas # of Household
Percent
Taking loan at high interest
85
26
Livelihood change
70
21,5
Support from relatives
48
15
Selling of advance labour
41
12,5
Spending savings
26
8
Selling houssehorld assets
16
5
Migrated to surrounding areas
9
3
Reminttance from relatives
7
2
Making children work
5
2
Selling productive assets
4
1
Migration
4
1
Making other members work
3
1
Tempory work
3
1
Other
3
1
Total
324
100
Source: Adapted from Bangladesh Food Security Cluster 2015, .
SEM 2015 56
2. CONTEXTUALIZATION: RURAL-URBAN MIGRATION IN BANGLADESH In Bangladesh, current urban population growth rate is around 4 per cent per year (World Bank 2015). Major urban areas have experienced a tremendous increase in size and population since the 1970s: in 1974, 1.6 million people were living in urban areas, rising to 22.3 million in 1991, 32.5 million in 2001, and 47.7 million in 2011. Today, more than 53 million people live in urban areas, representing about 34% of the total population (World Bank 2015) (graph 2). Graph 2: Evolution of urban and rural populations in Bangladesh (1985-2014) (% of total population) 100 80 60 40 20 0 1985
1991
1997 Urban population ( % of total)
2003
2009
2015
Rural population ( % of total)
Source: Author, using data from the World Bank (2015)
The capital and largest city, Dhaka, is home to almost 15 million people and is one of the most densely populated cities in the world (Zaman et al. 2010), with a density of about 20,000 inhabitants per square meter. Rapid urbanisation in Bangladesh is seemingly inevitable, notably due to the extremely unfavourable land-population balance in the country. Thus, “[t]he question is not whether Bangladesh should urbanize; the question is how Bangladesh will handle the challenges of urbanization” (Hussain 2013). While in the majority of the world’s countries the growth of the urban population is mostly due to natural population increase (the net excess of births over deaths) (Tacoli 2009), in Bangladesh the combined re-classification of settlements from rural to urban and rural-urban migration plays a major role (Alam and Rabbani 2007; Uddin and Firoj 2013). It has been estimated that rural-urban migration accounts for about two-thirds of total urban growth (Bhuyan et al. 2001; Hermman and Svarin 2013), and that since the end of the 1990s Dhaka has received between 300,000 and 400,000 rural migrants annually (Bangladesh Bureau of Statistics 2001; Friedman 2009). As such, it is necessary to analyse and to understand the patterns of and the reasons behind rural-urban migration, the key driver of urbanisation in the country.
2.1. Factors: Why do people migrate from rural areas to urban centres?
Rural areas in Bangladesh, where agriculture is the dominant sector, are characterized by an increasing lack of economic opportunities. As stated by Zaman et al. (2010, p.9), “the agriculture sector is no longer able to absorb the surplus labor force entering the economy every year”, therefore encouraging people to seek employment in urban areas. The high population/land ratio and the growing phenomenon of landlessness contribute to this lack of economic opportunities in rural areas (Ullah 2004; Uddin
SEM 2015 57
ASIA-PACIFIC
PIERRE WALTER FLOODS AND RURAL-URBAN MIGRATION IN BANGLADESH
and Firoj 2013). In contrast, urban areas and particularly the two largest cities, Chittagong and Dhaka, concentrate economic activities such as garment industries, financial and banking services, administrative headquarters and civil employment (Islam 1999). More importantly, around 80 per cent of all employment in a city like Dhaka is in the informal sector (Bangladesh Bureau of Statistics 2010), which plays a central role in the rural-urban migration context given – as will be examined below – the fact that it constitutes the best opportunity for new migrants to rapidly find a job. Thus, in urban areas, migrants can find diversified job opportunities, regardless of skills (Hossain 2001). Finally, in the famous model of rural-urban migration theorized by Todaro (1969), migration is directly linked to the wage differentials between rural and urban areas and the probability of finding a job in the city. In Bangladesh, the rural wage rate has been lower than the urban wage rate for several decades (Herrmann and David 2009), even if the differential has been decreasing significantly over the last few years (IFPRI 2013). Of course other factors, such as marriage and dependency relations, also cause rural-urban migration, but they are much less important than economic factors. In addition, natural disasters play a significant role in explaining rural-urban migration in Bangladesh. According to Herrmann and David (2009, p.1), “[t]he principle factor that encourages people to leave their homes in the country side is the frequent recurrence of natural disasters, which undermine agricultural development and cause food crisis”. Indeed, the average yields of the main crops have been stagnating and sometimes declining over the last 20 to 30 years (ibid). Migration to cities can therefore serve as a coping strategy for households that have lost their income and/or place of residence because of a natural disaster (The Government Office for Science 2011). Sudden natural disasters, like the August-September 2014 floods, are not the only issues at stake. Slow onset environmental events, such as saline intrusion in the southern part of the country or riverbank erosion, may significantly affect rural life and agricultural productivity, therefore playing an important role in the decision to move (IOM 2010; Uddin and Firoj 2013).
FOCUS: FLOODS AS A FACTOR OF RURAL-URBAN MIGRATION According to the International Organization for Migration (IOM), ‘’while there is good data on initial displacement as a result of floods there is less evidence on longer-term impacts of floods on migration decisions. Evidence from India suggests that floodplains are characterized by a variety of migration dynamics, including periodic movements to high ground for shelter and temporary work as well as permanent migration where people’s livelihoods are more severely affected’’ (Walsham 2010, p.10). In that sense, a real “flood-migration nexus” has been identified in Bangladesh, “both at the national level with an increasing displacement of rural populations to urban areas and at the international level with important migration to India” (Gemenne et al. 2011, p.62). For instance, a 2007 study demonstrated that in rural areas of northern Bangladesh affected by floods in 2005 the majority of migrants relocated to urban areas. In this case, rural-urban migration proved to be an effective coping strategy, enabling “potentially vulnerable households to avoid a debt cycle” (Rayhan and Grote 2007, p.82). In the same vein, the phenomenon of “landless farmers” migrating to urban centres is increasingly reported (Rahman and Manprasert 2006; IRIN 2010). In such cases, floods reoccurring year after year reduce the quality and the yields of the crop fields. When farmers start to struggle to make a living, they sell their field, thus becoming “landless farmers”. As the financial situation of these landless farmers becomes worse and worse, many of them permanently migrate to urban centres in order to find other sources of revenues. In Bangladesh, areas that are particularly prone to flooding are often also home to the poorest – and thus more vulnerable – populations (map 4), making the “flood-migration nexus” particularly important in such areas.
SEM 2015 58
It is important to emphasise that a distinction between rural-urban “environmental migrants” and rural-urban “economic migrants” is obviously not relevant since social, demographic, economic and environmental factors are highly intertwined. What is clear is that on top of economic, social and/or demographic factors, natural disasters create the conditions for migration to occur (Hagerly 2008).
2.2. Impacts of rural-urban migration
Rural-urban migration is traditionally regarded as a natural process of economic development, allowing urban industrial growth to benefit from the surplus manpower released from the rural sector (Bhuyan et al. 2001). In a country like Bangladesh, where appropriate policies to govern rural-urban migration are lacking, this process generates many negative impacts on the development of both cities and villages.
2.2.1. Slums
As stated by Jahan (2012, p.189), “urban benefits fail to touch the majority of the poor migrants”. The first problem is that because the majority of rural-urban migrants are particularly poor, many of them cannot afford to live in the formal residential areas of the host city. Therefore, a large proportion of rural-urban migrants end up in slums (Uddin and Firoj 2013). For instance, it has been estimated that in Dhaka about 3.4 million people live in 4,966 different slums (Ishtiaque and Mahmud 2011), and that in the middle of the 1990s 93 per cent of slum dwellers in Dhaka were from rural areas (Majumder et al. 1996). In these slums, social, sanitary and environmental conditions are extremely poor: solid waste management is almost inexistent, and people often lack access to clean water, making them vulnerable to water borne diseases (Alom and Khan 2014). It is striking to note that in Bangladesh’s urban areas the percentage of the population using improved drinking water sources and improved sanitation facilities have been stagnating over the last two decades (see tables 3 and 4), due to the fact that the majority of urban growth is located in slums where sanitary conditions are very poor. Table 3: Percentage of population using improved drinking water sources in Bangladesh (1990-2012) Year
Total
Urban
Rural
1990
77
87
77
1995
78
87
75
2000
79
86
77
2005
81
85
79
2010
81
85
80
2012
85
86
84
Source: McInerney and Magar 2014, http://pages.uoregon.edu/aweiss/intl442_542/2014%20Bangladesh%202.pdf
SEM 2015 59
PIERRE WALTER FLOODS AND RURAL-URBAN MIGRATION IN BANGLADESH
ASIA-PACIFIC
Table 4: Percentage of population using improved sanitation facilities in Bangladesh (1990-2012) Year
Total
Urban
Rural
1990
39
58
34
1995
42
58
37
2000
47
58
43
2005
51
57
49
2010
56
57
55
2012
57
58
55
Source: McInerney and Magar 2014, http://pages.uoregon.edu/aweiss/intl442_542/2014%20Bangladesh%202.pdf
2.2.2. Job opportunities
Even if Bangladesh’s fast-growing urban economy strongly relies on rural-urban migrants, the development of the non-agricultural sector is not sufficient to absorb the large number of migrants relocating to cities (Herrmann and Svarin 2009). Therefore, many rural-urban migrants end up working in the informal sector, especially those with the lowest levels of education. Migrants who find jobs in the informal sector of urban areas typically work as drivers, rickshaw pullers, mechanics, hawkers, carpenters, barbers, daily labourers or personal servants (Jahan 2012). These jobs are low-paid and as a result migrants working in the informal sector are often not able to break free from the cycle of poverty and to afford housing in the formal sector (Mohit 2012). In parallel, rural-urban migration may be a factor of “brain drain” from rural areas to urban centres. Indeed, when considering Bangladesh as a whole, rural-urban migrants tend to be relatively young and more educated than the average national educational level (Bhuyan et al. 2001). Thus, rural-urban migration contributes to the draining of individuals who could have had a positive impact on the rural economy, and has therefore been identified as a factor that impedes rural development (ibid).
2.2.3. Environmental risks
Finally, when discussing the general impacts of rural-urban migration, it is important to note that in many cases, rural-urban migrants find themselves in situations not only of social and economic vulnerability, but also of environmental risk. In the country’s two main cities, Dhaka and Chittagong, which are highly prone to flooding, most of the slum dwellings are built with non-durable materials, such as bamboo, wood, thatch, straw and scraps, which are not resistant to extreme climatic events (floods, cyclones, rapid erosion, etc.) (Jahan 2012). In addition, slums are usually located in zones that are particularly dense and prone to flooding, such as low lying areas along riverbanks in the case of Dhaka (ibid). This increased vulnerability caused by environmental factors exacerbates the process of circular poverty in which ruralurban migrants are trapped. Thus, given the sustained flux of rural-urban migration in Bangladesh and its negative consequences in social, economic and environmental terms, improved urban planning and rural-urban migration management is clearly of the utmost importance. The final section of this paper will therefore try to provide some policy recommendations.
2.3. Policy recommendations
In Bangladesh, international and internal migration has significantly increased over the past three decades (Bangladesh Bureau of Statistics 2008). While the
SEM 2015 60
Government intervenes quite strongly in international migration management, policy-makers pay scant attention to internal migration (National Food Policy Capacity Strengthening Programme [not dated]). As such, many recommendations have been proposed by various experts and organizations so that all parties concerned by the process of rural-urban migration – migrants, source communities and destination communities – can benefit. These recommendations may be grouped around two main ideas: (1) ensuring well-balanced development between rural and urban areas, which takes into account rural-urban migration; and (2) thoughtful urban planning.
2.3.1. Ensuring well-balanced development between rural and urban areas
In 2011 the Government of Bangladesh published a draft of the country’s national urban policy for the coming years, entitled “National Urban Sector Policy” draft. This document mentions that, “[t]he policy recognizes the existing spatial or regional imbalance in the pattern of urbanization in the country and also the rapid pace of urban population growth, particularly of Mega City Dhaka and other large cities”. It also indicates that, “rural to urban migration plays a key role in urbanisation and that it has both positive and negative consequences. To achieve balanced urbanisation rural urban migration [should] be properly guided to avoid over concentration of population in one or few cities”. As argued by Momen (2012, p.64), “properly guided” rural-urban migration is hardly feasible “given the constraints of the macroeconomic policy environment”. However, several paths of action do exist. Given that rural-urban migration mostly arises due to the lack of economic opportunities in rural areas, it appears that “the policy of stopping out-migration and inducing reverse migration becomes equivalent to the policy of poverty alleviation through the creation of employment and income generating activities in the rural areas” (Bhuyan et al. 2001, p.14). The investment in rural areas should thus take two complementary forms. Firstly, the government should continue to support the modernisation of the agricultural sector, with the purpose of increasing agricultural productivity (Herrmann and Svarin 2009). According to the International Fund for Agricultural Development (IFAD), while rice is the dominant crop an increase in its production is “limited by farmers’ lack of access to critical production tools such as high-yielding rice seeds” (IFAD 2014, p.2). In the same vein, the fishing industry is “under-utilised”, and fishermen should be provided with more resources such as “technologies for farming nutrient-rich small fish and better access to open bodies of water, in order to expand production, which will improve incomes and nutrition” (ibid). Increasing agricultural productivity will also require more efforts to be made in terms of adaptation to natural hazards and diversification of agricultural production (Herrmann and Svarin 2009; IFAD 2014). For instance, farmers should be encouraged to use crops that are more tolerant to floods, drought and/or salinity, and more research should be conducted on these topics. Secondly, Bangladesh should aim to develop rural industries and rural infrastructure, as well as improving health and education facilities, so that people do not need to go to cities to find such services (Bhuyan 2001). In parallel, the development of secondary cities should be encouraged. Indeed, regionalization (i.e. decentralization) of economic growth is necessary to ensure a balanced development of the country (Jahan 2012). This could be achieved by establishing industrial estates and educational facilities and by encouraging private investment in semi-urban centres (Bhuyan 2001). Finally, in addition to these measures that are meant to act on the root causes of rural-urban migration, an integrated policy on internal migration remains essential. Such a policy should adopt a proactive approach and address existing challenges but also anticipate future ones (Herrmann and Svarin 2009).
SEM 2015 61
ASIA-PACIFIC
PIERRE WALTER FLOODS AND RURAL-URBAN MIGRATION IN BANGLADESH
2.3.2. Thoughtful urban planning
Concerning urban centres, action must first be taken with regard to slums. As a priority, slums should be legally recognized and slums dwellers should be provided with a legal identity, so that they can benefit from utility services, social security and safety net programmes (Herrmann and Svarin 2009). Subsequently, incentives should be provided to facilitate housing for migrants, with an emphasis on private sector housing initiatives (Zaman et al. 2010). Slum upgrading programmes should also be encouraged, as they present several advantages over sites-and-services projects – such as the preservation of existing economic systems and community structures (Mohit 2012). An important part of the strategy should be directed towards job creation, because it would allow slum dwellers to move into formal housing. As stated by the IFAD (2014, p.2), “[w]ith most of the labour force engaged in low-income, lowproductivity jobs in the informal sector, the challenge will be to boost income and productivity, and to transfer labour to the formal sector”. More generally, urgent improvement is needed in land use planning, as well as in property valuation and taxation when slums are transformed into private real estate (Zaman et al. 2010). In order to address the sanitary issues and the environmental risks discussed above, health services and basic infrastructure should be developed in urban areas that lack them. A possible short-term solution to provide better health services in slums is the implementation of Public-Private Partnerships (PPP). Indeed, contracting out health service delivery to the private sector or NGOs has already been tested in Bangladesh, with relatively positive results (Mohit 2012). Concerning natural disaster prevention and management, the short-term needs entail the creation of more drainage systems that could diverge the surplus of water and therefore avoid floods (World Bank 2005). Moreover, the improvement of flood prevention in major urban areas is an urgent priority. Notably, the government should create a hierarchal chain of command that would be under a single, regulatory department, in order to put a stop to the current level of disorganisation in flood prevention and reduction (McInerney and Magar 2014).
CONCLUSION In Bangladesh, rural-urban migration is a critical phenomenon whose magnitude and consequences for both rural and urban areas are significant. The factors behind such a phenomenon are multiple and complex, being, as demonstrated in this article, economic, demographic, social and environmental in nature. Flooding is one of the major causes of rural-urban migration in Bangladesh, as shown by the above discussion of the characteristics and consequences of the floods that occurred in August and September 2014. While only some of the people in affected areas decided to leave the affected zones in the immediate aftermath of the disaster, its impacts have to be considered in the broader context which characterizes Bangladesh, namely a country which is recurrently affected by natural disasters, whose rural economy is struggling and whose urban areas have to deal with multiple risks. In this particular context, cities in Bangladesh can be considered to be faced with a “double jeopardy future: they must respond to swelling populations, whilst also experiencing increased threats from future environmental change” (The Government Office for Science 2011, p.149). As such, the focus of policy makers should be on addressing both the causes of rural-urban migration – because they are evidence of the problems that exist in rural areas – and its negative consequences. Rural-urban migration should therefore not be seen as an inherently negative phenomenon, but rather as a an effective coping strategy that can ease people out of situations of vulnerability when properly managed and planned.
SEM 2015 62
REFERENCES Books, reports and presentations –– Agarwala, S. et al. 2003, Développement et changement climatique au Bangladesh : accent sur l’inondation des côtes et la région des sundarbans, OCDE, Paris. –– Ahmed, A.U. 2006, Bangladesh. Climate Change Impacts and Vulnerability. A Synthesis. Climate Change Cell, Department of Environment, Dhaka. –– Ahmed, A.U. and Mirza, M.M.Q . 2000, “Review of Causes and Dimensions of Floods with Particular Reference to Flood ’98: National Perspectives”, In Ahmad, Q .K., Chowdhury, A.K.A., Imam, S.H. and Sarker, M. (Eds.), Perspectives on Flood 1998, The University Press Limited, Dhaka. –– Bangladesh Bureau of Statistics 2010, “Measuring the informal employment in Bangladesh”, presented at the Regional Workshop on MAP on Decent work in ASIA, Bangkok, Thailand, 28-30 June 2010, . –– Bangladesh Food Security Cluster 2015, Food security, nutrition, shelter and early recovery assessment in flood affected areas of north-west Bangladesh August 2014, . –– Bhuyan, A.R., Khan, H.A.R. and Ahmed, S.U. 2001, Rural Urban Migration and Poverty: The Case for Reverse Migration in Bangladesh, Centre on Integrated Rural Development for Asia and the Pacific, Dhaka, Bangladesh. –– Food and Agriculture Organization (FAO) 2014, GIEWS Country Brief. Bangladesh, accessed on 22 March 2015, . –– Gemenne, F., Brücker, P. and Ionesco, D. (Eds.) 2012, The State of Environmental Migration 2011, Institute for Sustainable Development and
International Relations (IDDRI) / International Organization for Migration (IOM). – – Guha-Sapir, D., Hoyois, P. and Below, R. 2013, Annual Disaster Statistical Review 2012: The Numbers and Trends, Centre for Research on the Epidemiology of Disasters (CRED), Brussels. – – Herrmann, M. and Svarin, D. 2009, “Environmental pressures and rural-urban migration: The case of Bangladesh”, MPRA Paper No. 12879. – – Hossain, M.Z. 2001, “Rural urban Migration in Bangladesh: A micro Level Study”, paper presented at the Brazil IUSSS Conference, 20-25 August 2001. – – International Displacement Monitoring Center (IDMC) 2015, Bangladesh: comprehensive response required to complex displacement crisis, accessed 28 February 2015, . – – International Federation of Red Cross And Red Crescent Societies (IFRC) 2014, Emergency appeal operations update. Bangladesh: Floods, accessed 8 March 2015, < http://reliefweb.int/sites/reliefweb. int/files/resources/MDRBD014OU1. pdf>.
–– Islam, N. 1999, Urbanization, Migration and development in Bangladesh: recent Trends and Emerging Issues, Paper I, Centre for Policy Dialogue, Dhaka. –– Majumder, P.P., Mahmud, S. and Afsar, R. 1996, The squatters of Dhaka city: dynamism in the life of Agargaon squatters, University Press Limited, Dhaka. –– National Food Policy Capacity Strengthening Programme [not dated], Research proposal, accessed 12 April 2015, . –– Potsdam Institute for Climate Impact Research and Climate Analytics (PIK) 2013, Turn Down the Heat: Climate Extremes, Regional Impacts, and the Case for Resilience, World Bank, Washington DC. –– The Government Office for Science 2011, Foresight: Migration and Global Environmental Change, Final Project Report, London. –– The JNA Consolidation Project 2014, “Pre-Disaster Secondary Data”, accessed 15 March 2015, . –– United Nations Conference on Trade and Development (UNCTAD) 2006, The Least Developed Countries Report 2006: Developing Productive Capacities, New York and Geneva.
– – International Fund for Agricultural Development 2014, Investing in rural people in Bangladesh, accessed 29 March 2015, .
–– Walsham, M. 2010, “Assessing the evidence: environment, climate change and migration in Bangladesh”, International Organization for Migration (IOM) Report, International Organisation for Migration, Dhaka, pp. 1-70.
– – IPCC 2014, Climate Change 2014: Synthesis Report. Contribution of Working Groups I, II and III to the Fifth Assessment Report of the Intergovernmental Panel on Climate Change [Core Writing Team, R.K. Pachauri and L.A. Meyer (eds.)], IPCC, Geneva, Switzerland.
–– World Bank, Human Development Unit 2005, Bangladesh: Attaining the Millennium Development Goals in Bangladesh, accessed 10 April 2015, .
SEM 2015 63
ASIA-PACIFIC
PIERRE WALTER FLOODS AND RURAL-URBAN MIGRATION IN BANGLADESH
–– Zhang, X., Rashid, S., Ahmad, K., Mueller, V., Lee, H.L., Lemma, S., Belal, S. and Ahmed, A. 2013, “Rising Wages in Bangladesh”, International Food Policy Research Institute (IFPRI), accessed 11 April 2015, . Articles –– Alam, M. and Rabbani, M.D.G. 2007, “Vulnerabilities and responses to climate change for Dhaka”, Environment & Urbanization, Vol. 19, No. 1, pp. 81-97. –– Alamgir, J. 1993, “Rural-Urban Migration in Bangladesh: Theoretical Approaches to Understanding Internal and External Dynamics”, The Journal of Social Studies, Vol. 59. –– Alom, M. and Khan, Z.H. 2014, “Environmental and Social Impact Due to Urban Drainage Problems in Dhaka City, Bangladesh”, International Journal of Engineering and Advanced Technology (IJEAT), Vol. 3, pp. 128-32. –– Braun Van, J. 2004, “Towards a renewed focus on Rural Development”, Agriculture & Rural Development, Vol. 2, No. 2, pp. 4-6. –– Dewan, T.H. 2015, “Societal impacts and vulnerability to floods in Bangladesh and Nepal”, Weather and Climate Extremes, Vol. 7, pp. 36-42. –– Friedman, L. 2009, “A city exploding with climate migrants”, In Bangladesh: Where the Climate Exodus Begins, Environment & Energy Publishing, Washington D.C. –– Hagerly, D.T. 2008, “Bangladesh in 2007: Democracy interrupted, Political and Environmental challenges ahead”, Asian Survey, Vol. 48, No. 1, pp. 177-183. –– Harris, J.R. and Todaro, M.P. 1970, “Migration, Unemployment, and Development: a Two-sector Analysis,” The American Economic Review, Vol. 60, pp. 126-142. –– International Organization for Migration (IOM) 2009, « Changement climatique et déplacement au Bangladesh – Une crise silencieuse? », accessed 22 February 2015, .
SEM 2015 64
–– IRIN 2010, “BANGLADESH: Landless numbers on the rise”, accessed 20 March 2015, . –– Ishtiaque, A. and Mahmud, M.S. 2011, “Migration Objectives and their Fulfillment: A Micro Study of the Rural-Urban Migration of the Slums of Dhaka City”, Malaysian Journal of Society and space, Vol. 7 No. 4, pp. 24-29. –– Jahan, M. 2012, “Impact of rural urban migration on physical and social environment: The case of Dhaka city”, International Journal of Development and Sustainability, Vol. 1, No. 2, pp. 186-194. –– McInerney, B. and Magar, R.T. 2014, “Urban Environmental Challenges and Poverty Alleviation. Bangladesh”, accessed on 25 March 2015, . –– Mohit, M.A. 2012, “Bastee Settlements of Dhaka City, Bangladesh: A Review of Policy Approaches and Challenges Ahead”, Procedia - Social and Behavioral Sciences, Vol. 36, pp. 611-622. –– Momen, S. 2012, “Questioning the Paradigms and Theories Underlying the New Urban Sector Policy of Bangladesh”, Journal of Bangladesh Institute of Planners, Vol. 5, pp. 59-67. –– Rahman, M.D.H and Manprasert, S. 2006, “Landlessness and its Impact on Economic Development: A Case Study on Bangladesh”, Journal of Social Sciences, Vol. 2, No. 2, pp. 54-60. –– Rayhan, I. and Grote, U. 2007, Coping with Floods: Does Rural-Urban Migration Play any Role for Survival in rural Bangladesh?, Journal of Identity and Migration Studies, Vol. 1, No. 2. –– Tacoli, C. 2009, “Crisis or adaptation? Migration and climate change in a context of high mobility, Environment & Urbanization, Vol 21, No. 2, pp. 513-525. –– Todaro, M.P. 1969, “A Model of Labour Migration and Unemployment in Less Developed Countries,” The American Economic Review, Vol. 59, No 1, pp. 138-148.
–– Uddin, N. and Firoj, M. 2013, “Causes and Consequences of Rural- Urban Migration in Bangladesh: An Empirical Study in Chittagong City”, International Journal of Ethics in Social Sciences, Vol. 1 No. 1, pp. 89-104. –– Ullah, A.K.M.A. 2004, “Bright City Lights and Slums of Dhaka city: Determinants of rural-urban migration in Bangladesh”, Migration Letters, Vol. 1, No. 1, pp. 26-41. –– Zaman, A.K.M, Alam, K.T. and Islam, J. 2010, “Urbanization in Bangladesh: Present Status and Policy Implications”, ASA University Review, Vol. 4 No. 2, pp. 1-16. –– Press articles –– Hussain, Z. 2013, “In Bangladesh, the Alternative to Urbanization is Urbanization”, accessed 25 March 2015, . Websites –– Bangladesh Bureau of Statistics, accessed 10 April 2015, . –– National Aeronautics and Space Administration (NASA) 2014, Earth Observatory, accessed 1 March 2015, . –– Scottish Natural Heritage 2015, Rivers and their catchments: an overview, accessed 27 October 2015, . –– World Bank 2015, World DataBank, accessed 20 March 2015,
CRISTINA ALVAREZ-QUINONES TORRES
Drought in Tharparkar: From Seasonal to Forced Migration
P
akistan is ranked in the top ten countries most vulnerable to climate change (National Disaster Management Authority NDMA). According to the Global Climate Risk index, Pakistan, together with Haiti and the Philippines were the most affected countries in 2012 (Zofeen, 2014). Due to its geography, it is greatly exposed to climate-change-related risks. Pakistan’s fresh water resources are provided by monsoon rainfalls and the melting of glaciers from the Himalayas, which are retreating faster than in any other part of the world due to rising temperatures (Sattar, 2014). This is likely to cause not only glacial lake outburst floods (GLOFs) but also increasing water flows into rivers. In addition, according to the Director of the Pakistan Meteorological Department, monsoon patterns are also changing partly as a result of the well-known “Asian brown cloud1” derived from air pollution. Proof of this change of pattern might be found in the 2010 floods in Pakistan, when monsoon rains occurred in the northern part of the country, which is normally monsoon free. Had this level of rainfall occurred in arid zones, the rainwater would have been absorbed by rivers, thus avoiding the devastating consequences of the floods. On the whole, Pakistan’s climate is arid, with levels of precipitation that are low (average rainfall in below 240 millimetres) and uneven, as 81% of river flow and 65% of precipitation take place in the 3 months of the monsoon season (Sattar, 2014). As a result, the country is prone to droughts, which have been increasing in number and intensity over the past few decades. In a country highly dependent on agriculture (as well as on natural resources such as natural gas from the desert zone of Baluchistan) all these extreme environmental situations are having severe impacts on this sector, and thus on food security, but also on migration patterns. Historically, Pakistan has been a country with high levels of migration, both internal and international, linked to both its geography and environmental changes. For instance, during the colonial period, the British introduced canal irrigation in what is now Punjab province, bringing farmers from the East; and in the post-colonial period, following the construction of the Mangla Dam the British offered to relocate the population displaced from the project to Britain (Sattar, 2014). This paper will analyse the drought that occurred in the region of Tharparkar, in Sindh province starting in 2013 and reaching its most devastating point between March and August 2014. The region of Tharparkar is traditionally prone to droughts, and its population, which is dependent on agriculture and livestock, has long suffered from extreme environmental conditions that have led to problems of food insecurity
1. “Asian brown cloud, a large atmospheric brown cloud that occurs annually from about November through May over eastern China and southern Asia. The Asian brown cloud is caused by large amounts of aerosols (such as soot and dust) produced in the combustion of fossil fuels and biomass across the region. It has been linked to decreases in summer monsoon rainfall in India since 1930, the southward shift of the summer monsoon in eastern China, declines in agricultural production, and increases in respiratory and cardiovascular problems in the people inhabiting the region”. http://global.britannica.com
SEM 2015 65
ASIA-PACIFIC
CRISTINA ALVAREZ-QUINONES TORRES DROUGHT IN THARPARKAR: FROM SEASONAL TO FORCED MIGRATION
and chronicle malnutrition, increasing neo-natal mortality and diseases and death among livestock, all causing an increasing degree of forced migration. This paper will focus on the development of the drought and its consequences for the population, both in terms of migration and livelihood. It will also analyse the response and measures undertaken by the Government and will attempt to set out a series of recommendations to address the problem.
1. RAINFALL AND DROUGHT CONDITIONS IN PAKISTAN Rainfall variability in Pakistan is high. While the northern half of the country is semi-arid to very humid, the southern part, in which Tharparkar is located, is arid to hyper-arid. Drought is a slow onset event: its effects can be less obvious as they usually accumulate slowly over a long period of time. Consequently droughts normally affect a higher number of people than other natural hazards (Pakistan Meteorological Department). According to the Pakistan Meteorological Department a drought “is an extended period of months or years when a region notes a deficiency in its water supply. Generally, this occurs when a region receives consistently below average precipitation. It can have a substantial impact on the ecosystem and agriculture of the affected region”. Droughts can be meteorological – defined by the dryness and duration of the dry season; agricultural – mainly affecting food production and farming; hydrological – associated with the effects of low levels of precipitation on the water supply; and socio-economic – occurring when the demand for an economic good exceeds supply, due to weather-related water shortages (Pakistan Meteorological Department). According to the Jaggarta organization, the worst drought that has taken place in Pakistan in the last 50 years is that of 1998-2002, of which the El Niño2 phenomenon in 1997 was an important starting point. The Meteorological Department of Pakistan has also established a link between El Niño and instances of drought, as over a period of 100 years (1871-1988), 11 out of 21 droughts occurred in El Nino years. It also associates droughts with factors such as the prevalence of high-pressure systems, winds that carry continental instead of oceanic air masses, deforestation, and global warming. Climate change is part of the causes of drought, as can be seen in both the changing patterns of precipitation (the monsoon occurring in September rather than in July and August) and in the intensity of events (waves heat, floods cyclones, etc…). But are other factors have also been identified (United Nations Pakistan, 2014), such as the demand for natural resources and institutional apathy. A growing population increases the demand for natural resources, which are largely non-renewable such as groundwater or land among others. The use of and drilling for groundwater increases salt contamination and thus reduces the amount of fresh water. Population growth also increases the exploitation of other natural resources such as minerals, present in the region of Sindh, further reducing the amount of available land and water, and urbanisation and the growth of urban areas affect the supply of water to the surrounding region. Public institutions do not, however, seem to actively respond to these issues. As the Pakistan Meteorological Department recognises, “no organisations dealing with the drought issues exist in Pakistan and the responses to drought for the distressed economic and social sector, whenever such situation arose, are taken on emergency
2. “A climatic event occurring every two to seven years, characterized by warming of surface waters and reduced upwelling of cold, nutrient-rich water off the western coast of South America, causing die-offs of plankton and fish and influencing jet stream winds, altering storm tracks and affecting the climate over much of the world”. http://www.thefreedictionary.com
SEM 2015 66
Map 1. Map of deserts in Pakistan
Source: Sindh Provincial Disaster Management Authority
and on ad hoc basis”. There is also a lack of communication and coordination between institutions (Di Nunzio, 2014) as well as limited budgets for mitigation, or even development. The Government of Pakistan controversially classified the 2014 drought in Tharparkar as socioeconomic (Hashim, 2014), and it was only when different media and NGOs started to report infant mortality and loss of livestock due to disease that the Government began to recognis”e the seriousness of the situation (Pakistan Water Partnership, 2014).
1.1. Tharparkar: description of the drought
According to the Sindh Relief Department, the district of Tharparkar has been declared calamity-hit in 1968, 1978, 1985, 1986, 1987, 1995, 1996, 1999, 2001, 2004, 2005, 2007 and 2012. The desert of Tharparkar covers more than 22.000 km² and is the largest in Pakistan and the 18th largest in the world. Its population numbers 1.5 million people, living in 2300 villages and urban settlements. It is composed of six talukas – Mithi, Islamkot, Chachro, Dihly, Diplo and Ngarparkar – each of which receive different levels of rainfall. The land, although arid, is highly fertile but depends on the July to September rainfall. Unfortunately, Pakistan’s rainfall pattern is known to be highly variable and this variability seems to be increasing as a result of global warming (Sattar, 2014). Rainfall in the desert varies between 100mm and 700mm (Pakistan Water Partnership, 2014), of which the summer monsoon (July to September) accounts for 60% to 70% of the annual rainfall (Pakistan Meteorological Department). This is illustrated by a comparison of monthly rainfall levels in 2013 versus average levels in the province of Sindh: March -89%, April +82%, May -100%, June +292%, July - 83%, August +50% and September -41%. The figures for 2014
SEM 2015 67
ASIA-PACIFIC
CRISTINA ALVAREZ-QUINONES TORRES DROUGHT IN THARPARKAR: FROM SEASONAL TO FORCED MIGRATION
highlight the worsening of the drought: March -17%, April -18%, May -98%, June -40%, July - 84%, August -17% and September -99% (Pakistan Meteorological Department). This translates into a rainfall deficit of around 30% between March 2013 and February 2014 with some towns barely receiving a drop of water (JSWO, 2014). The vastly reduced monsoon season is thus the main cause of droughts in Pakistan, in an area already prone to droughts. And pollution and climate change are making of them a common phenomenon in the area (JSWO, 2014). For the preceding three years Tharparkar had been faced with a drought-like situation, but it was not until October 2014 when the Provincial Disaster Managing Authority (PMDA) declared the zone as an “impending emergency” (WFP, 2014). Interestingly, the zone would usually be declared as a disaster area as of mid-August if rainfall is below normal levels and consequently some assistance in terms of water, food, fodder and medicines is provided. But in 2014 this only happened when the spiral of deaths of humans and animals became too alarming (Shaikh, 2014). In fact, in 2014 the monsoon season, which arrived towards September, brought an insignificant quantity of rain leading to a worsening of the already severe drought-like conditions prevailing in the area. In the monsoon season of 2014 Tharparkar received an estimated 124mm of rainfall, compared with 190mm in 2013 and 220 mm in 2012 (WFP, 2014).
2. THARPARKAR: LIFE AND THE IMPACTS OF DROUGHT The people of Tharparkar live on agriculture, livestock and daily wages. Estimates suggest that 30% to 40% of population is dependent on agriculture and cattle respectively, with the remainder dependent on daily wages from services, local trading and transportation in urban settlements (Consortium Management Unit, 2014).
2.1. Impact on agriculture
Agriculture is largely dependent on monsoon rainfall as there are few zones in Pakistan where irrigation is practiced (United Nations Pakistan, 2014) and high yields are only possible with a significant amount of rain, in spite of the fact that rural communities have adapted over time by using water stress resistant and efficient crops such as millet or sugar. Given that Tharparkar, unlike other areas, has only one crop season (Sattar, 2014) three years of drought-like conditions have meant three years of crop failure for some families, leading to lower incomes and malnutrition. According to an assessment carried out by the Thardeep Rural Development Programme (TRDP, 2014), 28% of the families interviewed (holders of land) were able to cultivate their land, and the majority (54%) bought their seed on credit. Around 30% purchased in cash and only 15% had seed stock already available. The study also indicates that for a good crop four to five periods of rainfall are required. In the case of the majority of the farmers (86%), their seed was completely destroyed before the first rains.
2.2. Impact on livestock
Livestock also falls victim to droughts in various ways: water shortages and their impact on grazing make animals weaker and more prone to disease. The consumption of herbs mixed with sand causes digestive problems, metabolism disorders (Khangharani, 2014) and viral infections that are highly contagious. As such, prices of livestock fall and farmers are either unable to sell their animals or do so at prices that jeopardize their income. Seeing as there is barely any kind of veterinary service in Tharparkar, the final outcome of disease is often death, and given that the population depends on livestock for milk and meat, this inevitably increases their vulnerability to malnutrition and reduces their resilience. In 2014 a serious sheep pox outbreak occurred, causing a large culling of herds and significantly reducing farmers’ income and further deteriorating the already tough situation facing the population (United
SEM 2015 68
Nations Pakistan, 2014). The sheep pox outbreak reportedly led to at least 42,000 deaths (Di Nunzio, 2014). According to a Hands assessment (Hands Pakistan, 2014) the livestock mortality rate due to the 2014 drought reached 70%. More than 300,000 animals died from different diseases caused by the unavailability of fodder, the quasi-inexistent water supply and sheep pox. Another survey indicates that the livestock death ratio during the three-month period from July to September was recorded at 14% in sheep and goats and 4% in cows and large domestic animals (TRDP, 2014). Finally, another assessment (Consortium Management Unit, 2014) showed that part of the population lost one third of their cows and camels, while for others two thirds of small ruminants (sheep, goats) were lost to diseases that were unable to be treated because of lack of capital to buy vaccines coupled with their limited availability. In 2014, the sale of livestock, which is generally turned to as a strategy of last resort to cope with a lack of resources and famine, decreased significantly as the weak conditions of herds caused prices fall (Consortium Management Unit, 2014).
2.3. Impact on nutrition
Tharparkar’s drought undoubtedly greatly affected and deteriorated its population’s sources and levels of income and had a direct and debilitating impact on food insecurity, malnutrition, which mostly affected women and children, and deaths. Many media reports indicate that the alarm regarding the 2014 drought was only sounded when the child death toll had reached around 120, a figure which ultimately reached 400 (Khangharani, 2014). According to the Thardeep Rural Development Programme, 82% of the population surveyed in their assessment (TRDP, 2014) were found to suffer from food insecurity (food available for a maximum of 15 days), 17% had food security for up to six months and only 1% had food security for one year. This situation was exacerbated due to the indebtedness of families, which according to the same study reached 69% at the moment of the assessment. Indebtedness has a significant impact on the ability to cope with these situations of distress. In 2013, 70% to 80% of families surveyed had decided to go into debt in order to buy seeds for cropping and land preparation for the monsoon season as well as vaccinations for livestock; a similar situation was observed in 2014, between the monsoon seasons. As no rainfall occurred in either of the two seasons, the situation of families inevitably became even more delicate, being unable to pay back their debt (Consortium Management Unit, 2014). This cycle is further exacerbated when higher castes or families with greater socioeconomic resources give food loans to lower income families in exchange for the gains from future harvests: as drought results in crop failure, these families become further indebted, and start to have to cut food and medical expenses, thus worsening their food insecurity as well as their health. The spiral becomes fatal where those most vulnerable to droughts and famines become even more vulnerable when revenues from harvests or other sources of income shrink due to drought.
2.4. Impact on migration
The latest population census of Pakistan in 1998 indicates that during the 1980s and 1990s the region of Sindh witnessed around 10% of the internal migration in the country while accounting for 23% of the country’s population. Punjab, another arid region, accounted for more than 50% of the country’s internal migration (Sattar, 2014). These figures illustrate that the larger part of internal migration occurs in areas where there is significant pressure on land and resources, and zones where there are low levels of industrialisation. The historical lack of mobility has prevented social networks from developing within urban centres, resulting in urban migration due to linkages to be more limited. Yet this seems to be changing as a result of the drought-like conditions from which the region has been suffering in the last decades (Sattar, 2014), as is illustrated in this case.
SEM 2015 69
ASIA-PACIFIC
CRISTINA ALVAREZ-QUINONES TORRES DROUGHT IN THARPARKAR: FROM SEASONAL TO FORCED MIGRATION
Both the sale of livestock and migration have been reported as coping strategies to deal with situations of drought. According to a senior official in the Provincial Disaster Management Authority of Sindh (PDMA), approximately 175,000 families have fled the drought-blighted region (Shaikh, S. & Tunio, S., 2014). Temporary or seasonal migration is a recurrent phenomenon in Tharparkar, but whether or not this migration was seasonal was not assessed. During the dry winter months (December to February) or during years of drought, families migrate to barrage areas in the province of Sindh to harvest sugar crops, wheat, and rice, and to feed their livestock. But in normal years migration takes place in April and May, which is when the wheat is harvested (Sattar, 2014). According to Care and the Relief Foundation (Khangharani, 2014) in a normal year seasonal migration is practised by 15% to 20% of families, a figure that increases to 35-45% in years of drought. In 2014 it was estimated that an additional 25% of families resorted to migration, both with and without livestock. But not all inhabitants migrate: a recent study shows that families with livestock are more inclined to migrate to look for grazing and water for their animals, while owners of land are more reluctant to do so, due to fears of losing their land (Kolhi, 2014). And there are also those who do not migrate for socioeconomic reasons. In some cases the family does not have sufficient means to travel long distances in search of irrigated areas. During such long distances the chances of livestock survival are low due to either a lack of water or to their weak condition. This inevitably makes migration a worse solution. Some families do not view definitive migration as possible either, as their degree of poverty is such that they do not have the means to relocate (Rahma Islamic Relief, 2015). In some cases of this nature, only one member of the family migrates to cities or urban settlements in search of alternative sources of income. According to a survey from the Thardeep Rural Development Programme (TRDP, 2014) carried out in 74 villages in Tharparkat and Umerkot at the end of 2014, 73% of migration to barrage areas for livestock grazing or in search of agricultural labour involved a single family member (partial migration), while in 27% of the cases the whole family migrated. There are more than 20 different communities in Tharparkar, a mixture of Muslims (64%) and Hindus (36%), the largest denominations being the Bheel, Kolhi and Meghwar. The Bheel and Kolhi, pertaining to the Hindu religion, have been the most affected, according to different surveys. These communities are used to migrating every year, during the harvest season, but not from August to September as they did in 2014. One of the surveys carried out (Consortium Management Unit, 2014) revealed that a large portion of the people that had migrated with their entire family in 2014 came from the Bheel and Kolhi communities (64% in total), the next largest community being the Meghwar (6%). The first people to migrate often move to nearby districts (Sanghar, Badin, Umerkot and Mirpurkhas) in search of work opportunities and available fodder. The later ones usually have more means and are more inclined to migrate with only one member of the family, to irrigated areas to search of in-farm and out-farm labour, and the head of the family sends back remittances to support the rest of the family that remained at home. Indeed, of those partially migrating, the majority come from the Meghwar (25%), followed by the Bheel (21%) and the Kolhi (11%). The rest (42%) are from 22 other, mainly Muslim communities. Muslims usually migrate to urban centres such as Karachi and Hyderabad, but do not leave their houses, and send their earnings back home. Many other families indicated that they were ready to leave in the following weeks as they saw their sources of income, including the sale of livestock, shrink. It goes without saying that if no measures are taken by the authorities before the next monsoon, the situation of the population will deteriorate even further, provoking more migration. Partial migration is basically associated with livestock grazing, and, as mentioned, in Tharparkar this kind of seasonal migration takes place every year during the dry period (April and May). In 2014, according to the same survey (TRDP, 2014), 19% of the
SEM 2015 70
existing livestock accounted for in the assessment was taken to barrages areas versus 12% that perished and 4% that was sold.
3. POLITICAL RESPONSE Whenever rainfall is below normal levels in mid-August, the authorities of Tharparkar declare the zone a disaster area and as such assistance to the population in the form of food, fodder, water, and medicines is provided. Tharparkar had been facing a drought-like situation since 2011, but in the estimation of the authorities, it was only the lack of rainfall during the 2013 monsoon season that led to the droughtlike situation in December 2013/January 2014 (Pakistan Nutrition Coordination Working Group, 2014). The Meteorological Department had stated that even with a 30% lower level of rainfall in 2013, the situation did not qualify as a drought. Instead, as mentioned above, it was declared a “socioeconomic disaster” (Hashim, 2014), and it was only in March 2014 after domestic and international media and NGOs increasingly reported a state of famine and a significant increase in infant mortality as well as diseases and deaths among livestock, that the provincial authorities declared the area “calamity-hit” (Hashim, 2014). And it was not until October 2014, after another three months’ (July, August and September) rainfall levels below normal, and an “alarming” level of human deaths and animals (Shaikh, 2014) – some figures point to 400 to 500 deaths – that the zone was declared an “impending” zone and the drought was recognised as such (WFP, 2014). Over a period of one year, a zone traditionally prone to drought where rainfall levels had been below normal levels and where chronic malnutrition and poverty affects many households, was initially treated as “drought-like conditions”, followed by the status of “calamity-hit” and “impending zone” to finally be declared as suffering from drought. As such, there was a clear and founded consensus amongst journalists, researchers, NGO’s and other civil society groups about the negligence and the lack of governance that the authorities of Pakistan, both central and provincial, had displayed in the classification and handling of the drought (Di Nunzio, 2014). This lack of governance and coordination was particularly apparent in the accusation from certain critics of the National Disaster Management Authority (NDMA) that in Sindh province 60,000 bags of wheat intended for the relief of the population were not distributed at the end of March due to an administrative error (Di Nunzio, 2014). The same institution had already been the subject of criticism during the 2010 floods, as it had been unable to coordinate aid between international NGOs and other agencies (Di Nunzio, 2014). The reality is that the authorities themselves demonstrated negligence when referring to the issue: local officials placed the blame on higher level authorities’ lack of response, claiming it had considerably worsened the unbearable living conditions of Tharparkar’s population, while the higher authorities blamed district officials for alerting them to the situation too late (Shaikh, S. & Tunio, S., 2014). Furthermore, the Tharparkar Deputy Commissioner’s office claimed that in mid-August they had advised the Sindh provincial government about the risk of famine and advised that the district of Tharparkar be declared a disaster zone, but that they received no response (Shaikh, S. & Tunio, S., 2014). Such contentions clearly show the lack of response and the inability to compromise on the part of the authorities regarding the problem of the drought. Immediately after these incidents, in a context of a “flurry of visits by political leaders” (Hashim, 2014), two separate emergency relief aid packages totalling $10 million and $1 million were approved. Following some dismissals and changes in the provincial government, a former Pakistani senator agreed that the government had failed to distribute food to part of the population on time, acknowledging that there were cases of malnutrition especially among mothers and infants. But he in turn blamed the media for inaccurately reporting the nature of a seasonal phenomenon,
SEM 2015 71
ASIA-PACIFIC
CRISTINA ALVAREZ-QUINONES TORRES DROUGHT IN THARPARKAR: FROM SEASONAL TO FORCED MIGRATION
namely migration, and described the situation as a “media made disaster”. He went further stating that the delay of government’s response did not cause any loss of life nor migration (Hashim, 2014). According to the NDMA, in one week after recognising the area as calamity-hit at the beginning of March, 3,582 tons of wheat (worth approximately $2.5m), 201 tons of rice, and 1,484 tons of emergency food packs and other food aid were distributed in Tharparkar. In addition, 58 medical staff were deployed on emergency duty and 5,318 people treated at emergency medical relief camps. Other measures announced were investments in health facilities of around Rs 30m ($302,000) and compensation of Rs 200,000 ($2,000) to the families of each of the 70 infants who had died in the district of Tharparkar from December onwards (Hashim, 2014). The latest data provided by the NDMA in 2014 indicates that a total of 126,790 bags of wheat (100kg/bag), 320 bags of rice (50kg/bag) and the equivalent to 231 tons of food items had been distributed to mitigate the consequences of the drought. Mineral water and fodder was also provided. In terms of medical assistance, around 50 medics, paramedics and doctors from neighbouring cities were deployed with medicines for emergency duty; 6 medical camps were established by the Army, and other mobile medical teams and dispensaries were in evidence. In total 153,385 people were treated, evenly split between men, women and children. In addition, 17 mobile veterinary teams were deployed to vaccinate and treat a total of 4,2 million cattle. The latest drought situation report released by the NDMA, with provisional data up to January 2015 sets the number of wheat bags distributed at 625,849, and the number of people treated at 446,596. These figures show that despite the fact that the situation was addressed belatedly, with a delay of at least one year, assistance has improved since initial action was taken in March 2014.
4. PAKISTAN’S MIGRATION POLICY According to the Internal Displacement Monitoring Centre, the majority of the Internally Displaced Persons (IDPs) in Pakistan are related to environmental disasters or to the lack of appropriate mechanisms to deal with such disasters. A figure illustrates this: between the 2010 and 2011 monsoon floods, a total of 15 million persons (out of a population of 182 million) were displaced across the country (Shaikh, 2014). And yet Pakistan still has no environmental migration policy. Pakistan’s main challenge in addressing environmental migration is thus to develop a national policy, covering both internal and international migration. The only current legislation related to these issues is the Emigration law passed in 2009 (Sattar, 2014), which does not deal with internal migration or displacement, nor does the National Climate Change Policy, developed by the Ministry of Environment and approved in September 2012. Indeed, Pakistan seems to deny the existence of human displacement due to environmental events, as shown in the response to the Tharparkar drought. The importance of implementing a policy on migration instead of the reactive actions that the Government of Pakistan currently carries out when natural disasters take place rests on the need to get to the roots of the problems and avoid migration taking place as a solution of last resort. The policy debate should thus be oriented towards avoiding forced migration, and ensuring that migration should be perceived and employed as an adaptive measure. Climate change-induced migration should be framed within the context of a development policy (ADB, 2012).
4.1. Approaches for a migration policy
In general terms, policies on environmental migration can be addressed through two different angles that can be complementary. The first would cover the scope of protection of migrants (communities of origin) and the second that of adaptation to climate change through migration (Sattar, 2014). In the case of Pakistan, a complete
SEM 2015 72
comprehensive and holistic approach needs to be implemented. In the absence of a migration policy, the first step should be to create the necessary data system to discern migration patterns: Pakistan latest census is that of 1998, and the motives for migration considered within it are education, marriage, business, employment/ transfer, returning home, health and others3. Interestingly enough, environmental migration is not included.
4.1.1. Measures of protection for communities of origin
Several measures can be taken to reduce the vulnerability of communities to environmental risks and are related to: 1) disaster risk management, 2) poverty reduction policies 3) resilience and social protection (ADB, 2012). 1) Disaster Risk Management This is a crucial matter for Pakistan in order to reduce the impacts of climate change. The risk of being affected by disasters is essentially a function of the degree of vulnerability, the exposure to damaging hazard events, and the frequency and severity of hazards (National Disaster Management Authority, 2013). As developing countries’ vulnerability to natural disasters increases, an effective national risk management policy is essential. Up until 2005, when an earthquake hit the country, the natural disaster risk reduction policy in Pakistan was a reactive policy, based on emergency relief. This derived from the “Calamity Act” of 1958. As a consequence of the earthquake’s impact on the country and population, and in response to the need for an appropriate policy and of more institutional coordination, the National Disaster Management Authority (NDMA) was created in 2006. The Provincial Disaster Management Authority (PDMA) and the District Disaster Management Authority (DDMA) are under the jurisdiction of the NDMA. The DDMA is the first port of call on the alert chain, but it is the responsibility of the PDMA to implement the policies and plans elaborated at the national level, and to coordinate the response in the case of a natural catastrophe. Up until 2012, there was no coordination between the different levels of authority and the response to natural disasters such as the 2010 and 2011 floods were anything but planned. Natural disaster risk was thus not well managed. Indeed, the mismanagement of the flood crises and the unsustainable losses that they caused to the country are at the origin of the Risk Reduction Policy approved by the government in 2013, a policy which was formulated with a broad base of different stakeholders: national and international consultants, relevant federal ministries and departments among others (NDMA, 2013). According to the NDMA: “The policy shall promote priority measures to ameliorate existing vulnerabilities to hazards and ensure that future development initiatives add resilience. The policy also seeks to provide guideline for timely, dedicated and adequate investment on hazard mitigation and preparedness interventions at all levels which will not only substantially reduce the disaster risk but also the consequential damages and economic cost associated with response, recovery and rehabilitation” (NDMA, 2013). But this policy has encountered certain challenges that have been visible in the Tharparkar drought crisis. The first is the low level of risk awareness and knowledge. The knowledge of risk of Pakistani institutions is limited, both in terms of mapping but also in terms of its dynamics. Models of risk assessment, vulnerabilities, multihazard risks, and loss and damage assessments all have to be developed. There is a clear need to ensure the capacity to compile sound data that will help to prevent, efficiently manage and mitigate the effects of natural disasters, such as forced migration. A second issue is the necessity of capacity building at all levels. As has been illustrated
3. Retrieved: http://www.pbs.gov.pk
SEM 2015 73
ASIA-PACIFIC
CRISTINA ALVAREZ-QUINONES TORRES DROUGHT IN THARPARKAR: FROM SEASONAL TO FORCED MIGRATION
by the present case study, the lack of coordination between the different levels of public authorities seems to have been part of the problem in the delay in recognising the drought and in taking the necessary emergency relief action to prevent displacement. The decentralisation of the aforementioned natural disaster management authorities needs to be well coordinated. The NDMA has a policy-making role and should have the capacity to provide support and assistance to the other authorities to implement risk reduction action; and the provincial and district levels also need to have the capacity to carry them out. For this decentralisation to be effective it is also crucial that information flows efficiently between levels, so that the district authorities that are normally the closest to the event sound the alarm as soon as possible to reduce the risks of crisis situations and to activate the necessary measures. Finally, a third challenge is the lack of integration of natural disaster risks assessment into development planning and policies due, again, to a low level of awareness but also to institutional commitment and capacity to undertaking it (NDMA, 2014). 2) Poverty reduction policies It is essential that policies to reduce poverty take a long term stance not only for the sustainability of people’s living conditions and development but also for the sustainability of the climate. In the same way that climate change and environmental migration can increase people’s level of poverty, a poverty reduction policy can address climate change and thus induce environmental migration. A clear example is that of China, where economic development has significantly increased rural to urban migration. But in several Chinese megacities, that same economic development is now causing environmental problems that are translating into environmental migration: those who now leave the city to avoid the negative effects of the deteriorating environment. 3) Resilience and social protection measures Considering Tharparkar is one of the most vulnerable regions to drought in Pakistan, long term measures must be taken in order to increase the resilience of its communities, make the lives of the people sustainable and avoid forced migration. The need to invest in water infrastructure seems to be inevitable, such as establishing water treatment plants or irrigation systems. Improving peoples’ financial resources can also alleviate their hardship in seasons of low rainfall or crop failure, through measures such as low interest rate loans or grants, or conditioned loans that would be returned only if there is no crop failure due to low rainfall; social protection measures such as conditioned cash transfers could also help to increase their means of living as well as human capital (cash transfer dependent upon a medical appraisal and school attendance). Investment in health facilities seems to be necessary in Tharparkar. New sources of income also need to be found, and given that agriculture is the main means of earning income, new varieties of crops that are more resilient to dry areas or suitable for saline water could be promoted (TRDP, 2014).
4.1.2. Migration as an adaptation measure
When discussing migration, due to socio-economic linkages or other reasons, it is necessary to consider at least two types of migrants within this spectrum: those who are forced to migrate and those who want to migrate. But when addressing climate change, planned migration should also be considered as an adaptive strategy. According to several studies (ADB 2012, Sattar 2014) planned migration is barely considered in any climate change policy as an adaptive strategy, and more specifically it is not in Pakistan’s Climate Change Policy (Sattar, 2014). But there are certain cases that may shed light on this, and possibly enhance planned migration as a form of adaptation in zones that are extremely and recurrently vulnerable to climate change. This is the case of Fiji, in the South Pacific Ocean, where rising seas are contaminating fresh water and agricultural land rendering some coastal areas uninhabitable.
SEM 2015 74
When adaptation measures such as building seawalls no longer worked, others like planned migration and relocation of the affected population to new land did. An illustration of this is in the relocation of the village of Vunidogoloa where the sea had breached the seawall barriers causing daily flooding and saltwater degrading the soil and destroying crops (UNFCCC). The government undertook a process to move 150 people to a different site and build new houses. Plans for relocation only went ahead after the community had given its consent, and villagers actively participated in the relocation process. Public authorities contributed with funding for the provision of basic services and new livelihoods, and the community also received assistance in re-establishing agriculture and capacity building for alternative initiatives to generate income. But in the case of Tharparkar, planned migration action seems to be a far off prospect. As has been illustrated, the management of the 2013-14 drought was all but planned. Pakistan’s response to droughts has in some cases been “stop gap arrangements” (Consortium Management Unit, 2014), and established contingency plans have not been effective. The usual cycle of drought relief operations starts with a declaration of emergency, which leads to an analysis of the situation that is in turn transformed, if deemed an emergency, into an urgent and immediate provision of wheat, followed by a provision of other relief goods (Provincial Disaster Management Authority, 2014). No permanent action is undertaken in addition to these ad-hoc relief plans. After this crisis, there seemed to be a certain degree of awareness of the fact that the paradigm of crisis management had to be changed from “stop gap arrangements” to a strategy that tackles the problem at its root and that promotes sustainable solutions, from response to resilience. As such, a proposal for the creation of the Thar Development Authority was presented by the Provincial Government of Sindh with the objective to revolve around policies in the water, livestock and health sectors, and the empowerment of people to alleviate perpetual poverty. These policies should be subject to legislative review and approval and may add to the drafting of a draft policy that the government has initiated (Khangharani, 2014).
CONCLUSION Pakistan has many challenges to face. The country was ranked 146 out of 187 in the 2013 Human Development Index (UNDP). It is one of the most vulnerable countries to natural disasters, and yet, it has only recently approved, in 2013, a risk reduction policy. The majority of its internally displaced persons are due to environmental events, and yet Pakistan has no environmental migration policy. It is ranked in the top ten countries most vulnerable to climate change, and yet the National Climate Change Policy approved in 2012 was only enforced in 2013 and does not deal with environmental migration. But one of the main challenges facing Pakistan in order to efficiently and effectively address all these problems is institutional capacity, which contributes to determining the level of impact that climate change in general and environmental events or natural disasters in particular will have on the population. Since the flooding in 2010 and 2011 and its consequences, the Government of Pakistan seems to have taken certain steps to formulate policies that will address these issues, but now it has to go a step further and integrate environmental migration in these policies. In Tharparkar, the Government has the opportunity to start doing so by implementing measures that will increase the population’s resilience and livelihood and thus reduce their vulnerability to climate change, which will help to mitigate forced environmental migration.
SEM 2015 75
ASIA-PACIFIC
CRISTINA ALVAREZ-QUINONES TORRES DROUGHT IN THARPARKAR: FROM SEASONAL TO FORCED MIGRATION
REFERENCES Articles –– Sattar, Adnan. 2014. Climate Change and Migration. Exploring the Linkage and what needs to be done in the context of Pakistan. Lead Pakistan. Occasional Paper Series 29. –– Shaikh, Sana F. 2014. Internally displaced persons: citizens’ rights in a world at the mercy of climate change. Human Rights Review. Retrieved: https://uclhumanrightsreview. wordpress.com/volume-i-studentarticles/internally-displaced-personscitizens-rights-in-a-world-at-themercy-of-climate-change (consulted on April 4th, 2015) –– World Food Programme. 2014. Alert on Alarming Food Security and Nutrition situation. Special Focus: Worsening Thar Drought Press Articles –– Di Nunzio, Jack. 2014. “Malnutrition and Chronic Water Scarcity Persist in Pakistan’s South-East. Future Directions International”. http://www. futuredirections.org.au/publications/ food-and-water-crises/28-globalfood-and-water-crises-swa/1704malnutrition-and-chronic-waterscarcity-persist-in-pakistan-s-southeast.html (consulted on April 8th, 2015) –– Hashim, Asad. 2014. “Pakistan’s Thar residents living on the edge”. http://www.aljazeera. com/indepth/features/2014/03/ pakistan-thar-residents-livingedge-2014315121120904102.html (consulted on April 4th, 2015)
SEM 2015 76
–– Khangharani, Sono 2014. “Drought in Thar: some more broken promises”. http://www.dawn.com/news/1132994 (consulted on April 4th, 2015) –– Kolhi, Chander. 2014. “Drought and migration: A brief story of Tharparkar”. http://www.dailytimes. com.pk/opinion/24-Mar-2014/ drought-and-migration-a-brief-storyof-tharparkar (consulted on April 4th, 2015) –– Shaikh, Saleem and Tunio, Sughra. 2014. “Slow response to famine claiming lives in Pakistan’s Sindh province”. http://www.trust.org/ item/20140314115423-0fxy2/ (consulted on April 8th 2015) –– Zofeen T., Ebrahim. 2014. “Migration seen through the prism of climate change”. http://www.dawn.com/ news/1129428/migration-seenthrough-the-prism-of-climate-change (consulted on April 8th, 2015) Reports –– Asian Development Bank. 2012. Addressing Climate Change and Migration in Asia and the Pacific. Mandaluyong City –– Consortium Management Unit. 2014. Drought Assessment Report. Districts Tharparkar and Umerkot. 26th October 1st November 2014 –– Hands Pakistan. 2014. 1st Situation Analysis Survey Report, District Tharparkar. March 2014. –– Jaggarta Social Welfare Organization (JSWO). 2014. Tharparkar Drought 2014. –– National Disaster Management
––
––
––
–– ––
––
Authority. 2013. National Disaster Reduction Policy. Pakistan Water Partnership. 2014. Aide Memoire. Fact Finding Mission and Drought Master Planning Appraisal Mission. April 16– April 21, 2014. Tharparkar Drought Pakistan Nutrition Coordination Working Group. 2014. Nutrition, Food Security and Livelihood Emergency Tharparkar District, Sindh ProvincePakistan. Briefing Note – 20th March 2014. Provincial Disaster Management Authority. 2014. Drought status, actions taken and future initiatives. Sindh Coordination Meeting. Rahma Islamic Relief. 2015. Tharparkar. Situation Assessment. February 2015. Thardeep Rural Development Programme (TRDP). 2014. Situation Assessment on Drought. Tharparkar and Umerkot. Monitoring and Evaluation Section. United Nations Pakistan. 2014. “The predicament of governance: drought in Sindh province”. UNRCO Mission report 9 –11 December. One UN Programme II (2013 – 2017)
Web pages –– National Disaster Management Authority: http://www.ndma.gov.pk –– Provincial Disaster Management Authority: http://www.pdma.gov.pk –– Pakistan Meteorological Department: http://www.pmd.gov.pk –– United Nations Framework Convention on Climate Change: http://unfccc.int
LINH NGUYEN
Cancer Villages in China
I
n recent decades, China has achieved rapid growth with an annual increase in GDP of 8 to 9 percent, turning this country into one of the biggest and most powerful economies in the world (World Bank, 2007). However, this process of rapid industrialisation was also developed at the expense of nationwide environmental degradation; from the smog in big cities to land and water chemical contamination. Furthermore the benefits and profits of industrialisation are mostly reaped by a small urban population while at the opposite end of the spectrum, are “cancer villages” with some of the most helpless populations in China. This study will serve as one of the first investigations into cancer villages in the migration field and provide an initial understanding of the combination of environmental, economic and political factors that influence the aspiration and action of migration/non-migration of the concerned populations. It does so while noting that migration is not a long-term solution for cancer villages as it does not solve the problem of pollution. Instead, migration can be considered as a kind of shortterm pain-relief for vulnerable groups while waiting for the clean-up process to be realised. Understanding migration/non-migration aspects of cancer villages contributes to the understanding of strategies and reactions of the local residents and helps policy makers to provide support structures for both migrants and non-migrants to reduce the short-term and long-term impacts of environmental destruction. Part 1 will deal with the cause and development of the “cancer village” phenomenon. Part 2 gives arguments for considering this phenomenon as a migration issue; villagers are divided into different groups based on their aspiration and ability to migrate. Part 3 will focus on the group that aspires to move, and explore the economic and political factors that limit people’s capacity to do so.
1. THE “CANCER VILLAGE” AS A RISING PHENOMENON There is no official definition and scientific diagnosis of a “cancer village” due to the lack of data and research (Yu and Zhang, 2009). With the increasing concern and interest in this subject, the typical definition of such a phenomenon is simply: communities with greater rate of cancer than the expected rate (e.g. Liu, 2010; Lorawainwright, 2015a; McBeath et al., 2014). Cancer villages are considered to be a result of the “grow (pollute) first, clean up later” approach of Chinese leaders without considering the environmental and social impacts such as health, poverty, equality, and justice (Liu, 2013b). This development strategy is embedded in the famous and debateable theory of the environmental Kuznets curve (1955), which claims that pollution rises during the initial industrialisation period and automatically falls as a country reaches post-industrial levels due to a change in the composition and techniques of production (Grossman and Krueger, 1995). This theory has been criticised as it would undermine policy makers’ focus on environmental law, which may lead to serious ecological and social damage (Dasgupta et al, 2002; Panayotou, 1997). China is not the only example proving the failure of this theory; such crises have also been experienced in many other countries during their development process such as Eastern European States and republics of the former Soviet Union or some Asian economies like Malaysia, Thailand and Korea (Economy, 2004; Perout, 1995). Research and reports on cancer linked to pollution in China started to emerge in the 1970s but it was only from the end of 1990s and early 2000s that cases of
SEM 2015 77
ASIA-PACIFIC
LINH NGUYEN CANCER VILLAGES IN CHINA
cancer villages, such as Shangba or Xiaojizhuang, caught the attention of media and NGOs (Liu, 2010; McBeath et al, 2014; Watts, 2010; Watts, 2008). Cancer villages are mostly linked with the chemical industry, paper factories, or resource extraction and processing (Lora-Wainwright and Chen, 2015). Since available official information is rather limited, there have been varied attempts by researchers and activists to map the cancer villages such as those undertaken by Deng Fei and Lee Liu (Watts, 2010; Liu, 2010). Their maps show a concentration of cancer villages lying in Eastern China, with a strong correlation between the high percentage of cancer villages downstream and large industrial activities upstream. One famous example is the Huai River Delta, home to tens of thousands of small factories, which freely dump their waste into the river causing large-scale health issues, damage to fisheries and crop failures, thus affecting the lives of over 150 million people in Henan, Anhui and Jiangsu Provinces (Economy, 2004). In Huangmenying village along the Huai River, around 80% of young people are ill all year round (Liu, 2013a). The problem is worsened by the poor management of dams and reservoirs along the river, creating flooding and limiting the river’s capacity to dilute the pollutants (Economy, 2004). Heshan village in Hunan Province is another example: the water is heavily polluted by arsenic, listed as carcinogenic to humans by the World Health Organisation, from mines and chemical plants (Lee, 2014). In the past two decades, 157 villagers have died of cancer and another 190 have developed cancer due to arsenic poisoning out of a population of about 1,500 (Lee, 2014). Water and soil contamination also destroy local agriculture. Rice can no longer be grown and other plants also die when rain washes airborne pollutants into the fields (Lee, 2014). Longling villagers suffer from air pollution from nearby fertilizer and steel Figure 1. The cancer village phenomenon by province, China, 2009. (Liu, 2010)
SEM 2015 78
factories (Liu, 2010). With a population of 154, only four out of thirty families have not had a cancer victim while cancer killed four entire families (Liu, 2010). In Dongjing village, where a chemical industry is located, which produces phloroglucinol and o-chlorophenol, villagers stated that “the air became smelly, thick and unbearable, fish and prawns died, the water tasted strange and turned red” (Lora-Wainwright and Chen, 2015, p.16 ). The water tests showed that the amount of chloride was as high as 2000 times above the safety standard (Lora-Wainwright and Chen, 2015). After years of public speculation by local populations, international media and Chinese activist groups, the Chinese government first acknowledged the existence of the cancer village phenomenon in a report of the Ministry of Environmental Protection in 2013 (MEP, 2013; BBC, 2013). The report stated that the toxic chemicals have caused many environmental emergencies linked to water and air pollution and there are even some serious cases of health and social problems like the emergence of cancer villages in individual regions. However, two months later, health and environmental officials of China refused to validate the report’s wording, claiming that the acknowledgement of the environmental ministry was a mistake and restricted the usage of the “cancer village” term in local media (Kaiman, 2013). Yet, the government continuously displays efforts to address the pollution problem. In April 2014, the first amendments to the country’s environmental protection law in 25 years were passed, promising greater power for environmental authorities, harsher punishment for polluters and encouragement of non-government groups in environmental management (Kaiman, 2014; Bloomberg News, 2014). However, the gap between government policy and its implementation will still prove a major challenge for China over the coming years due to the top-down policy design, lack of political will, lack of capacity at the local level, and civil society’s limited power to speak out.
2. THE NECESSITY OF CONSIDERING CANCER VILLAGES AS A MIGRATION ISSUE There have been studies on the possible impact of migration on the creation of cancer clusters (e.g. Contreras, 2008; Admin et al., 2010) but none of them has analysed the influence of cancer clusters on the residents’ migrational aspirations and ability to migrate. In the case of cancer villages in China, resident relocation is often briefly mentioned as a solution alongside pollution mitigation, factory relocation and alternative sources of natural resources, which in most cases is drinking water (e.g. Yu and Zang, 2009). Clearly, reallocation is not the first choice for the government due to its costliness, the complication in planning for the relocation itself as well as supporting a post-relocation programme and the risk of other villages demanding similar treatment. Additionally, it is fair to say that relocation is only a short-term measure, as it does not solve the root cause of problem in a way that environmental restoration and environmental policy enforcement would do. However, it is hard to ignore the existing and urgent demands of residents in cancer villages to be relocated, especially where alternative distribution of critical resources such as farming soil, clean water or clean air is difficult. Furthermore, the involuntary migration of villagers, without support from the government or other parties, usually lacks the capacity and skill to help people to sustain themselves financially. This will create a social burden and instability in the destination. This is especially true for many villagers in cancer villages, who were previously farmers with limited education. Yet, there are also villagers who do not move despite suffering from environmental hazards, due to their lack of capacity to migrate. Considering the scale and the possibility of an increase in the number of cancer villages, both cases are undesirable for the long-term development of the country. As a result, cancer villages and migration issues require better understanding by policy makers in order to provide appropriate
SEM 2015 79
ASIA-PACIFIC
LINH NGUYEN CANCER VILLAGES IN CHINA
support structures and to minimise individual (both migrants and non- migrants) and societal costs. In slow onset cases of environmental degradation in cancer villages, populations can be categorised by their willingness and their ability to move, which is the result of various factors involving their economic and political situation (Bates, 2002). Aspiration for resettlement does not only depend on the pollution level but also on their perception of the possibility to win over polluters, which is largely based on the support of government and non-government actors such as the media, NGOs, educated leaders as well as the economic reliance of villagers themselves on the industries in question (Lora-Wainwright et al., 2012; Yang and Lennon, 2010; Tilt, 2013). In cases with support from third parties and some of the leading villagers usually involving the most educated individuals – villages actually did continuously fight to put a stop to pollution (for example, the cases of Qiugang and Shangba villages). As a result, they were more willing to stay in their polluted village with the hope of obtaining justice, and waiting for the recovery of their land. Others might decide to stay even without the hope of improving their living standards, usually older people who have an emotional connection to their homeland (Horn, 2013), or because their status and privileges in the village would drop significantly were they to relocate to a city, especially for elderly males (Carr, 2005). Such cases can be listed as “voluntary immobility”. On the other hand, previous experiences of unsuccessful protests could also dampen villagers’ faith in the possibility of state protection, and discourage their attempts to stop pollution (Lee, 2014; Liu, 2011; Liu, 2013a). Additionally, the difficulties in proving a causal link between cancer and a specific pollutant in court also motivated villagers to reframe their demands to polluting firms and the local government, shifting from demands for a cleaner environment and better health, to demands for financial compensation for losses incurred (Lora-Wainwright et al, 2012). Both cases might lead to the wish to move as an escape from pollution. However, the aspiration to migrate does not necessary lead to the act of migration due to differences in the ability to move from villager to villager. Migrants from cancer villages can be categorised as one type of environmental refugees: “people affected by the gradual deterioration caused by anthropogenic alteration of their environment” (Bates, 2002 p. 473; El – Hinnawi, 1985). Two categories of environmental displacement can be discerned: temporary displacement due to disasters or permanent displacement due to drastic environmental changes (El – Hinnawi, 1985). Among cases of migration from cancer villages, resettlements were mostly self-organised and rarely received any state support. Meanwhile, remaining cases, who “wish to move but remain in situ”, find themselves in a situation of “involuntary immobility” (Jónsson, 2011, Black and Collyer, 2014). According to Bates (2002), the poor are normally the most vulnerable to environmental disruption which leads to migration. In many cancer villages, the poorest and most vulnerable groups are usually those that do not have sufficient means to relocate, locking them into a downward spiral of poverty and health crises.
3. STRUGGLING TO MOVE 3.1 Environmental refugee: the absence of official reports
Large-scale centrally organised evacuation due to a toxic environment has been recorded in other countries as well as in China. In the U.S., 950 families in Love Canal were permanently relocated using government funds due to toxic waste disposal in 1980 (Brown, 2011). More recently, the 2,000 or so residents of Tuzköy have been re-settled by the Turkish government since 2010 due to widespread cancer and lung disease linked to erionite, a rare and highly toxic mineral present in local rock (Christie-Miller; 2013). Relocation due to environmental degradation in China
SEM 2015 80
is rather rare and action undertaken is usually slow and belated, following years of public and media speculation and the revelation of serious consequences. In 2009, 150,00 residents in Jiyuan, Hebei Province were relocated after more than 1,000 children had tested positive for lead poisoning (BBC, 2009; Liu, 2010). In 2009, the project was expected to cost 1bn Yuan ($146m) and was to be paid for by the lead company (BBC, 2009; Liu, 2010). However, no clear timetable for relocation was set nor any official report published on the movement provided. In the cases specifically related to cancer villages, however, there are no official reports relating to relocation. This may be due to the sensitivity and widespread nature of the issue. As 499 villages have been identified as “cancer villages”, clearly relocating each and every member of the affected communities is an enormous challenge for the government (Liu, 2010). Furthermore, the relocation of one village may lead to increasing demand for similar treatment from other villages, which would potentially increase existing tensions and social instability. Such reasons may motivate the government to refuse to acknowledge the problem of cancer villages and prevent related information from being published. Many media outlets, researchers and NGOs reporting on cancer villages mention the obstruction of the local governments regarding their efforts to approach villagers and collect data (e.g. Yang and Lennon, 2010; Brown, 2012). Another challenge for data collection related to environmental refugees from cancer villages is that, due to the lack of a centralised relocation programme, most of the movement is self-organised. It can be either totally self-financed by villagers, or partly financed by the government or by compensation from polluters in cases where villagers successfully gained government recognition of pollution or launched a successful lawsuit, even the amount of such compensations is usually extremely low (such as the case of Qingpuling village – Li, 2014; Liu, 2010). In the context of slow onset environmental degradation like the situation in cancer villages, environmental hazards largely influence local economies, especially for farmers whose livelihoods are more sensitive to natural conditions. This also infers difficulty as to data collection since the decision to move will rarely be exclusively due to environmental factors, but also due to economic reasons (Bates, 2002). Moreover, the rapid and unprecedented process of urbanisation in China has attracted a large flow of labour from rural to urban areas, which makes it extremely difficult to distinguish between environmental and economic factors leading to migration. This difficulty is especially true for the young and educated groups, who usually have a greater ability to move and are the most likely to move irrespective of the pollution issue. In the case of Heshan, where the environment has been intoxicated by mines and chemical plants, young individuals have moved out of the village while old and retired people remained (Lee J., 2014). On the other hand, in the cases of farmers who are forced to leave their hometown without the necessary transferable skills to find employment in their destination, such relocation may provide a better living environment, but it is unlikely to elevate migrants out of poverty. Unplanned large-scale rural-urban migration due to environmental issues will add to the existing tension around urbanisation issues such as food security, health, education, already facing China (Chen, 2007; Gong et al, 2012; Quan, 1991). Finally, the absence of data might reflect the absence of relocation itself, suggesting the existence of a broad category of involuntary immobility.
3.2 Involuntary immobility or the “cancer village” dilemma
The lack of migration flows in the context of a heavily polluted environment raises the issue of involuntary immobility. This phenomenon is not only an environmental health problem but is also deeply rooted in social, cultural and political issues. People are trapped in a toxic and hazardous living environment due to their poverty, their lack of power to speak out and the deep-seated inequality in the fast developing
SEM 2015 81
ASIA-PACIFIC
LINH NGUYEN CANCER VILLAGES IN CHINA
economy. Tragically, the three factors are both initially the cause of the cancer village phenomenon and also the reasons that lead to the prolongation of the issue. These self-propagating problems have locked cancer village victims in a downward spiral of poverty and health crisis without the ability to relocate. The following sub-section will analyse the different barriers and constraints that prevent people from having recourse to migration. It is important to mention that that these barriers are rarely separate but rather intertwined and have a cause and effect relationship.
Poverty and social inequality
Poverty in rural areas coupled with the socio-economic policies of the Chinese government, which deepen social inequality, partly cause the widespread pollution in villages. The imbalanced environmental policy and clean-up programmes which focused on protecting citizens in cities and the lax implementation and monitoring of pollution in rural areas created the movement of toxic plants from the municipal districts of modern cities to nearby rural areas (Liu, 2013a; Watt, 2010). Liu (2013a) described how the 1996 “Developing Model Cities Programme”, introduced by the Chinese government as a response to the environmental crisis, did not stop pollution but instead drove the movement of polluting factories from urban to rural areas. The thirst for development of both local government and residents and the lack of monitoring capacity allowed for an extremely limited enforcement of environmental regulation in villages (Lora-Wainwright and Chen, 2015; Liu, 2013). This enabled factories to pollute and avoid investment in waste management. When the consequences of their pollution are revealed, local governments have their hands tied due to their dependence on industrial tax revenues, while the residents struggle with health problems, lose their livelihoods, and thus suffer from increasing poverty (Lora-Wainwright and Chen, 2015; Liu, 2001). In some cases, the livelihoods of local villagers also greatly depends on the polluting plants, either directly through employment, or through compensation, which will be discussed in greater detail below (Lora-Wainwright and Chen, 2015; Van Rooij B. et al, 2012). These factors also discourage victims from taking action to either stop pollution or relocate. The ramifications of pollution have also weakened the financial capacity of villagers to relocate. Commonly, a high proportion of residents in cancer villages were farmers whose income suffered significantly in the polluted areas as their agriculture resources, such as water and soil, were destroyed (Liu, 2015). These residents are also most exposed to pollution due to their lack of knowledge, their limited financial capacity to protect themselves – for instance by buying clean water, or migrating given that their daily life requires more contact with contaminated water and soil. In many families, cancer victims were the main source of income, a fact which significantly reduced household incomes and was exacerbated by the need for expensive treatment and extra care from others (Philips, 2015; McKenzie, 2013; Wolf, 2014; Horn, 2013). The cost of treatments can as amount to the equivalent of several years’ income for villagers, forcing them to sell land, borrow money or use up their savings (Liu, 2015; Watts, 2010; Lee, 2014; Brown, 2012). Even comparatively wealthy households experienced financial difficulties after paying for their family members’ treatment, leaving them with no ability to pay back debts, and thus facing the risk of having to sell their property (Brown, 2012; Lee, 2013; Watts, 2010). Due to the lack of medical care, sanitation, financial wherewithal, and environmental awareness in rural areas, many victims are diagnosed with cancer at a very advanced stage, which increases both medical costs and the mortality rate (Liu, 2013a; Yang and Fang, 2006). Health damages coupled with financial crises deepens households’ povert levels. Furthermore, residents in rural areas are also less likely to have formal education and skills that can be transferred to other sectors, which could enable them to find jobs in cities. Their illness, serious poverty and lack of transferable skills in turn magnify their vulnerability to environmental deterioration without the capacity to relocate (Black and Collyer, 2014).
SEM 2015 82
Little power to speak out and a lack of government support
Villagers that are struggling to finance their relocation also face challenges in gaining acknowledgement and support from the government as well as from polluters to facilitate their relocation to a new area. This is firstly due to the lack of knowledge and difficulties in providing valid scientific evidence that would demonstrate the correlation between pollution and health problems. As previous studies show, villagers’ data collection methods are rather simple: listing the number of deaths diagnosed as being due to cancer, keeping pictures of their dead livestock and crops, collecting samples of contaminated water and soil (Lora-Wainwright and Chen, 2015; Sant, 2013). Such practices were described by Lora-Wainwright and her colleagues (2012) as being of a politically sensitive nature which serves to attract attention and demand redress, and which earns villagers attention from the media and activist groups and, in turn, provides them with a degree of political capital which they otherwise be unlikely to have. However, they have no scientific evidence that links the illness to pollution, which is a major obstacle for villagers in gaining recognition by the government and the courts (Lora-Wainwright et al, 2012; Phillips, 2015). Furthermore, the villagers also face the problem of collecting data from industrial sites. In Dinbang, for example, villagers are not legally entitled to enter the factory or to demand full records of a factory’s emissions (Lora-Wainwright et al, 2012). Identifying which pollutants lead to cancer, and the factories from which they are emitted in regions where there are multiple polluters, is yet another challenge for villagers. Huai River is an extreme example where there are tens of thousands of factories along the river basin freely dumping both treated and un-treated waste into the river (Economy, 2004). This makes it extremely difficult to identify specific cancer-causing agents in amongst the various disease-causing agents (Yang and Zhuang, 2014). Similarly, Wuli village in Zhejiang province, the centre of China’s textile industry, and Xinglong village in Luliang County, both suffer from waste dumping by more than one polluter (McKenzie, 2013). The challenge of proving the correlation between cancer and a particular pollutant is not only faced by villagers but also by scientists and professors. Song Weimin, a specialist in environmental health at Fudan University in Shanghai, has stated that as the list of physical, chemical and biological factors continues to grow, the connection between cancer and pollutants has become, against all obvious logic, harder to prove (Horn, 2013). Secondly, victims do not always receive support from the local authorities, who play an important role in the success of villagers in claiming governmental recognition and compensation from polluters for their relocation. China has created over 100 national environmental laws and regulations but enforcement is mostly left to local officials, who are faced with a potential conflict of interest due to corruption and the tax revenues that local authorities receive from polluters (Yang and Lennon, 2010). Lora-Wainwright and Chen (2015), in their study of nine cancer village sites, concluded that the amount of government support to villagers’ campaigns varies between different levels of government. For other cases, village leaders can also prevent bottom-up regulation (Liu, 2010). In many cases, village leaders protect industries and prevent local protests due to the fear of losing tax revenue from polluting factories and in order to maintain order (Lora-Wainwright and Chen, 2015; Liu, 2001). As mentioned above, factories have moved to poor rural areas and many of them have become the main source of revenue for local governments as well as providing employment for residents. Corruption has been reported by villagers. The village leader in Tazu initially organised a joint petition to the town government complaining about the pollution from Linchang, a state-own factory; but villagers subsequently claimed that he received gifts from the factory to stop pursuing the petition (Van Rooij et al, 2012). Sometimes, village officials are owners or managers of the polluting enterprises thus creating a conflict of interest (Lora-Wainwright and Chen, 2015). At the township and county
SEM 2015 83
ASIA-PACIFIC
LINH NGUYEN CANCER VILLAGES IN CHINA
level, Lora-Wainwright and Chen (2015) claimed that there are mostly always negative responses to the villagers’ complaints at the initial stage. The most common outcome, as they pointed out, is the avoidance of responsibility and placement of pressure back on to local governments to maintain social stability and to deal with pollution. In the case of Qiugang, the village Party Secretary received an order to stop the villagers from reporting about pollution to Beijing and the protestors faced violent threats from factory owners and the local government (Yang and Lennon, 2010). Villagers’ protests were blocked by the authorities and deemed a threat to the peace and stability of the community (Watts, 2010; Lora-Wainwright and Chen, 2015). Support of third parties such as the press, NGO and researchers is an important force empowering cancer village victims to claim for compensation and relocation. Lora-Wainwright (2010) claimed that it is only when an intensive level of press coverage does threaten the status quo of a region and potentially damages its attractiveness to investors and tourists, that pressure and funding exerted from a higher level enable and require the township and counties to take action, such as in the case of Shangba and Huangmengying. There are an increasing number of reports on cancer villages in well-known Chinese media, which are mostly State-controlled, as well as in the international media, especially in the first half of 2013 after the official citing of cancer villages in the Ministry of Environment’s document (Liu, 2010; LoraWainwright and Chen, 2015). NGOs, such as Greenpreace, also support villagers both indirectly, by running campaigns or raising awareness, and directly, by supporting data collection and defence in court. The recent victory of Qingpuling villagers in a legal battle against a local waste processing plant was achieved after 5 years thanks to continuous support from a volunteer environmental lawyer from the Center for Legal Assistant to Pollution Victims (Philips 2014). In the case of Qiugang, villagers received support and advice from Green Anhui, an NGO founded in 2003 by 17 students, to bypass the barriers and threats of polluters as well as local government and to push for the relocation of toxic plants. Cancer villages have also received attention from Chinese and foreign researchers, which helped to greatly improve the standard of research concerning the phenomenon and to bring cancer village issues into formal discussions. Researchers such as Lora-Wainwright, Ajiang Chen and Lee Liu spent years in the field to follow up different cases, collect data and bring a better understanding of cancer villages to light (Lora-Wainwright and Chen, 2015; Liu, 2010). However, such successful cases are few and far between as local governments largely prevent the involvement of third parties. Mostly all media, researchers and NGOs reporting on cancer villages talk about the obstruction from local governments with regard to approaching villagers and collecting data (e.g. Yang and Lennon, 2010; Brown, 2012). Local media was barred from reporting an accident by order of the local government (Van Rooij et al, 2012; Economy, 2004). It is especially difficult for foreign organisations or individuals to carry out research in highly sensitive cancer villages, and this has generated significant controversies (Lora-Wainwright and Chen, 2015; McBeath et al, 2014). Not only outsiders but also activists from the villages have been closely monitored by the State’s and factories’ security officers to prevent them from reporting to the central government or providing information to third parties. In Qiugang, villagers were not allowed to send their complaints to Beijing and a protester was violently threatened (Yang and Lennon, 2010). Famous activists such as Wei Dongying or Hou Daishan have been threatened and prevented from interacting with outsiders (Wolf, 2014; Sant, 2013). In cases where villagers won lawsuits against polluters, the difficulties in proving the correlation between cancer and pollutant made villagers limit their redress to only economic damages, putting aside health damages (Liu, 2011, Lora-Wainwright et al, 2012). This resulted in a very low level of compensation, which does not provide them with the sufficient financial capacity to move. In the case of Qingpuling village, for example, the successful legal proceedings against a toxic plant only led to the
SEM 2015 84
payment of 6 million yuan ($976,626) by the factory shared among 600 villagers - a mere 6,000 yuan per person - and no concrete link has been established between the villagers’ illnesses and the pollution (Phillips, 2014; Li, 2014). In Zhumuzu village, the requirement for relocation of villagers after 10 years was met with a payment of 200,000 yuan from the government to each family (Global Times, 2015). However, this amount is far from enough for villagers to purchase an apartment elsewhere (ibid.). Furthermore, while such successful legal proceedings may lead to relocations or the closing-down of polluting enterprises, they do not necessarily require such enterprises to clean up the effects of pollution. The documentary on the situation in Quigang village is a case in point; after years struggling with the population and fighting against industries as well as their local government, Quigang villagers were finally successful in having polluting factories move out of their area but then faced the new challenge of resolving the problem of chemical residues, which may require a new court case (Yang and Lennon, 2010). Similarly, villagers in Heshan are still suffering from cancer and agricultural damages caused by the poisoning of water and soil by arsenic left behind by mines and chemical plants that had been operating in the area since the 1950s and which closed down in 2011 due to their pollution levels (Lee, 2014). In such cases, villagers may end up becoming increasingly dependent on the compensation provided by polluting companies as their source of income, which dampens their courage to fight to put a stop to pollution, trapping them in a spiral of health problems and economic poverty that increasingly undermines their ability to move (Van Rooij et al., 2012).
CONCLUSION Due to the degradation of the living environment and to the lack of power to speak out, the strategies of populations in cancer villagers are not a simple matter of whether to move or to stay, also including the murky issue of whether or not to continue fighting for a clean environment. Their aspiration and ability to migrate are largely formed by their expected outcomes from protest, which is influenced by the support of internal parties, such as village leaders or educated villagers, or external parties, such as the media and NGOs. Among migration groups, the respective economic and environment-related aspirations to relocate are difficult to untangle. Moreover, many environmental refugees from cancer villages are farmers whose education and skills are too limited to earn a stable living in their new destinations. The most vulnerable group is the population left behind, forced to bear the health damage and heightened poverty due to its inability either to move or to obtain alternative resources, which in turn worsens the situation of such villagers. Both cases are undesirable due to the potential to increase inequality as well as to create social strain and instability. To address this issue, integration between environmental and migration policy is critical. This means that, besides the ongoing improvement of environmental policy and its enforcement, more attention should be paid to protecting the basic needs of immobile populations in cancer villages and also to enable relocation for the most vulnerable cases while the pollution problem is being addressed. Facilitating the participation of civil society and enabling the collection, publication and dissemination of information will moreover strengthen the victims’ power to speak out.
SEM 2015 85
ASIA-PACIFIC
LINH NGUYEN CANCER VILLAGES IN CHINA
REFERENCES Books: –– Lester R. Brown, 2011, Chapter 6. Environmental Refugees: The Rising Tide. World on the Edge: How to Prevent Environmental and Economic Collapse. US: W.W. Norton & Company –– Economy E.C., 2004, The River Runs Black. USA: Cornell U. Press 2004. –– J.R.Contreras, 2008, Cancer Clusters: Challenges in Rural Areas. The Effectiveness of Current Policies, Methods, Resources, and Impact on Small Area Analysis. USA: U. of Utah. –– Liu L., 2013, Environmental policy is Social Policy – Social Policy is Environmental Policy. USA: Wallimann, Isidor ed: 2013. Ch.9. Chinese Model Cities and Cancer Villages: Where Environmental Policy Is Social Policy. –– Yang & Dafang Zhuang, 2014, Atlas of the Huai River Basin Water Environment : Digestive Cancer Mortality. PRC: Yang, Gonghuan, Zhuang, Dafang. –– Articles: –– Admin et al., 2010, Epidemiologic Mapping of Florida Childhood Cancer Clusters. [online] Available at: http:// uwf.edu/ramin/pediatric%20blood%20 and%20cancer%20article.pdf (viewed April, 2015) –– Bates D.C., 2002, Environmental refugees? Classifying Human Migrations Caused by Environmental Change, Population and Environment, 23(5), p. 465-477 –– Black and Collyer, 2014, Populations ‘trapped’ at times of crisis, Forced Migration Review, 45 –– Carr E.R., 2004, Placing the environment in migration: environment, economy, and power in Ghana’s Central Region, Environment and Planning, 37(5), p. 925-946 –– Chen J., 2007, Rapid Urbanization in China: A Real Challenge to Soil Protection and Food Security, CATENA, 69(1), p. 1-15. –– Chuanmin Y. and Qianhua F., 2006, A Village of Death and Its Hopes for the Future, China Rights Forum, 1, p. 25-29 –– Dasgupta S. et al, 2002, Confronting the Environmental Kuznets Curve, The Journal of Economic Perspectives, 16 (1), p.147-168
SEM 2015 86
–– El – Hinnawi, E., 1985, Environmental Refugees. Nairobi, Kenya: United Nations Environmental Programme –– Gong P. et al, 2012, Urbanisation and Health in China, The Lancet, 379 (9818), pp. 843-852 –– Grossman and Krueger, 1995, Economic Growth and the Environment, The Quarterly Journal of Economics, 110(2), p. 353-377 –– Jonsson G., 2011, Non-migrant, sedentary, immobile, or ‘left behind’? Reflections on the absence of migratioin. International Migration Institute, 39 –– Kuznets, S., 1955, Economic growth and income inequality. American Economic Review, 49, p. 1-28 –– Liu L., 2010, Made in China: Cancer Villages. Environment Science and Policy for Sustainable Development. [online] Available at: (viewed April, 2015) –– Liu L., 2013, Geographic approaches to resolving environmental problems in search of the path to sustainability: The case of polluting plant relocation in China. Applied Geography 45, p. 138-146 –– Lora-Wainwright A., 2010, An Anthropology of ‘Cancer Villages’: villagers’ perspectives and the politics of responsibility, Contemporary China, 19(63), p. 79-99 –– Lora-Wainwright A., 2015, Health, illness and welfare in rural China, School of Interdisciplinary Area Studies, Social Sciences Division, [online] Available at: (viewed April, 2015) –– Lora-Wainwright A. and Chen, 2015, China’s cancer villages: contested evidence and the politics of pollution (unpublished manuscript) (on file with author) –– Lora-Wainwright A., Zhang Y., Wu Y. and Van Rooij B. (2012), Learning to live with pollution: the making of environmental subjects in a Chinese
––
––
––
––
–– ––
––
––
––
industrialized village. The China Journal, 68(July 2012), p. 106-124 McBeath J.H. et al, 2014, Environmental Pollution, Cancer Villages and the State’s Response. American Association for Chinese Studies, [online] Available at: (viewed April, 2015) MEP, 2011, The 12th Five-Year Plan for the Environmental Health Work of National Environmental Protection. Ministry of Environmental Protection of the People’s Republic of China. [online] Available at: (viewed April, 2015) Panayotou T., 1997, Demystifying the Environmental Kuznets Curve : Turning a Black Box into a Policy Tool, Environment and Devvelopment Economics, 2 (4) Perout A., 1995, Environmental Refugees: Defining Environmental Migrants and Long-Term solution to Deal with Environmental Migration. Concordia University. [online] Availble at: http://spectrum.library. concordia.ca/114/1/MM05105.pdf (viewed April, 2015) Quan Z. X., 1991, Urbanisation in China, Urban Studies, 28 (1), p. 41-51 Tilt B., 2013, Industrial Pollution and Environmental Health in Rural China: Risk, Uncertainty and Individualization, The China Quarterly, 214, p.283-301 Van Rooij B. et al, 2012, The compensation trap – The limits of Community Based Pollution Regulation in China, Pace Environmental Law Review, 31(3). [online] Available at: < http://digitalcommons. pace.edu/cgi/viewcontent. cgi?article=1703&context=pelr > (viewed April, 2015) Watts J., 2008, China’s Environmental Health Challenges, The Lancet, 372(9648), p. 1451-1452 Yu J., Zhang S., 2009, The Chinese Cancer Village Phenomenon and
Its Reflection of Health-Related Environmental Pollution Problems. Proceedings of China Environmental Science Society Annual Conference 3: 880–889. [online] Available at: http:// www.kadinst.hku.hk/sdconf10/ Papers_PDF/p166.pdf (viewed April, 2015) Newspaper articles: –– BBC, 2009, “China to move 15,000 from smelter”. In BBC. London UK [online] Available at: < http://news. bbc.co.uk/2/hi/asia-pacific/8313711.stm > (viewed April, 2015) –– BBC, 2013, “China acknowledges ‘cancer villages’”. In BBC. China [online] Available at: < http:// www.bbc.com/news/world-asiachina-21545868 > (viewed April, 2015) –– Bloomberg News, 2014, “China takes on pollution with biggest changes in 25 years”. In Bloomberg News. [online] Available at: < http:// www.bloomberg.com/news/ articles/2014-04-24/china-enactsbiggest-pollution-curbs-in-25-years > (viewed April, 2015) –– Christie-Miller A., 2013, “Turkey: End in Sight for “Cancer Village”. In eurasianet.org. Turkey [online] Available at: < http://www.eurasianet. org/node/66982 > (viewed April, 2015) –– Horn, 2013, “Recovery is slow in rural China’s ‘cancer villages’”. In McClatchyDC. Washigton DC [online] Available at: (viewed April, 2015) –– Jingyang L., 2013, “Study confirms cancer village fears in east China”. In chinadialogue. China [online] Available at: < https://www.chinadialogue.net/ blog/6551-Study-confirms-cancervillage-fears-in-east-China/en > (viewed April, 2015) –– Kaiman J., 2013, “Inside China’s “cancer villages””. In The Guardian. Yanglingang [online] Available at: (viewed April, 2015) –– Kaiman J., 2014, “China strengthens environmental laws”. In The
––
––
––
––
––
––
––
Guardian. Beijing [online] Available at: < http://www.theguardian.com/ environment/2014/apr/25/chinastrengthens-environmental-lawspolluting-factories > (viewed April, 2015) Lee J., 2014, “Arsenic pollution sows despair in Chinese cancer village”. In Reuters [online] Available at: < http:// in.reuters.com/article/2014/06/23/ uk-china-environment-healthidINKBN0EY16S20140623 > (viewed April, 2015) McKenzie D., 2013, “In China, ‘cancer villages’ a reality of life”. In CNN. [online] Available at: < http://edition. cnn.com/2013/05/28/world/asia/ china-cancer-villages-mckenzie/ > (viewed April, 2015) Philips, 2015, “Inside China’s toxic Village of Windows”. In The Telegraph, UK [online] Available at: < http://www.telegraph.co.uk/news/ worldnews/asia/china/11416830/ Inside-Chinas-toxic-Village-ofWidows.html > (viewed April, 2015) Phillips T., 2014, “Chinese ‘cancer village’ scores rare victory over polluters”. In The Telegraph [online] Available at: < http://www.telegraph. co.uk/news/worldnews/asia/ china/11061201/Chinese-cancervillage-scores-rare-victory-overpolluters.html > (viewed April, 2015) Qian L., 2014, “Villagers unhappy with toxic plant compensation”. In ShanghaiDaily.com [online] Available at: < http://www.shanghaidaily.com/ national/Villagers-unhappy-withtoxic-plant-compensation/shdaily. shtml > (viewed April, 2015) Qian, 2014, “Villagers unhappy with toxic plant compensation”. In ShanghaiDaily.com Shanghai [online] Available at:< http:// www.shanghaidaily.com/national/ Villagers-unhappy-with-toxic-plantcompensation/shdaily.shtml > (viewed April, 2015) Sant S.V., 2013, “Wei Dongying, the ‘Erin Brockovich’ of China, says in spite of gov’t vow to address pollution, her ‘cancer village’ is still a killer”. In CBS News [online] Available
––
––
––
––
at: < http://www.cbsnews.com/news/ wei-dongying-the-erin-brockovichof-china-says-in-spite-of-govt-vow-toaddress-pollution-her-cancer-villageis-still-a-killer/ > (viewed April, 2015) Souvid Datta, 2015, “Photographs of China’s ‘Cancer Villages’”. In Vice [online] Available at: < http://www. vice.com/read/photographs-ofchinas-cancer-villages > (viewed April, 2015) Watt J., 2010, “China’s ‘cancer villages’ reveal dark side of economic boom”. In TheGuardian. Xinglong [online] Available at: < http://www. theguardian.com/environment/2010/ jun/07/china-cancer-villagesindustrial-pollution > (viewed April, 2015) Watts, 2010, “China’s ‘cancer villages’ reveal dark side of economic boom”. In TheGuardian. Xinglong [online] Available at: < http://www. theguardian.com/environment/2010/ jun/07/china-cancer-villagesindustrial-pollution > (viewed April, 2015) Yingying Z., 2011, “The shadow over rural China”. In chinadialogue [online] Available at: < https://www. chinadialogue.net/article/4098-Theshadow-over-rural-China > (viewed April, 2015)
Videos: –– Brown A., 2012, In SBS One [online] Available at: < http://www.sbs.com. au/news/dateline/story/chinascancer-villages > (viewed April, 2015) –– Wolf E., 2014, In DW [online] Available at: < http://www.dw.de/chinascancer-river/av-17371227 > (viewed April, 2015) –– Yang R. and Lennon T., 2010, [online] Available at: < https://www.youtube. com/watch?v=NeYGHpyJKK4&list =PL87D6049346C9C735&index=1 > (viewed April, 2015) Interview: –– 1. Lican, 2015, Discussion by email.
SEM 2015 87
SHUYU JIANG
Displacement and Resettlement Following the Ludian Earthquake in China
W
hile the memory of the Wenchuan earthquake is vivid in Chinese people’s memory, on 3 August 2014, a 6.5-magnitude earthquake devastated Ludian County in Yunnan Province in southwest China. According to the central government’s calculation (Government of the PRC, November 2014), 617 people were reported dead, 112 missing and 318,000 people were displaced. The earthquake was the largest natural disaster in China in 2014 and caused economic losses amounting to US$6 billion (ESCAP, 2014). This paper concentrates on displacement after the Ludian earthquake and the relevant solutions to it. The first part provides the background information as to why this area is vulnerable to natural disasters. The second reviews the impacts of the earthquake and how rescue and temporary migration were subsequently implemented. After analysing the short-term action, the third part focuses on long-term resettlement and rehabilitation in order to explore feasible solutions to different flows of migrants in the longer term. The paper notably establishes connections between environmental and economic factors before and after the migration process. On the one hand, an extensive thriving economy would exacerbate environmental risks, thus inducing more natural disasters and migration problems. On the other hand, given existing problems, environmental migration could represent a proactive solution for this underdeveloped area to obviate the vicious circle regarding its development and accelerate economic growth.
1. BACKGROUND INFORMATION 1.1. Country Profile – China
As shown in Figure 1, China is prone to droughts, floods, cyclones, earthquakes and various other types of natural disasters. Droughts are the most influential natural disaster and almost 100 million people are under threat from it. Next come cyclones, which mainly affect coastal areas, and then earthquakes and floods, which also touch about 10 million people. More seriously, rapid economic development and an expanding population bring about more environmental problems. All these factors aggravate the frequency of natural disasters and the subsequent difficulties regarding resettlement. It is estimated that “since 2008, China has experienced three disasters in which more than 3 million people were displaced, five disasters that 1 to 3 million people were displaced” (Lavell & Ginnetti, 2014).
SEM 2015 89
ASIA-PACIFIC
SHUYU JIANG DISPLACEMENT AND RESETTLEMENT FOLLOWING THE LUDIAN EARTHQUAKE IN CHINA
Figure 1. Absolute population exposure to hazards: China (Lavell & Ginnetti, 2014)
Figure 2. Population exposed to earthquakes in China (Lavell & Ginnetti, 2014)
source: UNEP/GRID-Geneva PREVIEW
Even though earthquakes threaten fewer people than droughts or cyclones, their impact should not be underestimated. China is vulnerable to earthquakes because it is located in both the circum-Pacific seismic belt and the Alpine-Himalayan orogenic belt. The deformation between the Pacific plate, the Indian plate and the Philippine plate jointly influence China’s tectonic features. The complexity of its tectonic makeup therefore results in the significant density, high frequency and wide range of earthquakes in China: “In all the continental areas around the world, about 1/4 to 1/3 big earthquakes took place in China in the 20th century” (China Earthquake Administration, 2013). A further observation regarding the regions which are frequently affected by earthquake (Figure 2) displays another difficulty in risk reduction. Besides the area around Beijing and Bohai Sea in north China, people in the middle and western part of Mainland China are more exposed to earthquakes. Meanwhile, the social and economic development of this area lags behind that of the costal area, hence funding and resources for risk reduction in the area are limited. This also adds to the difficulty in resettlement and rehabilitation after hazards and potentially hinders further development of these areas.
1.2. Ludian County as a vulnerable area
Like many other areas in western China, this area is prone to natural disasters as a result of its natural conditions, as well as the absence of a sustainable and concrete development plan. First of all, Ludian County suffers from harsh natural conditions. Located in a fault zone, the area is frequently affected by earthquakes. “Since 1900, there have been 15 earthquakes with a magnitude higher than level 6 in this area” (Government
SEM 2015 90
of the PRC, November 2014), The geological configuration is complex in this mountainous area with precipitous slopes, deep canyons and fragmented stratum. Moreover, its changeable climate results in many natural disasters. In dry seasons, people must rely on cisterns for their daily provision of water. Yet it so happened that the earthquake occurred during the rainy season in the basin of the Jinsha River so there is a high possibility of a series of secondary disasters in the wake of the earthquake. It has allegedly been reported that compared with the earthquake itself, more people died as a result of landslide, rocks, as well as flows of debris. Moreover, the unfavourable natural conditions impede economic development in this area. Yet, tough as the conditions are, agricultural productivity is low in this county. Regarding industrial development, the inauspicious natural conditions pose a threat to development, which requires strategic planning to minimise environmental impacts. However, in reality, overpopulation and overexploitation have contributed to serious soil-erosion, which has worsened environment problems. Firstly, an important source of economic revenues is the quarrying industry, and while this industry expands without sound regulation, it will inevitably have negative consequences for the environment. Secondly, the population density is 277 people per square kilometre (Ludan County Government, 2014) , which is twice the average density in Yunnan Province. As the population has already exceeded the ecological carrying capacity, management alone cannot solve all environmental problems. This area suffers from poverty. In the city of Zhaotong, “Within 11 districts and counties in this city, 10 are recognised as extremely poor based on national standards” (Bai Wenxue, 2014). In Longtoushan Town, which is the settlement most seriously effected by the disaster, “there are 51214 people, of which 6910 people are under poverty, 2650 people are under extreme poverty, 4360 are with low incomes” (Ludan County Government, 2014). The city cannot thus be expected to solve all of its development problems itself, as in a state of poverty, expenditure on more resilient infrastructure and other risk reduction measure is limited. For instance, most houses here are made from wood or adobe, which cannot resist strong earthquakes. Consequently, impoverished areas are more exposed to disasters and disasters exacerbate poverty. The economic development of Ludian County thus falls into a vicious circle: the underdeveloped economic and environmental conditions hamper development so that accessible water power and mineral resources are particularly important for economic growth, yet the reliance on these recourses potentially destroys the environment.
1.3 Absence of pre-existing disaster reduction measures
A UN ESCAP disaster review warned of the potential danger of “slow-onset disasters”, which are “less visible, as they are spread over time with multi-sectoral impacts” (UN ESCAP 2014). Such disasters constitute a major problem in this area, where stony desertification is gradually undermining livelihoods and threatening the safety of the population. The problem is accentuated by the lack of risk reduction measures on the one hand, and by the impracticability of conventional measures (such as consolidating houses or improving living conditions) on the other hand; migration could thus be a more realistic option. Figure 3 indicates two major problems in this affected area. Firstly, there is little coverage of forest to alleviate the negative consequence caused by overexploitation, and secondly, the absence of roads, railroads and other basic infrastructure would hinder any attempted rescue following the occurrence of a natural disaster. Certain funding has been devoted to both environmental management and migration. Ludian county launched a comprehensive management scheme concerning stony desertification from 2008 to 2013, “277.96 square kilometers of karst areas have been managed, which accounts for 34.5% of the total area”(Junyi Chen, 2013). As the project is particularly costly and time-consuming, progress has been relatively
SEM 2015 91
SHUYU JIANG DISPLACEMENT AND RESETTLEMENT FOLLOWING THE LUDIAN EARTHQUAKE IN CHINA
ASIA-PACIFIC
slow. Moreover, in 2012 in Ludian County, 60 households migrated to other places as a result of the fragile ecological environment and poverty and 1.5 million Yuan has been devoted to this project (Yanquan, 2013). By way of comparison, in Qiaojia County in Zhaotong, 600 people benefited from this policy and 10 million Yuan was allocated in the same year (Yanquan, 2013). At the provincial level, in 2014 the Yunnan government started to rebuild houses in rural areas and began resettlement. However a mere 24.14% of programmes have been started and only 13.79% of them have been finished in Ludian County (Junli Zeng, Yongqin Yang, 2015). Consequently, poor disaster mitigation and the reluctance of environment migrants represent other underlying causes of the large casualties and economic losses provoked by the earthquake.
2. RESCUE AND EVACUATION AFTER THE EARTHQUAKE 2.1 Impacts of the earthquake
The intensity of the earthquake was high (Figure 5), reaching level IX1 in intensity at its epicentre in Ludian County. Qiaojia County and Huize County were also seriously affected, and the earthquake also had an impact on Guizhou and Sichuan Provinces, and, reportedly “in 10350 square kilometers of areas, the intensity exceeded level VI” (People’s Daily, August 2014). According to the data updated on the 4th August by the International Federation of the Red Cross (Figure 4), the earthquake has already resulted in 398 deaths, with a great deal of destruction, most of which was in Ludian County. Figure 4. Death toll after the earthquake Prefecture
country/District
Death
Missing
Zhaotong
Ludian
319
0
Qiaojia
55
0
Zhaoyang
1
0
Huize
122
3
Total
398
3
Qujin
Injured
1,801
Source: IFRC, August 2014
As discussed above, the fragile ecological environment in the affected area also contributed to many secondary disasters. A barrier lake was formed when the river was blocked by huge landslides caused by the earthquake, and the rising water level submerged the village in that area, which would have greatly endangered the lives of the 800 inhabitants had they not been evacuated beforehand (Earthquake Report, August 2014). Besides huge casualties, another feature of the earthquake was the tremendous damage to infrastructure: large amounts of basic infrastructure were destroyed, sealing off the affected area. Up to the 20th of August 16,158 machines and 8,951 personnel were involved in restoring transportation links, water supply, and electricity and telecommunications (Yan Wang, August, 2015).
1. In China, the intensity of an earthquake is measured from level 1 (weakest) to 12 (strongest). Signs of destruction of buildings occur when the level is higher than 6 (Author’s note).
SEM 2015 92
On the 4th August, the first dispatch of resources was sent to victims. However, floods, aftershocks and many other secondary disasters further debilitated the state of the already fragile infrastructure. Many repaired roads were damaged afresh, thus preventing other rescue forces and resources from entering the disaster area. Some resources were transported through aerial delivery by helicopters, and others were delivered by the army.
2.2 Organisation of the rescue process after the Ludian earthquake
At the central level, the Chinese government has established an overarching legal framework and coordinated work at different levels regarding the disaster response system: the “Law of the People’s Republic of China on Protecting Against and Mitigating Earthquake Disasters” was passed in 1997. It covers monitoring, protection against potential hazards, as well as emergencies and reconstruction after an earthquake. In 2012, the Chinese government enacted the “National Earthquake Emergency Response Plan”, which is composed of a hierarchical system, from level I(highest) to IV (lowest). The level can be upgraded to a higher level if an earthquake strikes a border area, an area inhabited by ethnic minorities and other particular areas. Figure 6. Response levels of the National Earthquake Emergency Response Plan Level
Standards
Major Participants (From central to local level)
I
Death toll (including missing) > 300; Directeconomic loss > 1% of the total GDP in the affected area last years; Magnitude > 7.0 (or >6.0 in densely populatedareas )
State Council (Guidingrescue and coordinating assistancenationally) Commanding Headquarter in response to disasters in the rovidencial level (Leading emergent response in the affected area)
II
Death tool (including missing) 50-300; Magnitude 6.0-7.0 (or 5.0-6.0 in densely populated areas
State Council (When necessary); Providencial cammandig headquarter in responce to disasters
III
Death toll (including missing) 10-50; Magnitude 5.0-6.0 (or 4.0-5.0 in densely populated)
Municipal commanding Headquarter in responce to disasters with the support from the providencial level
IV
Death toll (including missing) < 10; Magnitude 4.0-5.0
County commanding headquarter in response to disasters with the support from the providencial and municipal level
Source: Author’s summary based on the National Earthquake Emergency Response Plan
This kind of top-down approach is widely adopted in risk reduction and regarding emergencies, and the case of the Ludian earthquake was no exception. Each level provides for a a division of tasks and typically every bureau has a corresponding office at the local level. After the Ludian earthquake, a level I emergency response was launched. The China Earthquake Administration organised a team composed of six working groups: disaster monitoring and forecast; investigation and inspection of disasters; media coverage; comprehensive management; scientific support and logistical support (Shifang He et al, 2014). In addition, as stipulated in the law, “the Chinese People’s Liberation Army, the Chinese People’s Armed Police Forces and the People’s Militia shall carry out the tasks of protecting against and mitigating earthquake disasters” (Government of the PRC, 1998). As such, rescue teams were deployed to the area immediately after the earthquake — “One minute after the disasters, 115 soldiers in the emergency rescue team have been deployed to the area and 5 hours after the earthquake, the first rescue resources have arrived” (Junli Zeng, Yongqin Yang, 2015). In addition to the central government working group, the earthquake administration
SEM 2015 93
ASIA-PACIFIC
SHUYU JIANG DISPLACEMENT AND RESETTLEMENT FOLLOWING THE LUDIAN EARTHQUAKE IN CHINA
Figure 5. Impacts of the earthquake
Source: Government of the PRC, November 2014
SEM 2015 94
in Yunnan Province also dispatched a 30-member working team to the county to assist with and implement orders from the central government (IFRC, August 2014). While the various levels of government institutions have played a leading role in the rescue process, the role of non-governmental actors should not be neglected. Due to the deployment of the Ministry of Civil Affairs, many social workers arrived in the disaster areas and assisted the rescue effort. They mainly interacted with those people who were displaced, particularly assisting victims who lost relatives. Their contribution compensated for the absence of basic community services and organisation after the evacuation. To improve the organisation of the relief effort, the “National Earthquake Emergency Response Plan” also includes social mobilisation as an effective approach after an earthquake. It requires the local headquarters to identify specific organisations and personnel to regulate the voluntary work, and to publish information about the needs of the disaster area to ensure the safety and efficient organisation of all volunteers. This combination of government resolution backed up by participative social organisation has become an emerging trend in China and the discussion below will further elaborate on this phenomenon.
2.3 Emergent resettlement
Temporary resettlement is mainly organised in two ways: collective resettlement and voluntary migration. According to Article 35 of the “Law of the People’s Republic of China on Protecting Against and Mitigating Earthquake Disasters”, concerning post-earthquake relief and reconstruction, the Ministry of Civil Affairs is primarily in charge of the arrangement and resettlement of victims, including the establishment of temporary shelters, the provision of daily necessities, and so on. Considering the difficulty of resettling such a huge population, victims are also encouraged to voluntarily move to other places and live with their relatives. Up to the 15th August, 342 collective resettlement shelters had been established, about 126,600 people had been resettled collectively and 113,100 people had been resettled separately (Bureau of Civil Affairs in Yunnan Province, August 2014).
2.3.1. Temporary settlement in centrally located camps
In the temporary camps, there are centralised provisions of food, water and other daily necessities. People living in temporary camps receive benefits for daily life— “every citizen could obtain 25 Yuan every day during an emergency resettlement period of 10 days. Then in the interim period of three months, everyone could obtain 15 Yuan per day” (Bureau of Civil Affairs in Yunnan Province, August 2014). Several departments are jointly in charge of the well being of victims. When selecting the locations for resettlement, the Ministry of Land and Resources undertook a scientific examination and evaluation to rule out geological threats. In these shelters, local centres for disease control conducted disinfection and supervised epidemic diseases. As for basic social services, medical centres, epidemic prevention centres, fire-fighting points and public security regulations were established to minimise risks within a clustered population.
2.3.2. Self-organised resettlement
Alternatively, a large number of victims chose to seek assistances from their relatives and migrated to other areas by themselves. Like most underdeveloped areas in China, many young people in Ludian County have already left their hometown to become migrant workers in cities. In 2010, the whole county had exported 114, 300 migrant workers (Hongxin Nian, 2014). Elderly people and children thus comprised the majority of the population in the county. After the earthquake, they had the option to move with young workers to cities. A major problem of this type of resettlement lies in the Hukou System in China: in China, everyone is officially registered
SEM 2015 95
ASIA-PACIFIC
SHUYU JIANG DISPLACEMENT AND RESETTLEMENT FOLLOWING THE LUDIAN EARTHQUAKE IN CHINA
in one place and the social well-being is associated with the location of the Hukou. As Hukou in cities are difficult to acquire, the subsequent problem is the issue of how these victims can gain access to social welfare if they move.
2.3.3. Involvement of civil society
Notably, the aftermath of the earthquake was the first time that the Chinese Ministry of Civil Affairs devised a social work service assistance plan. Five social service teams were deployed to the collective resettlement tents and schools from Beijing, Shanghai, Guangdong, Sichuan and other Provinces at the end of August. Under the coordination of the social service centre for the Ludian Earthquake, these social service teams directly assisted corresponding social service centres and focused on establishing local social organisation in the resettlement area. Once the social service team had concluded their mission after three months, a considerable proportion of the volunteers continued to participate in the resettlement process. In one of the resettlement spots, “Huijiezi”, volunteers were expected to live with migrants for one year. Their daily job mainly included providing resources and offering psychological counselling after the crisis. Compared with disaster rescue in the immediate aftermath of the earthquake, this long-term voluntary work is more targeted at the needs of the local society and improving the efficiency of the whole migration process. A wider range of civil society engagement facilitated the resettlement process. Firstly, many services had not been fully rehabilitated in the face of increasing demand for them after the disaster. Secondly, it improved the efficiency of assistance from other provinces because participation at the grassroots level can better target the needs of displaced people. For instance, volunteers organised recreational activities to accelerate the rehabilitation and integration of local communities. Lastly, they shared experiences and best practices about social services and voluntary participation, which have not previously been popularised in this underdeveloped area. Such activity further cultivates local voluntary organisations and volunteers, which could constitute the backbone of the future development of local civil society.
3. FROM TEMPORARY EVACUATION TO STABLE RESETTLEMENT Given that more than 300,000 people were displaced after the earthquake, a serious question was posed regarding how these migrants would resettle in the longer term. An overarching objective was established on the national level: within three years, basic living conditions and social-economic development should have returned to or exceeded levels in the region prior to the earthquake. Compared with post-disaster temporary migration, long-term rehabilitation not only involves resettlement of victims, but also their integration into new communities and the cultivation of their self-sufficiency.
3.1. National planning and policies on rehabilitation
Three months after the earthquake, the State Council published an overall plan about the reconstruction an9d rehabilitation following the earthquake. It contains some similarities to the ongoing resettlement process. The plan also emphasised a combination of decentralised and centralised settlement, and mobilizes other viable social resources to ease the financial burden. Aside from the common feature of flexibility, it blueprinted a more specific resettlement plan, summarising forms of resettlement into 3 categories: A. Decentralised settlement: those residents who still have contracted land could voluntarily build their houses under the guidance of an overarching planning authority. Farmers who formerly lived in areas with high geological hazards
SEM 2015 96
should also be migrated to a safer area and resettled in a dispersive way; B. Centralised settlement: designed for the farmers who lost their contracted land. In the event of sufficient, people would also be resettled in order to avoid geological hazards. C. Monetary compensation: distributed to those farmers who have migrated to work in cities whose houses were damaged in the earthquake. Moreover, subsidies were also offered to those who wished to buy houses in cities. The plan also introduces a new spatial arrangement for the resettlement, composed of three parts: A. Restoration in original zones, mainly comprising the valley plain where the natural environment is secure and economic conditions are sound. This area has mainly attracted migration inflows from the severely affected areas; B. Reconstruction near the original zones. This area has also been designed for inflows of migrants from the old town in Ludian County and the displacement caused by landsides and flooding; C. Zones under comprehensive management. These places are in danger of destruction, mainly because of geological hazards. The process requires the improvement of ecological resilience so unlike the two previous categories, it is the major area in which migration outflows have occurred.
3.2. Flows of migrants following the evacuation
Combined with the above spatial arrangement and trends, major flows of displaced people can generally be divided into the following groups: A. returnees; B. migrants to nearby areas; C. potential environmental migrants to other areas. This paper will analyse these three types of migrants in turn to identify their current situation and the problems facing them. A. Returnees: Due to cultural and social reasons, most migrants are reluctant to move great distances to different parts of China, a fact that is magnified considering that many victims are elderly people. Traditional Chinese people value places where they have lived for generations, hence reconstruction of original sites is frequently the preferred option. After returning, these people usually resettle in a decentralised fashion. Although a considerable number of people decided to return, the chronic problems have not been solved. As mentioned above, this area is exposed to numerous natural hazards, and given the poor economic conditions, farmers are unable to rebuild houses in a manner which makes them resilient to natural disasters. Moreover, difficulties in the restoration of basic infrastructure may hamper the restoration of economy. As a result, the whole restoration process is blighted by uncertainty and proved extremely costly. B. Migrants to nearby areas: Due to the severity of the earthquake, in the inhabitants of the most severely affected areas cannot return. It is thus imperative that they migrate to another area. One frequently adopted option was to set up resettlement points near to the original location. In order to ensure the efficient and scientific selection of a new site, this category of migrants have mainly resettled in centralised settlements. One of the representative areas is Longtoushan Town, where the severity of the earthquake was most pronounced; almost the entire town was destroyed by the earthquake. On top of that, the population in the old town had already exceeded the ecological carrying capacity, meaning that rebuilding the original site was not a rational option. Consequently, a new settlement site was selected near the area called “Luoyingkou-yingpan” district. This settlement is a site of about 200 hectares (Government of the PRC, November 2014) to house migrants from the old town. C. Potential environment migrants to other areas: the national plan also identified zones under comprehensive management, where people exposed to high
SEM 2015 97
ASIA-PACIFIC
SHUYU JIANG DISPLACEMENT AND RESETTLEMENT FOLLOWING THE LUDIAN EARTHQUAKE IN CHINA
natural risks should migrate to other places. There had not been any concrete plan regarding this flow of migrants up until this point. Nonetheless, it marks a transition from passive disaster response to a more proactive means of addressing disaster mitigation and preventive efforts.
4. THE EXISTING SITUATION AND DIFFICULTIES OF MIGRATION IN THE LONG TERM Unlike traditional migration, resettlement after disasters such as earthquakes involves more difficulties. Typically, in the categories of environmental migration for the purpose of project construction or ecological protection, ex-ante research of the feasibility is carried out, both a well-organised plan for the whole process and a socio-economic survey regarding the willingness of migrants are drawn up, and compensation is attributed to migrants before implementation. In contrast, disaster-induced migration requires an instant response as soon as possible. Meanwhile, with the losses of homes or even relatives, migrants have to endure huge psychological pressure. The difficulties and possible policy operations vary according to different target groups. The following section will examine the challenges faced by different flows of displaced people and how they attempt to recover from the effects of the earthquake.
4.1. Willingness to move
In the affected area previous migration has mainly been driven by economic factors. Young people move to cities in search of better job opportunities, with their family members (mainly children and elderly people) remaining in the county. Migrant workers save and send back much of their income to support their family in the counties. However, migrants driven by other factors, such as environmental migration, are less welcomed by the local people even though in many case the areas that the migrants left are no longer suitable for life. The previous section highlighted the cultural factors in this problem. In fact, even though there are currently no accurate official data regarding migrant flows, it can be deduced from media coverage and previous experience that most people returned to their area of origin or somewhere nearby. In 2015, the expected target was to establish 46 settlements, 139 educational programmes and 28 sanitation programmes (Houyou Cai and Xunshen, 2015). Among these settlements, more than half of the sites were in Ludian County: 24 in Ludian County, 10 in Qiaojia County and 12 in Zhaoyang District in Zhaotong (Bureau of Housing and Urban-Rural Development of the PRC). As shown in the Figure 5, all of these settlements are located near the earthquake’s epicentre.
4.2. Restoration of the economy
Given that willingness to move is limited, many residents relocate in or near to the original area. Recovery of the economy is a central element in the rehabilitation of these areas. In order to facilitate it, the first step that must be taken in affected areas is to recover agricultural production by supporting traditional agriculture in the area. For instance, cultivation of pepper is the major source of income for many farmers but many mature peppers could not be harvested in time after the earthquake. Additionally, 20,000 mu2 of pepper land was destroyed , 160,000 mu was partially destroyed and 30,000 mu were slightly damaged (Ministry of Agriculture of the PRC, 2014). The Ministry of Agriculture organised purchasers for the affected areas and
2. Mu is the measurement in China. 1 mu is equal to 666.67 square meters. Author’s explanation.
SEM 2015 98
promoted direct marketing channels with local farmers. It also organised online sales so that companies in other provinces could purchase peppers. Nevertheless, rehabilitation near the original area may not be a sustainable solution. On the macro level, following the disaster, 322 geological hazard points were found, of which 139 are new (Yanling Liu, August 2014). This underlines the fact that previous environmental risks still exist. On the micro level, the income of most victims mainly comes from agriculture, thus people’s loss of land as a result of the earthquake raises the question of the adaptation to the economic structure in the places to which they have been relocated because of their lack of skills.
4.3. Reconstruction of houses
While the central government established a framework for resettlement after the earthquake, the local government dealt with the details and the implementation of the rehabilitation process. A central aspect of rehabilitation is fund raising for rebuilding houses in the new settlement site. According to the national plan, subsidies were allocated for the reconstruction of houses by victims. The standard sum was 40,000 Yuan per household for reconstruction of a house with an additional 10,000 Yuan for impoverished households (Yongfeng Zhao, 2014). Moreover, the local government designated a centralised management system, according to which residents’ houses were rebuilt communally with funding managed collectively. At the local level, a series of rules3 were proclaimed. Firstly, residents had to submit an application to the neighbourhood committee (“Juweihui”, a self-governance entity in China based on people living in nearby areas). After approval by the leader of the committee, the neighbourhood committee must report the fact to the government of Ludian County and sign a contract with the resident. Secondly, funding is composed of two elements: A. A public payment: a special subsidy for rebuilding houses in the collective resettlement areas which is allocated by the municipal authorities. The residents are required to submit a “power of attorney for the payment”. After examination of the submission, the money is directly paid for units of construction during each phase of the construction. B. Money contributed by residents: in the event that these special subsidies are not sufficient, residents are required to collect the remaining funding themselves and pay it to the county government. Both of these lines of funding are eventually allocated to a special account by the office of finance in the county. To make the process more transparent, a supervision group, which includes residents, monitors the whole process of management, utilisation of funding, as well as the quality of the houses. This combination of public and self-raised money helps to significantly alleviate the burden of a county, which has to deal with extreme poverty.
4.4. Selection of the new site
While resettlement near the area of origin may not be a long-lasting solution, migration to other places may also prove difficult. First and foremost, Yunnan Province is home to a broad range of ethnic minorities, meaning that resettlement must take the habits of ethnic minorities into consideration. Fourteen different ethnic minorities live in Ludian County, the largest proportion of which are Hui (16.6%) (Ludian County Government, 2014). Prior to the earthquake the same minority groups lived in close proximity to but separately from each other because of the inconvenience of transportation in the mountainous area. They thus developed their respective individual cultural atmospheres and lifestyles. Consequently, it is better that the relocated area has a similar
3. For details, see: Ludian County Government: Management of funding for rebuilding houses in settlements in Ludian County. 2015. http://www.ludian.gov.cn/defo_Show.asp?InfoId=2256&ClassId=54&Topid=31. Accessed: 15th April, 2015.
SEM 2015 99
ASIA-PACIFIC
SHUYU JIANG DISPLACEMENT AND RESETTLEMENT FOLLOWING THE LUDIAN EARTHQUAKE IN CHINA
social and economic structure. Additionally, the low transferability of skills also makes it difficult for most farmers to integrate in new economic and social conditions. Besides the issues concerning those people to be relocated, problems focusing on the host communities should also be recognised. Counties with newly established settlements were already densely populated and had exceeded their ecological capacity. An influx of migrants thus puts additional strain on the environment, increasing environmental pressure in the area. Thus, if the capacity of the new host community is not carefully evaluated, relocation is merely a transfer of problem from one region to another, perpetuating the vicious circle. Meanwhile, the possibility of relocating the people displaced by the earthquake to more developed areas in the west of China is also unlikely. In addition to transportation costs, there are evident differences in lifestyle, culture and many other social factors. Indeed, the inequality of development among the different regions in China makes the selection of relocation sites problematic.
5. CONCLUSION Migration in the wake of the earthquake is not merely a passive response to the disaster. On the one hand, if migration is associated with the transition of livelihoods and progress towards poverty reduction, victims could overcome the limitations imposed by environmental conditions. If migration policy helps to reduce the pressure that human activities put on the environment, the recovery process in ecologically fragile zones will be more effective. As a consequence, the transition from relying on outside assistance to self-sufficiency is a key issue in the long term. As Balakrishnan Rajagopal contends, developmental displacement should include “rights to life and livelihood” (in McDowell Gareth Morrell, 2010). This right requires “adequate standards of living for the whole family”, as well as protection of “the sustainability of the local environment”(in McDowell Gareth Morrell, 2010). After the restoration of farmland and equipment, some agricultural measures could be initiated in order to make production more intensive and better organised. The value chain could be further extended by developing the processing industry. In addition to agriculture, other industries should also be looked to to contribute to the economic recovery. For instance, in some areas, social workers have launched several entrepreneurship programmes (online businesses, traditional artefacts) to equip displaced people with skills to broaden sources of economic income in new settlements. Moreover, development of the tourism and service industries could also facilitate economic development in a more sustainable way. Furthermore, environmental migration could also represent an essential solution to the prevention and mitigation of natural disasters, in addition to sustainable development in this region. The introduction of and increasing recourse to environmental migration in the region could facilitate transformation from passive disaster reaction to positive environmental mitigation and adaptation, and a combination of environmental migration and poverty reduction could pave an innovative path for rural development in China and other developing countries. In Chinese, the world “crisis” (Wei ji) is composed of two words: danger and opportunity. This earthquake is undoubtedly a severe calamity, yet it also presents an opportunity for the transition of the economy. Thus, following the completion of the resettlement process, the long-term approach must entail not only recovery from the earthquake, but also implications for sustainable future development.
SEM 2015 100
REFERENCES Books and reports –– Christopher McDowell and Gareth Morrell. 2010. Displacement beyond conflict. Berghahn books. P. 69.
–– Houyou Cai and Xunshen. 28th April, 2015. Half of the reconstruction of houses have been finished in Yunnan Daily.
–– IFRC. August 4, 2014. Information bulletin China: Ludian Erthquake. p. 2.
–– Yongfeng Zhao. 11th November, 2014. Rethinking Ludian earthquake, solutions to disasters and poverty in Yunnan Information Paper.
–– Chris Lavell and Justin Ginnetti. 2014. The Risk of Disaster-Induced Displacement in South-East Asia and China, P.32. Oslo: IDMC & NRC. –– ESCAP. 2014. Disasters in Asia and the Pacific: 2014 Year In Review. Thailand: ESCAP. –– Yanquan. 2013. Introduction to cities. Yunnan Yearbook 2013. Yunnan. Articles –– Hewei: the Model of Ludian: a new milestone for the social work after disasters. China Society Periodical, 2014(30). –– Junli Zeng, Yongqin Yang. 2015(5). Local government’s response to natural disasters—A Case of Ludian Earthquake. Journal of Anhui Agricultural Sciences. –– Shifang He et al. 2014(5). An overall introduction to the emergency work after the Ludian Earthquake. China emergency Rescue. Press articles –– Bai Wenxue. 7th August, 2014. Poverty exaggerates natural disasters. In People’s Daily. –– The distribution and intensity of the Ludian earthquake. 7th August, 2014. People’s Daily. –– Yan Wang. 20th August, 2015. Preparation for the rehabilitation by Ludian County in Xinhua News Agency.
–– Yanling Liu. 11th August, 2014. Checking potential geological risks in Ludian county in China News. Government bulletin –– The central people’s government of PRC. Law of the People’s Republic of China on Protecting Against and Mitigating Earthquake Disasters. Adopted since 1st March 1998. –– The central people’s government of the People’s Republic of China (PRC). 23th November 2014. Notification of the overall plan about the reconstruction after the Ludian earthquake. –– News office of Ministry of Agriculture of PRC. 28th August 2014. http://www. moa.gov.cn/zwllm/zwdt/201408/ t20140828_4027615.htm. –– Office of bureau of Civil Affairs in Yunnan Province. 14th August 2014. http://yunnan.mca.gov.cn/article/lddz/ gzdt/201408/20140800685894.shtml. –– Report of the reconstruction of houses after the Ludian Earthquake (Mid-April). 29th April 2015. Yunnan: Bureau of Housing and Urban-Rural Development of PRC.
–– China Earthquake Adminisration. 2013. http://www.cea.gov. cn/publish/dizhenj/467/ 490/20131127151858836596174/index. html. –– Ludian County Government: A Brief Introduction of Ludian County. 2014. http://www.ludian.gov.cn/info_Show. asp?InfoId=365&ClassId=62&Topid=31. –– Ludian County Government: Longtoushan Town. 2014. http:// www.ludian.gov.cn/ info_Show.asp?I nfoId=290&ClassId=84&Topid=82. –– Ludian County Government: Management of funding for rebuilding houses in settlements in Ludian County. 2015. http://www. ludian.gov.cn/ defo_Show.asp?InfoId =2256&ClassId=54&Topid=31. Websites –– GSI International Steering Committee for Global Mapping, http://reliefweb. int/map/china/global-mapandaround-zhaotong -yunnan-chinaland-use-a ugust-05-2014. –– Earthquake report, http://earthquakereport.com/2014/08/03/very-strongearthquake-sichuan-yunnan-guizho u-rg-china-on-august-3-2014/. –– Hongxin Nian. Everyone has 25 Yuan everyday during the emergent resettlement in affected areas in Zhaotong. 6th August, 2014 in Yunnan.cn. http://society.yunnan.cn/ html/2014-08/06/content_3316043. htm.
–– Junyi Chen. 2013. The trail project of comprehensive management of stony desertification in Ludian County. Development and reform bureau in Ludian County.
SEM 2015 101
STEPHANIE LYONS
The Jakarta floods of Early 2014: Rising Risks in one of the World’s Fastest Sinking Cities
I
INTRODUCTION
n January and February 2014, the Indonesian megacity of Jakarta was hit by heavy rainfall and flooding that caused the deaths of 23 people and displaced more than 60,000 others (Setiawati 2014; OCHA 2014). This was not the first time that Indonesia’s capital and economic centre had experienced the severe consequences of floods. Jakarta is one of the largest coastal cities in Southeast Asia, with a long history of exposure to natural hazards and disasters and high vulnerability to climate change (Firman et al. 2011). Floods inundate Jakarta at least annually and are projected to worsen as a result of climate change; in fact, flooding represents the greatest climate- and disaster-related risk to the city, and its most severe floods on record have all occurred within the last twenty years (World Bank 2012b, 1; Douglass 2010, 45). Situated around a large bay on rapidly subsiding land and floodplains, Jakarta is intrinsically vulnerable to floods and other projected climate change impacts, and this vulnerability is compounded by human activity. The city’s large population of poor residents is especially at risk, with communities concentrated in dense, often unstable settlements in some of Jakarta’s most flood-prone areas near the bay, rivers, lakes and floodwater retention areas. These risks have been exacerbated by the rapid growth of Jakarta’s economy and population, uncontrolled and poorly planned urban development, and long-term environmental degradation, all of which accelerated over the second half of the twentieth century and is continuing today. Many Jakarta residents face both temporary and longer-term displacement each time floods hit the city, and as flooding becomes more frequent, it poses immense challenges for both Jakarta’s and Indonesia’s governments and a range of non-government actors. From an environment and migration perspective, Jakarta is an example of a context in which natural hazards are already displacing communities, while, at the same time, increasing population growth and migration are adding to local environmental degradation, thereby further increasing the risks from both floods and displacement. This case study examines the floods and resulting human displacement that occurred in Jakarta in early 2014—in the context of the broader, long-term flooding risks posed by climate change—and reviews some of the responses and solutions that have been proposed and employed to date. While there is substantial data available on Indonesia’s and Jakarta’s environmental vulnerability to floods—and extensive media reporting on communities’ experiences of both floods and displacement—it appears that as yet there has been limited explicit or in-depth analysis of the connections between flooding and displacement in Jakarta. While national and local authorities regularly release official data on the number of people affected and displaced by individual flood events in Jakarta, the availability and accessibility of longer-term data and estimates are variable and sometimes inconclusive. This study therefore
SEM 2015 103
ASIA-PACIFIC
STEPHANIE LYONS THE JAKARTA FLOODS OF EARLY 2014: RISING RISKS IN ONE OF THE WORLD’S FASTEST SINKING CITIES
draws from a range of secondary evidence provided by international organisation reports (such as from the International Organization for Migration and the World Bank), academic research, Indonesia’s national- and city-level government authorities, and local and international news media accounts. An analysis of the implications of floods and displacement in Jakarta is timely for those actors involved in addressing these problems at the city level, and is also pertinent from national and global policy perspectives. Over recent years, Jakarta’s government has been increasingly engaged in measures to mitigate floods and reduce the risks of displacement. Minimising flood impacts was a central election commitment of Jakarta’s previous governor, Joko “Jokowi” Widodo, and remains a central focus of his successor, Basuki “Ahok” Tjahaja Purnama, who became governor in October 2014 after Jokowi was elected president of Indonesia (Purnamasari 2013). (In examining action undertaken in Jakarta to date, this study focuses primarily on the Jakarta government, which has provincial-level status and encompasses five smaller authorities, each with local mayors.) With flooding due to worsen as a result of climate change, Jakarta faces an increasingly urgent task in reducing flood risk and avoiding severe consequences for its citizens, including displacement, injury and death. These imperatives are relevant throughout Indonesia and Asia more broadly, where populations and cities are burgeoning. Asia’s urban areas are the fastest growing regions in the world; by 2025, Asia will be home to ten of the world’s twenty most highly populated urban agglomerations (IOM 2014b). This study therefore offers insights on flooding and displacement in Jakarta as a rapidly developing, densely populated, climate change-exposed city. It begins by examining the environmental vulnerability and risks faced by the city of Jakarta and its residents. The study then explores experiences of flooding and displacement in Jakarta’s recent history, including the floods of early 2014, before investigating key policies and response measures to date, including both flood mitigation measures and community relocation efforts. The study concludes by highlighting key areas for action by governments and other actors to improve the integration, delivery and design of flood-related policies and measures.
1. BACKGROUND AND HISTORY Environmental vulnerability
As the world’s fourth most populous nation and largest archipelago, Indonesia has always been vulnerable to natural hazards (Randall 2013; IOM 2013). Comprising more than 17,500 islands to the north and south of the equator, it is exposed to severe earthquakes, volcanic eruptions and dry mass movements, and suffered devastating human and environmental loss and displacement from the 2004 Indian Ocean tsunami (World Bank 2015b; IOM 2014). Floods comprised almost a third of more than 1,500 disasters recorded in Indonesia in 2014, and have been by far the most frequently occurring type of natural hazard in Indonesia since 1980 (Jakarta Post 2014a; IOM 2013). Jakarta is one of Indonesia’s most disaster-threatened provinces and encapsulates many of the challenges the country faces from climate change and urbanisation in degraded, vulnerable environments (Elyda 2014). “Greater Jakarta”, designated as Jabodetabek, is a rapidly growing “mega-urban region” of around 28 million people, located on the northwest coast of the island of Java, which is home to around 54 per cent of the country’s total population of almost 230 million (Tarrant 2014; World Bank 2015b). Current population statistics for Jakarta’s primary urban area vary depending on how broadly the area is defined, ranging from over 10 million (Sentana 2014) to around 16 million people (Hill 2013). It has been estimated that at least an additional 2.5 million people from surrounding areas commute into Jakarta for work
SEM 2015 104
every day (Firman et al. 2011). Having grown from around two million people in 1960, Jakarta has undergone significant uncontrolled urban development over the past few decades, leading to expanding unstable settlements, water shortages, and increased traffic due to rising car ownership (Douglass 2010, 47; Maclean 2014). It is now one of the ten most densely populated cities in the world, comprising rich residential communities and high-rise developments, as well as dense neighbourhoods of lowand middle-income residents (known locally as kampungs) and informal settlements (Tarrant 2014; HRW 2006). As Jakarta is Indonesia’s capital and economic hub—generating more than 20 per cent of national GDP and also comprising a large informal sector—disasters in the city have significant consequences for local residents and the country as a whole (Tarrant 2014; McKinsey Global Institute 2012, 14; World Bank 2009). Figure 1. Jakarta, Indonesia’s capital and economic hub, is situated on subsiding land and floodplains around Jakarta Bay, which opens out to the Java Sea.
Image: Creative commons.
Located on a swampy plain around the Bay of Jakarta, the city is, in effect, a “sinking bowl” (Tarrant 2014) and is highly exposed to flooding from heavy rainfall and seawater and river water inundation. Much of the ageing technical infrastructure for flood mitigation—including floodgates, canals and a sea wall—has been
SEM 2015 105
ASIA-PACIFIC
STEPHANIE LYONS THE JAKARTA FLOODS OF EARLY 2014: RISING RISKS IN ONE OF THE WORLD’S FASTEST SINKING CITIES
unable to accommodate the floods of recent years. As the impacts of climate change worsen, Jakarta’s rainfall and flooding are projected to become increasingly frequent and intense (World Bank 2014a). Indeed, floods and flood-related dangers pose the greatest risk to Jakarta of any type of natural hazard: while their occurrence may be predictable, they can be extremely hazardous and hit the city at least annually, typically in January and February at the peak of the rainy season (Tarrant 2014; Maclean 2014; Douglass 2010). Jakarta’s environmental vulnerability to floods can be understood as the product of intersecting natural and human-influenced activities and characteristics (Ekuatorial 2014). Most of the northern part of Jakarta is a floodplain: a lowlying area that should hold and channel water during floods, but cannot safely function due to over-development (Ekuatorial 2014). This is exacerbated by the severe degradation and blockage of the thirteen rivers that flow through the city, along which many of the poorest residents are settled (Hill 2013; Ekuatorial 2014; World Bank 2010). Jakarta is also said to be the world’s fastest sinking city: the highly porous land has subsided by around four metres over the last three decades and is now sinking around seven centimetres on average each year as a result of groundwater extraction, concreteheavy load construction, natural consolidation and tectonic activity (Tarrant 2014; Firman et al. 2011). Due to rapid land use change and development, Jakarta has very few natural drainage sites: its water tables cannot adequately absorb rainfall, and floodwaters and concrete settlements create blockages (Ekuatorial 2014). Rainfall and sea-level rise compound this vulnerability. In the last decade, extreme rainfall in Jakarta has grown markedly during the peak months of January and February. Rainfall in these months averaged 193 millimetres per day in 2013, compared with a recorded average of 400 millimetres per month between 1879 and 2002 (Ekuatorial 2014). Forty per cent of Jakarta already lies below sea level, and projections indicate sea levels could rise from 18–59 centimetres by 2100 (Tarrant 2014). A 50centimetre rise in sea level, combined with subsidence in Jakarta Bay, could permanently inundate densely populated city areas that are home to over 270,000 people (Ward et al. 2012, 523; World Bank 2015b). Much of Jakarta’s physical infrastructure and human activity exacerbate these risks. Urban waste is a major problem; most neighbourhoods use local septic tanks or dump waste into sewers that flow into the canals, which have lost up to 75 per cent of their capacity (Tarrant 2014). From everyday garbage to mattresses and refrigerators, overwhelming quantities of human waste clog various canals, floodgates and urban spaces, especially within the kampungs, where embankments have been known to trap floodwaters (Ekuatorial 2014; Maclean 2014; World Bank 2010).
1.2. Groups most vulnerable to displacement in Jakarta
Although flooding is increasingly affecting all Jakartans (the presidential palace was famously flooded in 2013), it is the city’s poorer residents who are the most vulnerable, given their location in densely packed, flood-prone areas. While some of these people are migrants to the city and others have lived there for generations, poorer communities are mostly concentrated in low-lying areas near the rivers, canals, retention lakes and bay (Firman et al. 2011). Jakarta’s governor said in 2014 that more than 600 community units are prone to flood. According to the Jakarta Disaster Mitigation Agency (BPBD), the most flood-prone areas include seven sub-districts comprising more than 20 smaller community units (Elyda and Dewi 2014). The majority of people who migrate to Jakarta come from other parts of Indonesia—especially poor and rural regions—in search of better living conditions, and often work in informal sector jobs, such as in food stalls and boatyards (Firman et al. 2011; Tarrant 2014). The World Bank estimated in 2010 that an additional 250,000 people come to Jakarta each year in search of work. Some migrants settle illegally or semi-legally in informal settlements on the precarious edges of rivers and floodwater
SEM 2015 106
retention lakes (Tarrant 2014). Workers, such as those in the construction sector, have been known to move around the city, living wherever work is available (Wilhelm 2011, 130). Studies indicate that some rural-urban migrants follow friends or family to the city, while others migrate alone and send remittances back to their families, and may relocate frequently to find the cheapest accommodation possible (Wilhelm 2011). Some migrants are seasonal and have been known to remain in Jakarta for up to ten months per year, but are often omitted from official figures (UNHabitat 2003, 212). The instability and fluidity of these types of income, employment and housing arrangements suggest that migrants can be acutely vulnerable to floods. Of course, many flood-vulnerable Jakartans are not migrants, but rather permanent or long-term residents—in kampung Muara Baru, for example, 90 per cent of respondents to a 2007 survey had lived there for more than ten years (Nurlambang 2012, 80). While reliable data on kampungs are scarce, as they do not constitute formal administrative entities, many host a combination of poor, near-poor, working- and middle-class residents, with unstable shelters constructed alongside more resilient permanent buildings (UN-Habitat 2003, 211–212). Since the 1970s, swift urbanisation, increasing land prices and speculation have shrunk these settlements while reducing available land for low-income housing, increasing population density within and around the kampungs (UN-Habitat 2003). Flooding is therefore another type of displacement pressure faced by many kampung residents, along with commercial development and corrupt activities that have forced some residents out of their homes over the past few decades (UN-Habitat 2003; HRW 2006). Kampung Muara Baru offers one example of these communities’ vulnerability: located just inside Jakarta’s seawall, it is home to more than 100,000 people and already sits almost two metres below sea level (Tarrant 2014). For local residents who must look upwards from their homes to view the sea, daily high tides and enduring high-water marks from past floods are stark reminders of how evacuation and permanent displacement threaten their everyday lives. The people most threatened by floods in Jakarta are therefore likely to face overlapping circumstances that increase their overall vulnerability. From long-term residents to temporary migrants, communities’ inherent environmental vulnerability can be compounded by factors such as residents’ levels of income, type of work, residency status, shelter, and the extent of their social connections and ties to their district and community. These people may have multiple experiences of displacement by flooding, whether temporary or long-term, within their lifetimes; the implications of this for their physical and mental health and social wellbeing can be profound (Maclean 2014). By reviewing floods in recent history and the 2014 flooding event, the following section examines the environmental and displacement implications in greater detail.
2. FLOODS OF 2014 AND RELATED DISPLACEMENT 2.1. Floods in recent history
Jakarta’s annual floods have become more intense, frequent and widespread in recent decades. Following decades of swift population growth in the latter half of the twentieth century, Jakarta’s most destructive floods on record have occurred within the last 20 years: in 1996, 2002, 2007, 2013 and 2014 (Douglass 2010, 45; Tarrant 2014). The 2007 flood was Jakarta’s worst on record, and was the first time that a large storm surge—originating from a huge monsoon storm and high tide—flooded the city (Tarrant 2014). As much as 75 per cent of Jakarta was flooded, at least 76 people were killed, disease outbreaks affected more than 200,000 people, and damages amounted to more than USD 900 million (Tarrant 2014; Douglass 2010; World Bank 2014a; World Bank 2015b). It is estimated that at least 1,500 homes were destroyed
SEM 2015 107
ASIA-PACIFIC
STEPHANIE LYONS THE JAKARTA FLOODS OF EARLY 2014: RISING RISKS IN ONE OF THE WORLD’S FASTEST SINKING CITIES
(World Bank 2012b). Displacement estimates from the 2007 flood vary from around 340,000 (Douglass 2010; World Bank 2014a) to up to 590,000 (Tarrant 2014). In the neighbourhood of Muara Baru alone, more than 4,000 houses were inundated by at least two metres of water (Nurlambang 2012, 79). Fisheries and businesses lost up to 50 per cent of their incomes, and up to 90 per cent of the local population was unable to go to work (ibid.). In a survey of almost 200 residents after the flood, only around 30 per cent of respondents said they had received flood warnings, and that these had come from neighbours, relatives or friends, rather than the government (Susandi et al. 2011, 5; Nurlambang 2012, 79). After the flood, 24 per cent of survey respondents reported having received government assistance, and 30 per cent said they had received support from non-governmental organisations (NGOs) (ibid.). The floods of early 2013 were Jakarta’s worst since 2007: heavy rainfall broke riverbanks, sending torrents of water into the city centre and inundating the iconic Hotel Indonesia traffic circle (ABC News 2014; Jakarta Post 2015c). While the reported total death toll from the 2013 flooding varies, data from United Nations OCHA (2013) suggest at least 41 people were killed and 120,000 were displaced (Hill 2013; Jakarta Post 2015c).
2.2. Floods of 2014
The Jakarta floods of 2014 underscored residents’ vulnerability to displacement and the significant challenges involved in confronting increasingly common and widespread flood events. On 12 January, after several days’ torrential rain led to river overflows and flooding, the Indonesian Government declared a 30-day emergency readiness phase (ABC News 2014; International Federation of the Red Cross 2014). A range of government actors were mobilised: the Jakarta BPBD coordinated the process in conjunction with its national-level counterpart, the BNPB, with further assistance from the military, police and several other agencies that supported evacuation and relief efforts (IFRC 2014). By 19 January, more than 30,000 residents had been forced to evacuate and at least seven people had died from drowning, electrocution or flood-related illnesses (ABC News 2014; Sentana 2014). Two days later, five more residents had been killed, and the number of displaced people had more than doubled to almost 63,000; many took shelter in more than 250 makeshift displacement centres close to the affected areas, such as mosques and schools (OCHA 2014). At this point, it was estimated that nearly 135,000 people from 100 different urban villages in Jakarta had been directly affected by the flooding (ibid.). As January drew to a close, the floods had killed 23 people; the majority of deaths occurred in eastern Jakarta, though people were also killed in the north, west, central and southern parts of the city (Setiawati 2014). While thousands of evacuees returned to their homes to recover and clean up, more than 18,500 people were forced to re-evacuate to shelters following more rain and flooding on 3–4 February (ReliefWeb 2014). Some neighbourhoods had already been evacuated nine separate times during the month of January alone, underscoring the instability and unpredictability of many residents’ circumstances (Maclean 2014). Some communities, including thousands of residents of Kampung Pulo, were evacuated again later in February due to floods that reached depths of almost three metres (Jakarta Post 2014d). The floods overwhelmed much of Jakarta’s infrastructure and posed major immediate and longer-term risks to safety and health. Flood levels were recorded at between 20 centimetres and 1.2 metres in low-lying areas near the rivers, and reached up to two metres at the riverbanks and up to four metres in some homes (IFRC 2014; Maclean 2014). Hundreds of kilometres of road were made inaccessible by inundation, drainage systems and bridges were damaged or destroyed, and local power was cut in some areas for at least two days, though phone and electricity
SEM 2015 108
services remained intact in other areas (IFRC 2014; ABC News 2014). Many residents fled their homes by wading through the floodwaters or using rubber or makeshift boats. As the death toll implies, strong currents in the floodwaters were particularly dangerous, as the majority of residents did not know how to swim (Maclean 2014). Thousands of houses and buildings were flooded—and some half submerged—by black water containing sewage and waste (IFRC 2014; Maclean 2014; ABC News 2014). This had serious sanitation and health implications, including skin infections, diarrhoea (particularly in children under five years old), and the risk of severe conditions such as leptospirosis, an animal-borne disease that is spread through bacteria in water and can be fatal (Maclean 2014). Following this flood and others, residents said the floodwaters inside their homes took up to two weeks to subside (Maclean 2014). After the February floods had abated, the BNPB estimates they had incurred around USD 407 million in damages to the city and led to a 0.4 per cent spike in inflation, which reached 1.07 per cent (Ekuatorial 2014; Elyda 2014). Additional floods that hit Jakarta in the ensuing months of 2014 provide further examples of how flooding is becoming a more frequent event throughout the year in Jakarta. For instance, three months later, in May 2014—just before the start of Jakarta’s traditional “dry season”—parts of the city were flooded once again. In Kampung Pulo, heavy rainfall burst the banks of the Ciliwung river, and, although residents’ homes were inundated by up to two metres of water, no deaths or evacuations were reported (Wardhani and Elyda 2014). Several months afterward, following the city’s brief dry season, the flood season was said to have started early, when unexpectedly heavy rainfall and floods hit the city in November (Elyda and Dewi 2014). On this occasion, more than 20,000 people were affected and at least 1,000 evacuated to temporary shelters (ibid.). These flood events offer additional insights into how residents responded and adapted in 2014 to increasing incidences of flooding, and the resulting implications for evacuation and displacement. Recent accounts suggest that some residents are reluctant to evacuate their homes during floods, preferring instead to remain and employ various methods to cope and adapt. In Kampung Pulo in May, it was reported that many residents had not left their homes, but had simply moved onto the second floors of their houses to avoid the floodwaters (Wardhani and Elyda 2014). It is common for locals to prepare by moving their belongings above the anticipated flood lines, with some residents stowing valuable household items and chickens on the elevated railroad tracks that run parallel to their districts (Ika 2014; Maclean 2014). Media reports suggest that Jakartans who have lived in such districts for years are highly aware of the floods’ increasing frequency, and some have developed their own methods of preparing for floods, including sharing information and tips with neighbours and packing their own “survival kits” (ibid.). They are also accustomed to postflood clean up and recovery, which can take weeks (Jakarta Post 2013a). However, it should not be assumed that such approaches to coping with or adapting to floods can guarantee residents’ safety or necessarily reduce the likelihood of displacement. A media interview with one local resident suggests that some people may believe they are “safe” to remain at home as long as the flood levels have not reached two metres; another local resident said her children swam in the floodwaters after school and “enjoyed” the floods (Wardhani and Elyda 2014). Given the significant inherent health and safety dangers of Jakarta’s floodwaters, these anecdotes highlight the importance of distinguishing suitable adaptation measures from risky practices and behaviours that may arise where locals have come to view severe flooding as routine or even banal events (ibid.; Maclean 2014; Zein 2015).
SEM 2015 109
ASIA-PACIFIC
STEPHANIE LYONS THE JAKARTA FLOODS OF EARLY 2014: RISING RISKS IN ONE OF THE WORLD’S FASTEST SINKING CITIES
3. RESPONSES TO FLOODS AND DISPLACEMENT Having outlined Jakarta’s vulnerability and the complexity and scale of the implications of floods in the city, this case study now examines some of the policy frameworks and response measures that have been proposed and employed in recent years. As Jakarta’s flooding implicates several complex policy areas, this study does not seek to provide an exhaustive account of all pertinent measures at the local, provincial, national and international levels. Instead, it highlights some of the notable policies that have been established and key efforts that have been undertaken in recent years to address Jakarta’s flooding and related displacement problems. The proliferation of such measures over the last decade suggests that people in Jakarta—from leaders and government officials to NGOs and local residents—are broadly aware of these challenges and the need to address them, yet many efforts to date have not been well designed or coordinated (World Bank 2012b).
3.1. Overarching government frameworks and policies
Indonesia and Jakarta have a number of overarching strategies and policies in place on climate change adaptation (CCA), disaster risk reduction (DRR) and urban planning, each with implications for managing the short-, medium- and long-term risks from floods. Following the 2004 Indian Ocean tsunami, the Indonesian government adopted a more comprehensive national approach to DRR, devoting attention to disaster prevention, preparation, emergency response and post-disaster recovery (World Bank 2012a, 40). Indonesia has also been active at the regional and global levels within the Hyogo Framework for Action—developing national action plans on disaster management and DRR—and has ratified the Association of South-East Asian Nations (ASEAN) Agreement on Disaster Management and Emergency Response (IOM 2013, 244; World Bank 2012b). As noted above, since 2008, disaster management has been coordinated at the national level by the National Disaster Management Agency, known as BNPB, which since 2010 has also had counterpart agencies at the provincial level known as BPBDs (ibid.). Jakarta therefore has a provincial-level BPBD agency. While Indonesia is clearly conscious of the need for comprehensive DRR policies, a representative from the national BNPB suggested in 2014 that some parts of the government still viewed disaster mitigation as primarily a matter of emergency response, rather than as a long-term process of planning and investment (Elyda 2014). In 2013, Indonesia developed its National Action Plan for Climate Change Adaptation (known as RAN-API) which includes short-term priorities and intends to “harmonise and operationalise” all of Indonesia’s national and sectoral adaptation plans (Republic of Indonesia 2013, i). The RAN-API reflects an effort to synthesise CCA planning with related policies: recognising the links with growth and development, the government has expressed an aim to integrate adaptation action into Indonesia’s third National Medium-Term Development Plan, for the period 2015-19 (ibid.). Notably, as of 2014, Indonesia did not have a specific funding mechanism for CCA; instead, implementation was financed by “overall development” funds at the national, provincial and district levels, drawing on both domestic and international funding sources (ibid., 17). It is unclear whether these funding arrangements have the capacity to ensure sufficient long-term funding for CCA at every level of government. In addition, Firman et al. (2011, 5) observed that much of Indonesia’s climate change expertise had traditionally been concentrated at the national level—such as in the National Council of Climate Change and ministries—and that there was still limited climate change expertise at the Jakarta government level. Any provincial-level CCA plans developed in recent years have mainly been ad-hoc, occurring as part of the individual actions of different government agencies (World Bank 2012b, 7).
SEM 2015 110
In the context of strategies such as Indonesia’s National LongTerm Development Plan 2005-2025, in 2010 Jakarta created a Spatial Plan for 2030, which integrated climate change to a minor extent and highlighted the areas of the city at greatest risk from flooding (World Bank 2012b, 7). Nurlambang (2012, 82) notes that the Spatial Plan does not address the displacement issues from climate change, nor meet broader equity imperatives. The boom of private sector developments in Jakarta and the resulting emphasis on private sector interests over recent decades has not been resolved (ibid.; World Bank 2012b). While the need to synthesise DRR, CCA and urban development plans is widely acknowledged at the international level and noted by the Indonesian government, the existing separate frameworks are not well integrated or coordinated (UNDP 2015, xiii; UNISDR 2015; World Bank 2012b; Republic of Indonesia 2013; Firman et al. 2011). This applies at both the national and provincial levels, and is also reflected in the large number of government agencies responsible for different aspects of flood and climate change-related actions, which must collaborate on planning and mobilise quickly to confront hazards and disasters (World Bank 2012b; Firman et al. 2011; Ward et al. 2012, 521–22). The establishment of the Jakarta BPBD at the end of 2010 signalled the government’s recognition of the need for a designated disaster agency, though the BPBD’s precise powers and role were not clearly delineated within government, and coordination problems persist (World Bank 2012b, 7; Elyda and Dewi 2014). Despite Indonesia’s significant numbers of rural-urban migrants and the displacement potential of natural hazards both in Jakarta and elsewhere in the country, there is no specific national policy or legislation on internal displacement (Randall 2013; IDMC 2013). According to the Internal Displacement Monitoring Centre (IDMC) (2013), the national BNPB is accountable for people displaced by both natural hazards and “social conflicts”, while the Ministry of Social Affairs is responsible for relief during emergencies. Relevant legislation includes a disaster management law (2007) and another on handling social conflicts (2012), which empowers local authorities and the military to decide how to manage social unrest and conflict (ibid.). This lack of detailed directives, coordination and oversight from the national level means that displacement policies are largely ad-hoc, and this may in fact increase the potential for internally displaced people’s rights to be violated, especially with regard to the return to and protection of their property (ibid.). Moreover, IDMC has highlighted that a number of relevant European Union-funded programs run by NGOs ended in 2013 because no major crises had caused mass internal displacement in Indonesia in recent years. This suggests that current policy settings on relocation and displacement may be unclear, incomplete and possibly under-prioritised at both the national and local levels. Policy settings at the national and Jakarta levels therefore do not demonstrate strong conceptual or practical connections between the challenges of environmental degradation, migration and displacement. However, it should be noted that while Jakarta does not have an overarching displacement policy, in recent years its government has taken a number of decisions and measures on community relocation due to flooding.
3.2. Flood mitigation plans and projects in Jakarta
After Jakarta’s devastating floods in 2007, Indonesia’s president formed a taskforce to expedite urgent technical interventions and address the flooding challenge over the long term (Tarrant 2014). The taskforce considered two dramatic possibilities that would have directly confronted Jakarta’s inherent flood and displacement problems, yet entailed huge consequences. These options included abandoning the northern part of the city around the bay, or moving the capital to another location at a higher elevation in southeast Java or on another island (ibid.). Both ideas were rejected because of Jakarta’s established role as Indonesia’s capital and economic centre, and
SEM 2015 111
ASIA-PACIFIC
STEPHANIE LYONS THE JAKARTA FLOODS OF EARLY 2014: RISING RISKS IN ONE OF THE WORLD’S FASTEST SINKING CITIES
the according cost and upheaval: the cost of abandoning north Jakarta alone was estimated at USD 220 billion in assets (ibid.). According to media reports, the taskforce decided to focus initially on strengthening Jakarta’s existing canals as well as its coastal defences, triggering the acceleration of various technical measures as well as the creation of the National Capital Integrated Coastal Development (NCICD) Master Plan, a major infrastructure and urban development programme supported by the Dutch government (ibid.; Tarrant 2014). The NCICD plan has the potential to reduce both flood and displacement pressures on Jakarta by constructing a “Giant Sea Wall” and reclaiming land, but was facing an uncertain future as of 2015. Expedited following the 2013 floods, the USD 40 billion project would build a new 35-kilometre seawall and 17 artificial islands in the shape of Indonesia’s national symbol, the garuda bird (Tarrant 2014). The islands would close off Jakarta Bay and include new residential and business developments for up to one million residents and workers, aiming to reduce pressures on Jakarta’s existing land area (ibid.; Japan Times 2014). The project would also create one large storage lake for floodwaters in Jakarta Bay, fed by onshore pumping stations. While this plan ostensibly aims to address both flooding and displacement by fundamentally transforming Jakarta’s urban layout and creating new settlement areas, it has stirred long-held concerns about the continued prioritisation of private interests in Jakarta’s planning and disregard for the needs and circumstances of poorer residents (Elyda 2015). Indonesia’s outgoing economic minister launched the first phase of the plan only days before his government left office in October 2014, and in early 2015 the project was proceeding (Dewi 2014; Jakarta Post 2015a; Jakarta Post 2015b). However, in April 2015, the Indonesian government called for the suspension and review of land reclamation efforts under the NCICD (Elyda 2015). This followed objections from certain neighbouring regional administrations which said they were unwilling to supply sea land for the project, as well as revelations that the Jakarta government had already granted building permits to large private developers (ibid.). While Jakarta’s government subsequently indicated the project may proceed regardless, its future appears uncertain (Wardhani 2015). Although a detailed exploration of Jakarta’s myriad other infrastructure improvement plans is beyond the scope of this case study, the city has been expediting a range of notable other measures to reduce the risks of flooding and displacement. The height of Jakarta’s existing sea wall was raised in 2008, but is today almost subsumed by high tides in some sections, due to the combined impacts of subsidence and sea-level rise (Tarrant 2014). The World Bank is also supporting a USD 190 million project to address urgent flood issues through dredging, embankment fortification, and restoration of priority canals, flood ways and water retention ponds, led by the Ministry of Public Works in Jakarta (World Bank 2014a). The project includes an explicit commitment to provide adequate housing and transitional support to locals required to relocate due to the project (World Bank 2012c). In February 2015, the project was reported to be around one year behind schedule (World Bank 2015). Jakarta’s former governor previously stated that these measures will be effective during “normal” heavy monsoons, but are unlikely to prevent floods under extreme conditions (Hill 2013). The government is also trying to address land subsidence in multiple ways. A moratorium on the construction of new malls was introduced as part of an attempt to ease traffic and reduce the number of unnecessary large concrete developments that are currently contributing to subsidence, though this has not been comprehensively applied or enforced (Tarrant 2014). Concurrent efforts to convince residents to stop extracting groundwater and instead use the city’s piped water system have also been difficult to enforce, as many people access free groundwater illegally and perceive Jakarta’s piped water as expensive, dirty and unreliable (ibid.). While Jakarta faces a tremendous long-term challenge in implementing suitable technical infrastructure for floods, there is also a central role for early warning
SEM 2015 112
systems and community-based approaches to information sharing and disaster education, which are helping Jakarta residents to better understand, prepare for and respond to floods. The city’s existing early warning systems use mobile phone messaging to warn district representatives about imminent floods. In recent years, NGOs, researchers and the Jakarta government have been developing smart phone applications that use government and community-provided data to help residents monitor risks during floods and become more resilient over the long term (Peta Jakarta 2015; PMI 2015). These innovative solutions build on extensive efforts to increase local communities’ capacity to respond to flooding—including communitybased risk assessments, disaster response teams, contingency planning, and training in how to act safely during floods and clean homes to reduce health and sanitation risks (ARC 2015; Maclean 2014). Local Jakartans’ experiences during the 2014 floods (as noted above) underline the continuing need to widely disseminate such communityfocused measures and training. The overarching difficulties encountered to date in establishing adequate infrastructure and systems to address flooding reflect broader underlying governance issues in Jakarta and at the national level, especially poor implementation, enforcement and—as noted above—inadequate coordination between agencies and other actors. After becoming Jakarta’s governor in October 2014, Ahok publicly called for improvements in all three areas to expedite flood mitigation, and said in November 2014 that “[a]ll agencies and working units actually know what they have to do when a flood comes. But they are not well managed and coordinated” (in Elyda and Dewi 2014). World Bank analysis suggests these issues also apply at the national level; in 2012, it observed there had been an insufficient focus on DRR and prevention measures, and that BNPB lacked the confidence of line agencies in coordination efforts (2012a, 40). It suggested that existing fiscal capacity and legal frameworks could adequately support effective disaster risk management, but that the Indonesian government needed to prioritise the implementation and enforcement of regulations and improve its operational capacities (ibid.).
3.3. Response measures during the floods
Beyond the policy frameworks and ongoing infrastructure interventions in Jakarta, authorities and supporting organisations implement a range of practical response measures during floods. During the floods of early 2014, the Indonesian government announced it had the existing capacity “to respond to both short and longer-term needs created by the floods including emergency shelter” (IFRC 2014, 1–2). As part of contingency planning, the Jakartan authorities had already distributed emergency response supplies in villages before the rainy season began, including food, non-food items and water (ibid.). Further supplies were deployed as needed during the floods. A range of actors provided evacuation and relief assistance, including NGOs, which helped to establish shelters, open field kitchens, and distribute hygiene supplies and other emergency kits (IFRC 2014; USAID 2014). Temporary displacement from evacuation was thus relatively well managed through the preparation of temporary evacuation shelters, which were used multiple times by some residents (ReliefWeb 2014). The government also carried out cloud seeding: a process whereby substances are inserted into incoming clouds from military planes, with the aim of causing heavy rains to fall over the ocean before they reach Jakarta (Ika 2014). The government later claimed that this process reduced rainfall by up to 32 per cent during the 2014 floods, though scientists have questioned the accuracy of reported results of cloud seeding in general (Elyda 2014; Rochmyaningsih 2013). In addition to the flood mitigation policies and measures outlined above, Jakarta’s government and municipal administrations have started to remove settlements and relocate people in some of the city’s poorest and most flood-prone areas. Authorities have cited flooding as the central reason for the measures, arguing that people cannot
SEM 2015 113
ASIA-PACIFIC
STEPHANIE LYONS THE JAKARTA FLOODS OF EARLY 2014: RISING RISKS IN ONE OF THE WORLD’S FASTEST SINKING CITIES
live in the highly exposed, informal or unstable settlements that currently encroach on the edges of rivers and waterways. Apart from being repeatedly flooded, such settlements can also inhibit floodwaters from flowing, draining and receding effectively. The relocation measures may thus be seen as an effort to avoid future floodinduced displacement and rehabilitate flood-prone areas (Wardhani and Elyda 2014). At the same time, the relocations constitute a form of permanent displacement for local people who have well-established lives and livelihoods in these areas. For some city dwellers, the relocation process has been coercive and raised long-standing land rights issues (Maclean 2014; Wilson 2014). It has triggered numerous controversies about the government’s consultation processes and relocation methods, the number of people implicated, the livelihoods of affected communities, the state of alternative housing, and access to suitable compensation, resettlement and work opportunities (Maclean 2014; Purnamasari 2013). Given the highly dense and commonly informal living arrangements of many of Jakarta’s most flood-vulnerable communities, it is difficult to identify precisely how many people have been affected by the relocation measures to date, and unclear exactly how many have been excluded from or judged ineligible for alternative housing by the government. The Jakarta Residents Forum has suggested that the government removed more than 19,000 people from their homes in 2013, and fewer than 40 per cent were offered alternative accommodation (Wilson, 2014). Indonesia’s land tenure, ownership and access rights are complicated and have long been compromised by corruption; furthermore, up to 80 per cent of all housing in Indonesia is “informal or self-help based”, meaning many communities’ housing arrangements are insecure (ibid.; HRW 2006). It is not possible within this case study to closely examine broader links in the context of Jakarta’s land and property issues. Yet these relocation measures clearly compound long-standing housing uncertainty for many poor communities, and other political, social and economic interests have likely driven government relocation efforts, in addition to flood risks and environmental vulnerability. It is notable that large commercial buildings and luxury housing estates in the same areas (such as near the highly vulnerable Pluit dam) have reportedly remained “untouched by the administration’s policy interventions”, even though such developments are known to exacerbate flood hazards (Wilson, 2014, 2). The government stepped up its latest relocation efforts in 2013 with a particular focus on high-risk, low-income areas around rivers, dams and retention ponds (Jakarta Post 2013a; Maclean 2014). Authorities have removed settlements and other structures from around the waterways to clear out sedimentation and debris, increase the depth and width of rivers, and create more “green” space (Jakarta Post 2014c). Government approaches to community consultation and the removal of homes have varied significantly. In 2013, Jakarta’s then-governor, Jokowi, was reported to have consulted personally with residents from near the Pluit dam, and said that authorities should be taking a “softly-softly approach” and initiating a dialogue with communities (Dewi 2013b; Dewi 2013c). Yet residents facing relocation in 2014—such as those from Condet in east Jakarta—said they had not been informed or consulted about their relocation, and that their land rights were being violated (Jakarta Post 2014c). Similarly, some residents in Pela Mampang in south Jakarta said in August 2014 that they had received only two days’ notice that their properties would be removed, while the mayor maintained that the communities had been consulted one week before the demolition (Kelety 2014b). In addition to short consultation periods, residents also reported that authorities had proceeded with the demolitions despite locals’ continued protests and concerns (ibid.). Some residents sought assistance from Indonesia’s National Commission on Human Rights, which argued that far more people were facing eviction and relocation than the government data suggested (Pernamasari 2013; Dewi 2013b; Wilson 2014).
SEM 2015 114
While certain residents have welcomed the opportunity to move from the floodprone areas into alternative housing, some have found the settlements unsafe or poorly suited to their everyday needs. For example, some apartments are too small for relocated families, leak regularly due to inadequate construction or maintenance, or lack access to sufficient amounts of clean water (Jakarta Post 2014b; Kelety 2014a). One government official noted some buildings were in a poor condition before they were transferred to the city administration (Jakarta Post 2014b). Some residents must travel over 20 kilometres daily between their new homes and work or school; while Jakarta’s government committed in 2013 to providing free boat services to connect these areas, such arrangements are not universally available to resettled communities (Jakarta Post 2013a; Wilson 2014). Some residents have indicated that these issues are still outweighed by the safety the new settlements provide from frequent floods and evacuation (Jakarta Post 2014b). Uncertainty persists for people that have been unwilling or unable to move from high-risk areas or resettle in alternative housing as part of the relocation measures. As noted above, many locals settled in Jakarta’s most flood-prone areas because of the readily available work opportunities in the city’s centre. Some are reluctant to move because they have strong familial, cultural and economic ties to these areas, and therefore insist they can continue to live with the floods (Maclean 2014; Tarrant 2014). Many also say they cannot afford the deposits or rents for alternative housing, or have suggested that the compensation amounts offered by the government for previously occupied land and property are too low (Jakarta Post 2013a; Wardhani and Elyda 2014). The government has emphasised that people who do not hold Jakarta residency cards are ineligible for government-supported resettlement (Tarrant 2014; Kelety 2014c; Wardhani and Elyda 2014). In 2014, the government evicted illegal street vendors from several areas, despite acknowledging their role in meeting the needs of low-income workers (Kelety 2014c). The governor stated that only registered Jakarta residents were eligible for low-cost apartments and vendor licences, and said the government was working with neighbouring jurisdictions of Java to discourage migration to Jakarta (ibid.). These accounts show that relocation efforts to date have been fraught. In some cases, the relocation measures have left poor communities with limited options and arguably higher vulnerability to floods, and have failed to offer equitable and inclusive solutions for improving communities’ resilience to floods and other climate change impacts.
CONCLUSION By examining the policies and measures adopted in recent years to mitigate flooding and displacement in Jakarta, this case study illuminates a number of areas for further work and improvement by both government and non-government actors. It is clear that governments at each level should better integrate relevant policy frameworks to improve Jakarta’s ability to respond to environment-induced displacement and migration. Given the hitherto limited integration of Indonesia’s current DRR, CCA and urban planning frameworks and the absence of a formal national policy on internal displacement, there is scope for Indonesia to review and synthesise its policies relating to environment-induced displacement and migration. The implications of existing national migration policies and practices should also be considered. This also applies at the Jakarta level, where holistic decision-making is needed on city planning, flood mitigation infrastructure, community resettlement, and overall migration patterns. Natural hazard- and disaster-induced displacement and permanent relocation already occur regularly in many parts of the country, and therefore merit a concerted policy framework that supports national consistency
SEM 2015 115
ASIA-PACIFIC
STEPHANIE LYONS THE JAKARTA FLOODS OF EARLY 2014: RISING RISKS IN ONE OF THE WORLD’S FASTEST SINKING CITIES
and protection of human rights in the event of flooding and displacement. The Indonesian government has already acknowledged the need to integrate and “mainstream” climate change throughout its policies, and this should support coherent links between measures to mitigate flooding (along with other extreme weather events) and flood-induced displacement at the national, regional and local levels. Jakarta’s government should review and address gaps in policy coordination, enforcement, and implementation of flood mitigation and flood response measures. As outlined above, actors involved in managing flooding and displacement in Jakarta broadly agree on the need for improvement in each of these areas. This applies to both the planning and implementation of flood mitigation measures and response strategies during severe flooding. Jakarta’s government could improve coordination by more clearly delineating and communicating the roles and responsibilities of agencies and other organisations (such as NGOs that regularly support flood relief), and improving these actors’ capacity to fulfil their mandates and work together. As the World Bank (2012a, 40) has highlighted, the BNPB should be clearly empowered to coordinate line agencies during flooding. The delay of the NCICD Master Plan also suggests a need for stronger coordination between the Jakarta government, regional governments and the national government as well as private sector actors and international donors. Measures to relocate residents in highly flood-prone areas should be conducted as part of a long-term strategy that prioritises consultation, equity and social inclusion. As the approaches and experiences described above demonstrate, Jakarta’s relocation efforts to date have been ad-hoc and exclusionary for many communities. While the measures may have removed some residents from immediate flood risks, they have included inconsistent and rushed consultation methods, placed some communities in problematic alternative housing, and have actually increased uncertainty and instability for some of Jakarta’s poorest and most vulnerable residents, including migrants. People who are removed from their homes in high flood-risk areas but are not assisted in finding alternative housing face grave social and economic insecurity and—without secure shelter and access to basic social services—are likely to remain highly vulnerable to floods. As noted above, while resettled populations may no longer live in flood-exposed homes, many have had to abandon their old communities, face unsafe conditions in their new housing, and continue to return daily to flood-prone areas in order to work. One particularly crucial issue is the lack of conclusive, accessible data on how many people may need to move; these data are needed to support evidence-based decision-making on relocation and resettlement. The government should engage communities in relocation proposals from the outset, to support their resettlement in safe housing and protect their access to income and employment opportunities. Relocation efforts must also account for poor and unregistered people to ensure they are not left behind. These principles— while certainly challenging and complex to fulfil—are not new; they are included in the involuntary resettlement policies of existing flood mitigation programs, such as the World Bank project outlined above (World Bank 2012c), and could in fact form a useful basis for extending and improving Jakarta’s overall approach to relocation and displacement issues. Governments, NGOs and international organisations should also urgently focus on building residents’ knowledge and capacity to respond safely to flooding, particularly where relocation is not an immediate or feasible option. The 2014 floods showed that many Jakartans still face major health and safety risks from flooding, and many have a limited understanding of appropriate adaptation and resilience strategies. There is thus an urgent need to build on the important and often innovative methods that are being used in Jakarta—from community-based information gathering and dissemination, to training in DRR and CCA concepts and practices—to strengthen the capacity and resilience of Jakarta’s hundreds of thousands of vulnerable residents.
SEM 2015 116
This is particularly important in the context of continuing relocation efforts, which are in danger of creating perverse incentives for some residents to remain in unsafe housing for fear of losing their homes, communities or livelihoods. While not all residents may be able to move, there is also scope for smaller-scale, more immediate measures that increase the technical resilience of communities (such as renovation of existing housing structures to make them safer and more resistant to storms and floods). The events of early 2014 underlined the risks posed by floods and displacement in Jakarta, which are becoming an increasingly frequent and severe problem due to the intersecting processes of climate change, ongoing environmental degradation, and poorly planned urban development. Even in the event of immense interventions to ease progressive land subsidence, the megacity’s geographic position means it will remain acutely exposed to sea-level rise, flooding and other extreme weather events in the coming years. Fundamental changes to human activity and behaviour are required if the city is to remain and continue to grow. This demands the urgent design and implementation of effective infrastructure measures and other mitigation solutions, as well as measures that can help to reduce both short- and long-term displacement from flooding. The experiences of 2014 also demonstrate that many of the city’s most vulnerable residents have low resilience to floods and climate change, and remain at high risk of displacement. While the task facing Jakarta is clearly immense and requires a strategic approach over the long term, there are also important immediate opportunities to expand and intensify existing measures that build local residents’ capacity to respond to floods, and thereby reduce the number of people that are killed, injured and displaced by major flood events.
SEM 2015 117
ASIA-PACIFIC
STEPHANIE LYONS THE JAKARTA FLOODS OF EARLY 2014: RISING RISKS IN ONE OF THE WORLD’S FASTEST SINKING CITIES
REFERENCES Books and reports –– ARC. 2015. ‘Indonesia’. American Red Cross. http://www.redcross.org/whatwe-do/international-services/wherewe-help/asia/indonesia. –– HRW. 2006. Condemned Communities: Forced Evictions In Jakarta: III. Background. Human Rights Watch. http://www.hrw.org/reports/2006/ indonesia0906/3.htm. –– IFRC. 2014. Information Bulletin: Indonesia: Floods. International Federation of the Red Cross and Red Crescent Societies. https://www.ifrc. org/docs/Appeals/rpts14/IDfl300114.pdf. –– IOM. 2013. Disaster Risk Reduction Compendium: Asia. IOM. http:// publications.iom.int/bookstore/ index.php?main_page=product_ info&cPath=1&products_id=977. –– IOM. 2014b. Human Rights, Climate Change, Environmental Degradation And Migration: A New Paradigm. Issue In Brief. IOM. http:// publications.iom.int/bookstore/ index.php?main_page=product_ info&cPath=49&products_id=1067. –– McKinsey Global Institute. 2012. The Archipelago Economy: Unleashing Indonesia’S Potential. McKinsey & Company. http://www.mckinsey.com/ insights/asia-pacific/the_archipelago_ economy. –– Nurlambang, T. 2012. ‘Public Policy Matters On Climate Change And Migration In Indonesia: The Case Of Jakarta City’. In Climate Change, Migration And Human Security In Southeast Asia, 1st ed., 74-83. S. Rajaratnam School of International Studies. http://www.isn.ethz.ch/DigitalLibrary/Publications/Detail/?id=151217. –– OCHA. 2013. Monthly Humanitarian Bulletin: Indonesia. OCHA. http:// www.un.or.id/documents_upload/ newsletter/2013%2001_%28EN%29_ Humanitarian%20Bulletin.pdf. –– OCHA. 2014. Update On Jakarta Floods As Of 21 January 2014. http://reliefweb. int/map/indonesia/indonesia-updatejakarta-floods-21-january-2014.
SEM 2015 118
–– ReliefWeb. 2014. Indonesia - Jakarta Flooding (ECHO Daily Flash 5 February 2014) Report. ReliefWeb. http:// reliefweb.int/report/indonesia/ indonesia-jakarta-flooding-echodaily-flash-5-february-2014. –– Republic of Indonesia. 2013. National Action Plan For Climate Change Adaptation (RAN-API) Synthesis Report. Republic of Indonesia. https://gc21.giz.de/ibt/var/app/ wp342deP/1443/wp-content/ uploads/filebase/programme-info/ RAN-API_Synthesis_Report_2013. pdf. –– UNDP. 2015. Strengthening Disaster Risk Governance: UNDP Support During The HFA Implementation Period 2005-2015. UNDP. http://www. undp.org/content/undp/en/home/ librarypage/crisis-prevention-andrecovery/strengthening-disasterrisk-governance.html. –– UN-Habitat. 2003. The Challenge Of Slums: Global Report On Human Settlements 2003. UNHabitat. http://mirror.unhabitat. org/pmss/listItemDetails. aspx?publicationID=1156. –– USAID. 2014. Indonesia: Disaster Response And Risk Reduction. USAID. –– Wilhelm, M. 2011. Approaching Disaster Vulnerability In A Megacity: Community Resilience To Flooding In Two Kampungs In Jakarta. https:// opus4.kobv.de/opus4-uni-passau/ frontdoor/index/index/docId/175. –– World Bank. 2009. Climate Resilient Cities: A Primer On Reducing Vulnerabilities To Disasters. World Bank. http:// siteresources.worldbank.org/ INTEAPREGTOPURBDEV/ Resources/Primer_e_book.pdf. –– World Bank. 2012a. FY2013-2015 Country Partnership Strategy For Indonesia. World Bank. http:// documents.worldbank.org/curated/ en/2012/12/17559441/indonesiacountry-partnership-strategyperiod-fy13-fy15.
–– World Bank. 2012b. Jakarta Case Study Overview: Climate Change, Disaster Risk And The Urban Poor. http://siteresources.worldbank. org/INTURBANDEVELOPMENT/ Resources/336387-1306291319853/ CS_Jakarta.pdf. –– World Bank. 2012c. World Bank Supports Flood Mitigation Efforts In Jakarta. http://web.worldbank.org/ WBSITE/EXTERNAL/NEWS/0,,con tentMDK:23088802~menuPK:34466 ~pagePK:34370~piPK:34424~theSite PK:4607,00.html. –– World Bank. 2015a. Jakarta Urgent Flood Mitigation Project (P111034) Implementation Status & Results Report. World Bank. http://www.worldbank. org/projects/P111034/jakarta-urgentflood-mitigation-project?lang=en. Articles –– Douglass, M. 2010. ‘Globalization, Mega-Projects And The Environment: Urban Form And Water In Jakarta’. Environment And Urbanization Asia 1 (1): 45-65. doi:10.1177/097542530900100105. –– Firman, Tommy, Indra M. Surbakti, Ichzar C. Idroes, and Hendricus A. Simarmata. 2011. ‘Potential ClimateChange Related Vulnerabilities In Jakarta: Challenges And Current Status’. Habitat International 35 (2): 372-378. doi:10.1016/j. habitatint.2010.11.011. –– Susandi, A, D Pratiwi, T Suwarto, and M Tamamadin. 2011. ‘Adaptive Behavior Assessment Based On Climate Change Event: Jakarta’S Flood In 2007’. http://www.eepsea.org/o-k2/ view-item/id-410/Itemid-385/. –– Ward, P. J., W. P. Pauw, M. W. van Buuren, and M. A. Marfai. 2012. ‘Governance Of Flood Risk Management In A Time Of Climate Change: The Cases Of Jakarta And Rotterdam’.Environmental Politics 22 (3): 518-536. doi:10.1080/09644016.201 2.683155.
Press articles –– ABC News. 2014. ‘Tens Of Thousands Displaced In Deadly Jakarta Floods’. ABC News. http://www.abc.net. au/news/2014-01-20/an-tens-ofthousands-displaced-by-deadlyfloods-in-jakarta/5207586. –– Dewi. 2013a. ‘Kampung Project A Test For City To Provide Housing For Urban Poor’. Jakarta Post. http://www.thejakartapost.com/ news/2013/05/06/kampung-projecta-test-city-provide-housing-urbanpoor.html. –– Dewi. 2013b. ‘Jokowi Sits At Same Table With Pluit Dam Residents’. Jakarta Post. http://www. thejakartapost.com/news/2013/05/22/ jokowi-sits-same-table-with-pluitdam-residents.html. –– Dewi. 2013c. ‘Jakarta Prepares To Move Squatters To Allow For Flood-Prevention Work’. Jakarta Post. http://www.thejakartapost. com/news/2013/01/25/jakartaprepares-move-squatters-allow-floodprevention-work.html. –– Dewi. 2014. ‘Ahok Skeptical About Giant Sea Wall Project’. Jakarta Post. http://www.thejakartapost.com/ news/2014/11/03/ahok-skepticalabout-giant-sea-wall-project.html. –– Ekuatorial. 2014. ‘BNPB : Seven Culprits Of Jakarta’S Oods’. Ekuatorial. http://ekuatorial.com/ en/disaster/bnpb-seven-culprits-ofjakartas-floods#!/story=post-9572. –– Elyda. 2014. ‘BNPB Wait For Governor To Act On Flooding’. Jakarta Post. http://www.thejakartapost. com/news/2014/11/29/bnpb-waitgovernor-act-flooding.html. –– Elyda. 2015. ‘Central Govt Halts Jakarta Reclamation’. Jakarta Post. http://www.thejakartapost.com/ news/2015/04/13/central-govt-haltsjakarta-reclamation.html. –– Elyda and Dewi. 2014. ‘Red Alert: Jakarta Hit With Early Flooding’. Jakarta Post. http://www. thejakartapost.com/news/2014/11/21/ red-alert-jakarta-hit-with-earlyflooding.html. –– Hill, E. 2013. ‘Indonesia’S Ambitious Plans To Reduce Jakarta Flooding’. Floodlist. http://floodlist.com/asia/ plans-reduce-jakarta-flooding.
–– Ika, A. 2014. ‘Flooding In Jakarta: The Numbers’. Wall Street Journal. http:// blogs.wsj.com/briefly/2014/11/28/ flooding-in-jakarta-the-numbers/. –– Jakarta Post. 2013a. ‘Residents In Flood Prone Areas Ready To Be Relocated’. Jakarta Post. http://www. thejakartapost.com/news/2013/02/01/ residents-flood-prone-areas-ready-berelocated.html. –– Jakarta Post. 2014a. ‘566 People Killed By Natural Disasters In 2014: BNPB’. Jakarta Post. http:// www.thejakartapost.com/ news/2014/12/31/566-people-killednatural-disasters-2014-bnpb.html. –– Jakarta Post. 2014b. ‘Relocated Riverbank Squatters Gripe About Apartment Conditions’. Jakarta Post. http://www.thejakartapost.com/ news/2014/02/17/relocated-riverbanksquatters-gripe-about-apartmentconditions.html. –– Jakarta Post. 2014c. ‘Ciliwung Riverbank Residents Protest Eviction Plan’. Jakarta Post. http://www. thejakartapost.com/news/2014/06/07/ ciliwung-riverbank-residents-protesteviction-plan.html. –– Jakarta Post. 2014d. ‘Flood Displaces Kampung Pulo Residents Again’. Jakarta Post. http://www. thejakartapost.com/news/2014/02/24/ flood-displaces-kampung-puloresidents-again.html 1/2. –– Jakarta Post. 2015a. ‘S. Korea Offers $10M Aid For Giant Seawall’. Jakarta Post. http://www.thejakartapost.com/ news/2015/01/23/s-korea-offers-10maid-giant-seawall.html. –– Jakarta Post. 2015b. ‘Tender Begins For Sea Wall’. Jakarta Post. http://www. thejakartapost.com/news/2015/02/14/ tender-begins-sea-wall.html 1/2. –– Jakarta Post. 2015c. ‘The Week In Review: Drowning Jakarta’. Jakarta Post. http://www.thejakartapost.com/ news/2015/02/15/the-week-reviewdrowning-jakarta.html. –– Japan Times. 2014. ‘‘Great Wall Of Jakarta’ Planned To Combat Floods In Sinking Capital’. Japan Times. http://www.japantimes.co.jp/ news/2014/10/16/asia-pacific/sciencehealth-asia-pacific/great-wall-jakartaplanned-combat-floods-sinkingcapital/#.VSt8ExOUfXE.
–– Kelety. 2014a. ‘Clean Water A Luxury At Pluit Low-Cost Apartments’. Jakarta Post. http://www. thejakartapost.com/news/2014/07/12/ clean-water-a-luxury-pluit-low-costapartments.html. –– Kelety. 2014b. ‘Mampang Squatters Evicted To Widen River’. Jakarta Post. http://www.thejakartapost.com/ news/2014/08/19/mampang-squattersevicted-widen-river.html. –– Kelety. 2014c. ‘Illegal Vendors Face Ongoing Expulsions, Confiscations’. Jakarta Post. http://www. thejakartapost.com/news/2014/08/09/ illegal-vendors-face-ongoingexpulsions-confiscations.html. –– Maclean, D. 2014. ‘Flooding and Jakarta’s Urban Poor’. The Diplomat. http://thediplomat.com/2014/05/ flooding-and-jakartas-urbanpoor/?allpages=yes&print=yes. –– Purnamasari, D. 2013. ‘Human Rights Activists To Monitor Pluit Flood Relocations’. Jakarta Globe. http:// thejakartaglobe.beritasatu.com/news/ jakarta/human-rights-activists-tomonitor-pluit-flood-relocations/. –– Rochmyaningsih. 2013. ‘Is Cloud Seeding Preventing Further Flooding In Indonesia?’. Scidevnet. http://www. scidev.net/global/earth-science/news/ is-cloud-seeding-preventing-furtherflooding-in-indonesia-.html. –– Sentana, M. 2014. ‘Flooding In Jakarta Displaces Thousands Amid Continuing Rain’. Wall Street Journal. http://blogs.wsj.com/ indonesiarealtime/2014/01/19/ flooding-in-jakarta-displacesthousands-amid-continuing-rain/tab/ print/. –– Setiawati, I. 2014. ‘Flood Death Toll Rises To 23 People’. Jakarta Post. http://www.thejakartapost.com/ news/2014/01/27/flood-death-tollrises-23-people.html. –– Tarrant, B. 2014. ‘Special Report: In Jakarta, That Sinking Feeling Is All Too Real’. Reuters. http://www. reuters.com/article/2014/12/22/ us-sealevel-subsidence-jakarta-sridUSKBN0K016S20141222. –– Wardhani. 2015. ‘Jakarta Insists Coastal Reclamation Will Go Ahead’. Jakarta Post. http://www.thejakartapost. com/news/2015/04/30/jakarta-insists-
SEM 2015 119
ASIA-PACIFIC
STEPHANIE LYONS THE JAKARTA FLOODS OF EARLY 2014: RISING RISKS IN ONE OF THE WORLD’S FASTEST SINKING CITIES
coastal-reclamation-will-go-ahead. html. –– Wardhani and Elyda. 2014. ‘Flood Hits Kampung Pulo, Again’. Jakarta Post. http://www.thejakartapost.com/ news/2014/05/24/flood-hits-kampungpulo-again.html. –– Wilson. 2014. ‘Floods, Housing Security And Rights Of Jakarta’S Poor’. Jakarta Post. http://www. thejakartapost.com/news/2014/02/08/ floods-housing-security-and-rightsjakarta-s-poor.html. –– Zein. 2015. ‘The Danger Of Floods Becoming Routine’. Jakarta Post. http://www.thejakartapost.com/ news/2015/02/11/the-danger-floodsbecoming-routine.html 1/4.
–– IOM. 2014a. ‘Where We Work: Indonesia’. http://www.iom.int/ cms/en/sites/iom/home/where-wework/asia-and-the-pacific/indonesia. default.html?displayTab=latestnews&v=1392752313000. –– Peta Jakarta. 2015. ‘Petajakarta.Org/ Banjir’. http://petajakarta.org/banjir/ en/. –– PMI. 2015. ‘Ready To Face Disaster With #Siagabencana Applications’. PMI. http://www.pmi.or.id/index. php/component/k2/item/474siap-hadapi-bencana-denganaplikasisiagabencana.html.
–– Websites
–– Randall. 2013. Moving Stories: Indonesia. UK Climate Change and Migration Coalition. http://climatemigration. org.uk/moving-stories-indonesia/.
–– IDMC. 2013. ‘Indonesia: Internal Displacement In Brief’. IDMC. http:// www.internal-displacement.org/ south-and-south-east-asia/indonesia/ summary.
–– World Bank. 2015b. ‘Indonesia Dashboard’. World Bank. http://sdwebx.worldbank. org/climateportalb/ home.cfm?page=country_
SEM 2015 120
profile&CCode=IDN. –– World Bank. 2014a. ‘Jakarta Urgent Flood Mitigation Project/Jakarta Emergency Dredging Initiative Project’. World Bank. http://www. worldbank.org/en/results/2014/09/10/ jakarta-emergency-dredginginitiative-project. –– World Bank. 2014b. ‘Reducing Extreme Poverty In Indonesia’. http:// www.worldbank.org/en/country/ indonesia/brief/reducing-extremepoverty-in-indonesia. Visuals –– (Figure 1.) Wikipedia. 2009. Jakarta subdistrict. Creative commons Attribution-ShareAlike 3.0 Unported. http://en.wikipedia.org/ wiki/Jakarta#/media/File:Jakarta_ subdistrict.png –– World Bank. 2010. Jakarta Flood. Video. https://www.youtube.com/ watch?v=UjzeW5BtgNA.
CLOTHILDE TRONQUET
From Vunidogoloa to Kenani: An Insight into Successful Relocation
W
“Today, we launch the first project in Fiji to save an entire village from the rise in sea levels caused by climate change. It is real. It is happening now.” (Bainimarama, 2014).
ith this forceful introduction, Commodore Josaia Voreqe Bainimarama, Prime Minister of Fiji began his opening speech on the 16th January 2014 for the inauguration of the brand-new village where the residents of Vunidogoloa were about to move, 8 years after their initial request to relocate. This was a day for celebration, with colorful balloons, traditional outfits and ceremonial rituals, the Vunidogoloa people welcomed the Prime Minister, officials and journalists that had come to officially open their kenani (promised land) (PM Bainimarama opens Vunidogoloa Village Relocation Project - 2014, 2014). A far cry from the negatively connoted representations of environmental migration as being emergency-driven and compelled by humanitarian concerns, the Vunidogoloa relocation is the result of a well-thought-out, multilateral and participative process that lasted nearly a decade. Climate change is a crucial issue for the 30 000 Pacific Islands, especially the smallest and low-lying ones. The intrinsic characteristics of small islands make them highly vulnerable to climate change, sea-level rise and extreme events. Floods, landslides, coastal erosion and storms are expected to increase in frequency and intensity, as a consequence of sea-level rise, thus putting at risk housing, facilities, infrastructure, and also crops and vegetated wetlands. Most of the settlements and infrastructure are located in coastal areas: the IPCC estimates that more than 50% of the population of the islands in the Pacific lives within 1.5 km of the shore, exacerbating the adverse effects of climate change. The small islands’ vulnerability also raises concerns related to water resources, reef, agriculture and forest, biodiversity and energy. This high degree of vulnerability is in stark contrast to the emissions produced by these islands: while they only emit an estimated 1% of global greenhouse gases (0.006% for the Pacific Islands only), they are among the most exposed regions to the effects of climate change. They are thus required to dedicate their limited resources to adaptation strategies, representing elevated costs relative to their Gross Domestic Product (IPCC, 2007) (Wilson, 2014). Faced with sea-level rise and increasingly extreme events, Pacific islanders have no choice but to develop resilience strategies, such as climate risk management programmes. Shore protection measures have been progressively replaced by more flexible strategies: trying to adjust to sea-level rise or backing off, while putting an emphasis on water stress, energy security etc. Permanent relocation, although considered as a last resort, seems inevitable following both slow-onset and disastrous events, although the number of people that will be affected in both the short
SEM 2015 121
ASIA-PACIFIC
CLOTHILDE TRONQUET FROM VUNIDOGOLOA TO KENANI: AN INSIGHT INTO SUCCESSFUL RELOCATION
and long-term is difficult to estimate. Relocation is a multifaceted process, requiring exhaustive preparation, addressing logistical, construction and economic matters, but also having to take political and social aspects into account. In this context, the successful relocation of Vunidogoloa has taken on an exemplary dimension. Located on Vanua Levu, the second largest island of Fiji, the small village of Vunidogoloa suffered from a high exposure to sea-level rise and extreme events. The residents took up the challenge of adaptation to climate change, and engaged in a process of relocation that officially started in 2006. Headed by two ministries and the inhabitants of Vunidogoloa, the relocation project involved a wide range of actors: from the funding provided by international organisations to the support given by non-state actors. The resettlement followed a comprehensive approach with housing, economic, and cultural factors all successfully taken into account. Based on that experience, this study is an attempt to answer the following questions: How did a 150-inhabitant village in Fiji cope with climate-related risks? How did the people from Vunidogoloa manage the relocation process? What levers and actors were mobilised to implement the project? And finally, what lessons can be drawn from this experience for future adaptation to climate change in low-lying islands? The first part will consider contextual elements of the case, and then examine the various aspects of the project. The next part will examine social and cultural aspects of the relocation, before finally analysing the value of the Vunidogoloa experience for adaptation policy making. The present study is based on the examination of Fijian governmental and local administration press releases and articles in local and international newspapers; blog publications; reports and documentation issued by the International Labour Organization (ILO), the Pacific Conference of Churches (PCC), the Nansen Initiative, and academic literature on climate change and adaptation. On top of this literature, exchanges were conducted by email with a member of the PCC, who held workshops in the village before the relocation, with a member of ILO that took part in the Cash for Work Program, and finally with Brook Meakins, a Californian attorney who visited the village before, during and after the relocation.
1. CONSCIENTIZED INHABITANTS FACING CLIMATE CHANGE FIJI: The Republic of Fiji is located in Melanesia, in the South Pacific Ocean. It is composed of 333 islands, among which approximately 100 are inhabited. 70% of the barely one million inhabitants live on the largest island of the country, Viti Levu, which hosts the capital city of Suva. Sixty kilometres northeast of Viti Levu lies Vanua Levu, the second largest island with an area of some 5 400 km² and a population of more than 130 000 people. Fiji mainly relies on economic revenue from tourism, but the country also exports sugar, textiles, copra, gold and silver, which make it one of the richest and most developed countries in the Pacific zone. Fiji is also endowed with timber and fish resources. The country has had a military government since 2006 following the coup instigated by the current Prime Minister Commodore Bainimarama and the country was suspended from the Commonwealth in 2009 in the absence of the elections requested by the intergovernmental organisation. The suspension finally ended in 2014. Fiji is highly vulnerable to natural disasters and particularly prone to cyclones, earthquakes and tsunamis, floods and droughts, and landslides.
1.1. traditional village relying on a subsistence economy
The former village of Vunidogoloa is located in the province of Cakaudrove (see Figure 2: Vanua Levu (United Nations)), in the district of Koroalau, 40 kilometers
SEM 2015 122
from Savu Savu (the second largest city on Vanua Levu) and 100 kilometers from Labasa, the main city of Vanua Levu. The main road of Saqani, alternatively called the Natewa Bay road or Savusavu road is situated more than a kilometre away from the village (Figure 3: Vunidogoloa and Kenani before construction (author based on Google Maps) thus obligating the people from Vunidogoloa to travel more than one kilometre to reach the road in order to go to school, hospital etc. The village is made up of 26 houses in the Natewa Bay (see Figure 2: Vanua Levu (United Nations), with the population cited at between 122 and 150 depending on the sources, 140 inhabitants being the most oft-quoted estimation. Tradition, culture and religion are crucial to the rural community of Vunidogoloa. The inhabitants form a cohesive and homogeneous group: they all share indigenous Fijian origins, they speak the iTaukei language along with English and mostly belong to the Methodist Church, with one or two exceptions of other Christian families. The village is traditionally organised with subcommittees in charge of every single aspect of community life, such as agriculture, religion, and health (Sorowale, Vunidogoloa: climate change induced relocation, 2011). Vunidogoloa’s organisation is embedded in the traditional indigenous Fijian organisation, based on chief-ruled hierarchy, with a stratification of chiefs starting from the level of the provinces (yasana), to districts (tikina cokavata), sub-districts (tikina vou), and the village community (koro) (Mills, 2014). On the island of Vanua Levu, where Vunidogoloa is located, economic revenues mainly come from the sugar industry, the copra crop and tourism, but, as in the rest of Fiji, the economy is still largely a subsistence economy. Vunidogoloa is no exception, relying on fishing and agriculture for its livelihood. Fishing provides the main economic revenues and the villagers used to grow taro roots, malanga (tubers that resemble sweet potatoes) and potatoes, before the sea destroyed the crops. The villagers also raise pigs. Home gardens containing local crops are essential to the livelihood of small islands. The reliance on ecological resources is widely acknowledged in the Pacific Islands; a report by the Food and Agriculture Organization (FAO) cited Fiji’s level of dependence on plant resources at 65%, compared to 37% in Vanuatu, for example (IPPC, 2007). More anecdotally, the village is known for an alleged gift shared by two families to heal broken bones (Biumaiono, Mysterious gift of bone healing, 2013).
Figure 1. Fiji’s main islands: Viti Levu and Vanua Levu (Google Maps)
Figure 2. Vanua Levu (United Nations)
SEM 2015 123
ASIA-PACIFIC
CLOTHILDE TRONQUET FROM VUNIDOGOLOA TO KENANI: AN INSIGHT INTO SUCCESSFUL RELOCATION
Figure 3. Vunidogoloa and Kenani before construction
New location of the village
Saqani main road
Former village of Vunidogoloa Tabia River
Source: author based on Google Maps.
Figure 4. Former village of Vunidogoloa
Source: author based on Google Maps.
SEM 2015 124
Figure 5. Vunidogola’s new location before construction
Source: author based on Google Maps.
1.2. village exposed to the elements
The village was formerly located between the Natewa bay and the Tabia river (see Figure 3: Vunidogoloa and Kenani before construction (author based on Google Maps)), exposing it to floods when high tides coincided with heavy rains, increasing the level of the river. In interviews in local media, inhabitants attest to the recurrent flooding in the village. Floods are not a new phenomenon, but their number and intensity have markedly increased in the past decade and the inhabitants observed the rise in sea level. Sea-level rise, flooding and erosion had considerable impacts on the livelihood of community: –– The encroachment of the land by the sea and consequent erosion had already forced the village to partially move: there used to be houses located on the point where the river currently flows into Natewa Bay. The village used to cover a larger area and at that time it sat well above the sea level (Biumaiono, Rebuilding Vunidogoloa, 2013). Even before the relocation of the village, many houses had already had to be moved several times (Sovaraki, 2014). –– The construction of the houses had to be revised: the houses that were destroyed by the encroachment of the village and repeated floods were not rebuilt in the same way. The villagers recall the former houses being bigger and well built in the 1950s (Biumaiono, Rebuilding Vunidogoloa, 2013). Houses were placed on stilts (Meakins, 2012), but the elevation was not sufficient and the houses were systematically flooded. –– The extreme weather even affected the way the villagers sleep. As Julia Edwards explains, the floods have made the floors of houses distorted and irregular, preventing the inhabitants from sleeping on the floor where they found a little freshness (Edwards, Bula Bulletin: Relocation of Vunidogoloa Village, 2012).
SEM 2015 125
ASIA-PACIFIC
CLOTHILDE TRONQUET FROM VUNIDOGOLOA TO KENANI: AN INSIGHT INTO SUCCESSFUL RELOCATION
Figure 6. Weathered of wood of the stilts houses
Photo by Simi Sorowale)
Figure 7. Repeatedly destroyed makeshift walkway
Photo by Simi Sorowale
Figure 8. Stunted breadtree in Vunidogoloa
Photo by Julia Edwards
SEM 2015 126
–– Access to facilities was also complicated. The walking path going up to the main road was systematically destroyed when waves swept through the village and the inhabitants had to repeatedly rebuild it (Sorowale, Vunidogoloa: The Clear and Present Danger, 2012) (See Figure 7: Repeatedly destroyed makeshift walkway (Photo by Simi Sorowale). –– The distance from the main road forced them to use bamboo rafts to get to the hospital (Edwards, Relocation revisited: Vunidogoloa village, Vanua Levu, Fiji, 2014), which the inhabitants were unable to access at high tide. –– Food security was also challenged with a decline in agricultural productivity and the consequent disappearance of home gardens: the floods destroyed the crops the Vunidogoloa people used to grow, and made the soil saline and thus unproductive. Vegetation no longer grew in the salty soil (Meakins, 2012) and only withered fruits grew on the few breadtrees that subsisted (Edwards, Bula Bulletin: Relocation of Vunidogoloa Village, 2012). Moreover, severe drought also affected the yields (Sorowale, Climate Change and Relocation: Vunidogoloa and Nukudamu , 2012). In addition to flooding and erosion, Vunidogoloa, like the rest of Fiji, is also exposed to other natural risks such as tropical cyclones, an example of which is the intense cyclone Tomas that struck Vanua Levu in 2010. In 2012, the Cakaudrove province was cited as the worst affected by climate change in Fiji during the National Summit for Building Resilience to Climate Change (Fiji Times - PACNEWS, 2012). Vunidogoloa is a traditional Fijian village, with a small and homogeneous population both in ethnic and religious terms. The village relies on subsistence activities mainly based on fishing and, to a lesser extent, agriculture. In the last decade the environmental degradation caused by sea-level rise, storms and erosion – exacerbated by the village’s remote location – affected the villagers’ livelihood and living conditions, causing them to think about relocation. The fact that relocation seems to be fully driven by environmental factors makes the residents “environmental migrants”, although this term was rarely used in the media. The existence of other intertwined social and economic circumstances as catalysts for the relocation can also be considered; for instance, the remoteness of the village from the main road and the thus complicated access to medical and educational facilities may also have contributed to the residents’ request to move. Although exact data on fishing resources is unavailable, it is also possible that overfishing or climate change have made them scarcer, enhancing the inhabitants’ desire to move.
2. RELOCATION: A LONG-TERM AND COSTLY PROCESS 2.1. Relocation as a last resort: from the necessity to adapt to relocation
The idea of relocation dates back to the 1950s. Quoting the headman, Sailosi Ramatu, the journalist Ana Sovaraki recalls in the Fiji Sun that the first instance of reaction to extreme climatic events occurred in 1956, when talks put the idea of relocation on the table, even though it was not carried out at that time. According to Mr. Ramatu, the village was not resettled because, unlike today, the villagers were not well-informed with regard to climate change and environment-related risks; the elders were reluctant to relocate (see part III.A.); and the necessary funds to put a relocation process in place were not available (Sovaraki, 2014). Adaptation to new climatic patterns was first implemented with the inner resources of the village. Firstly, as mentioned above, the most threatened houses were moved, but the sea kept gaining ground. A second strategy consisted in building a seawall in order to keep the high tides at bay. According to the Fiji Times, a wall was funded by the Japanese government (Biumaiono, Rebuilding Vunidogoloa, 2013). In
SEM 2015 127
ASIA-PACIFIC
CLOTHILDE TRONQUET FROM VUNIDOGOLOA TO KENANI: AN INSIGHT INTO SUCCESSFUL RELOCATION
fact, the still visible seawall was not the first one to be built: as noted in a fieldwork study carried out in the village, the remnants of a former sea wall are located under water 60 meters away from the current shoreline (Sorowale, Vunidogoloa: The Clear and Present Danger, 2012). Even though the seawall was protective for a time, the sea progressively overtook the wall and progressively broke it down. Worse still, the wall now has a detrimental effect on the village, holding water within the village area, preventing it from receding to the sea. Figure 9. Broken seawall
Photo by RCommuser on FlickR
Having noted the inadequacy of moving houses to different but equally precarious sites within the village and building seawalls, the inhabitants strongly considered relocation as a last resort. Relocation was discussed for years before the village finally resolved to ask for the government support. The villagers approached the government and formally asked for relocation assistance in 2006, at a time when the impacts of floods and erosion were becoming harsher. With this request, Vunidogoloa set a precedent, as it was the first village to ask to relocate due to climate change related-events. The government accepted the proposed relocation but the project did not start straight away. Numerous discussions and consultations were held among the villagers and the project commenced once the inhabitants had given their consent. During the discussion process, the 2010 cyclone Thomas had a marked impact on the debates by making climate-related events more visible, raising awareness both in the village and within the government (Datt, 2014). Indeed, the awareness raising process was not only occurring at the village level, but also at the government level as evidenced by the holding of the first National Summit for Building Resilience to Climate Change in October 2012. The meeting illustrated new concerns and political will to address the impacts of climate change. It also had an educational dimension, seeking to inform the population about their changing environment. The manager for the Provincial Services iTaukei Affairs Board, Timoci Namotu, reported that provincial officers had launched a training programme and information work targeting the population of Cakaudrove (Vunidogoloa’s province)
SEM 2015 128
at the district and village level (Fiji Times - PACNEWS, 2012). The dissemination of information most probably contributed to the growing awareness of the population, including in Vunidogoloa. Indeed a striking feature in the interviews transcribed in the press from 2012 onwards, is the fact that inhabitants were clearly aware that the slow-onset events and extreme natural disasters that struck them were caused by climate change, a feature that was confirmed by Brook Meakins.
2.2. The relocation project: location and progress
In 2012, Vunidogoloa officially received the support of the government and was selected to be the first village to relocate. As such, the relocation process had an experimental element. The relocation plan initially covered the building of 30 houses and water and energy facilities, with government assistance focusing on funding, technical support and advice.
2.2.1. Kenani, the chosen and promised land
The selection of a site for the relocation was crucial in the process. The fact that the site was chosen rapidly by the inhabitants certainly constituted a factor of the success of the relocation. Newspaper reports make no mention of any other potential site that might have been considered for the relocation, and, as reported in the Fiji Times, the site had first been identified as early as 1952 in the perspective of a potential relocation (Biumaiono, Rebuilding Vunidogoloa, 2013). The site lies on higher ground, nearly two kilometres inland from the original village site, but still within Vunidogoloa boundaries (see Figure 5: Vunidogola new location before construction (Google Maps). One house already stood alongside the new site (Meakins, 2012). It is a 5-acre parcel, which belongs to one of Vunidogoloa’s residents: Mataqali Nadawa and it was apparently donated without compensation (Taleitaki, 2014). The absence of land-related issues greatly facilitated the project; as a member of the national disaster management office stated, the acquisition of a new land would have extended the relocation process and involved far higher costs (Wilson, 2014). The villagers named it Kenani, after the Fijian word for Canaan, the Biblical Promised Land. As the headman declared to the Methodist mission partner Julia Edwards “after many years our prayers have finally been answered”; “God has allocated a special place for us” (Edwards, Climate justice and the Pacific Conference of Churches: moving the relocation agenda in the Pacific, 2014). The religious dimension of the relocation of Vunidogoloa should not be underestimated; the fact that the villagers consider their new village as a place given to them by God imbues the relocation process with meaning in the eyes of villagers and highly contributed to their approval of and commitment to the project (see part III.B.).
2.2.2. A delayed but successful implementation, based on local participation
The project was only officially launched in 2012, when Vunidogoloa received the government confirmation that they had been selected for relocation. The relocation plan covered the building of 30 identical houses, in accordance with the choice of the villagers that everyone would be treated equally. All houses were to be equipped with their own separated kitchen, with running water, provided by a natural system through gradient drainage, requiring the construction of a water source and tanks. The houses were also planned to have a proper bathroom with inside toilets and a shower, which was not the case in the former village. Finally, the plan included an energy supply with solar panels for each house. It also planned to implement incomegenerating activities to ensure the livelihoods of the community. From the beginning, the relocation process has been driven by equality concerns and has been based on a consensual and participative decision-making process. The provision of basic facilities and economic opportunities demonstrates the comprehensive character of
SEM 2015 129
ASIA-PACIFIC
CLOTHILDE TRONQUET FROM VUNIDOGOLOA TO KENANI: AN INSIGHT INTO SUCCESSFUL RELOCATION
the relocation: it is not simply about moving people from one place to another, but also aims to ensure better living conditions and to serve the community’s livelihood. Due to a lack of evidence, it is very hard to distinguish the elements of the project which directly stemmed from the villagers’ will from those which arose from government input, as well as the changes that were made to the project during its implementation. It should be noted that all reviews of the project emphasise its participative and inclusive aspects, underlining the fact that villagers had a central role in the decision-making process. It was decided, seemingly by the villagers, that each married couple would have its own house; the former village only had 26 houses and some married couples used to share their house with up to three families (see part I.A.) (Edwards, Relocation revisited: Vunidogoloa village, Vanua Levu, Fiji, 2014). Although not greatly commented upon in the media, the implementation of the project was delayed in several regards, firstly from its confirmation in 2006 to an official launch in 2012. Subsequently, the construction of the houses was due to be completed by the end of 2012 (Silaitoga, Sea level woes, 2012), but was only finished at the beginning of 2014. In August 2012, the divisional planning officer north Alipate Bolalevu justified the delays in the local press by citing the time needed to fulfil all of the requisite procedural stages before the construction could actually start: “The villagers will inform government through district and provincial council meetings of the situation they face in their villages as a result of climate change. Then they will have to identify a new piece of land for relocation and liaise with the mataqali for consent. When that is done, the villagers together with the consent from the mataqali will inform their provincial council offices and then it will come to the Ministry of Provincial Development where assistance and other relocation details would be attended to.” (Silaitoga, Sea level woes, 2012). An initial delay can be attributed to the earthwork the parcel required. The site was located on the top of a hill, which needed to be lowered and earthen tiers were constructed (Silaitoga, Works delay village relocation, 2012). After heavy rain, the recently levelled ground was then found to be prone to erosion and landslides, which gave rise to new work. The villagers planted long-rooted vetiver grass – locally known to stabilise the soil – on the advice of agricultural officers (Silaitoga, Villagers put down roots, 2012). Then, the delivery of the building material was planned for the beginning of September 2012 (Silaitoga, Sea level woes, 2012), but by the end of 2012, the soil had not yet been sufficiently stabiFigure 10. Villagers planting grass lised ,and timber had been cut for only two houses (Edwards, at the new village Climate-induced relocation: a first for Fiji, 2013). Contradictory information arises from the different press reports, government press releases and international organisations concerning the tempo of construction of the houses, which research work for the present study did not manage to clarify. In March 2013, according to the Fiji Sun, 3 houses were reported to have been built in the new village (Tuimoala, 2013). In September 2013, according to the Fjii Times, 14 houses had been built thus far and 16 others had been planned (Moceiwa, 2013). This affirmation closely corresponds to ILO information of September 2013, according to which 16 houses had been built in 7 months (ILO, 2013). But in December 2013, the government stated in a press release that only 10 had been built, including 8 completed with 24 still to be completed (Fiji government, 2013). The construction resumed at high speed with 4 houses being built in 15 days (ILO, 2014). The houses were finally completed by the very end of 2013 (New homes to open soon with income generating provisions for Vunidogoloa residents, 2013). One thing that is certain is that the lack of materials was at least partially responsible for the slow progress of the work Photo by Serafina Silaitoga
SEM 2015 130
and its suspension for 4 weeks in August and September 2013. As was confirmed by a member of ILO, the volunteers that built the houses had to share the same building tools, which considerably slowed down construction; although a few months beforehand a journalist suspected that the delays were caused by the recurrent stability problems of the ground (Pareti, 2013). Figure 11. Houses under construction in April 2013
Photo by Julia Edwards
Figure 12. Houses under construction in August 2013
Photo by RCommuser -Flickr
The houses were built according to the initial plan, and were effectively endowed with a supply of water and renewable energy, and although the construction suffered some delays, the postponement of the move does not seem to have caused any kind of conflict. On the contrary, Reports bear witness to the enthusiasm of the villagers and their gratitude regarding the government involvement at all stages of the construction process (Silaitoga, Villagers put down roots, 2012). Although the houses were built gradually, the villagers moved together to the new site of Kenani over a three-day period in January 2014.
SEM 2015 131
ASIA-PACIFIC
CLOTHILDE TRONQUET FROM VUNIDOGOLOA TO KENANI: AN INSIGHT INTO SUCCESSFUL RELOCATION
The question of property rights has not been addressed in the media, but as confirmed by a member of ILO, the inhabitants not only benefit from the usufruct of the houses, they also own them.
2.2.3. Shared costs revised upwards
As of 2012, it was acknowledged that the Fijian Government would cover two thirds of the relocation costs, corresponding to the building materials, the construction of the houses, the construction of the infrastructure related to income-generating activities and labour. It was planned that the villagers would contribute the remaining third of the cost that would be provided through wood supply and labour (Meakins, 2012). This division of the financial burden, suggested by the government, seemingly won unanimous approval. It is hard to establish an exact estimate of the costs of the relocation, as the figures communicated varied a great deal depending on the stage of the relocation and the source, but it can be clearly asserted that the actual expense exceeded the expected costs. Thus the 2/3-1/3 equation was exceeded, turning into a 75% governmental 25% local split according to the media, and in truth the governmental part probably exceeded 75% of the costs. The landscaping work was not planned at the beginning of the project and generated new expenses. In March 2013, the director of environment of the Commissioner Northern’s office, Jope Davetanivalu indicated to the press that the FJD 310,000 made available by the government had to be increased by an additional FJD 50,000, mostly because of the irregularities of the location site. In 2013, the director treaties of the Foreign Affairs Ministry, Esala Nayasi, evoked a FJD 200,000 surplus for the excavation work of both Vunidogoloa village and Narikoso (another village engaged in a relocation process), without giving any detail on the precise sharing of the costs by each village (PCC, 2013). In another article, the planning officer north Alipate Bolalevu explains that the cost of the Kenani site levelling was about FJD 130,000, which would match the figures of Esala Nayasi with 65% of the earthwork expenses for the two villages dedicated to Vunidogoloa. At the launch of the project, in 2012, the estimated cost of each house was around FJD 15,000 (Rawalai, Village relocation begins, 2013), amounting to FJD 450,000 overall for the 30 houses, with two thirds (FJD 300,000) supposedly covered by the government. In 2013, the press communicated that the allocated budget for the relocation amounted to $360,000 (Pareti, 2013). But, despite the fact that the infrastructure for income generating activities has to be added, this figure is far below the actual cost. By the end of the process, in January 2014, the government communicated that it had spent FJD 879,000 (some USD 432,206) on the whole relocation process (Silaitoga, Villagers to move into new homes, 2014). However, according to the IPS news agency, the cost of the relocation process reached FJD 978,000 (Wilson, 2014). Finally, at the Conference of the Parties in December 2014 in Lima, the figure was put at FJD 988,228.89 (SPEREP, 2014). It can thus safely be said that the actual cost of the relocation amounted to nearly three times the original cost planning. The village contribution, as mentioned above, was provided in the form of timber and labour. A logging license was issued by the government for the village to cut down part of the forest on their own territory, with the logging handled by a local company, Vitiana Timber Limited, owned by the recently deceased local businessman Bhadur Ali (Edwards, Relocation revisited: Vunidogoloa village, Vanua Levu, Fiji, 2014) (Biumaiono, Rebuilding Vunidogoloa, 2013). The financial contribution corresponding to the timber was estimated at FJD 250,000 (Edwards, Relocation revisited: Vunidogoloa village, Vanua Levu, Fiji, 2014), namely 22% of the total project (excluding the valorisation of the labour). Beyond the financial distribution between the government and the villagers, the distribution reflected a process of task sharing: the villagers were in charge of logging the wood and were expected to take part in the construction process and the
SEM 2015 132
government covered the remainder of the expenses. The access to timber resources within the community was therefore a key element of the relocation’s success.
3. A COMPREHENSIVE PROCESS REQUIRING MULTILATERAL MOBILISATION 3.1 Relocating: from construction to economic empowerment
As observed above, the relocation process went hand-in-hand with an improvement in living conditions thanks to the provision of basic facilities and through the development of income-generating activities, building a true comprehensive framework for the relocation. From the construction of the houses to the establishment of new economic activities, a wide range of actors were mobilised in the relocation process. The villagers undoubtedly played a fundamental role in the relocation but they were closely supported by the local and national governments and they also benefited from assistance from international organisations. The project was a joint venture between the villagers, the local government with the support of the Commissioner Northern’s office, the national government with the assistance of the Ministry of Provincial Development, National Disaster Management and the Ministry of Labour, in particular through the participation of volunteers from the National Employment Centre (Vunidogoloa cashes in, 2013).
3.1.1. Construction of the houses
The construction of the houses was undertaken by volunteers identified by the Ministry of Labour among the unemployed people registered at the National Employment Center (NEC). After a selection process, 12 qualified unemployed people were selected out of 28 to work on clearing the parcel, crop planting and construction of the village. All of them followed an Occupational Safety and Health training course and attended a session on the traditional values and good practices and behaviour (ILO, 2014). For the work completed, they received a weekly allowance from the Ministry of Labour in addition to board and lodging. Observing that construction was advancing at a slow pace due to the lack of tools, the Ministry of Labour requested the support of the ILO within the framework of an adapted Cash for Work Plus Programme. After the conclusion of an agreement in November 2013, the ILO provided safety equipment and additional tools to the volunteers, which sped up the construction of the houses, with 4 houses being built in 15 days.
3.1.2. Installation of solar panels Figure 13. Solar panel in Kenani
Photo by Julia Edwards
SEM 2015 133
ASIA-PACIFIC
CLOTHILDE TRONQUET FROM VUNIDOGOLOA TO KENANI: AN INSIGHT INTO SUCCESSFUL RELOCATION
The use of solar power systems is part of a wider energy policy to which Fiji has committed. With the aim of reducing emissions and in pursuit of energy independency, Fiji has already become a “renewable energy island” with more than half of its electricity being produced by renewable energy sources (IPCC, 2007). In the case of Vunidogoloa, the installation of solar panels was facilitated by the existence of a UN Women-funded rural empowerment programme, which trained 10 Fijian women in solar engineering at the Barefoot College in India for 6 months in 2012. Thanks to this capacity-building programme, trained women took responsibility for the electrification of the new houses, as was the case for a dozen Fijian villages, and the villagers could benefit from up to 3 solar lights, for the price of the wiring (Edwards, Relocation revisited: Vunidogoloa village, Vanua Levu, Fiji, 2014) (Rawalai, Woman lights up homes, 2014) (Fiji Government, 2014).
3.1.3. New economic opportunities
The development of income-generating activities was included in the project from the beginning but elements of the economic activities to be developed in the new village changed over time, such as the modalities of support. As recalled by a member of ILO, it was initially planned that the inhabitants would receive a cash grant amounted to FJD 200 per family for their own economic development, however it was later decided that the income generating activities would be developed at the community level jointly with the assistance organisations. The activity of rice farming, mentioned in 2012 (Kumar, 2012), disappeared from the project later on, aquaculture and pineapple farming were mentioned from the beginning and remained in the project, and finally, the installation of copra drier and the planting of banana shoots was added by the end of 2013. These different activities were implemented through close cooperation between the Ministry of Agriculture, the Ministry of Fisheries, and the ILO. Figure 14. Pineapple tops and ponds in Kenani
Photo by Julia Edwards.
SEM 2015 134
After surveying the area, the Ministry of Agriculture recommended the planting of banana and pineapple tops, which were provided by the ILO, and staff from the Ministry of Agriculture assisted the villagers with the planting of the crops and advised them on farming practices. Finally, the ILO also provided copra dryer (ILO, 2014). Considering the extended distance to the sea, the promoters of the project also considered aquaculture as a complementary activity to fishing. Four fish and prawn ponds (out of the 8 initially announced in 2013) were built by the Ministry of Fisheries (Silaitoga, Villagers to ready eight new ponds, 2013). During the visit of the Methodist church in November 2014, only one pond had been stocked with fish (Edwards, Relocation revisited: Vunidogoloa village, Vanua Levu, Fiji, 2014). Cattle farming infrastructure, such as paddocks have also been built (Wilson, 2014). The Vunidogoloa relocation was not a mere population movement; it was accompanied by structural changes aiming to improve living conditions and make the community more sustainable and more resilient to climate changes. The Government and the ILO supported the relocation so that Kenani would offer new economic opportunities, supporting a transition from fishing-based revenues to agriculturalrelated activities more broadly speaking and creating new economic opportunities. The villagers received material assistance, technical advice, and training in order for them to tackle the new activities. A lack of information precludes an evaluation of the actual appropriation of the agricultural crops and aquaculture infrastructure and the effective economic benefits derived from them.
3.2. Post relocation observations: improved quality of life in an on-going project
The move to Kenani has taken place and the available reviews of community life in the new village are very positive. The villagers seem very grateful to the government for having funded and managed the relocation. As summarised in the report undertaken by the Methodist church in November 2014: “life is easier”. The relocation has facilitated an alleviation in the daily life of the villagers: the proximity of the road has simplified access to facilities; now the children are able to go to school by bus and the hospital can be reached easily. Fishing activities have continued in conjunction with the new activities, the only drawback being that the fishermen are now forced to commute back and forth to the sea to go fishing. No trace seems to remain from the concerns evoked in 2012 about children’s safety arising from the proximity of the new site to the main road (Edwards, Bula Bulletin: Relocation of Vunidogoloa Village, 2012). The village has even become an attraction on the island and school children frequently visit it (Edwards, Relocation revisited: Vunidogoloa village, Vanua Levu, Fiji, 2014). This pedagogical role of the village could potentially turn Kenani into a tourist attraction. However, in January 2014, the relocation was still not complete. The exposure to landslides and erosion necessitated the implementation of a second phase of the project, as further landscaping was needed, in conjunction with the installation of waterways, drains and footpaths. An evacuation centre was also built during this second part of the project. The second phase has further increased the overall cost of the relocation: in September 2014, the government estimated that the additional cost amounted to FJD 200,000 (Fiji Government, 2014).
4. COPING WITH THE SOCIAL CONCERNS RELATED TO RELOCATION 4.1. Leaving home: acceptance and memory work in a traditional society
Leaving home is never an easy process and Vunidogoloa was no exception to that rule, as the headman confirmed in 2014: “It was not easy for the village community to relocate” (UNOCHA, 2014).The vast majority of the villagers took part proactively in
SEM 2015 135
ASIA-PACIFIC
CLOTHILDE TRONQUET FROM VUNIDOGOLOA TO KENANI: AN INSIGHT INTO SUCCESSFUL RELOCATION
the relocation process and, as mentioned above, the residents consider the new site to be a holy land. But the move was particularly difficult to accept for others, as highlighted by Brook Meakins who visited the village before its move in 2012, and who observed that the relocation process aroused various issues ranging from property rights1, lack of financial means, to cultural loss (Meakins, 2012). The elderly were particularly sensitive to this loss, as they had spent their entire lives in the village and felt it to be part of their existence and identity: “This was especially true for older people that had lived in the village all their life, because the land is part of their culture and identity.” said the headman. He described the relocation process as “a very emotional period for us as there was a lot of waiting, insecurity, and questioning.” (UNOCHA, 2014). Distancing themselves from their home village raised significant concerns among the inhabitants, especially in the traditional Pacific context, where ties to the land are especially close, strong and meaningful. Indeed, the concept of land (vanua in Fijian) is imbued with traditional significance that goes far beyond the economic value of the land. Vanua refers to the profound link between the people and the land, the land steeped in cultural heritage, transmitting identity to the people through their ancestors. This connection rules as a leading principle in the management and sustainable use of natural resources (IPCC, 2007). Understanding the vanua concept makes the trauma of leaving one’s homeland more intelligible, as relocation may be understood as a threat to the villagers ‘identity and cultural heritage. This approach also makes the concerns that were raised regarding the cemetery of Vunidogoloa more understandable: the inhabitants refused to leave the remains of their ancestors in a place vulnerable to the sea and chose to move them to the new location, which finally seemed to suit the villagers: “The new cemetery is now more convenient, and we save time going to visit there compared with accessing the old site” said an elder, quoted by Julia Edwards (Edwards, Relocation revisited: Vunidogoloa village, Vanua Levu, Fiji, 2014). However, the relocation of a community to a nearby site, in the case of Vunidogoloa a site on the community’s own land, remains the least disruptive type of migration (Campbell, 2010): the community moved altogether, preserving their identity, tradition and even the structure of their neighbourhood, with neighbours from the former village remaining neighbours in the new one (Edwards, Relocation revisited: Vunidogoloa village, Vanua Levu, Fiji, 2014); and the move was made within village-owned land boundaries. The old village was not removed and still stands where the river Tibia and the Natewa Bay meet. As some articles report, the villagers still regularly visit it. As stated in the reports made by visitors, the vast majority of the population accepted the move, often with enthusiasm. Nonetheless, Vice mentions a striking anecdote in a photo report published in March 2015: the case supposedly recounted by the headman, Sailosi Ramatu, is the story of an old man who reportedly returned to the old village to be left to die there (Tan, 2015). An awareness-raising workshop was held in Vunidogoloa before the relocation took place in 2012. It was organised by the Pacific Conference of Churches (PCC) and the Nansen Initiative. The workshop provided an opportunity for the oldest villagers to tell their stories and discuss the history of Vunidogoloa. The villagers also reported the progressive environmental changes that had occurred over the past few decades and were able to voice their fears and hopes regarding the relocation process. Despite the fact that research for this study did not unearth any villager feedback on the workshop, it can be confidently stated that this forum for
1. Indeed, the customary tenure of 80% of the land in the Pacific did not make the relocation any easier as it renders any land transaction at the community level almost impossible (Anderson & Lee, 2010)
SEM 2015 136
dialogue and exchange was valuable for the villagers, as a communal act to discuss and come to terms with a major change in the life of the community. Lastly, it should be recalled that migration and displacement in general are not new features for Pacific Islanders. The case of the Banabans, forced to migrate to Fiji in 1945 (Edwards, Phosphate mining and the relocation of the Banabans to northern Fiji in 1945: lessons for climate change forced displacement, 2014) is only one of a number of examples in the history of Pacific mobility; mobility runs in the Pacific islanders’ veins (Hau‘Ofa, 1994). This tradition of mobility is also present in Vunidogoloa. Indeed, during the 2012 awareness-raising workshop, a previous displacement of the community was evoked: their ancestors had already had to move from the inland mountain of Vanua Levu to the coastal area when their settlement was flooded (Edwards, Bula Bulletin: Relocation of Vunidogoloa Village, 2012). The recollection of a past experience of displacement may also have enhanced the adaptive capacity and resilience of the community.
4.2. Religion and the role of the Pacific Conference of Churches
Christianity is the main religion across the Pacific, but the region offers a multitude of syncretism. At the regional scale, the Pacific Conference of Churches (PCC) brings togther the Christian churches of the region and has a membership of 6.5 million people. In Fiji, 80% of the population are Christian and most of them belong to Methodist churches, which corresponds to Vunidogoloa’s case where the whole population is Christian and the vast majority belonging to Methodist Church (see part I.A.). Religion is a major feature in the life of Pacific islanders and Vunidogoloa is no exception. The faith of the villagers accompanied them all along the relocation process. As early as 2007, when the relocation had just been confirmed by the government, the villagers devoted the first Friday of each month to prayers and fasting for the relocation process (Edwards, Climate-induced relocation: a first for Fiji, 2013). The choice of the name Kenani, meaning “promised land” is also very indicative of their Christian devotion. The significance of religion in the life of the Pacific islanders confers a primary role to the churches in terms of day-to-day support. In light of the environmentalrelated events suffered by the Pacific Islands, it seems obvious for the church to take up the issue of climate change. At the regional level, the PCC is a recognised actor and expert on climate change. The Conference has developed advocacy work to frame environmental displacements, in conjunction with governments, civil society and regional organisations. It has also developed assistance programmes to help Pacific communities and their local churches to cope with climate change (UNOCHA, 2014). In the case of Vunidogoloa, the PCC became a key stakeholder regarding the social aspects of relocation. According to the Climate Change Officer of the PCC, Peter Emberson, the villagers asked for spiritual guidance in 2012: “Basically they wanted to know where the church stood in relation to their displacement”, “They wanted to hear from someone in authority in the church, so we helped facilitate that for them.” (Pareti, 2013). The Methodist Church General Secretary, Reverend Dr Epineri Vakadewavosa then visited the village and reassured the inhabitants. The PCC first heard about the relocation of the village through local news. They contacted the Methodist Church of Fiji and Rotuma (a member of the PCC), who arranged a first visit in March 2012. Later in 2012, the PCC organised a 3-day awareness-raising workshop in conjunction with the Nansen Initiative in order to brief the villagers on climate change issues, and undertook work on the community history (see III.A.). In April 2013, the PCC returned to Vunidogoloa with the assistant general secretary of the Methodist Church, and held a learning exchange session that pursued the historical work started the previous year. Three other visits were subsequently organised, the latest of which took place in February 2015. During the whole process,
SEM 2015 137
ASIA-PACIFIC
CLOTHILDE TRONQUET FROM VUNIDOGOLOA TO KENANI: AN INSIGHT INTO SUCCESSFUL RELOCATION
the PCC provided expertise to the villagers and helped them to prepare for relocation. The Church acted as a forceful cohesive stakeholder and a substitute for public social services in the process. A particularly remarkable facet of the Church’s contribution to the process was its ability to directly interact with the community but also to interact with superior authorities; indeed, the PCC was asked by the government to run the Climate Change related discussion group in national conferences. Lastly, a year and a half after the move, a project to build a church is now underway, with the crowdfunding campaign Indiegogo Vunidogoloa, led by the Californian attorney Brook Meakins, who visited the village several times, following requests from the villagers for this kind of assistance.
5. POLICY IMPLICATIONS: THE LESSONS LEARNT FROM VUNIDOGOLOA CASE 5.1. Appraising the Vunidogoloa relocation
Although the relocation of the village of Vunidogoloa was successful in the sense that the inhabitants moved under favourable circumstances with a good level of support and that they themselves are happy about the relocation, some elements of the process itself may be questioned and also with regard to the way in which it could be replicated. The presence of land and timber resources was a crucial aspect of the relocation. The villagers had internal resources that meant they were able to move within their own land boundaries, avoiding major concerns regarding land property rights. These resources also considerably reduced the financial cost of relocation, and the principal contribution on the part of the villagers was the provision of timber that they already owned. It is difficult to say what might have happened had the community not owned a sufficient and appropriate area of land, especially in the context of customary tenure that complicates land transactions and often make them impossible. It is unclear whether the government would have been able to assist the community in land transactions or contribute to the purchase of timber. It is hard to say if a community deprived of resources, even one as exposed as Vunidogoloa, would have succeeded in moving. The sustainability of the timber resource can also be questioned; there is no information on how the wood was cut, if sustainability standards were applied and if – in the hypothesis of a multiplication of relocations on the island – the constructions standards, involving land clearing and wood cutting, would ensure sustainable management of land and forests. Moreover, the issues of erosion and landslides that were discovered late in the process of Vunidogoloa’s relocation call into question the planning of the relocation: should geographical and biophysical considerations not have been taken into account earlier in the project, and, in the case of a risky choice of location, to what extent should the will of the inhabitants prevail? In this sense, the Narikoso case provides another example of a relocation site exposed to environmental-related risks (see part IV.B.). Last but not least, the social concerns of the relocation were addressed through the voluntary assistance from religious organisations. Although they are highly implicated on climate change-related matters, the sustainability and durability of such arrangements can be questioned, and it could be argued that the State should incorporate the role currently assumed by the church? The timeline and cost of the relocation are also matters of concern. The project was confirmed in 2006 but only implemented in 2012, with the actual move taking place in 2014, a period of at least 8 years for the project to come to fruition. Even if relocation seemed to be the most appropriate and, in fact, the only solution left for Vunidogoloa, the question of what can actually be offered to other communities in
SEM 2015 138
emergency situations should be posed. The government’s administrative ability to concurrently lead various projects of this kind is questionable, especially regarding its financial capability. From an initial 2/3 governmental-1/3 local division, the government ended up covering more than three quarters of the costs of the relocation, which in all probability were three times higher than the original estimate. More than 1 million Fijian dollars were spent on the Vunidogoloa relocation, and this substantial cost casts doubt on the viability of the project to be replicated elsewhere.
5.2. Narikoso and other future relocations in Fiji
Vunidogoloa is not a unique case in Fiji. The mean sea level has risen by an average of 4.6mm per year since 1993 according to the Lautoka tide gauge in western Fiji, putting numerous communities at risk. As early as 2012, the Vunidogoloa villagers reported visits of other village leaders seeking advice in the perspective of their own possible relocation (Meakins, 2012). Other relocation projects have taken place, such as those in Narikoso and Denimau. Narikoso is located on Ono Island, about 280km from Vunidogoloa, and shares similar characteristics with Vunidogoloa: a population of more than a hundred inhabitants, about 30 houses, a location in a coastal area that was flooded in the case of high tides, with a seawall that no longer helped to limit the damage. The village requested assistance for relocation from the Government in 2011. A site has been designated for relocation, and here again, the land is owned by locals. But the Narikoso villagers have not been as lucky as their counterparts in Vunidogoloa: the lowering and stabilisation of the land was not sufficient to make the site hospitable and the Government provided an engineering team to help stabilise the site. Just as in the case of Vunidogoloa, the process was consensus-based and participative, and the relocation was a multilateral process: the government supported the relocation in conjunction with the Secretariat of the Pacific Community (SPC) – an intergovernmental organisation - and the German development agency GIZ (UNOCHA, 2014). The PCC also assisted the process of relocation. Other villages in Fjii are concerned by relocation processes. In this regard, the Vunidogoloa relocation has acted as a catalyst for other processes and helped to raise awareness; in its wake the Government has conducted assessments of the impact of climate change on the island, and it was announced at the beginning of 2015 that about 800 communities had already been affected by the impacts of climate change in Fiji. From this assessment it was evaluated that some 45 villages need to be relocated over the next 5 to 20 years (Naivua, 2015) (Susu, 2015).
5.3. Fiji’s guidelines for relocation: leading the adaptation debates at the local and international level
The perspective of multiple relocations in a short time period has been accompanied by the drafting of guidelines on climate change adaptation and relocation in particular. The adaptation plan has evolved over time in Fiji and relocation is now a preferential adaptation strategy. As has been observed above, the Fiji government is working to disseminate information in the communities. The formerly feted seawalls are no longer considered as an effect means of combating sea-level rise, and are thus now only regarded as temporary facilities (PCC, 2013). Since the Vunidogoloa relocation, the Fijian Government has been developing a relocation policy in order to be able to respond to community requests in a systematic and ordered way. The German agency GIZ is assisting the Fiji government with this effort. General guiding principles on community ownership, participation, equity and equality should be established. Climate change concerns will be integrated into national government planning and thus budgeted for. It is also expected that relocation guidelines will be drawn up to complement the 2012 national climate change policy. The guidelines are still to be formally discussed, and as far as their
SEM 2015 139
ASIA-PACIFIC
CLOTHILDE TRONQUET FROM VUNIDOGOLOA TO KENANI: AN INSIGHT INTO SUCCESSFUL RELOCATION
legislative implications are concerned, no appropriate legal framework addressing environmental-related displacement has been established as of yet (Wilson, 2014). This legislative and governmental ambition is at risk of being confronted with limited resources in terms of human capital, and technical and financial capabilities. This is especially the case due to the low accessibility to international funds, and in particular to the Climate Change adaption fund due to the complexity of the application procedures and an overall lack of funding. This concern is shared by all Small Islands Developing States (SIDS) that are on the front line of the impacts of climate change and sea-level rise. The national relocation strategy is closely linked to the UNFCCC process and its discussions related to environmental migration. The Fijian Government has already integrated relocation as an adaptation tool to deal with climate change, but anticipation is not sufficient, especially considering the uncertainty related to climate change projections. Increasing the resilience of small islands should be considered as a comprehensive process, and a holistic approach should be favoured, taking into account cross-sector considerations, from socio-economic concerns to environmental systems. In the case of Fiji and Vunidogoloa in particular, the creation of alternative economic activities was crucial, especially considering the adverse impacts of climate change on marine ecosystems and therefore on traditional fishing activities (IPCC). Numerous challenges remain to be overcome, particularly the financial burden that relocation represents: finding sustainable funding for future relocations is key to the development of the adaptive capability of Fiji and other small islands.
CONCLUSION The example of the Vunidogoloa relocation highlights the viability of internal and international migration as an adaptation policy, disavowing the negative image that is often associated with it. The village of Vunidogoloa in Fiji has set an exemplary precedent in climate-related relocation. Suffering from slow-onset and disastrous events, the residents engaged in a relocation process supported by the Fijian authorities after a long period of internal discussion. The project was undertaken with the successful ambition of ensuring better living standards for the population. The success of the relocation was based on: i) a proactive and participative attitude of the population, facilitated by the procedures followed by the government; ii) a comprehensive approach increasing the resilience of the community, improving its living conditions but also offering new economic opportunities, ensuring both food security and new income-generating activities; iii) social support provided by the local and regional religious authorities. Nevertheless, as with all experimental projects, the relocation of Vunidogola has encountered obstacles: the project was delayed, the projected budget for the relocation tripled and the biophysical characteristics of the new site necessitated further work. At the time of the request for relocation, the project was the only one of its kind; it was not the result of an adaptation policy, but, quite on the contrary, initiated one. What was a first time innovative experiment turned out to be a basis for framing permanent voluntary internal displacements in the country. Indeed, the multilateral and inclusive experience of Vunidogola served as a catalyst for a national adaptation policy. As a result, Fiji has become one of the voices for the cause of low-lying islands for relocation and an advocate for international mechanisms to facilitate relocation processes.
SEM 2015 140
REFERENCES Books –– Anderson , T., & Lee, G. (2010). Understanding Melanesian customary land. In AID/WATCH, In defense of Melanasian customary land (pp. 2-4). Sydney. –– Campbell. (2010). Climate Change and Population Movement in Pacific Island Countries. In Burson, Climate Change and Migration: South Pacific Perspectives (pp. 29-50). –– Edwards, J. (2014). Climate justice and the Pacific Conference of Churches: moving the relocation agenda in the Pacific. In L. Andrianos, J.-W. Sneep, & G. Kerber, Sustainable Alternatives for Poverty Reduction and Eco-Justice ..., Volume 1 (pp. 208-224).
org/global/about-the-ilo/newsroom/ features/WCMS_221135/lang--en/ index.htm –– ILO. (2014). Cash for Work: Pilot Programme 2013-2014 Fiji and Solomon Islands Experience. –– UNOCHA. (2014, september 11). Fiji: Building resilience in the face of climate change. Retrieved from http://www. unocha.org/top-stories/all-stories/ fiji-building-resilience-face-climatechange Press Articles –– Biumaiono, S. (2013, december 15). Mysterious gift of bone healing. –– Biumaiono, S. (2013, december 15). Rebuilding Vunidogoloa. Fiji Times.
–– Edwards, J. (2014). Phosphate mining and the relocation of the Banabans to northern Fiji in 1945: lessons for climate change forced displacement. Le Journal de la Société des Océanistes, 121-136.
–– Datt, H. (2014, january 17). Climate Change forces villagers to relocate. Fiji One.
–– Hau‘Ofa, E. (1994). Our Sea of Islands. The Contemporary Pacific.
–– Kumar, R. (2012, june 27). Rising seas prompt move. Fiji Times.
–– Mills, I. (2014). Fiji 408 Success Secrets 408 Most Asked Questions.
–– Meakins, B. (2012, september 17). An Inside Look at the One of the First Villages Forced to Relocate Due to Climate Change. Alternet.
Reports –– Edwards, J. (2012, april-may). Bula Bulletin: Relocation of Vunidogoloa Village. Retrieved from Methodist Church: http://www.methodist.org. uk/downloads/wcr-julia-edwardsfiji-newsletter-aprilmay2012.pdf –– Edwards, J. (2013, january). Climateinduced relocation: a first for Fiji. Retrieved from Methodist Church: http://www.methodist.org.uk/ media/757401/wcr-pcc-relocationpolicy-fiji-jan13.pdf –– Edwards, J. (2014, november). Relocation revisited: Vunidogoloa village, Vanua Levu, Fiji. Retrieved from Methodist Church: http://www.methodist.org.uk/ media/1395086/relocation-revisited_vunidogoloa-village-fiji-nov14-je.pdf –– ILO. (2013, september 13). Fiji: A village forced to move by rising seas. Retrieved from ILO: http://www.ilo.
–– Fiji Times - PACNEWS. (2012, october 24). Evidence of climate change in Fiji: Chief.
–– Moceiwa, S. (2013, september 10). Construction of new homes to resume. Fiji Times. –– Naivua, S. (2015, february 9). More villages to relocate due to rising sea levels. FBC. –– Pareti, S. (2013, May). Climate Refugees? Islands Business. –– PCC. (2013, August 13). International community accused of selfishness, $34million needed for climate change in Fiji. Islands Business.
–– Silaitoga, S. (2012, august 29). Sea level woes. Fiji Times. –– Silaitoga, S. (2012, march 5). Villagers put down roots. Fiji Times. –– Silaitoga, S. (2012, march 21). Works delay village relocation. Fiji Times. Retrieved from Fiji Times. –– Silaitoga, S. (2013, november 7). Villagers to ready eight new ponds. Fiji Times. –– Silaitoga, S. (2014, January 2014). Villagers to move into new homes. Fiji Times. –– Sorowale, S. (2011). Retrieved from Vunidogoloa: climate change induced relocation: http://simisorowale. blogspot.fr/ –– Sorowale, S. (2012, may 1). Climate Change and Relocation: Vunidogoloa and Nukudamu . Retrieved from Climate change and relocation in Fiji: http:// climatechangeandrelocationinfiji. blogspot.fr/ –– Sorowale, S. (2012, may 8). Vunidogoloa: The Clear and Present Danger. Retrieved from Climate Change and relocation: http:// climatechangeandrelocationinfiji. blogspot.fr/ –– Sovaraki. (2014, august 20). Vunidogoloa relocation mooted in the 50s. Fiji Sun. –– SPEREP. (2014, december 5). Upheaval of Fiji communities as climate change impacts are felt . Retrieved from SPEREP: http://www.sprep.org/ climate-change/upheaval-of-fijicommunities-as-climate-changeimpacts-are-felt –– Susu, A. (2015, february 12). 800 Communities Under Threat. Fiji Sun.
–– PCC. (2013, april 3). Seawalls are not an option to stop rising sea levels. Islands Business.
–– Taleitaki, S. (2014, january 2014). Vunidogoloa relocation praised. Fiji Sun.
–– Rawalai, L. (2013, may 21). Village relocation begins. Fiji Times.
–– Tan, J. (2015, march 17). Photographing Fiji’s Sinking Island Communities. Retrieved from Vice: http://www. vice.com/read/photographing-fijissinking-island-communities
–– Rawalai, L. (2014, january 18). Woman lights up homes. Fiji Times. Retrieved from Fiji Times.
SEM 2015 141
ASIA-PACIFIC
CLOTHILDE TRONQUET FROM VUNIDOGOLOA TO KENANI: AN INSIGHT INTO SUCCESSFUL RELOCATION
–– Tuimoala, J. (2013, March 16). More money for Vunidogoloa relocation. Fiji Sun. –– Vunidogoloa cashes in. (2013, december 13). Fiji Sun. –– Wilson, C. (2014, May 25). Fiji Leads Pacific Region on Climate Adaptation Efforts. IPS News Agency. –– Government press-releases –– Bainimarama. (2014, january 16). Speech at the launch of the Vunidogoloa village relocation project. Retrieved from Fijian government, Public Service Commission : http://www. psc.gov.fj/index.php/psc-news/ speeches/829-prime-ministercommodore-j-v-bainimarama-speechat-the-launch-of-the-vunidogoloavillage-relocation-project
SEM 2015 142
–– Fiji government. (2013). New homes for Vunidogoloa residents. –– Fiji Government. (2014, march 28). Solar engineer shares skills. Retrieved from Fijian Government: http:// www.fiji.gov.fj/Media-Center/PressReleases/SOLAR-ENGINEER-SHARESSKILLS.aspx –– Fiji Government. (2014, September 1). Vunidogoloa relocation 2nd phase underway. Retrieved from Fiji Government: http://www.fiji.gov. fj/Media-Center/Press-Releases/ VUNIDOGOLOA-RELOCATION-2NDPHASE-UNDERWAY.aspx –– New homes to open soon with income generating provisions for Vunidogoloa residents. (2013, december 12). Retrieved from Fiji Government Blog:
http://fijiblog.gov.fj/blog/2013/12/12/ new-homes-to-open-soon-withincome-generating-provisions-for. html –– PM Bainimarama opens Vunidogoloa Village Relocation Project - 2014. (2014, January 16). Retrieved from Fijian Government: http://www.fiji.gov.fj/ Photos---Video/Photo-Gallery/PMBainimarama-opens-VunidogoloaVillage-Relocatio.aspx?imagepath=/ Photos---Video/Photo-Gallery/PMBainimarama-opens-VunidogoloaVillage-Relocatio/
The Americas
PIA VAN ACKERN
When Mining Moves People: DevelopmentInduced Displacement and Resettlement in La Guajira, Colombia
C
olombia is after Syria the country with the highest number of internally displaced people in the world – amounting to over six million according to records of the United Nations High Commissioner for Refugees (UNHCR) and the Internal Displacement Monitoring Center (IDMC) (UNHCR 2015; IDMC 2015). Around 300,000 people are newly displaced each year, most of them because of the impacts of the internal armed conflict (IDMC 2014). Yet, it is not only conflict that displaces people in Colombia; development projects such as large-scale resource extracting projects are also forcing people to leave their homes. It is ironic that the initiation of massive development projects that endeavor to increase national wealth have the potential to create new poverty in the case of those displaced (Price 2009: 267). Oliver-Smith describes this paradox as such: “[a]imed at generating economic growth and thereby improving general welfare, these projects have all too often left local people displaced, disempowered, and destitute. Resettlement has been so poorly planned, financed, implemented, and administered that these projects generally end up being ‘development disasters’” (2009: 3).
In Colombia, mining is an important segment of the national development strategy designed to stimulate the Colombian economy, increase its competitiveness on the international market and create “more social, regional and intergenerational equality” (Teherán Sanchez 2014: 44). In the 1970s, the open-cast mining of coal was given a special role within the development strategy as it was prioritised by national policies, and has grown considerably over the last 40 years (Teherán Sanchez 2014: 44). The biggest open-cast coal mines are located in the César and La Guajira departments in the northeast of Colombia and have led to the displacement and resettlement of the local population (Teherán Sanchez 2014: 45, 52). This paper seeks to provide a review of the recent displacement and resettlement processes in the context of the Cerrejón mine in the department of La Guajira. Given that multinational corporations are the main stakeholders of this mining project and their yield supplies the world market, these displacements are not only of national but also of international concern. Since the beginning of the Cerrejón mining operation in 1976, different displacement processes have taken place. People have had to move because of infrastructure construction or the expansion of extraction activities. The violent displacement of the community of Tabaco, which attracted international attention in 2001, marked a turning point as Cerrejón subsequently introduced a resettlement policy. Currently, the planned resettlements of five communities are
SEM 2015 145
THE AMERICAS
PIA VAN ACKERN WHEN MINING MOVES PEOPLE: DEVELOPMENT-INDUCED DISPLACEMENT AND RESETTLEMENT IN LA GUAJIRA, COLOMBIA
under way – the four rural and partly afro-Colombian communities Roches, Patilla, Chancleta and Las Casitas and the indigenous Tamaquito II community. The relocation of families to the new sites is at an advanced stage, yet some individual families remain at the original resettlement site – except for Tamaquito II where all families have moved. In 2014, international attention was drawn to the mine as the residents of Las Casitas and the Cerrejón company could not reach an agreement on resettlement and the international media and non-governmental organisations (NGOs) underlined the possible expropriation of the community (Willis 2014; Suhner 2014; Indepaz 2014). First of all, this paper will provide background on the department of La Guajira and the history and structure of the Cerrejón mine. Secondly, mitigation measures for mining-induced displacement and resettlement at the international, national and Cerrejón company level will be presented and assessed. Migration patterns in the influence zone of the Cerrejón mine will then be outlined, with a separate section for each of the five recent resettlement processes. The conclusion will provide a comparative perspective of the five cases and an outlook, giving rise to recommendations concerning the resettlement processes. The paper is based on primary and secondary sources. The primary sources comprise two interviews conducted with experts of the Colombian NGO Indepaz, which is accompanying the resettlements of Roche, Tamaquito II and Las Casitas, and the Swiss NGO Arbeitsgruppe Schweiz Kolumbien (Ask!). Available secondary material concerning the resettlement processes was partly lacking and partly contradictory. The paper cannot therefore guarantee that all details of the resettlement processes are included but it aims to represent the views of different stakeholders. Thus, the material was derived from various sources: academic articles, the Cerrejón website which includes a section on the resettlement processes (updated until mid-2012) and further information concerning the company, the Cerrejón’s progress reports on its social commitment from April 2009 to April 2015 which contain detailed but fragmentary information, a fieldwork study conducted by Hora on the resettlements of Roche and Tamaquitos II (2014), NGOs reports by Indepaz and Ask!, newspaper articles and other material.
1. BACKGROUND: THE DEPARTMENT OF LA GUAJIRA AND THE CERREJÓN COAL MINE In order to grasp the full extent of the resettlement processes linked to the extractive activities of the Cerrejón coal mine, a brief understanding of the geographical location and its socio-economic and political situation as well as of the history and structure of the Cerrejón mining operation is necessary.
1.1 La Guajira: Colombia’s Wild West
The department of La Guajira is located in the northeastern part of Colombia, bordering with Venezuela to the east. The department is a peninsula, surrounded by the Caribbean to the north and west. On the southwestern land border with the Colombian departments César and Magdalena is Colombia’s highest mountain range – the Sierra Nevada de Santa Marta. Due to its location, La Guajira is geographically relatively separated from the rest of the country. Figure 1 gives an overview of the department. The department has a semiarid to arid climate with two natural ports (Teherán Sánchez 2014, 47). According to the 2005 general census, 44.9 percent of the La Guajira population identifies itself as indigenous while another 14.8 percent considers itself of afro-Colombian origin (DANE 2010). La Guajira is one of the poorest departments in Colombia as about 60 percent of the population lives in poverty and 28 percent in extreme poverty (DANE 2012).
SEM 2015 146
Figure 1: Mining operation of Cerrejón in the south of La Guajira
Despite the economic hardship, indigenous communities relying on subsistence agriculture can maintain a decent standard of living (Hora 2014: 42). In 2014, parts of the region were facing such a severe drought that water had to be delivered by the State and humanitarian organisations on trucks with water tanks (Semana 2014c). However, these economic and water-related difficulties are not the only problems facing the region. The leading Colombian weekly Semana states: “There are villages in La Guajira which smell like petrol. Because in some of them, especially in the north, there is more illegal petrol than water. … The combination of these two problems is a ticking time bomb: this department forgotten by the rest of the country is on the verge of collapse” (2014a, translated by the author). Several persistent public governance problems characterise La Guajira. The regions’ authorities lost control over large parts of the border. The British newspaper The Guardian reports: “Over the years, the state has earned a reputation as Colombia’s Wild West”, neglected by State authorities (Balch 2013). Almost 200 illegal crossing points along the border with Venezuela allow flourishing criminal activities such as petrol smuggling and drug trafficking (Semana 2014b). This is firstly because of the small number of border police forces, some of whom are corrupt, secondly because the territory is under the control of armed groups, so-called Bandas Criminales, and
SEM 2015 147
THE AMERICAS
PIA VAN ACKERN WHEN MINING MOVES PEOPLE: DEVELOPMENT-INDUCED DISPLACEMENT AND RESETTLEMENT IN LA GUAJIRA, COLOMBIA
thirdly because of the presence of two fronts of the guerilla group FARC (Semana 2014b). The situation in La Guajira is highly complex as a result of its isolated geographical location and a difficult socio-economic and political context, and is characterised by a number of multifaceted problems. The department does not provide an easy environment for the establishment of a large industrial mining business which demands huge spatial capacity and the displacement of the local community.
1.2 The Cerrejón Coal Mine: A Multinational Enterprise
The mining sector in Colombia has grown significantly over the past few decades. The most important resources are coal, oil, natural gas, emeralds, gold and nickel (Hudson 2010: 158). 25.7 percent of Colombian exports were generated by the mining sector in 1995, increasing to 56.9 percent in 2012 (DANE 2013). The output of coal grew substantially from 4 million tons in 1981 to 65.5 million tons in 2006, comprising 1.4 percent of the world’s coal production (Hudson 2010: 158). Coal has been Colombia’s second largest export product since 2001 (Hudson 2010: 158). The largest and most productive coal mines are located in the northern departments of Colombia, in La Guajira and César. The Cerrejón open-cast coal mine is situated in the southern part of La Guajira and is considered as one of the largest of its kind in the world (Hudson 2010: 158; see figure 1). The Cerrejón mining project started in 1976. After an international competitive bid for 32,000 hectares suitable for coal mining, Intercore (a subsidiary of U.S.-based company Exxon) and the Colombian State-owned Carbocol (Carbones de Colombia S.A.) were contracted to develop the mining project. The creation of the mining infrastructure was carried out between 1980 and 1986, including the construction of the Bolíva port, a 4km-long channel, and a 150km train track connecting the mine, the port and the residential unit Mushaisa, constructed to accommodate the mining personnel (Cerrejón 2015 d). This settlement has good infrastructure consisting of a school, recreational facilities (e.g. a swimming pool, tennis courts), restaurants and hotels (Suhner 2015, see figure 1). In the context of this construction work more than 1,000 indigenous Wayuu were displaced (Leech 2009: 203). At the same time, the villages and settlements of the area experienced an increase in population as people moved there in search of the new jobs the mine would offer (González Perafán 2015). As it was one of the first opencast coal mines in Colombia, people were unaware of the potential negative impacts that a mine of such magnitude could bring about, such as environmental pollution or displacement. Mining activities began in 1985. Coal production grew progressively, from 4 million tons in 1985 to 32.8 million tons in 2012, amounting to a total of 540 million tons since extraction commenced. Most of the Cerrejón coal (58 percent) is exported to Europe, 12 percent goes to Central and Latin America, 9 percent to North America and the remaining 21 percent to Asia and other countries in the world (Cerrejón 2012c). In 1999, the contract was renewed, granting an extension of the concession contract until 2034 (Cerrejón 2015d). As part of the economic reforms required by the International Monetary Fund, the Colombian government sold its 50 percent share of Carbocol to a multinational mining consortium of Anglo American, BHP Billiton and Glencore in 2000. Two years later, the consortium bought Exxon’s remaining 50 percent share (Leech 2009: 202). Glencore sold its shares to Xstrata in 2006, but six years later Xstrata merged with Glencore (Brinded 2013). In 2013, Glencore was the biggest mining company worldwide with $200 billion in revenue from its activities in metals, minerals, coal and oil extraction; BHP Billiton was the second largest player with $67.83 billion in revenue from coal, metal and minerals; and Anglo American the fifth biggest with $33.06 billion in revenue in the same sectors (Spence 2014). The three multinational
SEM 2015 148
companies are active worldwide with headquarters in the United Kingdom, Switzerland, Australia and South Africa (Spence 2014). The Cerrejón mine is operated independently through the two subsidies Carbones del Cerrejón Limited and Cerrejón Zona Norte S.A., which have registered addresses in the British West Indies and Colombia. Each of the consortium’s three companies holds a 33 percent share of the mine (Hora 2014: 53; Cerrejón 2015f). Figure 2 provides an overview of Cerrejón’s development and indicates major resettlement events that are addressed in the following chapters.
2. MEASURES FOR MITIGATION: GUIDELINES AND LEGAL FRAMEWORK FOR DEVELOPMENT-INDUCED RESETTLEMENT Before assessing the current resettlement processes related to the Cerrejón mine, it is important to understand the internationally acknowledged standards for development-induced resettlements, the Colombian legal framework for mining and resettlement, and Cerrjón’s resettlement policy.
2.1. International standards: World Bank and IFC policy guidelines
From the 1980s onwards, the World Bank had to deal with public concerns about displacements caused by development projects which it fully or partly financed (Price 2009: 274). Consequently, anthropologists and other social scientists within the World Bank, led by the well-known expert on development-induced displacement and resettlement Michael Cernea, drew on the body of existing case studies documenting displacement disasters to develop guidelines for the Bank’s operational manual (Price 2009: 274). In 1988, Cernea published the book “Involuntary Resettlement in Development Projects. Policy Guidelines in World Bank−Financed Projects” which was henceforth used to address social issues in involuntary resettlement worldwide. Price highlights that these guidelines conceptualised “displaced people as a group temporarily victimised by development – to be treated with special measures that recognised their losses, as well as the importance of their social organization and identity, in the form of involuntary resettlement” (2009: 275). The World Bank’s policies require efforts to avoid and minimise displacement wherever possible. In cases where displacement has to take place despite such efforts, the policies require mitigation measures, deployed through time-bound action plans which address the social and economic losses caused by the displacement using the methods of baseline social census and survey work. The World Bank’s Operational Policy on Involuntary Resettlement (OP) 4.12 (2001, updated 2007, paragraph 2c) underlines that “[d]isplaced persons should be assisted on their efforts to improve their livelihoods and standards of living or at least to restore them, in general terms, to pre-displacement levels or to levels prevailing prior to the beginning of project implementation, whichever is higher”. Therefore, compensation alone is insufficient; restoring standards of living after resettlement can be considered as a minimum objective. Yet, successful resettlement should achieve substantial improvement in the living conditions of those displaced (Cernea 2008: 3). The World Bank guidelines influenced policies of other institutions around the world and within short time, the Organization for Economic Development and
SEM 2015 149
THE AMERICAS
PIA VAN ACKERN WHEN MINING MOVES PEOPLE: DEVELOPMENT-INDUCED DISPLACEMENT AND RESETTLEMENT IN LA GUAJIRA, COLOMBIA
several regional banks developed similar policy principles (Price 2009: 275). The International Finance Corporation (IFC) established a Safeguard Policy on Involuntary Resettlement in 1990, which was replaced by the Performance Standard for Land Acquisition and Involuntary Resettlement within the broader framework of the IFC’s Environmental and Social Performance Standards (IFC 2015a). The IFC’s Performance Standard has several objectives (IFC 2015b): –– “To avoid, and when avoidance is not possible, minimize displacement by exploring alternative project designs. –– To avoid forced eviction. –– To anticipate and avoid, or where avoidance is not possible, minimize adverse social and economic impacts from land acquisition or restrictions on land use by (i) providing compensation for loss of assets at replacement cost and (ii) ensuring that resettlement activities are implemented with appropriate disclosure of information, consultation, and the informed participation of those affected. –– To improve, or restore, the livelihoods and standards of living of displaced persons. To improve living conditions among physically displaced persons through the provision of adequate housing with security of tenure at resettlement sites.” In the case of mining activities, such international standards are of special importance because these activities are rarely national businesses, but often of a multinational nature. Yet, they have three obvious limitations. Firstly, they are not very detailed and cannot be applied to all local realities as there are huge differences between development projects and the environment and communities in which they are deployed. Secondly, it is not easy to assess whether “substantial improvement” in the living conditions of the displaced persons has been achieved and to what extent. Thirdly, the IFC standards have no binding character and there is no international agency that monitors and ensures these processes.
2.2. Colombian legislation
At the national level there are several separate laws and regulations which deal with resettlement in a broader frame and address rights concerning property and land acquisition, compensation, health, territory and ethnic communities, and preconsultation of communities in Colombia (González Perafán 2011: 10). This body of regulation protects the rights of displaced and resettled persons and communities to a certain extent, but there is no comprehensive legislation regulating resettlement in sufficient detail (González Perafán 2011: 7, 10). Different national laws and rulings are essential to the discussion around development-induced resettlement and demonstrate the dilemma between development projects for the common good and the welfare of the individual. Article 1 of the Colombian constitution of 1999 states that “Colombia is a social state under the rule of law, […] based on the respect of human dignity […], and the prevalence of the general interest”. Article 2 furthermore underlines that “[t]he essential goals of the State are to serve the community, [and to] promote general prosperity”. These first two constitutional articles establish the importance of the general interest and the promotion of national prosperity as well as the protection of human dignity and the community, hinting at the balancing act between these sometimes contradictory principles. Article 58 of the constitution stipulates that “[p]rivate property and the other rights acquired in accordance with civil laws are guaranteed and may neither be disregarded nor infringed by subsequent laws”. Yet, the article also specifies that “[w]hen in the application of a law enacted for reasons of public utility or social interest a conflict between the rights of individuals and the interests recognized by the law arises, the private interest shall yield to the public or social interest” and gives priority to the common good. It the case of expropriation because of this reason, the same article underlines that “compensation will be determined by taking into account the interests of the community and of the individual concerned”.
SEM 2015 150
Regarding the protection of vulnerable communities, special legislative provisions have been determined. The Constitution of 1991 recognised the plurality of the Colombian nation (article 1) for the first time and stipulates the adoption of affirmative measures for discriminated or marginalised groups (article 13). Indigenous people and afro-Colombians enjoy a higher degree of protection (González Perafán 2011: 27) The Colombian Mining Code (Law 685 of 2001, modified by Law 1382 of 2010) complements the possibility of land expropriation for mining activities. Article 5 (Law 685 of 2001) establishes that all minerals in the soil and subsoil are exclusive properties of the State, regardless of the ownership of the territory in which the minerals are located. In accordance with Article 58 of the Constitution, the mining industry is declared as being of public utility and of social interest by Article 13 (Law 685 of 2001). Article 22 (Law 1382 of 2010) stipulates the procedure of land easement and expropriation, also in the case of objection to the expropriation. However, Article 168 (Law 685 of 2001) claims that land easement for extraction activities is legal or obligatory, meaning that expropriation can take place even against the will of the concerned owner. Article 27 (Law 1382 of 2010) bought about an important modification to the 2001 version of the Mining Code, which determines the social responsibility of mining companies (corporate social responsibility policies). Companies are called upon to act voluntarily to improve the quality of life of the residents of the mining region as well as to prevent and compensate environmental damage. Additionally, Law 56 of 1981 and its decrees provide guidelines for dealing with expropriations due to infrastructure projects and therefore provide a legal basis for involuntary resettlement at the legislative level. However, the effectiveness of the law is fairly limited as it does not establish proceedings for the design and execution of resettlement programmes, nor does it define eligibility criteria for resettlement and the commitments and responsibilities of the parties to the resettlement process (González 2011: 9).
2.3. Cerrejón’s resettlement guidelines
Partly under State ownership up until 2000, the company had no resettlement scheme in place but instead a compulsory land acquisition scheme, i.e. the company bought the necessary land and the previous owner had to move – mostly to urban areas in the surroundings of the mine (Hora 2014: 68). In 1983, more than 1,100 indigenous Wayuu were displaced in such a fashion (Leech 2010: 203). During that time affected person stated that neither government authorities nor non-governmental organisations assisted the people who were forced to leave. They mostly moved to the bigger towns in the area and many of them fell into poverty (Hora 2014: 68). In August 2001, more than 25 families of the rural and mostly afro-Colombian community of Tabaco were expropriated and forcibly evicted from their homes by State security forces and the private guards of the Cerrejón mine without prior warning (Leech 2010: 203). This incident attracted broad public attention and marked a turning point in Cerrejón’s human rights and resettlement policy, leading to the introduction of a human rights office in 2006. One year later, Cerrejón and its stakeholders requested an independent review of its social responsibility practices and of its relation with the communities in the mining area (Harker/Kalmonovitz/Killick/ Serrano 2008: 2). This third party review was conducted by a panel of four experts, supported by a team from an international consulting firm, which had no links to the Cerrejón mine (Harker et al. 2008: 14). The result of this review was the establishment of a visible corporate social responsibility policy (CSR), in accordance with Colombia’s legislation. Cerrejón included the introduction of human rights training for soldiers of the Colombian army and private security forces employed to protect the mine and its infrastructure, the creation of complaints office, and a foundation system (Hora 2014: 61-65).
SEM 2015 151
THE AMERICAS
PIA VAN ACKERN WHEN MINING MOVES PEOPLE: DEVELOPMENT-INDUCED DISPLACEMENT AND RESETTLEMENT IN LA GUAJIRA, COLOMBIA
The third party review recommended that resettlements should be based on international standards and implemented not only when physical resettlement is necessary but also if a community regards itself as strongly impacted by the proximity of mining activities. Cerrejón was thus advised to establish a broader conception of “affected communities” (Harker et al. 2008: 5-6). Cerrejón subsequently introduced guidelines for resettlement which correspond to the World Bank standards and the International Financial Cooperation (IFC) guidelines for resettlement, including the stipulation that resettlement may be appropriate when a community is affected by the indirect impacts of the mine that result in a decrease in living standards. Furthermore, the company promised to develop indicators measuring the living standards of each community and to identify key actions to improve them (Cerrejón 2008). Since 2008, Cerrejón has published a progress report on its social commitments up to twice per year. Additionally, Cerrejón implemented a four-phase resettlement scheme (Cerrejón 2015h). These phases are described quite roughly and not much detail is given. The first phase, entitled “community engagement and strengthening of social capital”, includes the disclosure of the social and environmental impact studies which substantiate resettlement, as well as the organisation of preliminary actions to initiate a participative resettlement process. The second phase, “designing a participative resettlement action plan with the community, following IFC guidelines”, implies socio-economic baseline studies (population census and an asset inventory), the characterisation of the population living in the community to be resettled, a formal valuation of all assets, an outline of the compensation plan, an assessment of the assets and people affected, the selection of a new site, the identification of income generating projects which are created in conjunction with the community, and finally the formulation of the resettlement action plan. Cerrejón does not publish the criteria that establish whether a person or family is eligible for resettlement. The third phase consists of “executing the resettlement action plan”, entailing the design and construction of the resettlement site, an agreement on relocation details (e.g. individual compensation scheme and productive projects for resettlement entitled families) and the actual preparation for relocation. The respective resettlement actions plans for the five communities are not publicly available. The fourth and final phase of “relocation and stabilisation in the new location” contains the implementation of the productive and income generating projects, ongoing involvement by Cerrejón in social matters and “psycho-socioeconomic support” to assist the families while they familiarise themselves with their new location. According to Cerrejón’s scheme, all phases should be accompanied by a communication programme, social programmes and an evaluation and monitoring programme. It is remarkable that to date, no State authority has issued a resolution or other policy directive to regulate or at least to guide resettlements in the area surrounding the Cerrejón mine. González Perafán states that the resettlement processes depend heavily on the voluntary commitment of Cerrejón (2015).
4. POST-TABACO RESETTLEMENT PROCESSES: THE CASES OF ROCHE, PATILLA, CHANCLETA, LAS CASITAS AND TAMAQUITOS II The following sections will examine the resettlement projects that were initiated after the forced eviction of the Tabaco community and the introduction of the new resettlement guidelines. Each of the resettlements will be assessed against the background of the four phases established by Cerrejón and the IFC standards. Currently, Cerrejón is carrying out five resettlement processes (see figure 3). The communities of Patilla, Chancleta and Roche are located in proximity to the Comunidad pit and potential sites for an extension of the pit. The communities, including the
SEM 2015 152
Figure 3. The Cerrejón open-cast mine and its surroundings, including settlements and resettlements
Source: Hora 2014: 58
SEM 2015 153
THE AMERICAS
PIA VAN ACKERN WHEN MINING MOVES PEOPLE: DEVELOPMENT-INDUCED DISPLACEMENT AND RESETTLEMENT IN LA GUAJIRA, COLOMBIA
community of Las Casitas, are rural communities, partly of afro-Colombian descent. The indigenous Tamaquito II community is located further east close to the NAM dump and the Las Casitas community’s original location is south of the Oregenal pit, also in the area of potential expansion of the pit (Willis 2014). Tamaquito II does not lie within the area of potential expansion of the mine but is affected negatively by other impacts of the mine such as air and noise pollution, limited freedom of movement, decreased quality of the water and health problems (Gutierrez Torres 2013; González Peráfan/Valenzuela 2013). The new sites of Patilla, Chancleta, Roche and Las Casitas are located in close proximity to one another next to the highway Ruta Nacional 88, only 1.5 km away from the city of Barrancas, which has around 200,000 inhabitants (Hora 2014: 76; see figure 4). The proximity to the highway allows for easy access to Barrancas and other cities in La Guajira, which contrasts greatly with the remote locations of the original communities. The new resettlement areas of the four communities are identically designed with small terraced houses built from cement or bricks with a small inner courtyard. The houses in the original settlements were detached and had around 200 meters between them, leaving space for agricultural activities (Suhner 2015). The indigenous community of Tamaquito II is located elsewhere as well as being designed in a specific way, closely coordinated with the community. It is 3.5 km away from the other resettlement sites and only accessible via a dirt road (Hora 2014: 76). The baselines for resettlements defined by Cerrejón are shown in table 1. Roche has 25 families defined by Cerrejón as eligible for relocation and their new site comprises a total area of 33 hectares. In Patilla 73 families were eligible for relocation and the new site has a total area of 69 hectares. 57 families were eligible for resettlement in Chancleta and their settlement comprises 52 hectares. There are currently 31 families defined as eligible for resettlement by Cerrejón in Las Casitas, but the size of the new site is still unknown. In Tamaquito II 31 families were eligible for resettlement to a 300-hectare lot. Table 1. Characteristics of the communities participating in the recent resettlements Roche Family units eligible for relocation Ethnic or population group
Patilla 25
73
Chancleta 57
Las Casitas 31
Rural communities, partly afro-descendent
Tamaquito II 31 Wayuu indigenous
Relocation beginning
2011
2012
2012
2014
2013
Community area (ha) in resettlement
25
48
43
TBC
300
Area for agricultural projects (ha) in resettlement
5
6
8
TBC
93
Area for livestock projects (ha) in resettlement
3
15
1
TBC
wood pasture
Source: Compiled from Hora 2014: 71; Cerrejón 2012: 55
Each of the processes followed a different sequence and no coherent strategy is discernable. The resettlement processes are currently at different stages; the pace of operations varied greatly and none of the resettlements (i.e. the relocation of the eligible families to the new site) is fully completed – except for the Tamaquito II resettlement. The following section of the paper presents and evaluates the five
SEM 2015 154
Figure 4. Locations of the five resettlements
Source: Hora 2014: 77
SEM 2015 155
THE AMERICAS
PIA VAN ACKERN WHEN MINING MOVES PEOPLE: DEVELOPMENT-INDUCED DISPLACEMENT AND RESETTLEMENT IN LA GUAJIRA, COLOMBIA
resettlement processes, considering the situation of the village prior to resettlement, the resettlement negotiations and process, and the situation at the new site for the relocated families.1
3.1 The resettlement of the Roche community
The community of Roche is of afro-Colombian origin (González Perafán 2015). Prior to the mining activities in the region, the original settlement of Roche had around 400 inhabitants, a primary school and a health care unit (Ramirez 2010; Hora 2014: 78). The inhabitants were predominantly subsistence farmers. From 1997 onwards, Cerrejón started to buy land in and around the Roche community (Hora 2014: 78). Prices for the purchased land were negotiated on an individual basis and not publicly available (Hora 2014: 78-79). Many inhabitants of Roche sold their properties and moved to nearby communities (see figure 5). As a result of this rural to urban movement, they often faced indebtedness (as they could not afford new housing with the money they received for their former dwelling), unemployment, and marginalisation in their new location (Hora 2014: 79). It only became apparent in 2006 that Cerrejón would implement a group resettlement, initially designating 15 families for relocation and compensation. 374 families of the original Roche community were not included in this resettlement scheme and therefore founded the association Asoroche to have a stronger voice in claiming their right to be included in Cerrejón’s resettlement and social schemes (Ramirez 2010; González Perafán/Valenzuela 2013). Figure 5. Process of the depopulation of Roche Viejo
Source : Hora 2014 : 81.
1. Due to a lack of material on the resettlement processes of Patilla and Chancleta, both communities are examined in the same section.
SEM 2015 156
The available online documentation of the resettlement process reports activities up to June 2012 (Cerrejón 2015j). The following events of the process are derived from Cerrejón’s progress reports on its social commitment, material published by NGOs, and the interviews undertaken in the framework of this study. The first phase of “community engagement and strengthening of social capital” stretched from 2003 to 2012 and comprised according to Cerrejón a socioeconomic census (conducted by the Interdisciplinary Center for Regional Studies of the University of the Andes), an inventory of public goods and several trips of the Roche community to cities in Colombia in 2011 and 2012 as community building measures (Cerrejón 2015j). Since 2009, the NGO Indepaz has been assisting and advising the community (González Perafán 2015). For the second phase, “designing a participative resettlement action plan with the community, following IFC guidelines”, Cerrejón states that an agreement on the new settlement site, meeting the needs of agricultural land, was reached in a “participatory and systematic way” in 2007 (Cerrejón 2015j). After several community meetings in 2008, ten additional families were included in the relocation process, so that the official number of 25 families eligible for relocation was established. In the same year, a formalised agreement between the community, Cerrejón, and the representatives of the Town Hall and the Barrancas Ombudsman was concluded to rubber stamp the resettlement process (Cerrejón 2015j). During the third phase of “executing the resettlement action plan”, the Barrancas municipality authorised the construction of the new location in 2009, with construction subsequently beginning (Cerrejón 2015j). Ten final relocation agreements were signed in January 2011 of which eight had already been resettled to the new Roche site before April 2011 (Cerrejón 2011a). Figure 6. A street in the new settlement site of Roche
Source: Ask! 2014: 6
Cerrejón states that for the fourth phase of “relocation and stabilization in the new location” 16 families moved to the new site up to January 2011 (Cerrejón 2011b) and that in August 2011 the first agricultural project showed results. Another family moved to the new site in October 2012, while no agreement could be reached with the remaining eight families. Cerrejón set an initial deadline in February for the end of March 2012 which expired without results. Cerrejón states that it wanted to petition the Ministry of Mines to declare the property plots of public use and social interest to pave the way for expropriation but highlights its willingness to negotiate further (Cerrejón 2012a). In October 2012, the Ministry of Mines and Energy issued the declaration of public use and social interest of the Roche plots (Cerrejón 2012b).
SEM 2015 157
THE AMERICAS
PIA VAN ACKERN WHEN MINING MOVES PEOPLE: DEVELOPMENT-INDUCED DISPLACEMENT AND RESETTLEMENT IN LA GUAJIRA, COLOMBIA
Parallel activities carried out by Cerrejón to implement income generation projects in 2011 and 2012 included the provision of educational software, a training session for mothers on educational matters, the support of the creation of a motorbike garage, training in early childhood care for some women of the community, and the planned development of handicraft projects. Up to May 2013, Cerrejón reports the implementation of productive projects for 17 families at the new site. New negotiations with the remaining families started without results; yet no expropriation was carried out (Cerrejón 2013). Up to May 2014, Cerrejón contends that agreements with the remaining eight families were reached and that six of them moved to the new site (Cerrejón 2014a). In April 2015, the two remaining families were still rejecting resettlement, arguing that they raise livestock and therefore cannot accept alternatives. Cerrejón is not seeking eviction (Cerrejón 2015a). Although not all the families eligible for resettlement have moved to the new site, 23 families now permanently live there. The houses at the new settlement are all of similar style (see figure 6), built out of bricks and cement, comprising two bedrooms, one bathroom and a living room combined with a kitchen. All houses are equipped with electricity, air-conditioning and a natural gas oven (Hora 2014: 83). There are several community buildings: an assembly hall, a Catholic church, a primary school and a small health centre (Hora 2014: 84; see figure 7). The community has an area of 25 hectares for agricultural activities. Only 2.5 hectares are used for agricultural production, farmed by seven families (Hora 2014: 86). Some inhabitants of the new settlement complain that their properties are not big enough for horticulture and the raising of small livestock (Hora 2014: 89). The tap water has a salty taste and is not of drinking quality; therefore water has to be delivered by trucks.2 Figure 7. Resettlement of Roche including area designated for agricultural production
Hora 2014: 83; González Perafán/Valenzuela 2013.
2. Due to a lack of material on the resettlement processes of Patilla and Chancleta, both communities are examined in the same section.
SEM 2015 158
The proximity to the highway and the city of Barrancas has both advantages and disadvantages for the community. On the one hand, public services such as a hospital and a high school as well as other everyday necessities are reachable within a few minutes by taxi. On the other hand, there have been incidents of burglary, presumably originating from the city, which have caused anxiety among the residents of the new settlements (Hora 2014: 85).In addition to the lack of space for horticulture and small livestock and the security and water issues, the residents of the new community are critical of the fact that the productive projects are not satisfying, that early child care is lacking, and that school is too small (González Perafán/Valenzuela 2013). The NGO Ask! adds that the lack of functioning productive and income generating projects distresses the residents of the new site all the more given that the fouryear period of post-resettlement subsidies from Cerrejón will run out in 2015 (Suhner 2015). However, the community is satisfied with the higher education programme.3 (González Perafán/Valenzuela 2013).
3.2 The resettlement processes of La Patilla and Chancleta
There is no exact information available concerning the number of families living in the Patilla and Chancleta communities before the mine arrived or when the mining activities started. In both communities, people were notified in 2003 that Cerrejón had intentions to resettle their villages because of a potential expansion of the pit (Harker et al. 2008: 24). None of the communities wanted to be assisted by the NGO Indepaz, they preferred instead to negotiate on their own or through a representative (González Perafán 2015). Also in 2003, the University of the Andes’ interdisciplinary research centre produced a socio-economic report on the Patilla and Chancleta communities, including a population census (Cerrejón 2015g). In 2006, as part of the first phase of resettlement, round table dialogues were established (Cerrejón 2015g). For the second phase two years later, a new resettlement site was chosen and the assessment defining the families to be resettled was undertaken (Cerrejón 2015g). In 2011, the construction of the houses and infrastructure for both new settlements began, starting the third phase of “execution of the resettlement” (Cerrejón 2011a). Up to October 2011, 40 relocation agreements out of 46 had been signed for the Patilla community. In April 2012, the housing construction was completed in Patilla and the 45 families that had agreed to resettle started to relocate (Cerrejón 2012a). In May 2014, 33 livelihood projects were implemented at the new site and seven families were showing good progress in developing these projects, while six families demonstrated minimal progress (Cerrejón 2014a), showing some involvement in the fourth phase of stabilisation. In April 2015, Cerrejón stated that it had additionally reached agreements with 28 out of 35 families which were originally not entitled to resettlement, and that negotiations were ongoing with the remaining 13 families. At the new site, 38 projects have been implemented of which 25 are active. Six families still remain at the original site and negotiations are continuing (Cerrejón 2015a). Up to October 2011, 40 out of 57 Chancleta families had agreed on resettlement (Cerrejón 2011b) the first 28 of which had moved to the new site by October 2012 (Cerrejón 2012b). Long negotiation processes followed, resulting in the inclusion of some families that had not originally been defined as eligible. In the first quarter of 2015, 47 out of the 57 originally eligible families had agreed on relocation and moved to the new site, six out of nine originally ineligible families had been moved to the new site and five families remained at the old site, still in the process of negotiating with Cerrejón (Cerrejón 2015a).
3. Households in the urban centers in the region obtain their drinking water the same way (Hora 2014: 83).
SEM 2015 159
THE AMERICAS
PIA VAN ACKERN WHEN MINING MOVES PEOPLE: DEVELOPMENT-INDUCED DISPLACEMENT AND RESETTLEMENT IN LA GUAJIRA, COLOMBIA
The NGO Ask! states that the refusal of some families in Patilla and Chancleta to accept relocation is due to the fact that the new settlement is not rural enough (Suhner 2015). Indepaz explains that an additional reason is the changing nature of the family structure (e.g. people marry or have children) during the prolonged resettlement process (González Perafán 2015). This protracted resettlement process, internal community conflicts and non-transparent individual negotiations have harmed the social fabric of the two communities (González Perafán 2015). Information on the living situation at the new sites of Patilla and Chancleta is not available, yet their structure is similar to Roche’s and therefore comparable conditions can be expected.
3.3 The Resettlement of Las Casitas: Negotiations in process
The original Las Casitas site was founded in 1905 and was characterised by the agricultural and livestock activities of its residents (Cerrejón 2015e). In 2008, Cerrejón documented the decision to resettle the community because of the expected worsening of the air quality due to dust particles (Cerrejón 2015e). Yet, in 2014, it transpired that the residents of Casitas had to be moved because of the planned expansion of the pit, attracting the attention of international media and NGOs (Willis 2014; Suhner 2014). The first phase of “community engagement and strengthening of social capital” included the formal process initiated in June 2009, followed by a census of the population that identified all residents at that time and several community activities and excursions in 2011 and 2012 (Cerrejón 2015e). The NGO Indepaz carried out an additional census in the same year with different results (González Peráfan/Valenzuela 2013). In the second phase of “participative design of the resettlement”, a consultative committee for the relocation of Las Casitas was formed in January 2010 and some months later the property for the new settlement was selected (Cerrejón 2015e). The company states that “Cerrejón and the community agreed that the criteria for determining the right to compensation for resettlement were: (1) being a permanent resident in Las Casitas from before June 16 of 2009, (2) owning a house or property, and (3) being an independent household”. Due to the request of the community of Las Casitas nine families were additionally included even though they did not meet the initial criteria (Cerrejón 2014c). The families eligible for relocation at this stage numbered 31 (Cerrejón 2015e). In July 2012, the community voted on the design of the new village. Concerning the third phase of “execution of resettlement”, Cerrejón highlights in its online documentation of the resettlement process that community members entitled for resettlement participated in training and education programs and that income generating projects were in planning in 2011 and 2012 (Cerrejón 2015e). In March 2012, all Cerrejón activities concerning the resettlement of Las Casitas were suspended, as some persons related to Las Casitas wanted the resettlement process to be reviewed (Cerrejón 2012a). Yet, the construction of houses started in October 2012 and impact identification meetings were carried out with 17 out of the 31 selected families (Cerrejón 2012b). In 2014, Cerrejón states that nine agreements were reached with families at the original site and that the dialogue with 55 remaining families was ongoing (Cerrejón 2014a). The NGO Indepaz started advising the community in 2012 (González 2015). In a joint letter by the Las Casitas community action board in July 2014, the community proclaimed several points of dissatisfaction and disagreement with the current resettlement process (Indepaz 2014). They made complaints about the negotiation process which they consider to be neither fair nor transparent, deteriorating the social fabric of the community (Indepaz 2014). The construction of the new site was concluded prior to April 2015 and 11 of the 15 families that had already reached an agreement have moved to the new site (Cerrejón 2015a). Five of the relocated families have implemented their productive projects. Agreements (although their nature is unclear) have been reached with 11 of 13 families
SEM 2015 160
that were not eligible for relocation and negotiation talks with the remaining families and ten additional rural families are continuing (Cerrejón 2015a). In July 2014, Cerrejón issued a demand for expropriation (Cerrejón 2015a). However, it remains to be seen how the resettlement negotiations will unfold and whether Cerrejón will in fact expropriate the remaining families. The Las Casitas resettlement process seems to be even more unsystematic and conflictual than the previously discussed cases. The negotiation process is proving very lengthy and it seems that the positions of the negotiating parties have become more and more entrenched. The majority of the population still lives at the original site and only 11 families have moved to the new settlement. The conditions at the new site are similar to those in the new settlements of Roche, Patilla and Chancleta (Suhner 2015).
3.4 The resettlement process of the indigenous community Tamaquito II
The original settlement of Tamaquito II was founded in 1965 and was home 31 families prior to the resettlement carried out by Cerrejón in 2013. The residents of the site used up to 5,000 hectares – owned by the Colombian government but available for public use – for their livestock and hunting. Besides these activities, their livelihoods depended on subsistence horticulture, fishing and handicraft production (Hora 2014: 92). The mining operations would not have affected the old site directly, yet the depopulation of the neighbouring communities such as Tabaco and Roche and the air and noise pollution had severe negative impacts on Tamaquito II (Hora 2014: 92). Because of these changed conditions, the community collectively decided to resettle (Gutierrez Torres 2014). The resettlement of Tamaqutio II was handled differently from the other resettlements as it is the only community officially recognised as being of indigenous origin. The Ministry of Interior and Justice granted this status through Resolution 0047 in 2008 (Cerrejón 2015j). The online published documentation of the resettlement process by Cerrejón covers three of the four resettlement phases of Cerrejón’s resettlement scheme. According to the documentation, the phases run in parallel. Regarding the first phase of “community engagement and strengthening of social capital”, Cerrejón highlighted certain points. In April 2007, Cerrejón announced the official start of the resettlement process to the Tamaquito II community. Shortly afterwards, Cerrejón held a meeting with the state agency Incoder (the Colombian institute for rural development), the Municipal Ombudsman and the Tamaquito II community in which the latter explicitly expressed the wish to be relocated to a place which can be recognised as an indigenous reserve (Cerrejón 2015j). Later that year, Incoder proposed a site for the new settlement which was refused by the community because it was too small and did not meet their expectations. The community preferred to search on their own for an adequate resettlement location (Cerrejón 2015j). In the first quarter of 2012, Cerrejón reported several community events (New Year’s celebration, painting workshop, excursion, radio workshop for teenagers) and the training of two women in early childhood education (Cerrejón 2015j). The second phase “participative design of the resettlement action plan” began in April 2008 with the proposal of a suitable site for resettlement by the community. The Tamaquito II community initially demanded a territory of 1,000 hectares, and then lowered its demand to 500 hectares (Ramirez 2010). Eleven workshops were held between the community, Cerrejón and the municipality to negotiate the details. In February 2009 the community accepted a terrain of 300 hectares for the new location (Cerrejón 2015f). Between September and October 2009 a population census was carried out to define the families eligible for resettlement. In 2010, the Social Capital Group prepared the resettlement action plan and updated the baseline for resettlement. The NGO Indepaz carried out an additional baseline study in the same
SEM 2015 161
THE AMERICAS
PIA VAN ACKERN WHEN MINING MOVES PEOPLE: DEVELOPMENT-INDUCED DISPLACEMENT AND RESETTLEMENT IN LA GUAJIRA, COLOMBIA
year (Cerrejón 2015j). The two studies were compared and compromise between the two was reached. The specific design of the new community housing and facilities began in October 2010 and an agreement on the final design was reached in May 2011. Cerrejón bought the property for the new site in July 2010 (Cerrejón 2015j). Figure 8. Overview of the Tamaquito II resettlement
Source: Hora 2014: 96
During the third phase “execution of the resettlement plan”, a constructor for the new site was hired with the consent of the representatives of Tamaquito II, and the construction licence was granted until February 2012. In May 2012, a so-called impact response plan was negotiated with the support of Indepaz and community members of Tamaquito II were involved in the fabrication of construction material (Cerrejón 2015j). In May 2013, Cerrejón states that a general agreement was reached, resolving minor issues on specific compensation (Cerrejón 2013). The construction of the dwellings was finished shortly afterwards. In August 2013, all 31 families of Tamaquito II resettled collectively to the new site and the first three livelihood projects were put in place (Cerrejón 2014a). One year later, Cerrejón reports that ten families had started a collective cattle project and that six families had developed projects in trade and services. In February 2015, Tamaquito II received the land titles for their new settlement site (Cerrejón 2015b). The new site consists of 31 residential units, each with an adjoining three-hectare parcel of land, houses with public functions, a primary school and a park like area for community events (Hora 2014: 96, 98; see figure 8). The majority of the site is tropical dry forest and is used for cattle farming. There is enough fertile land for agricultural activities. Between each house there is a distance of more than 80 meters (Hora 2014: 97). One residential unit consists of three brick-made houses with an iron roof and one mud-wall house, comparable to the standard buildings in the old Tamaquito II site (Hora 2014: 97; see figure 9). Unlike the original site, the new residential units have bathrooms and are equipped with electricity, water pipes, gas ovens, fridges and televisions but not air-conditioning as in Roche (Hora 2014: 97; Gutierrez Torres
SEM 2015 162
2014). The residents still have to get used to these new features, which also give rise to additional dependency on income generation and support from Cerrejón, as they previously lived relatively autonomously (Gutierrez Torres 2014; Hora 2014: 100). Figure 9. Houses in the new settlement of the Tamaquito II community
Source: Gutierrez Torres 2014, photo credit: Luis Ángel
Residents remain unsatisfied because of the poor water quality, insufficiency of income generation projects and the infrastructure of the houses (Cerrejón 2015a). Cerrejón addressed some of these issues by digging a new underground well, conducting water tests, hiring members of the community to carry out maintenance work at the new settlement site and ordering maintenance work on the houses. Yet, these are temporary solutions that do not respond to the full range of problems.
4. COMPARING THE RESETTLEMENT PROCESSES: WHAT CAN BE LEARNT? In this section, the five resettlement processes will be compared and evaluated. It is evident that mining-induced planned resettlements are long-term, complicated and for each community singular processes that need time to be negotiated, carried out and established. Yet, there are some clear differences between the cases of Roche, Patilla, Chancleta and Las Casitas on the one hand and Tamaquito II on the other. The indigenous community of Tamaquito II was the only community out of the five that managed to reach agreement on collective resettlement to a new site, which corresponds to many of the Tamaquito II residents’ needs, and can be considered as the most successful resettlement project out of the five. One reason for this relative success is that the community had a strong leader, stayed firm and united and negotiated as a collective (González Perafán 2015). They were moreover assisted in negotiations by the NGO Indepaz. A second reason is that the community received special treatment because of its status as a vulnerable indigenous group – although the other communities are partly of afro-Colombian decent and therefore belong to an ethnic minority, they were not regarded as such a group. Yet, the resettlement created a state of dependency as the community is no longer self-sufficient, instead now having to rely on Cerrejón’s subsidies. The implementation of productive projects has not yet been successful.
SEM 2015 163
THE AMERICAS
PIA VAN ACKERN WHEN MINING MOVES PEOPLE: DEVELOPMENT-INDUCED DISPLACEMENT AND RESETTLEMENT IN LA GUAJIRA, COLOMBIA
The resettlements of the afro-Colombian and rural communities of Roche, Patilla, Chancleta and Las Casitas have proved more problematic. Individual negotiations resulting in lengthy and fragmented resettlement processes are characteristic of these cases. The resettlement processes depended heavily on the individual negotiation skills of the families. This shows that the implementation of the second phase of Cerrejón’s resettlement process “designing a participative resettlement action plan with the community, following IFC guidelines” is especially challenging in these cases. Conflicts and uncertainty over the entitlement for collective resettlement and the lack of transparency during that phase of the process are the main concerns of the people of the four communities. Careful pre-studies of the sites and populations as well as publicly negotiated criteria for resettlement eligibility is necessary and the maintenance of a transparent dialogue during the whole process is of particular importance. Another common experience for these four communities is that the collectively resettled families moved from a rural to semi-urban environment, a fact that significantly changed their lives. Although the new settlements are well equipped with electricity, air conditioning and gas, the residents’ financial independence through productive projects is guaranteed merely in individual cases and subsistence agriculture is only possible to a limited extent. These observations demonstrate that the implementation of the fourth phase of “relocation and stabilization in the new location” has also proved problematic. The sufficient development and provision of income generation measures is essential to decrease vulnerability and dependency of the already resettled and soon to be resettled communities. Therefore, such projects should be a top priority. In cooperation with local authorities the resettlement itself could become a community development undertaking, improving the overall situation of the inhabitants of the affected region. In addition to the issues concerning all four communities, a particularity for Roche is that Cerrejón started to buy land from the Roche families prior to the implementation of a corporate resettlement strategy. The vast majority, around 375 out of 400 people, originally living in Roche have moved individually to urban centres in the surrounding area, many of them becoming impoverished. It was only in 2006, almost ten years later, that Cerrejón offered a collective resettlement to the remaining 25 families, out of which 23 have accepted to move to the new site. Two families remain at the previous site because they are cattle farmers who need more land than that offered by Cerrejón. The group of people who moved on an individual basis before 2006 formed the association Asoroche to demanding further compensation from Cerrejón and the NGO Indepaz began to assist them as well as the resettled collective. The situation of the former has nonetheless shown no improvement to date. The Las Casitas case is specific because 20 of the 31 families eligible for resettlement still reside at the original site of the village, along with 55 families who were not deemed eligible. Although Cerrejón conducted a population census and established criteria for resettlement, these were not accepted by most of the Las Casitas families. There was no compromise reached between the census conducted by the NGO Indepaz which supports the Las Casitas community and Cerrejón’s results. This entrenched situation might be the result of a deficient participatory process, or due to the fact that the residents of Las Casitas were aware of the shortcomings of the new settlements for the Roche, Patillla and Chancleta residents, and therefore demanded better conditions from Cerrejón. Under Colombian law, it is the responsibility and legal duty of a consortium that belongs to the world’s biggest and economically most successful mining companies to conduct thoughtful long-term planning and to demonstrate a strong social commitment towards the people living in the area of the mine. These two qualities can certainly be developed further. Yet, the insufficient involvement of the Colombian State in the resettlement process is evident. The lack of comprehensive legislation
SEM 2015 164
should be resolved by a precise and coherent law or regulation. Additionally, more executive involvement of the State is required. An administrative authority – preferably at the local level – should be tasked with monitoring the entire resettlement process and thus safeguarding the affected people. It is evident that State control in La Guajira as “Colombia’s Wild West” is lacking not only in regulating mining industries but in other respects as well. However, if the national government allows such development projects for the sake of the national interest, it should offer more support to the affected local people.
5. OUTLOOK: ROUND TABLE MEETINGS To resolve some of the issues connected with resettlements and the sustainable establishment of the communities in their new sites, Cerrejón, the Barrancas municipality and the leaders of the five communities set up regular round table meetings at the beginning of 2014 (González Perafán 2015; Cerrejón 2014a). The different topics of discussion are: “productive projects (emphasis on the water irrigation system and water reservoirs for agricultural use), educational support, drinkable water and infrastructure, employability and income generation, equal treatment for all communities, and change in the public stratification level of the houses and the villages to reduce amount of public utilities charged” (Cerrejón 2014a). Up to April 2015, 46 meetings had been held. The agreement on an education aid programme was reached and a local consultant was hired to assess livelihood projects for the resettled families (Cerrejón 2015a). Whether the round table meetings can contribute to an integral improvement of the communities’ situations remains to be seen over the coming years. It is thus overall fair to conclude that although Cerrejón improved its resettlement strategy after the third party review in 2008 some clear shortcomings remain.
SEM 2015 165
THE AMERICAS
PIA VAN ACKERN WHEN MINING MOVES PEOPLE: DEVELOPMENT-INDUCED DISPLACEMENT AND RESETTLEMENT IN LA GUAJIRA, COLOMBIA
REFERENCES Books –– Cernea, Michael (1988): Involuntary Resettlement in Development Projects –– Policy Guidelines in World Bank− Financed Projects. Washington D.C.: The World Bank. –– Hudson, Rex A. (2010): Colombia: a country study, US Government edition, Federal Research Division, Library of Congress, 5th edition. –– Leech, Garry M. (2009): Beyond Bogotá: Diary of a Drug War Journalist in Colombia. Boston: Beacon Press. –– Oliver-Smith, A. (2009) (Ed.): Development & Dispossession: The Crisis of Forced –– Displacement and Resettlement. Santa Fe: School for Advanced Research Advanced Seminar Series. Articles –– Cernea, Michael (1997): The Risks and Reconstruction Model for Resettling Displace Populations. In: World Development, Vol 25, No. 10, 1569-1587 –– Cernea, Michael (2008): Reforming the foundations of involuntary resettlement: Introduction. In: Cernea, Michael/Mathur, Hari Mohan (eds.): Can Compensation Prevent Impoverishment? Reforming Resettlement Through Investment and Benefit-Sharing. New Delhi: Oxford University Press, 1-10. –– González Perafán, Leonardo (2011): Desalojo Forzado, Reasientamientos Involuntarios y Derechos de las Comunidades. In: Megaminería y Reasentamientos Forzados. Indepaz –– Hora, Benedikt (2014): Mining-induced displacement and resettlement in Colombia. Socio-economic and cultural consequences of resettlement of campesions and indigenous people – The case of the Cerrejón open pit mine in La Guajira. Master’s thesis, University of Innsbruck, http://diglib. uibk.ac.at/ulbtirolhs/download/ pdf/202154?originalFilename=true (consulted on 18 March 2015)
SEM 2015 166
–– Price, Susanna (2009): Prologue: Victims or Partners? The Social Perspective in Development-Induced Displacement and Resettlement. In: The Asia Pacific Journal of Anthropology, Vol. 10, No. 4, 266-282 Reports and press releases –– Ask! (Arbeitsgruppe SchweizKolumbien) (2014): Jahresbericht 2014. –– Cerrejón (2008): Response to the independent panel’s assessment of Cerrejón’s social engagement practices, http://www.cerrejon. com/site/Default.aspx?tabid=566 (consulted on 5 May 2015) –– Cerrejón (2009a): 2nd Progress Report on Cerrejón’s Social Commitments, April 2009, http://www.cerrejon.com/ site/Default.aspx?tabid=561 (consulted on 5 May 2015) –– Cerrejón (2009b): 3rd Progress Report on Cerrejón’s Social Commitments, October 2009, http://www.cerrejon. com/site/Default.aspx?tabid=563 (consulted on 5 May 2015) –– Cerrejón (2010a): 4th Progress Report on Cerrejón’s Social Commitments, April 2010, http://www.cerrejon. com/site/Default.aspx?tabid=564 (consulted on 5 May 2015) –– Cerrejón (2010b): 5th Progress Report on Cerrejón’s Social Commitments, October 2010, http://www.cerrejon. com/site/Default.aspx?tabid=562 (consulted on 5 May 2015) –– Cerrejón (2011a): 6th Progress Report on Cerrejón’s Social Commitments, April 2011, http://www.cerrejon. com/site/english/sustainabledevelopment-%E2%80%A2-socialresponsibility/performance/thirdparty-review-of-social-programs/ sixth-report.aspx (consulted on 5 May 2015) –– Cerrejón (2011b): 7th Progress Report on Cerrejón’s Social Commitments, October 2011, http://www.cerrejon. com/site/english/sustainabledevelopment-%E2%80%A2-socialresponsibility/performance/thirdparty-review-of-social-programs/
seventh-report.aspx (consulted on 5 May 2015) –– Cerrejón (2012a): 8th Progress Report on Cerrejón’s Social Commitments, June 2012, http://www.cerrejon. com/site/Default.aspx?tabid=1368 (consulted on 5 May 2015) –– Cerrejón (2012b): 9th Progress Report on Cerrejón’s Social Commitments, October 2012, http://www.cerrejon. com/site/Default.aspx?tabid=1543 (consulted on 5 May 2015) –– Cerrejón (2012c): Sustainability Report 2012, http://www.cerrejon. com/site/Portals/1/Documents/pdf/ sustainability_reports/Cerrejon_ Sustainability_Report_2012.pdf (consulted on 5 May 2015) –– Cerrejón (2013): 10th Progress Report on Cerrejón’s Social Commitments, May 2013, http://www.cerrejon. com/site/Default.aspx?tabid=1707 (consulted on 5 May 2015) –– Cerrejón (2014a): 11th Progress Report on Cerrejón’s Social Commitments, May 2014, http://www.cerrejon. com/site/Default.aspx?tabid=1946 (consulted on 5 May 2015) –– Cerrejón (2014b): 12th Progress Report on Cerrejón’s Social Commitments, November 2014, http://www.cerrejon. com/site/Default.aspx?tabid=2075 (consulted on 5 May 2015) –– Cerrejón (2014c): Cerrejón’s Declaration on the Statement of the Las Casitas Community Action Board in September of 2014, http://businesshumanrights.org/sites/default/files/ documents/CERREJ%C3%93N’S%20 DECLARATION%20ON%20 THE%20STATEMENT%20OF%20 THE%20LAS%20CASITAS%20 COMMUNITY%20ACTION%20 BOARD%20IN%20SEPTEMBER%20 OF%202014.pdf (consulted on 20 April 2015) –– Cerrejón (2015a): 13th Progress Report on Cerrejón’s Social Commitments, April 2015, http://www.cerrejon. com/site/Default.aspx?tabid=2190 (consulted on 5 May 2015)
–– DANE (Departamento Administrativo Nacional de Estadística) (2010): Boletín Censo General 2005, Perfil La Guajira, 13 September 2010 (consulted on 5 May 2015) –– DANE (Departamento Administrativo Nacional de Estadística) (2012): La Guajira: Pobreza Monetaria 2012, http://www.dane.gov.co/files/ investigaciones/condiciones_vida/ pobreza/Guajira_Pobrez –– a_2012.pdf (consulted on 15 April 2015) –– DANE (Departamento Administrativo Nacional de Estadística) (2013): Anexos estadísticos –– 2013 Colombia, exportaciones totales, según CIIU Rev. 3 1995 – 2013, October 2013, http://www.dane.gov.co/files/ investigaciones/comercio_exterior/ exportaciones/2013/a –– nexos_export_oct13.xls (consulted on 15 April 2015) –– González Perafán, Leonardo/ Valenzuela, Diana Paola (2013): Informe de visita y reuniones con comunidades a reasentar en La Guajira, 28-30 May 2013. Indepaz (consulted on 5 May 2015) –– Harker, John/Kalminovitz, Saloman/Killick, Nick/Serrano, Elena (2008): Cerrejon Coal and Social Responsibility: An Independent Review of Impact and Intent, http://www.cerrejon. com/site/Portals/1/Documents/ pdf/FinalPanelReportFebruary.pdf (consulted on 22 April 2015) –– IDMC (Internal Displacement Monitoring Centre) (2014): Colombia. Displacement continues despite hopes for peace, 16 January 2014. –– IFC (2015b): Guidance Note 5 Land Acquisition and Involuntary Resettlement, http://www.ifc.org/ wps/wcm/connect/4b976700498008d 3a417f6336b93d75f/Updated_GN5-2012. pdf?MOD=AJPERES (consulted on 15 April 2015)
Guajira. In: La minería de carbón a gran escala en Colombia: impactos econnónimcos, sociales, laborales, ambienmentales y territoriales, Friedrich Ebert Stiftung, Análisis 1/2014, 44-67 Newspaper articles –– Balch, Oliver (2013): Cerrejón mine in Colombia: can it address its human rights risks? In: The Guardian, 25 July 2013, http://www.theguardian.com/ sustainable-business/cerrejon-minecolombia-human-rights (consulted on 23 March 2015) –– Brinded, Lianna (2013): Timeline and Factbox: Glencore and Xstrata Merger. In: International Business Times, 3 May 2013, http://www.ibtimes.co.uk/ glencore-xstrata-merger-sharestrading-qatar-sovereign-464122 (consulted on 18 April 2015) –– Gutierrez Torres, Carolina (2014): “El pueplo wayuu que el carbón desterró” In: El Espectador, 24 February 2014, http://www.elespectador. com/noticias/medio-ambiente/ el-pueblo-wayuu-el-carbon-desterroarticulo-477081 (consulted on 18 April 2015) –– Spence, Robert (2014): Top 10 Mining Companies Based on Revenue. In: Mining Global, 12 August 2014, http:// www.miningglobal.com/top10/1069/ Top-10-Mining-Companies-Based-onRevenue (consulted on 17 April 2015) –– Semana (2014a): ¿Estamos perdiendo La Guajira? In: Semana, 19 July 2014, http://www.semana.com/nacion/ articulo/estamos-perdiendo-laguajira/396289-3 (consulted on 17 April 2015) –– Semana (2014b): Frontera con Venezuela, tierra de nadie, In: Semana, 19 July 2014 http://www.semana. com/nacion/articulo/frontera-convenezuela-tierra-de-nadie/396291-3 (consulted on 19 April 2015)
–– Suhner, Stefan (2014): Las Casitas droht gewaltsame Enteignung, 30 September 2014, ASK! (Arbeitsgruppe Schweiz-Kolumbien)
–– Semana (2014c): ¿Quién se robó el agua de La Guajira?, In: Semana, 4 August 2014. http://www.semana. com/nacion/articulo/quien-serobo-el-agua-de-la-guajira/398006-3 (consulted on 19 April 2015)
–– Teherán Sanchez, Sandra (2014): Impactos socioterritoriales de la explotación minera en los departamentos del César y La
–– Willis, Andrew (2014): BHP Coal Mine Meeting Relocation Resistance in Colombia, In: Bloomber Business, 11 November 2014. http://
www.bloomberg.com/news/ articles/2014-11-11/bhp-coal-minemeeting-relocation-resistance-incolombia?formatrss2012-08-02.html (consulted on 19 April 2015) Interviews –– Interview with Stephan Suhner, Arbeitsgruppe Schweiz-Kolumbien, conducted on 24 April 2015 via Skype –– Interview with Leonardo González Perafán, Indepaz, conducted on 4 May 2015 via Skype Websites –– Cerrejón (2015b): Cerrejón Handed Donation Deed to Wayuu Community of Tamaquito II, 11 February 2015, http://www.cerrejon.com/site/ english/press-room/news-archives/ cerrejon-handed-deed-to-tamaquitoii.aspx (consulted on 20 April 2015) –– Cerrejón (2015c): Chancleta (consulted on 5 May 2015) –– Cerrejón (2015d): History, http:// www.cerrejon.com/site/english/ourcompany/history.aspx (consulted on 16 April) –– Cerrejón (2015e): Las Casitas, http://www.cerrejon.com/site/ english/sustainable-development%E2%80%A2-social-responsibility/ resettlements/las-casitas.aspx (consulted on 5 May 2015) –– Cerrejón (2015f): Our Company, http://www.cerrejon.com/site/ english/our-company.aspx (consulted on 5 May 2015) –– Cerrejón (2015g): Patilla, http:// www.cerrejon.com/site/english/ sustainable-development%E2%80%A2-social-responsibility/ resettlements/patilla.aspx (consulted on 5 May 2015) –– Cerrejón (2015h): Resettlements, http://www.cerrejon.com/site/ english/sustainable-development%E2%80%A2-social-responsibility/ resettlements.aspx (consulted on 15 April 2015) –– Cerrejón (2015i): Roche, http:// www.cerrejon.com/site/english/ sustainable-development%E2%80%A2-social-responsibility/ resettlements/roche.aspx (consulted on 5 May 2015) –– Cerrejón (2015j): Tamaquito II, http://www.cerrejon.com/site/
SEM 2015 167
THE AMERICAS
PIA VAN ACKERN WHEN MINING MOVES PEOPLE: DEVELOPMENT-INDUCED DISPLACEMENT AND RESETTLEMENT IN LA GUAJIRA, COLOMBIA
english/sustainable-development%E2%80%A2-social-responsibility/ resettlements/tamaquito-ii/phase-i. aspx (consulted on 5 May 2015)
–– UNHCR (2015): 2015 UNHCR country operations profile – Colombia, http:// www.unhcr.org/pages/49e492ad6. html (consulted on 20 April 2015)
–– IDMC (2015): Global Overview 2015, http://www.internal-displacement. org/global-overview/ (consulted on 18 April 2015)
–– Ramirez, Nilson (2010): Interview with Nilson Ramirez, teacher of Tamaquito II, condicted on 19 and 20 November 2010 by Stephan Suhner, NGO Ask !, http://www. askonline.ch/fileadmin/user_upload/ documents/Thema_Wirtschaft_und_ Menschenrechte/Bergbau_Rohstoff/ Glencore_Kolumbien/Interview_ Nilson_Ramirez.pdf (consulted on 20 April 2015)
–– IFC (2015a): Environmental and Social Performance Standards and Guidance Notes, http:// www.ifc.org/wps/wcm/connect/ topics_ext_content/ifc_external_ corporate_site/ifc+sustainability/ our+approach/risk+management/ performance+standards/environment al+and+social+performance+standard s+and+guidance+notes (consulted on 15 April 2015) –– Indepaz (2014): Carta de la Junta de Acción Comunal vereda Las Casitas, 2 July 2014, http://www.indepaz.org. co/?p=4363 (consulted on 5 May 2015)
SEM 2015 168
alcaldiabogota.gov.co/sisjur/normas/ Norma1.jsp?i=9202#285 (consulted on 20 April 2015) –– Law 1382 of 2010, http://www. alcaldiabogota.gov.co/sisjur/normas/ Norma1.jsp?i=38863 (consulted on 15 April 2015) –– Law 56 of 1981, http://www.minminas. gov.co/documents/10180/670382/ Ley56de1981.pdf/7431ad3d-dcbf-4f1b9a3d-20e949c30954 (consulted on 20 April 2015) –– World Bank (2001): The World Bank’s
Legal sources and guidelines –– Colombian Constitution (English version), https://www. constituteproject.org/constitution/ Colombia_2013?lang=en (consulted on 20 April 2015)
Operational Policy on Involuntary
–– Colombian Mining Code
K:64709108~theSitePK:502184,00.html
–– Law 685 of 2001, http://www.
(consulted on 20 April 2015)
Resettlement (OP) 4.12, http://web. worldbank.org/WBSITE/EXTERNAL/ PROJECTS/EXTPOLICIES/EXTOPMA NUAL/0,,contentMDK:20064610~me nuPK:64701637~pagePK:64709096~piP
ADRIANA CRUZ FELIX
The Correlation between Environmental Disasters and Migration Trends in Chiapas, Mexico
I
n 2014, the state of Chiapas, Mexico was affected by tropical storm Boris and other strong rainfall events causing river over flow, landslides and floods that affected at least 30,000 people throughout the year. For more than a decade the state of Chiapas has experienced the second largest precipitations level in Mexico, just below that of neighbouring state Tabasco, with around 2,000 mm per year (CONAGUA, 2015). Moreover, Chiapas is Mexico’s poorest region, with 74.7 per cent of its population living in poverty (CONEVAL, 2012). The combined effect of critical socioeconomic conditions in Mexico and the increasing frequency and intensity of natural hazards caused by shifts in temperature, rainfall, and soil degradation, lead to the destruction of arable land, reducing food resources and sources of income opportunities that eventually encourage populations to migrate in the search of better living conditions elsewhere (FAO, 2015). Indeed, since the end of the 1990’s, studies have reported the critical degradation of Mexican soil, although environmental degradation and natural disasters only started to be linked to migratory movements by scholars during the second half of last decade (Albo&Ordaz, 2011). ‘Chiapanecos’1, for their part, have been more reactive to this situation as they started to feel the negative impacts of natural hazards with the floods of 1998 and subsequently Hurricane Stan in 2005, both of which caused catastrophic infrastructure destruction, environmental damage, and human losses. The consequences of by these two events were so pronounced that chiapanecos live with the fear that the worst is yet to come. The fear of once again experiencing a natural disaster is present in daily life, and yet the Mexican government’s climate change adaptation and mitigation policies have been inadequately formulated and seem insufficient to help communities to cope with strong rainfall and natural hazards. The purpose of this paper is to examine the argument that internal and international migration patterns in Chiapas have been shaped by the increased frequency of natural disasters. In the latest national census in 2010, Chiapas, which in the past was not one of the traditional migration states in Mexico, appeared for the first time in the list of the 15 Mexican states with the highest level of international migration, and is the state in Mexico with the fourth most negative net migration rate2 (INEGI, 2015). Furthermore, between 1995 and 2014 Chiapas jumped from 27th to 17th place of the national ranking of states to receive the largest amount of remittances per annum, a common tool to monitor migration movements in Mexico (Jungehülsing, 2010; Banxico, 2015). Studies
1. Chiapanecos is the common name given to people from the state of Chiapas. 2. Net migration rate is the number of emigrants minus the number of immigrants in the studied area. (INEGI, 2015)
SEM 2015 169
THE AMERICAS
ADRIANA CRUZ FELIX THE CORRELATION BETWEEN ENVIRONMENTAL DISASTERS AND MIGRATION TRENDS IN CHIAPAS, MEXICO
investigating the link between environmental hazards and the factors behind migration movements are still scarce in the region. This paper will start by presenting a brief description of climate change and environmental degradation in the state of Chiapas. This will be followed by a review of the natural disasters that occurred in 2014, particularly tropical storm Boris which exacerbated the environmental degradation caused by the 1998 floods and Hurricane Stan in 2005, and how this provides evidence of environmental factors acquiring an important role as drivers of emigration in Mexico. Subsequently, statistical data relating to migration movements and remittances received by Chiapas along with evidence from several case studies will be analysed to demonstrate the correlation between environmental degradation and emigration. The paper will end by presenting the manifest policy gaps when responding to natural disasters and contend that the government’s persistent failure to develop medium and long-term adaptation and mitigation strategies, instead focusing in the aftermath of disasters on immediate temporary solutions , perpetuates the high level of vulnerability of the population of Chiapas.
1. CLIMATE CHANGE IN CHIAPAS Chiapas is considered to be the second least resilient state in Mexico (Alscher, 2009:8). This can be explained by the mix of poor socioeconomic conditions – Chiapas is Mexico’s poorest state, with 74.7 per cent of its population living in poverty conditions (CONEVAL, 2012) – and the increasing frequency of floods caused by meteorological phenomena. According to the Mexican National Commission for Disaster Prevention and the National Meteorological Service3, Chiapas will experience an increase in the number of hurricanes and tropical storms in the coming years, and it will become more vulnerable to sea-level rise (Image 1) (Diario Official de la Federacion, 2014). Current environmental challenges are the consequence of unplanned demographic growth and the lack of regulation of the exploitation of natural resources for economic purposes (Ruiz, 2010). According to data from the Mexican National Ecology Institute, in 1990, 52 per cent of Mexico’s territory was covered with forests; this figure had decreased to 34 per cent by 2011, with average losses of 600 thousand hectares each year4 (Alscher, 2009:9; Camacho, 2014). Furthermore, the expansion of agriculture has also caused widespread soil erosion: in 2014, 63 per cent of Mexican territory presented some degree of soil erosion (123.3 million hectares) (CONAFOR, 2014). Deforestation, land use and soil erosion increase the impact of hydrological phenomena in the region during the rainy season given that forests serve as precipitation regulators by absorbing and rerouting water slowly into rivers, lakes and streams, reducing the size of the flood peak. In Chiapas, around 76 per cent of forest cover is degraded but the Mexican government has not implemented any measures to prevent this situation. Indeed, only 0.11 percent of the national budget is allocated to forest conservation and restoration (Castro, 2005). The areas most affected by water erosion are the Istmo-Costal, Soconusco, Sierra de Chiapas and Border regions, where rainfall ranges from 1,400
3. The Mexican National Commission for Disaster Prevention and the National Meteorological Service have undertaken a series of studies to identify the different risks and climate change conditions to which the different regions of Mexico will be exposed in the coming years. Their assessments have contributed to the establishment of the National Program for Climate Change Mitigation 2014-2018. (Diario Official de la Federacion, 2014) 4. Mexico is the second Latin American country with the highest deforestation levels, just behind Brazil. (Alscher, 2009:9)
SEM 2015 170
Figure 1. Flood risk (blue = areas highly vulnerable to flooding)
Source: Special Program for Climate Change 2014-2018. (Diario Oficial de la Federación, 2014)
mm in the coastal and downstream zones to 4,500 mm in the middle and upstream zones of the watersheds. Furthermore, the decline in both water quality and quantity is starting to cause conflicts among the population (Ruiz, 2010). Non-governmental organisations such as Greenpeace have also highlighted forest and wetland degradation as the main factors increasing Chiapas’ vulnerability to floods and related hydrological phenomena. Chiapas is facing a vicious circle of illegal deforestation for agriculture practices that increase the risk of flooding and landslides, which subsequently affects the poorest communities, forcing them to relocate in search of better living conditions. The current situation in Chiapas is critical as it is estimated that floods and droughts will affect at least 75 per cent of Chiapas’ territory in the coming years (Ibarrarán & Rodríguez, 2007).
2. THE RECCURENCE OF NATURAL DISASTERS IN CHIAPAS 2.1. 2014: Another year of heavy rainfall and flooding in chiapas
Each year from March to October, Chiapas’ population fears that the rainy season may cause worse natural disasters than the ones experience the year before (Narvaez, 2006). Emergency evacuations of vulnerable regions and the opening of temporary shelters have become common practices as soon as tropical storms are announced. According to the Mexican National Water Commission (CONAGUA) precipitation levels continue to rise each year (Table 1), while environmental degradation persists and, combined with the failure to repair infrastructure damage caused in previous years, increase the risk of moderate rainfall causing severe damage in the region.
SEM 2015 171
ADRIANA CRUZ FELIX THE CORRELATION BETWEEN ENVIRONMENTAL DISASTERS AND MIGRATION TRENDS IN CHIAPAS, MEXICO
THE AMERICAS
Table 1. Average Annual Precipitation (in millimetres) 2004
205
2006
2007
2008
2009
2010
2011
2012
2013
2014
Chiapas
1,713.8 2,190.7 2,354.2
2,302.6
2,354.9
1,953.1
2,730.3
2,381.6
1,885.3
2,278.6
2,056.5
National
872.2
812.2
900.7
723.4
962.1
697.2
742.3
920.5
830.8
788.1
808.0
Source. CONAGUA (2015).
MEXICO’S MIGRATION BACKGROUND Mexico has a long history of both internal and international migration. Analysts consider the roots of Mexican migration to the United States to be located around the 1840s, after the Mexican-American war when Mexico lost about 40% of its territory. It was then that the first cross-border social networks were created as thousands of Mexican families remained in former Mexican territory. Nevertheless, it was not until the first half of the twentieth century that people started to leave their rural communities in response to the economic and social instability caused by the Mexican Revolution (1910-1920) (Alscher, 2009). Initially, migration flows consisted mainly of internal migration towards cities, especially to Mexico City, or towards industrial manufacturing and agricultural cities in the northern part of the country and coastal tourist destinations. International migration towards the United States intensified around the 1940s with the implementation of the Bracero Program under which more than 4.6 million Mexicans moved to the U.S. under labour contracts (Jungehülsing, 2010). Towards the end of twentieth century, the Mexican debt crisis caused economic stagnation, which, in addition to demographic growth led to labour market saturation and the increased attractiveness of migration to the north. (Ruiz, 2010) Migration specialists consider the international migration flow that originated from the Bracero Program as ‘traditional migration’ in Mexico. After the 1980s, migration specialists believed there was a ‘new migration era’ in the country as migration flows started to emerge in every Mexican region, rather than just in the central and central-west regions, where the Bracero Program was first focused (Jungehülsing, 2010). Policy makers viewed migration a means of reducing pressure on the labour market and a source of additional financial flows generated by Mexicans working in the United States sending remittances to their families in Mexico. Alscher (2009) estimates that the income of households receiving remittances is between 20 to 25%, and in some cases even as much as 40% higher than households without cross-border ties.
In 2014, rainfall affected Chiapas’ population from the beginning of the year. Starting from January, when the rainfall caused by six cold fronts affected 11,086 people in 11 municipalities in the northern part of Chiapas, 380 temporary shelters had to be opened according to the Civil Protection Regional Institute. Furthermore, 8,183 hectares of crops and 4,175 houses were affected (Henriquez, 2014). CONAGUA declared that this was the first time in more than 50 years that Chiapas had witnessed such heavy rainfall at this time of the year. In June, tropical storm Boris hit Chiapas. Boris lasted 48 hours and, according to CONAGUA, its maximum precipitations amounted to 550mm. Nine municipalities were declared in a state natural disaster. On average, the region experienced the equivalent of 60 days’ rainfall in the space of twenty four hours. Official numbers state that during this tropical storm, 11 rivers reached their maximum capacity, 16,000 people were evacuated, and after the rainfall 943 people had to stay in 5 temporary shelters, with houses suffering total or partial damage in 31 municipalities (CENAPRED, 2015). There were also 14 landslides along federal roads and a bridge was destroyed in Villacorzo municipality. Two other landslides left two communities isolated for a several days (ICOSO Chiapas, 2015).
SEM 2015 172
In September, two tropical waves put 8 municipalities in a state of emergency and 3 municipalities of the northern and mountain regions of Chiapas in a state of disaster (ICOSO Chiapas, 2014). The over flow of the Chalaca river in Villa Comatitlan municipality, causing flooding ranging from 30cm to 1 meter deep, led to the death of a woman, and more than 2,000 people had to be lodged in temporary shelters following damage to around 850 houses (CNN Mexico, 2014). Furthermore, the over flow of the Santa Marta river damaged 11 houses in Osctuacan municipality, where 234 families had to be transferred to temporary shelters. 42 roads where damaged, causing the total or partial isolation of more than 3,000 families (Henriquez, 2014). In October, a cold front caused landslides, floods, and the loss of crops, affected 6 municipalities. At least 12 houses where declared uninhabitable and families had to evacuate and move in with relatives. Furthermore, more than 650 families suffered severe damage to their houses and material losses, forcing them to relocate to temporary shelters (Lopez, 2014). Nonetheless, there is no information available confirming the relocation of these families with their relatives, the status of reconstruction work, or whether people were able to return to their homes after the flooding subsided in all of the aforementioned cases. In 2014, Chiapas did not experience one singular catastrophic hydrological phenomenon causing massive human and material damage in the space of several days, as had been the case in previous years, but the effect of annual rainfall exacerbated the already vulnerable situation of the Chiapas population, with unofficial data accounting for more than 30 thousand people having been affected by flooding during the year.
2.2. 1998 Catastrophe caused by floods
Natural disasters started becoming critical in 1998, when the region experienced forest fires that lasted for 3 months, causing the deforestation of almost 200 hectares including natural protected areas. Deforested land became highly vulnerable to soil erosion, which increased the impact of the tropical storms caused by hurricane Mitch in Central America that hit Chiapas’ territory on 6th September of the same year. Rainfall was intense and abundant for 7 days throughout the Coastal and Sierra de Chiapas regions. The lack of forest cover meant that the high levels of precipitation caused landslides, which displaced large amounts of rock, vegetation and soil blocking the sewage system, causing rivers to overflow, flooding of villages and the accumulation of sediments along floodplains, estuaries and coastal lagoons (Parra, 2011). Regional ecosystem characteristics completely changed after the 1998 floods. Erosion marks became visible at middle and upstream sites where all vegetation had disappeared. The populations living next to rivers were covered with the debris and mud washed down during landslides (SEMARNAT-CNA / UNAM-IG, 1999). Villages were completely flooded, with no access to drinking water or food. According to official numbers, more than 400,000 hectares of agriculture land were damaged, mainly coffee and corn crops, around 500,000 people lost their homes, and 400 people died during the disaster (Arellano, 2005). The number of victims estimated by non-governmental organisations and civil associations is higher than official numbers, suggesting that the environmental disaster caused by the 1998 hydrological phenomenon affected around 1.2 million people in 36 of the 122 municipalities of the state of Chiapas. This number represents around 35 per cent of the total Chiapas population at the time. 50 rivers burst their banks, 20 bridges were destroyed, 450 km of national roads had to be reconstructed and 833 rural roads were destroyed. Rainfall in 1998 was three times higher than the previous year’s precipitation levels, and it was estimated that 24 per cent of the average yearly rainfall occurred during the space of 7 days (Castro, 1998). A considerable number of the victims were isolated as the Panamerican highroad was destroyed during the meteorological event (SIPAZ, 1998). Analysts at the time estimated that
SEM 2015 173
ADRIANA CRUZ FELIX THE CORRELATION BETWEEN ENVIRONMENTAL DISASTERS AND MIGRATION TRENDS IN CHIAPAS, MEXICO
THE AMERICAS
Figure 1. Correlation between land degradation and migration in Mexican states with high poverty rates. 2.50
3,00
y = 0,561 x -0,917
2.00
2.50
R² = 0.143
1.50 1.00
1.50
0.50
1.00
-----0.50
0
0.5
1
y = 0.283 x 0.267
2.00
1.5
2
-1.00 -1.50 Land degradation
2.5
Migration (Indice)
Migration (Indice)
Figure 2. Correlation between land degradation and migration in Mexican states with medium, low and very low poverty rates.
R² = 0.026
0.50 -----0.50
0
0.5
1
1.5
2
2.5
-1.00 -1.50 Land degradation
Source: BBVA Bancomer (Albo & Ordaz, 2011)
the reconstruction of damaged zones would take more than 25 years, and national authorities calculated that around 800 million U.S. dollars would be needed to repair the damages caused (Castro, 1998). In 1998, former Mexican President Zedillo (1992-2000) believed this catastrophe to be the worst meteorological disaster that the state of Chiapas had suffered. According to geophysical studies carried out by the National Autonomous University of Mexico (UNAM), disasters of similar magnitude occurred on average three times every 100 years in the region, at intervals of 30 to 40 years. Nevertheless, an even greater catastrophe occurred only 7 years later.
2.3. Hurricane stan 2005
Hurricane Stan hit the Yucatan Peninsula from the 3rd October to the 6th October 6th 2005, moving across the Gulf of Mexico and through the Sierra Madre. It was the 6th hurricane that touched land during the hurricane season of 2005, setting a new record after 1999 when five hurricanes directly impacted the coastal regions of Mexico (Parra, 2011). Intense rainfall caused by Hurricane Stan had a marked effect the already highly vulnerable communities in the southern part of Mexico, causing flooding and landslides in the states of Chiapas, Veracruz, Oaxaca, Puebla y Quintana Roo, and to a lesser extent in the states of Yucatán, Campeche and Tabasco. Hurricane Stan eclipsed the 1998 floods as the worst natural disaster experienced by Chiapas (CENAPRED, 2005). By the time Hurricane Stan reached the central east coast of Mexico, it had been classified as a category 1 hurricane according to the Saffi-Simson scale. Chiapas was the worst affected state, with 86 of the 98 fatalities and around 15 million U.S. dollars of the estimated total of 21 million U.S. dollars-worth of damage in the whole country (CENAPRED, 2005). Official Mexican government sources state that Hurricane Stan greatly affected 41 municipalities of the state of Chiapas. Tapachula, the second largest city of the state was the worst hit municipality due to flooding caused by the Coatan river overflowing. The sectors that were most affected were transportation, agriculture, water infrastructure, housing and environment (CENAPRED, 2005). For the first time in Mexican history, an official report of the socio-economic impact of the disaster included the damage caused to the environment and its impact on livelihoods (Parra, 2011). This report clearly demonstrated the link between the landslides caused by Hurricane Stan and the destruction of middle and upstream watershed vegetation that severely affected the habitat and human settlements in which the rainfall occurred.
SEM 2015 174
Hurricane Stan caused the isolation of around 700 thousand people due to the destruction of 1,800 federal roads, 530 rural roads and 27 bridges. 31,000 families were left homeless, while another 12,000 households suffer partial damage. To date there are still families waiting for their houses to be rebuilt (Briones, 2010) and there is no record of where homeless people moved. Likewise, 305 schools were damaged and 96 were completely destroyed, and more than 2,000 businesses operations were affected (Informador, 2010). 70 per cent of coffee crops were damaged, causing around 185 million U.S. dollars of losses according to unofficial estimates (Ruiz, 2010).
3. HOW DO FLOODS IN CHIAPAS RELATE TO ENVIRONMENTAL MIGRATION? 3.1. Environmental migration studies in mexico
migration studies in Mexico are well documented, especially during the last few decades in response to the estimated 500,000 people migrating to the United States. Nevertheless, analysts have mainly focused on studying the different economic and social factors pushing migration flows, commonly failing to recognise the importance of environmental degradation as one of the growing drivers of out-migration due to its impact on social and economic migration (Foresight, 2011). Since the end of the 1990s studies have reported the critical degradation of Mexican soil. But it was not until the second half of the last decade that environmental degradation started to be directly linked to migration flows in Mexico, as deforestation and unfertile areas have pushed rural communities to emigrate in search of livelihood opportunities (Albo & Ordaz, 2011). The Mexican Migration Project5 states that the vast majority of migration communities are characterised by a lack of possession of any kind of land or possession of land that has been degraded and is no longer fit for agriculture practices. To support this argument Albo and Ordaz (2011:7) compared the land degradation with CONAPO’s migration index charting migration movements. They created two groups, one of Mexican states with high and very high poverty rates and another containing states with medium, low and very low poverty rates. They found that there was a positive correlation between land degradation and migration in both groups, though this correlation was more significant in the group with high and very high poverty rates, suggesting that where the land is less fertile and communities experience economic hardship, migration rates tend to be higher (Graph 1 & 2). Furthermore, the Environmental Change and Forced Migrations Project in Mexico, also concludes that there is a link between environmental degradation and migration in certain regions of Mexico, as soil erosion and rainfall changes have contributed to migration flows (Alscher, 2009).
3.1. Correlating chiapas migration with environmental degradation
Temporary migration has been quite common in the state of Chiapas since the 1970s due to the coffee industry’s demand for a workforce. Yet the state was not considered part of the ‘traditional migration’ to the North, particularly when talking about migration to the United States, as the region was not part of the Bracero Program6, and also due to the fact that international migration requires a certain amount of financial investment that low level income communities cannot afford (Jungehülsing,
5. The Mexican Migration Project a bi-national research effort to understand the complex process of Mexican migration to the United States. It is co-directed by the University of Guadalajara (Mexico), and Princeton University (US). (MMP, 2015) 6. See box about Mexican Migration Background
SEM 2015 175
THE AMERICAS
ADRIANA CRUZ FELIX THE CORRELATION BETWEEN ENVIRONMENTAL DISASTERS AND MIGRATION TRENDS IN CHIAPAS, MEXICO
2010). Nevertheless, this trend drastically changed after the 1998 floods and increased even more after hurricane Stan in 2005. Since then, the frequency of tropical storms and hurricanes has considerably increased (Alscher 2009), generating agricultural and socio-economic crises that have contributed to the growing stream of people emigrating to both the United States and other regions of Mexico (Ruiz, 2010). The 1998 floods and hurricane Stan in 2005 are of particular importance in understanding the relation between migration movements in Chiapas and environmental degradation as it was not until the last decade that studies of migration movements have started to correlate mobility with environmental disasters. In the past, emigration from Chiapas was mainly to nearby destinations, but trends since the early 2000s show how that chiapanecos have started to emigrate to northern states with the intention of subsequently emigrating to the United States (Anguiano, M.E., 2008). The national census of 2010 confirms the persistence of the aforementioned trend as Chiapas figured for the first time in the list of the 15 states with the largest portions of emigration flows towards the United States. Furthermore, in terms of internal migration, Chiapas is the Mexican state with the lowest proportion of nonnative population and it ranks 4th on the list of states with the most negative net migration rate (- 1.4 with more than 105,858 people leaving Chiapas between 2005 and 2010 to migrate internally). It is interesting to note the destinations of migratory outflows from Chiapas. Data from the 2010 census show that 21 out of every 100 chiapanecos that emigrated went to Quintana Roo, the state receiving the secondmost immigrants in Mexico, mainly in search of better livelihoods given the presence of Cancun and other touristic destinations in the state. The second most popular destination for chiapanecos is Baja California: 13 out of every 100 Chiapas emigrants head there, mainly to the border city of Tijuana (8 out of 10), a relevant fact when related to the growing trend of international migration from the state. The remaining internal migration from Chiapas is directed to neighbouring states with better socio-economic conditions such as Tabasco, Veracruz, Mexico State and Mexico City (INEGI, 2015). Furthermore, it is important to note that one of main indicators used by the Mexican government to quantify the number of people migrating is the amount of remittances received by families in the different states of Mexico from their relatives in the United States. Based on this data, migration flows in Chiapas have visibly increased as remittances to Chiapas in 2005 amounted to four times the value of coffee production, the most important export product of the state. In the national ranking of states that receive the most remittances, Chiapas has risen from 27th place in 1995 to 11th place in 2005 and then to the 17th place in 2014 (Jungehülsing, 2010; Banxico, 2015). The recent decrease in the amount of remittances received by Chiapas could be explained by the fact that the trend of men migrating alone to work with the rest of the family remaining at home is giving way to one of relocation of the whole family (Ruiz, 2010). Another way to demonstrate the correlation between migration in Chiapas and hydrological phenomena, is to compare the amount of remittances received by the state over the course one year. Graph 3 shows that remittances increase during the 2nd and 4th trimester of each year, which corresponds to the annual rainfall season in the state of Chiapas. More specifically, in 2004 the remittances received by the state of Chiapas amounted to 587.5 million U.S. dollars, and in 2006, total remittances reached 940.8 million U.S. dollars (Banxico, 2015) eclipsing the remittances received by other ‘traditional migration’ states. The increase in remittances received by the state after Hurricane Stan in 2005 serves as proof of the correlation between the decision to migrate and the environmental vulnerability of the region (Jungehülsing, 2010). In 2005, 40% of the population of Chiapas that was living in the United States came from the Istmo-Costal, Soconusco, Sierra de Chiapas and Border regions, which were the regions most affected by both the 1998 floods and Hurricane Stan in 2005
SEM 2015 176
Graph 3. Remittances received by Chiapas from January 2003 to January 2015 300
250
200
150
100
50
Ja n Ju -M l - ar 2 Ja Sep 00 n t 3 Ju M 200 l - ar 3 Se 2 Ja pt 004 n- 20 Ju M 0 l - ar 4 2 Ja Sep 00 n t 5 20 M Ju l - ar 05 Se 20 Ja pt 06 n 2 Ju -M 006 l - ar 2 Ja Sep 00 n t 7 Ju M 200 l - ar 7 Se 2 Ja pt 008 n- 20 Ju M 0 l - ar 8 2 Ja Sep 00 n t 9 Ju M 200 l - ar 9 S 2 Ja ep 01 n t 0 Ju -M 201 l - ar 0 2 Ja Sep 01 n t 1 Ju M 201 l - ar 1 Se 2 Ja pt 012 n- 20 Ju M 1 l - ar 2 2 Ja Sep 01 n t 3 Ju M 201 l - ar 3 S 2 Ja ep 01 n t2 4 -M 0 ar 14 20 18
0
Source: The Bank of Mexico
(Ruiz, 2010: 8). It is, however, important to point out that remittances have not been converted into investment or employment opportunities for Chiapas; their function has been limited to directly helping to alleviate environmental damage and extreme poverty. They have moreover contributed to social inequality, separating households that receive remittances and those that do not (Alscher, 2009). In 1998, the manufacturing industry of the north Mexican border cities of Tijuana, Mexicali and Monterrey offered employment to the victims of the floods. Companies were even willing to pay for the transportation costs of the people from Chiapas willing to migrate for work, shedding light on how around 35,000 people from Chiapas emigrated to the North to work. Since then, the transportation businesses operating from the southern Mexican border with Guatemala all the way to the United States have vastly expanded (Castro, 2005). Testimonials also support the correlation between the 1998 catastrophe and the increase in migration flows from the state of Chiapas: “Everything started right after the strong rains of 1998 stopped. These rains destroyed 200 thousand hectares of agriculture lands and caused the death of 400 people in the south of Chiapas. The Government repaired and rebuilt rural and federal roads, but their help was not enough to bring back hope to the habitants of the Soconusco region. The coffee industry crisis had already generated critical survival circumstances. So, when this tragedy happened, huge amounts of people started to leave towards the United States.” (Castro, 2005:2) According to the Migration Survey of the Northern Border of Mexico, between 1995 and 1999, the number of emigrants deported back to Chiapas by the United States increased from 6,129 to 13,372 people, while from 1999 to 2000, the number of emigrants deported back to Chiapas was 30,523 people, more than doubling the 1999 numbers (Ruiz, 2010: 8).
SEM 2015 177
ADRIANA CRUZ FELIX THE CORRELATION BETWEEN ENVIRONMENTAL DISASTERS AND MIGRATION TRENDS IN CHIAPAS, MEXICO
THE AMERICAS
In the case study report “Environmental Change and Forced Migration Scenarios” regarding the case of Chiapas and Tlaxcala states in Mexico, Alscher (2009) also supports the correlation between problems of environmental degradation and migration in Chiapas. He illustrates his argument with the example of Motozintla municipality, one of the most affected populations by the strong rains of 1998 and Hurricane Stan in 2005. Alscher states that from 2000 to 2005 the total population of Motozintla decreased by 3%, while the male population decreased by 5%. He correlates demographic decline with emigration motivated by natural disasters based on the fact that other municipalities of the state of Chiapas that were not affected by the natural disasters in 1998 and 2005, experienced regular population growth during the same period. Other municipalities that experienced a male population decrease of more than 5% were the municipalities in the Socunusco and Sierra de Chiapas regions, which, as mentioned above, were the regions most affected by Hurricane Stan (Alscher, 2009:16). Alscher’s (2009:16) case study compared statistical population information collated by the Mexican National Institute of Statistic and Geography (INEGI) from the years 2000 and 2005. Furthermore, it verified this information through 39 in-depth interviews with both emigrants and non-emigrants. The author was able to conclude that emigration was more significant among the communities that were most affected by natural disasters. The majority of people interviewed stated that their lives had been affected by environmental degradation, which had played a crucial role in their decision to emigrate. Image 4. Recovery efforts have not reached most of forestlands destroyed by Hurricane Stan in 2005.
Source. CNN Mexico (2011)
SEM 2015 178
4. THE QUESTIONNABLE EFFECTIVENESS OF THE MEXICAN GOVERNMENT’S ADAPTATION AND MITIGATION POLICY RESPONSES It has been almost 10 years since Hurricane Stan and much of the environmental and infrastructure damage that it caused has not been addressed, making the population extremely vulnerable during the annual rainfall season especially giving the increasing levels of precipitation.7 A large swathe of Chiapas’ forest lands continue to deteriorate, with the National Forest Commission stating that it prefers to “let nature do its work”. The authorities have declared that the intensity of Hurricane Stan was unexpected and that the government was not prepared to face such huge reconstruction challenges in order to repair the environmental damage suffered mainly by the Istmo-Costal, Sierra de Chiapas and Socunusco regions (CNN, 2011). The problem is that the adaptation and mitigation strategies of both the Government of Chiapas and the Mexican National Government are based on a reactive strategy, meaning that they focus on alleviating post-disaster situations instead of implementing preventive policies and developing adaptation plans to reduce the population’s vulnerability. The report “Socioeconomic Impact of Disaster in Mexico of 2013” estimated that the damages caused by hydro meteorological and natural phenomenon had cost the state of Chiapas around 156 million U.S. dollars during that year (CENAPRED, 2014), a figure that makes the 1.2 million U.S. dollars promised by the Government of Chiapas at the beginning 2015 to develop the necessary adaptation and mitigation strategies and infrastructure seem largely insufficient (ICOSO, 2015). Briones (2010) criticises the Mexican mitigation strategy due to the fact that its actions are based on future potential environmental risks instead of taking social vulnerabilities into account in the policy formulation process. To date, Mexican policies are a medium-term solution that overlook the fact that the worst consequences of natural disasters are long-term as they are caused by the increase in the social vulnerability of poor populations in the face of environmental disasters. After the 1998 floods, the Housing Project of the state of Chiapas estimated that 7,000 families needed to be relocated, but the construction of new houses was undertaken without any technical assessments and in areas that also experienced high vulnerability to landslides and floods. Another big failure of the reconstruction programme is the fact that they do not cover basic public services: houses have intermittent electricity access, bad drainage and drinking water systems, there are not enough schools available and communities are more exposed to crime and health problems (Alvarado 2011). In 2013, the Mexican National Civil Protection System declared that the post natural disaster evaluations of Hurricane Stan where not conducted accurately. They thus did not provide a clear panorama of the destruction caused in 2005, a potential explanation for the fact that there are destroyed bridges and roads that have not been repaired, and displaced families who still have not recovered their home 10 years after the disaster (Romero, 2013). Similarly, information regarding the damage caused each year by floods, landslides and other hydrological phenomena is hard to find and controlled by the Chiapas government’s media agency. In 2005 action was taken to accomplish the government’s promises to the population, houses were given to those who lost everything after Hurricane Stan, but they were poorly constructed. It is thus unsurprising that by 2008 many of the houses in the different settlements had been abandoned (Briones, 2010). The poor conception and implementation of adaptation strategies is mainly due to conflicts of interests in Chiapas that have facilitated the diversion of funds. Each
7. Data provided at the beginning in section 2.1 of this text.
SEM 2015 179
THE AMERICAS
ADRIANA CRUZ FELIX THE CORRELATION BETWEEN ENVIRONMENTAL DISASTERS AND MIGRATION TRENDS IN CHIAPAS, MEXICO
year victims of Hurricane Stan and the yearly rainfall season continue to organise public demonstrations to demand government action. Several lawsuits have been filed wtih the General Attorney Office of Mexico, but they have not proved successful (Romero, 2013). It seems that the new government administration is trying to address the situation and has undertaken reconstruction and house distribution processes. Nevertheless, it seems that the lack of integral long-term adaptation and mitigation planning persists.
CONCLUSION The different data and studies presented throughout this paper demonstrate how migration has become an individual adaptation strategy for the population most affected by environmental disasters in Chiapas. A comparison of the case of Chiapas with the conclusions provided by the 2011 Foresight “Migration and Global Environmental Changes: Future Challenges and opportunities” report, show many similarities. Firstly, it is evident that environmental events have a significant impact on the economic, social and political drivers behind migration in the region. The damage caused by the 1998 floods and Hurricane Stan in 2005 illustrates how environmental disasters influence migration movements, underlined by the correlation between increased levels of precipitation and migration movements. Secondly, recent migration trends in Chiapas show that environmental degradation may be playing a major role as a driver of migration, as reconstruction work has been poorly planned, satisfying the promises of the Chiapas government but overlooking long-term social vulnerability, and exacerbating the social and economic conditions of the already extremely at risk communities in Chiapas. Thirdly, based on the recent severe damage caused by less intense environmental events such as tropical storm Boris and other hydrological phenomena in 2014, it is clear that the impact of environmental change will increase in the future. Fourthly, the vulnerability of the Chiapas population can be directly linked to the poor socio-economic conditions in the region and the lack of targeted public policies by the government. No long-term strategies are being formulated to halt the decline of the population’s resilience, meaning that the population of Chiapas is left without assistance to confront and adapt to the impacts of meteorological disasters. This could lead to internal and international migration in the search of better opportunities. In the case of extremely poor populations, who do not possess the minimum level of income needed to migrate, the situation is particularly critical as they remain trapped in highly vulnerable areas, attempt to cope with and recover from yearly damage with their own meagre means, continuing to live with the high risk of new environmental disasters. Environmental degradation will increase its role as a main driver for internal and international migration as long as the Government of Chiapas continues to ignore the critical importance of developing mid and long-term adaptation and mitigation strategies that reduce the vulnerability experienced by the majority of chiapanecos and concretely increase their resilience capacity, moving away from immediate temporary post-disaster solutions.
SEM 2015 180
REFERENCES Articles –– Arellano, José L. 2005. Apropiación territorial, deterioro ambiental y gestión de recursos hídricos en la cuenca superior del río Custepec, Chiapas. Universidad Autónoma Chapingo. San Cristóbal de Las Casas, Chiapas. Retrived from: http://www. inecc.gob.mx/descargas/cuencas/ cong_nal_06/tema_03/18_jose_ arellanos.pdf –– Briones, F. (2010). Inundados, reubicados y olvidados: Traslado del riesgo de desastres en Motozintla, Chiapas. Revista de ingeniería. Universidad de los Andes. Bogotá, Colombia. 132-144. –– Cuevas, J. (2005). Las inundaciones en la costa de Chiapas 1998: reflexiones sobre el posdesastre. Revista de la Universidad Cristobal Colon. Mexico. 20. p.61-71 –– Ibarrarán, E., M. Rodríguez. (2007). Estudio sobre Economía del Cambio Climático en México. Instituto Nacional de Ecología y Universidad Iberoamericana Puebla. México. Retrived from: http://www.inecc.gob. mx/descargas/cclimatico/e2007h.pdf –– Parra, M., (2011). Inundaciones y Vulnerabilidad Diferencial en el Municipio de Pijijiapan, Chiapas, Mexico. Temas de Coyuntura. 61. 33-62 Reports –– Albo, A., J.L., Ordaz (2011), Migración y Cambio Climático. El caso mexicano. Servicio de Estudios Económicos del Grupo BBVA. México. 11(27). Retrieved from: https://www.bbvaresearch.com/wpcontent/uploads/migrados/WP_1127_ Mexico_tcm346-267325.pdf
–– Chiapas and Tlaxcala. Mexico Case Study Report; Environmental Change and –– Fetzek, Shiloh. 2009. Impactos relacionados con el clima en la seguridad Nacional de México y Centroamérica. Primer Informe. Instituto Real de Servicios Unidos / FUNDAECO. Gran Bretaña. –– Forced Migration Scenarios (EACHFOR). Retrived from: https://www. ehs.unu.edu/file/get/7745.pdf –– Foresight. (2011). Migration and Global Environmental Change: Final Report. The Government Office for Science. London. Retrieved from: https:// www.gov.uk/government/uploads/ system/uploads/attachment_data/ file/287717/11-1116-migration-andglobal-environmental-change.pdf –– NU. CEPAL. Subsede de México. Retrieved from: http://www. cepal.org/es/publicaciones/25801caracteristicas-e-impactosocioeconomico-de-los-huracanesstan-y-wilma-en-la Newspaper Articles –– Alvarado, I. (2011). ‘Stan’ desencadena huracan politico. Periodico El Universal. Mexico. Retrieved from: http://www.eluniversal.com.mx/ estados/81081.html –– Camacho, E., (2014). Tasas de deforestación anuales en Chiapas afectan a la biodiversidad. Sin Embargo MX. Retrieved from: http://www.sinembargo.mx/07-102014/1136539
–– Alscher, S. (2009). Environmental factors in Mexican migration: The cases of
–– CNN MEXICO. (2011). Chiapas “dejó a la naturaleza” el trabajo de la recuperación por ‘Stan’. CNN Mexico. Retrieved from: http://mexico.cnn. com/planetacnn/2011/06/09/chiapasdejo-a-la-naturaleza-el-trabajo-de-larecuperacion-por-stan
–– CENAPRED. (2006). Características e impacto socioeconómico de los huracanes Stan y Wilma en la República Mexicana en el 2005. Centro Nacional de Prevención de Desastres
–– CNN MEXICO (2014). Al menos 848 viviendas resultaron afectadas en Chiapas por las lluvias. CNN Mexico. Retrieved from: http://mexico.cnn. com/nacional/2014/09/22/al-menos848-viviendas-resultaron-afectadas-
en-chiapas-por-las-lluvias –– Excelsior. (2014). Comienzan las evacuaciones preventivas en Chiapas por lluvias. Periodico Excelsior: Temporada de Huracanes. Mexico. Retrieved from: http://www.excelsior. com.mx/nacional/2014/06/03/962994 –– Henriquez, E. (2014) Chiapas: lluvias invernales han afectado a 11 mil personas de 83 comunidades. La Jornada. Retrieved from:http://www. jornada.unam.mx/ultimas/2014/01/08/ lluvias-invernales-han-afectado-a-11mil-personas-de-83-comunidades-345. html –– Henriquez, E. (2014) Al menos siete municipios afectados por lluvias en Chiapas La Jornada. Retrieved from: http://www.jornada.unam.mx/ ultimas/2014/09/29/al-menos-sietemunicipios-afectados-por-lluvias-enchiapas-6194.html –– Informador. (2010) Chiapas recuerda la tragedia que dejó el huracán ‘‘Stan’’. Periódico El Informador, Jalisco. México. Retrieved from: http://www.informador.com.mx/ mexico/2010/238605/6/chiapasrecuerda-la-tragedia-que-dejo-elhuracan-stan.htm –– La Jornada. (2014). Chiapas: desalojan a 16 mil por Boris. Periodico La Jornada. México. Retrieved from: http:// www.jornada.unam.mx/2014/06/05/ estados/028n1est –– Lopez, N. (2014). Derrumbes e inundaciones en municipios de la zona norte. Portal oficial del Grupo Noticias Voz e Imagen de Oaxaca, Tuxtepec, Chiapas. Retrieved from: http://www.noticiasnet.mx/portal/ en/node/239268 –– Romero, G. (2013). Chiapas a 8 años del Huracán Stan. Imagen Radio. Mexico. Retrieved from: http://www. imagen.com.mx/chiapas-8-anos-delhuracan-stan Non-Governmental Organisations & Civil Associations Publications –– Castro, G. (1998). El Tiro de
SEM 2015 181
THE AMERICAS
ADRIANA CRUZ FELIX THE CORRELATION BETWEEN ENVIRONMENTAL DISASTERS AND MIGRATION TRENDS IN CHIAPAS, MEXICO
Gracia Las Inundaciones: La Peor Catástrofe Natural en Chiapas (Primer parte/II). Otros Mundos Chiapas. Retrived from: http://www. otrosmundoschiapas.org/analisis/ TIRODEGRACIANATU.pdf –– Castro, G. (2005). Las remesas de los migrantes. La migración en Chiapas; San Cristóbal de las Casas, Chiapas, México. Otros Mundos Chiapas. Retrived from: http://www. otrosmundoschiapas.org/analisis/ LAREMEAII.pdf –– Castro, G. (2010). Cambio climático: los impactos ecológicos en Chiapas. Eco Portal. Mexico: Retrieved from: http://www.ecoportal.net/ Temas_Especiales/Cambio-Climatico/ cambio_climatico_los_impactos_ ecologicos_en_chiapas –– Jungehülsing, J. (2010). Las que se van, las que se quedan: reacciones frente al cambio climático. Un Estudio de caso sobre migración y género en Chiapas. Heinrich Böll Stiftung Foundation México, Centroamérica y el Caribe. Retrived from: http://www. boell-latinoamerica.org/downloads/ MIGRACION.pdf –– SIPAZ (1998). Enfoque III: Desastre en el Sur de Chiapas. Servicio Internacional para la Paz. Retrieved from: http://www.sipaz.org/es/ informes/43-informe-sipaz-vol-iii-no4-noviembre-de-1998/82-enfoque-iiidesastre-en-el-sur-de-chiapas.html Government Publications –– CONAGUA. (2005). Resumen del Huracán Stan. Comisión Nacional del Agua. México. Retrieved from: http:// smn.cna.gob.mx/ciclones/tempo2005/ atlantico/stan.pdf –– CONEVAL. (2012) Resultados de pobreza en México 2012 a nivel nacional y por entidades federativas.
SEM 2015 182
Consejo Nacional de Evaluación de la Política de Desarrollo Social. Retrived from: http://www.coneval.gob.mx/ medicion/paginas/medici%C3%B3n/ pobreza%202012/Pobreza-2012.aspx –– CENAPRED. (2014). Impactos Socioeconomicos de los desastres en Mexico 2013. Comision Nacional para la Prevencion de Desastres. Retrieved from: http://www. cenapred.unam.mx/es/Publicaciones/ archivos/21072014Resumen_ Ejecutivo_Impacto.pdf –– Diario Oficial de la Federacion http:// biblioteca.semarnat.gob.mx/janium/ Documentos/Ciga/agenda/PPD02/ DO3301.pdf –– SNPC. (2006). Características e impacto socioeconómico de los principales desastres ocurridos en la República Mexicana en el año 2005. Sistema Nacional de Protección Civil Centro Nacional de Prevención de Desastres. México. Retrieved from: http://www.proteccioncivil.gob. mx/work/models/ProteccionCivil/ Resource/375/1/images/no_7.pdf Web Pages –– Bank de Mexico. (2015). Ingresos por remesas familiares, distribución por entidad federativa. Banco de Mexico. Mexico. Retrieved from: http:// www.banxico.org.mx/SieInternet/ consultarDirectorioInternetAction.do ?accion=consultarCuadro&idCuadro= CE100§or=1&locale=es –– CONAGUA. (2015). Temperaturas y lluvia. Comisión Nacional del Agua. México. Retrieved from: http://smn.cna.gob.mx/index. php?option=com_content&view=a rticle&id=12&Itemid=77FAO. (2015). La Agricultura y el Desarrollo Rural en México. Organizacion de las Naciones Unidas para la Alimentacion y la Agricultura. Retrived from:
https://coin.fao.org/cms/world/ mexico/InformaccionSobreElPais/ agricultura_y_des_rural.html –– ICOSO Chiapas. (2015). Insituto de Comunicación Social del Estado de Chiapas. Gobierno del Estado de Chiapas. México. Retrieved from: http://www.icosochiapas.gob. mx/2014/06/05/tras-saldo-blancopor-boris-instruye-mvc-a-iniciarreconstruccion/ –– ICOSO Chiapas. (2015) Sesiona Consejo Estatal de Protección Civil ante el paso de la onda tropical 31 y 32. Insituto de Comunicación Social del Estado de Chiapas. Gobierno del Estado de Chiapas. México. Retrieved from: http://www.icosochiapas.gob. mx/2014/09/30/sesiona-consejoestatal-de-proteccion-civil-ante-elpaso-de-la-onda-tropical-31-y-32/ –– MMP. (2015). What’s the MMP? The Mexican Migration Project. Mexico & United States. Retrieved from: http:// mmp.opr.princeton.edu/home-en. aspx Workshops –– Ruiz, L. (2010). Ponencia presentada en GURN – ITUC Workshop “Climate Change Impact on Employment and the Labour Market. Responses to the Challenges”. 25 y 26 de marzo de 2010. Bruselas. Blogs –– Narvaez, H. (2006). El ayer, a 8 años del desastre de 1998 en Chiapas. Periodistas en Linea. Mexico. Retrieved from: http://www. periodistasenlinea.org/12-092006/8779
SEM 2015 183
Europe
Photo 1. Landslide in the village of Topcic Polje, near Zenica (central Bosnia), 15 May 2014
Source: huffingtonpost.com
SEM 2015 186
ELISE HAUMONT
The May 2014 Floods in Bosnia and Herzegovina
M
ay 2014 will probably be remembered for decades in Bosnia and Herzegovina. Never in living memory had the country been struck by such a large and destructive natural disaster, as record-breaking levels of rainfall led to gigantic floods, and numerous landslides. Tens of thousands of people had to urgently flee the rising water levels, while others had to leave their homes for good as they were destroyed or buried. As is often the case when such a disaster occurs, some populations proved more vulnerable than others; in this particular case, the Roma minorities and the Internally Displaced Persons (IDPs) from the Balkan war were worse affected. The evacuation of flooded areas was not planned beforehand and proved extremely chaotic. Temporary accommodation facilities were created ad hoc in buildings that were not designed to house people. The vast majority of those evacuated and displaced sought shelter with relatives, yet there is very little information about them. International aid proved crucial in reconstruction efforts, especially for rebuilding houses and recovering livelihoods, while the Bosnian public authorities, divided among numerous administrative levels demonstrated a weak response capability.
1. AN UNPRECEDENTED NATURAL DISASTER WITH ENORMOUS DAMAGE 1.1. Extraordinary levels of rainfall lead to mass flooding and landslides
Bosnia and Herzegovina is largely a mountainous country, except for its northern part which reaches into the Pannonian basin. The Sava River, the largest in the country, forms a natural border with Croatia to the north. To the east, the Drina River follows the border with Serbia. A low-pressure area designated “Yvette” or “Tamara” affected a large area of south-eastern and central Europe. Continuous, heavy rainfall, commencing on 13 May, resulted in extensive flooding in Serbia, Bosnia and Herzegovina (BiH), and Croatia. Three months’ worth of rain fell in the space of only three days; the heaviest rainfall in BiH since records began in 1894 (ACAPS, 2014). “Given the country’s topography, a vast number of rivers descend from higher elevations and feed into the Sava downstream. This caused sudden flash floods and extended inundations in the vast lower plains, where much of the country’s food and agricultural production is concentrated. Water moved downstream and upon reaching the River Sana, which also received flows from its tributaries to the east, remained above normal levels for many weeks; this impeded the normal discharge and recession in the flooded areas” (BiH Floods – Recovery Needs Assessment, 2014). In some places, the water reached the second floor of houses.
SEM 2015 187
EUROPE
ELISE HAUMONT THE MAY 2014 FLOODS IN BOSNIA AND HERZEGOVINA: EVACUATION AND DISPLACEMENT
Figure 1. Deadly flood across souhest Europe
Source: IOM, June 2014, Overview on IOM activities, Humanitarian Situation Report Rapid field assessment carried out on 3-4 June 2014
In BiH, between 1 and 1.5 million people are estimated to have been affected (out of a total population of 3.8 million). Affected areas cover approximately one-third of the country: Tuzla canton, Sarajevo canton, Zenica-Doboj canton, Bosnia-Podrinje canton, Una-Sana canton, Brčko district, and the regions of Banja Luka, Doboj, Bijeljina, Odžak, Bosanski Šamac and Srebrenica. The most affected were Bosanski Šamac, Odžak, Orašje, Doboj, Bijeljina, Brčko, and Maglaj. Floodwaters persisted for a number of weeks across a large portion of the affected area, restricting aid access, and impeding the return of the population and the resumption of agricultural and economic activity. As such, a full inspection that would have enabled a prompt estimation of the damage, effects and needs was further complicated and delayed.
1.2. Damage, casualties and immediate threats
These floods are considered to be the most serious natural disaster in the country in the past 120 years. Houses endured various forms of damage, depending on the level that waters reached and on the solidity of the construction. Moreover, heavy rains caused over 3,000 landslides which in some areas completely covered dwellings. Data provided by the Government of BiH on 28 May 2014, account for 852 completely destroyed houses, 47,745 damaged, and 6,109 at risk of being affected by landslides (IOM, June 2014). At the UN Head of Missions meeting in September, the number of damaged housing units was estimated to be 38,000, while Reliefweb, on its page on the Balkan floods, Overview, cites 75,000 damaged houses, of which 25,000 were
SEM 2015 188
severely damaged. Naturally, electricity and communications were cut off, many roads, bridges and transport facilities rendered unusable, sanitation facilities were damaged and the water supply polluted. Livestock were severely affected as well as crops and yields. The total economic impact of the disaster is estimated to have reached 2.04 billion EUR or 15% of BiH’s GDP in 2014 (Delegation of the EU to Bosnia and Herzegovina). According to official statistics, 25 people died as a result of the disaster11. As of 19 May, it is estimated that more than one million people did not have access to drinkable water or other basic needs including food, especially for babies, clothes, medicines, and construction materials. The temperature rose to 30 degrees Celsius in the days following the disaster, and the risk of outbreaks of disease was high due to the large number of rotting animal carcasses. As this paper will explore, the extent of the damage caused by the May 2014 floods was aggravated by BiH’s civil war heritage. This 3 and a half-year conflict that ended less than 20 years ago caused around 100,000 casualties in total, and displaced over 2,2 million people. Another consequence of the civil war, constituting an additional security threat, is the fact that 70% of the flood-affected zone is landmines-contaminated (BiH Floods – Recovery Needs Assessment, 2014). Landslides and flooding caused some landmines and unexploded ordnances to move. Mine warning signs were also washed away or displaced. A mine exploded in Brčko district but nobody was injured. The issue of shifting minefields also affected the provision of assistance, since the government warned against the use of roads without prior clearance (ACAPS, 2014). Securing these affected areas will take years. Bosnian foreign minister Zlatko Lagumdzija did not hesitate to compare the damages caused by the floods to those caused by the 1992-1995 war: “The physical destruction is not less than the destruction caused by the war. […] During the war, many people lost everything. Today, again they have nothing.” A large number of Bosnians also made the comparison, as their distress revived traumatic memories from the civil war (characterised by mass bombings of towns, ethnic cleansing and mass rape), which explain why psychological support was such a priority in relief and recovery assistance programmes.
1.3. New floods in August and September hit already weakened areas
This paper will focus on the May 2014 floods and their consequences in terms of displacement because they were exceptionally huge in size. However, it is worth noting that two other episodes of heavy rainfall led to floods and landslides in the following months. In affected regions, they considerably slowed the recovery efforts and caused further damage to already weakened areas. From 5 to 8 August, heavy rainfall caused flooding and landslides in Croatia, Serbia and central and northern Bosnia and Herzegovina. The Government of the Federation of BiH, Brcko District, Banja Luka, Celinac, Kozarska Dubica, Petrovo, and Kostajnica declared a state of natural and other disasters. Some areas that were hit by the May floods were flooded again (i.e. Zenica, Topcic Polje, Zepce, Zeljezno Polje, Banja Luka, Srebrenik, Tuzla, Celic, Lukavac, Gračanica, Doboj Istok, Celinac, Bijeljina, and Brcko District). As in May, houses were submerged or buried, bridges destroyed, roads blocked and communications cut off. The worst reported situation was in the Lukavac and Gračanica regions. In the latter, several hundred people were evacuated from their homes (UN, August 2014; JUKIC, August 2014). The September rains affected neighbouring countries more than Bosnia itself. Only in Bosanske Gradiške, in the north, were houses flooded (EUROPEAN COMMISSION, September 2014).
1. Number found in main sources, but an undated IOM report cites 32 casualties...
SEM 2015 189
EUROPE
ELISE HAUMONT THE MAY 2014 FLOODS IN BOSNIA AND HERZEGOVINA: EVACUATION AND DISPLACEMENT
2. MASSIVE DISPLACEMENT FOLLOW SOCIO-ECONOMIC PATTERNS 2.1. Unreliable data
Several sources evoke “a local media, quoting government sources”2 to advance a total of 950,000 people who had to evacuate their homes at some point following the beginning of the floods (articles and reports written around 20-25 May). On 20 May, CNN cited “Bosnian officials” to give the figure of 30,000 people displaced. On the same date, abc.net cited Assistant Security Minister Samir Agic to posit 500,000 people having left their homes (GEARIN, May 2014). The needs assessment endorsed by the UN, the European Union and the World Bank cites a total of 89,981 people displaced, with 49 822 people taking refuge in either official or alternative private accommodation at the peak level of displacement. In June, IOM cautiously evoked “tens of thousands” of displaced people, among which 90% found themselves in temporary living arrangements with relatives. In an article written in September 2014, IDMC stated that “the exact number of those displaced by the floods is unknown. Those who seek shelter with families and friends have not been included in displacement estimates and the figures for those living in the temporary accommodation facilities fluctuate as family members return home.”
2.2. Belated and chaotic evacuation and rescue
What is certain is that the magnitude of the catastrophe was not envisaged by public authorities beforehand and that the population was taken by surprise. Evacuation measures began only when people were trapped on their roofs. In total, more than 40,000 people were been evacuated (IOM, undated), in some areas that were only reachable by boat or by helicopter. The BiH Armed Forces, EUFOR, NATO and the U.S. were engaged in rescuing people by helicopter over the space of several days. In Zeljezno Polje, a village in central Bosnia, around 1,000 people, including babies, pregnant women, invalids and the elderly were evacuated. Among them, the local imam stated to Reuters “I think we’ll never be able to return to our village. It has disappeared” (DJURICA, May 2014).
2.3. An emergency solution that lasted: Temporary Accommodation Facilities (TAFs)
Temporary accommodation included mostly public buildings, as shown in the following graphic. At this date, there were 55 TAFs across BiH (26 in RS, 25 in FBiH and 4 in Brcko District), hosting 1,531 people (1,125 in FBiH, 314 in RS and 92 in Brcko District) (IOM, June 2014). According to IOM, 7 TAFs faced health issues, 6 faced food issues and 6 water and sanitation issues. The latter typically arise from the use of ad-hoc temporary accommodation facilities. 60% of those in temporary accommodation were women, with around 25% children (0-17 years old) and 25% of elderly people (over 60 years old), two particularly vulnerable groups of the population. On 3 September 2014, the UN Heads of Missions Meeting stated that: “While some of the TAFs have been closed (even forcibly), others are being re-opened; a total of 1495 persons have been registered while in TAFs, with an increase of some 100 beneficiaries over the past 60 days. The number is likely to increase with the coming heating season. Situation is further exacerbated by the forced closing of collective centres located in schools due
2. Apparently Vjekoslav Bevanda, the Prime Minister, cited by Elvira Jukic in her article “Transparency Urged in Bosnia Humanitarian Aid”, 30/05/14, Balkan Insight
SEM 2015 190
Photo 2. IOM cautiously evoked “tens of thousands” of displaced people
Source: AFP
Figure 2. Rapid field assessment carried out on 3-4 June 2014 Collective Centre for Dsiplaced 3% Public building 3% Elderly home 6%
Hotel 2% Hospital 2% Shopping mail 1%
Center for people with special needs 9%
Military barracks 17%
Schools 57%
Source: IOM, June 2014, Overview on IOM activities, Humanitarian Situation Report
to the start of the school year. Situation in the Federation is particularly dire with no solution in sight for victims of landslides whose homes will need to be relocated.“ This statement is based on an Individual Needs Assessment conducted in TAFs in late August by UNHCR and the Bosnian Ministry of Human Rights and Refugees. Concerning their expectation to return home, 13% of the interviewees said
SEM 2015 191
EUROPE
ELISE HAUMONT THE MAY 2014 FLOODS IN BOSNIA AND HERZEGOVINA: EVACUATION AND DISPLACEMENT
in September 2014 that they expected to return within a month, 28% in 2-3 months and 26% in the following six months. 31% said they cwere unable return at all. 61% of damage caused to the houses of the interviewees were due to floods and 34% to landslides. 25% of the houses in question were completely destroyed, 62% partially destroyed, 9% located in zones at risk of landslides and 2% in a mine-suspected area. However, many households were increasingly ready to return. It was observed that very often, the family was hosted in TAFs while men went back to the houses to repair them and render them habitable again. Another category which was not quantified consists of people hosted by relatives but who came to TAFs to obtain food and non-food items. This study concludes that there were no significant health concerns within existing TAFs and that the supply of drinkable water, food and sanitary items was adequate. Psychological support was provided, notably by four IOM expert teams in coordination with the BiH Centre for Mental Health. It is estimated that 50% of the people hosted in TAFs needed psychological support. Finally, no security issues within TAFs, including gender-based violence, were reported. Considering the high number of public buildings transformed into TAFs to respond to the urgent need, it was crucial to find sustainable solutions for those persons whose displacement was prolonged in order to free up public buildings for their intended use. As of September 2014, some TAFs were closed without the provision of alternative accommodation for residents. While TAFs were closed, other new TAFs were opened, as households previously accommodated with friends and family were forced to find alternative accommodation (UN Heads of Missions Meeting, September 2014).
2.4. Unequal exposure to risk: Roma and conflict IDPs proved the most vulnerable 2.4.1. Roma
Roma populations constitute the largest minority in BiH. They are particularly exposed “due to their extremely vulnerable economic situation, limited employment prospects, the poor quality of construction materials used for their houses and houses located in areas not meant for solid housing construction”(BiH Floods – Recovery Needs Assessment, 2014). Some even live in makeshift homes or in the streets. Indeed, almost all of them do not have regularly paid jobs, but rather live on daily-obtained income. More often than not their activity consists of collecting secondary raw materials (IOM, June 2014). It is thus unsurprising that their traditional income generating assets were destroyed or made unavailable. The particular social status of the Roma families as well as different procedures in the local level of governance results in the fact that many of them do not receive any form of social assistance. Among those who received some kind of grant, in June 2014, some were “experiencing delays or absence in receiving the grants, while numerous Roma families affected by floods/landslides have not received a single visit from the social welfare centre responsible for the area they live in. Further, the floods/landslides have worsened the already weak health state within the Roma community. More people are now affected by various health problems, whereas those with a history of chronic illness and psychological disturbances are experiencing difficulties in receiving the necessary therapies” (IOM, June 2014). In addition, households are largely made up of a relatively high number of children and elderly people who are naturally more vulnerable. In early June, 67 Roma persons were being accommodated in temporary accommodation facilities; 25 in Vogosca and 42 in Tuzla (IOM, June 2014). Due to its experience in working with these communities and relying on a network of partner NGOs, IOM conducted interviews with 343 Roma families. “Out of those interviewed, 40% had to leave their homes and seek temporary accommodation elsewhere, while 45% of the total number of interviewed households
SEM 2015 192
had their houses completely destroyed (no longer habitable) by the flooding/landslides. Of the interviewed families 80% had experienced complete or partial destruction of their furniture and other household belongings, 11% had no time during the evacuation to take their personal IDs (which were left in the flooded area), 21% had no income whatsoever and 61% were self-employed (collection of raw secondary material, agriculture and cattle breeding). Their income generation activities were severely affected with little prospect of being renewed without assistance from a third party.” BiH Floods, 2014 – Recovery Needs Assessment, conducted by Bosnian authorities at all level, with the support of the UN, the European Union and the World Bank, from 25 May to 17 June 2014. In certain places such as Tuzla, displaced Roma preferred to install their own tents rather than use temporary accommodation facilities offered by the municipality, believing that conditions were better there, and they refused to go far from their damaged properties for fear that their remaining belongings might be stolen. This created tensions with the municipality which signalled its intention to recover the areas spontaneously occupied by Roma (TURNER, 2014).
2.4.2. Internally Displaced Persons by Conflict
Conflict IDPs were also disproportionately affected. According to IDMC, 20 years after the Dayton agreement, around 103,400 people remain displaced, with more than 7000 IDPs still living in collective centres. 10% of home and land repossession cases remain unsolved. “In the period 1999-2005, many municipalities allocated plots of land as donations in order to alleviate the pressure of housing needs for IDPs and refugees wanting to integrate locally. Furthermore, the economic vulnerability of this population forced them to buy the cheapest plots of land. In many cases, these were located in lowlands near to riverbanks prone to flooding or on hillsides that were prone to landslides. Building new housing for that population group represented a huge issue due to lack of financial resources and so many constructions were built using poor construction materials and/or minimum experience construction workers. Moreover, over 75% of all housing units built before and after the war were constructed without building permits, which means that they are not properly registered.”
BiH Floods, 2014 – Recovery Needs Assessment
2.5. Reconstruction whenever possible, relocation for thousands
Many houses will have to be relocated, either because they were destroyed by landslides or because they are located on unstable slopes. The authorities will issue declarations of inhabitability, and have to inform citizens about the risks and encourage them to rebuild in safer areas to avoid similar damage and casualties in the future. As of September 2014, the process of identifying construction companies to assist in the re-construction of the housing of those families residing in TAFs was at its final stage and the reconstruction was about to commence. Thus, assistance to returnees was prioritised in both entities, with 1,200 units targeted (UN Heads of Missions Meeting, September 2014). However, donor assistance is mainly geared towards flood victims due to the complexity and cost of landslide-related recovery: the recovery of landslide-affected homes is estimated to be 50% more expensive, on average, than repairing flood-affected houses (UN Heads of Missions Meeting, September 2014). On 30 October 2014, the EU and UNDP estimated that around 250 families (around 700 people) remained homeless, mostly in the towns of Doboj, Zenica, Tuzla, Kalesija, Zivinice and Brcko, the places worst hit by landslides (JUKIC, October 2014). As stated above, it is very common in BiH not to hold a building permit. In Tuzla, one of the most affected areas, 90% of the affected dwellings are illegal (UN Heads of
SEM 2015 193
EUROPE
ELISE HAUMONT THE MAY 2014 FLOODS IN BOSNIA AND HERZEGOVINA: EVACUATION AND DISPLACEMENT
Photo 3. Flooded area near Brcko (northern Bosnia) on 18 May 2014
Source: AFP
Missions Meeting, September 2014). And throughout the country, almost no one has property insurance, meaning that affected residents lost virtually everything. In the short term, reconstruction efforts will offset job losses, with some 5,000 jobs created in the reconstruction industry (UN Heads of Missions Meeting, September 2014).
3. DISASTER RISK MANAGEMENT AND POLICY RESPONSE 3.1. Surprisingly pronounced private solidarity proved indispensable
Solidarity among people was highlighted in press articles and witness reports. Buses and truck companies made their vehicles available for transporting aid, students organised volunteer teams for clean-up, hotel owners provided free accommodation for the displaced, households offered shelter for those in need through social media (PASIC, 2014), and even Airbnb waived charges in the affected region (KUMPARAK, 2014). People from various parts of former Yugoslavia sent clothes, food and medicine to those in need. It is particularly notable that people helped each other regardless of ethnicity in a region that was devastated by ethnic war only twenty years ago. Identity belonging played a role however, since the diaspora proved reactive in sending money from abroad.
3.2. Poor response from national and local authorities 3.2.1. Emergency response
The risk of flooding was well known. In December 2010, heavy rain had already caused the Drina River to overflow, leading to widespread flooding and landslides. Apparently, no lessons were learnt in terms of risk prevention and management,
SEM 2015 194
since the affected areas in 2010 were affected again in 2014. For example, three people died in Tuzla in 2010 following a landslide engulfing a home (IFRC, 2010), a phenomenon that reoccurred three years later with even more devastating results. Bosnia and Herzegovina’s institutional setting directly results from the Dayton agreement and is extremely complex, with multiple layers of administrative and political structuring. Under emergency circumstances, the Ministry of Security is supposed to take the lead. Civilian protection is by default under the jurisdiction of the Ministry of Justice, which thus hosted the coordination centre for assistance and rescue operations. However, BiH has multiple layers of government. In Republika Sprpska, civil defence is also a responsibility of the entity channelled through the municipalities. As for the Federation of Bosnia and Herzegovina, there is an additional level, with the extra cantonal level between the entity and the municipality. Administrative layers are thus so numerous that confusion rapidly reigned: “With 14 governments, a dozen municipalities, the two entities and the state, no one really knows who is authorized for what and who is responsible” (DIALOGUE BiH). No national state of emergency was declared, precisely to avoid parallel decisionmaking, but FBiH, RS and Brcko District declared their own state of emergency. The re-flooding of early August highlighted the continued vulnerability of local communities and the increased inadequacy of existing flood protection measures. UN Heads of Missions stated in September that “Governments must develop and deploy policies for dealing with populated areas that are at an unacceptably high risk from flooding and landslides” and regretted that “no budgetary allocation was made for dealing with this issue”. As mentioned above, several hundred people were again displaced in Gracanica region (UN, August 2014) and many more elsewhere.
3.2.2. Longer-term recovery
As for the recovery phase, in September, no national or entity recovery programme had been deployed, leading to an ad hoc and uncoordinated approach by individual agencies (international and local) (UN Heads of Missions Meeting, September 2014). Local governments were still yet to receive substantial assistance from higher levels of government, several of which were threatened with insolvency as debts were mounting. Solidarity funds were established and housing assistance was prioritised by both entity governments, but no comprehensive enterprise recovery or employment retention program was launched outside of the donor community, while damage and displacement gravely threatened the livelihoods of many households. International and local donors accounted for the bulk of assistance provided (UN Heads of Missions Meeting, September 2014). General elections were held on 12 October, with the campaign dominated by economic and social issues. The newly elected politicians did not implement new measures or programmes to recovery from the flood.
3.2.3. Some clues for explaining such inefficiency
Did the obstruction arise from the complex structure which paralysed action, or from the people who govern? The debate opposes advocates of the two positions. The present study is not the place to go into the details of Bosnian politics, but the poor response capacity of the governments seems obvious, and it is probably aggravated by limited resources. Srecko Horvat defends another thesis, arguing that neoliberal influence is to be blamed. He depicts the crisis as a “social disaster” and accuses Balkan states of privatising water management companies and their gradually diminishing investment in the construction and maintenance of dams and embankments (HORVAT, 2014. This proposition is contested by Florian Bieber, who argues that very little privatisation has in fact occurred. According to him, the lack of public investment and maintenance of infrastructure is due to ongoing reconstruction following the war, the reduced professionalism of politicians because of party appointments
SEM 2015 195
EUROPE
ELISE HAUMONT THE MAY 2014 FLOODS IN BOSNIA AND HERZEGOVINA: EVACUATION AND DISPLACEMENT
Photo 4. A man cleans mud from his home in Maglaj, BiH.
Source: Velija Hasanbegovic/Radio Sarajevo
and favouritism, and hierarchical power-structures leading to slow response in times of crisis. Indeed, there is suspicion that the money supposedly allocated for flood prevention was not correctly allocated. The Prime Minster of Republika Srpska, Zeljka Cvijanovic, recognised in late May that the damage caused by the flood, and resulting displacement, could have been lessened had everything been done by the rules: “That does not mean that the catastrophe could have been prevented but the consequences could have been reduced to a minimum” (JUKIC, June 2014). “Areas around the river Sava in northern Bosnia suffered severe flooding because the embankments were not large enough or broke during the flooding. […] A Federation Audit Office report from January 2013, which dealt with the system of flood defences, said responsibility for managing possible floods was fragmented and that institutions were uncoordinated and divided. All the activities needed to bring the system of protection into a functional state were not taken. […] From the total money collected from water taxes, only 25 per cent was used for flood protection. The [previous] water-protection facilities were destroyed in the last war and as such cannot ensure an efficient protection from flooding in endangered area. The report noted also that while the Federation entity’s cantons obtained more than 10 million euro for flood protection, they spent only 16 per cent of the money on that task.” Elvira Juvik, 3 June 2014, “Bosnia Probes Missing Flood Prevention Funds” Balkan Insight
SEM 2015 196
3.3. Prompt international emergency response3
Given the poor resources of Bosnia and Herzegovina, international aid proved crucial in both the emergency and recovery phases. The country requested immediate support from the EU, and asked the UN Resident Coordinator to take the lead in coordinating international donor efforts. International Community Coordination Meetings were held daily from 18 May onwards. Almost 40 individual countries sent relief items, rescue teams or financial aid. UN agencies provided a total of 9.7 million USD for emergency humanitarian aid and for immediate recovery support. The first UN plane with emergency equipment landed on 19 May, followed by 5 more and a series of truck convoys. The UN network of field offices enabled the provision of urgently needed assistance to some 40 affected municipalities (UN Mission in BiH). On 15 May, the EU Civil Protection Mechanism was activated, for both BiH and Serbia, which was also badly affected by flooding. Bosnia & Herzegovina notably requested helicopters and motorboats to evacuate people and to transport water, medicine and food, as well as pumps, generators, tents, humidity dryers, water purification sets, gas heaters for tents and sanitation items. 23 Member States participated, and over 800 relief workers were deployed in the two countries. In BiH alone, these teams directly rescued over 1,700 people. The European Commission co-financed the transportation of relief material and personnel, and the European Commission’s Emergency Response Coordination Centre (ERCC) was responsible for matching the incoming offers of assistance with needs on the ground. In addition, more than 80 satellite maps were produced by the Commission to support both the affected countries and those providing assistance. The EU also provided €3 million in humanitarian aid on 6 June 2014 (EC Decision ECHO/-BA/BUD/2014/01000) (for the two countries), channelled through the Red Cross – Red Crescent as well as other partner organisations (ECHO factsheet, July 2014). Kristalina Georgieva, the European Commissioner for International Coordination, Humanitarian Aid and Crisis Response, visited Sarajevo on 21 May. As BiH is not a candidate country for EU membership, it cannot apply for aid from the EU Solidarity Fund.
3.4. International multi-faceted recovery aid4
From 22 May to 1 June, four teams were deployed on the ground to conduct a rapid needs assessment, which served as a basis for the International Donors’ Conference “Rebuilding together” which was held on 16 July in Brussels. In total, BiH received €139,775,743 in grants and €670,700,000 in loans (EUROPEAN COMMISSION page on International Donors’ Conference).
3.5. The UN floods recovery programme “Danas Za Nas”
This programme, entitled “today, for us”, started on 1 July 2014 and ran until 30 June 2015. It aimed to “re-establish normal living conditions, preserve jobs, support local economies and increase disaster resilience in more than 25 communities most affected by floods” (UN BiH). This USD 14,8 million programme was financed by 16 bilateral donors and implemented by UN agencies. It targeted 8 areas for assistance: 1. Livelihood support: The Cash for work programme delivered grants to the mostaffected municipalities to enable them to quickly employ locals to clean and repair public areas and infrastructures. 2. Livelihood support: Livestock feed concentrate, greenhouses and non-financial aid to improve the value-chain production were delivered to the most vulnerable farmers.
3. For an overview of foreign aid during the humanitarian phase, see UN in BiH’s interactive map: Floods Response Map – Humanitarian phase. http://ba.one.un.org/content/unct/bosnia_and_herzegovina/en/home/what-we-do/ joint-projects/floods-recovery/floods-recovery-map0.html
SEM 2015 197
EUROPE
ELISE HAUMONT THE MAY 2014 FLOODS IN BOSNIA AND HERZEGOVINA: EVACUATION AND DISPLACEMENT
3. Water Sanitation Projects (WASH): restoring the water, sanitation and sewage facilities. 4. Rehabilitation of health centres, notably through the provision of medical equipment and vehicles. 5. Support for centres for the elderly: reconstruction, equipment and staff training. 6. Stabilisation of landslides using drainage pipes. 7. Rehabilitation of the central heating system in Doboj. 8. Support for infrastructure rehabilitation, notably concerning bridges and access roads (UN BiH).
3.5.1. The EU Floods Recovery Programme
This programme was launched on 15 August 2015 and ended on 31 October 2015, providing a total aid package of €43.52 million out of which the EU contribution was €42,24 million, with UNDP providing the remaining €1.28 million. “The Programme consists of different components all of which aim to assist with the normalization of peoples’ lives in flood-affected areas and communities in 24 most-affected municipalities. The activities focus on the immediate restoration of vital public sector infrastructure and reinstatement of key public services, the emergency reconstruction of private dwellings for the most vulnerable and marginalized people, the revitalization of local economy and agriculture production and rehabilitation of communal infrastructure in selected municipalities. […] The Programme is being implemented by the United Nations Development Programme (UNDP), the United Nations Children’s Fund (UNICEF) and the International Organisation for Migration (IOM) until October 2015” (UN BiH). The Programme aimed to rehabilitate 4,000 dwellings for approximately 14,000 people, 100 local roads and bridges, 90 educational institutions (including pre-school facilities), 10 water and sanitation facilities, three municipality buildings, four Centres for social welfare, and four healthcare facilities (EUROPEAN DELEGATION to BiH). In addition, the EU funded the retention and generation of up to 2,000 jobs in small and medium-sized enterprises (SMEs), including in the agricultural sector (UN BiH). As of September 2014, the governments were not implementing any job retention programmes, meaning that the impact of this programme will likely remain limited (UN Heads of Missions Meeting, September 2014). An Advisory Panel was established in October 2014 to maximise collaboration between the EU and domestic authorities on all levels, also serving as an information exchange forum. By April 2015, the programme had helped some 1,500 families to return to their homes.
3.5.2. Various other country-led or NGO-led projects
The UN and EU relief efforts were by far the biggest, but other country-led or NGO-led projects were also implemented. For example, the Austrian Development Agency launched a project helping agricultural producers to recover livelihood security. According to the BiH agency for statistics, around 50 percent of agricultural holdings are less than 2 ha and over 80 percent less than 5 ha. Thus, familial agriculture on small plots is widespread, and when land, crops or livestock are devastated, those households lose all sources of income. These people are the most vulnerable to environmental hazards. Through donations of seeds, seedlings, beehives, poultry and small and large cattle, this programme had assisted 2,424 agricultural producers as of April 2015 (SUNJE, 2015).
3.6. Controversy around the use of international funds
Bosnia and Herzegovina’s Prime Minister regretted in late July that many donors bypassed Bonsia’s institutions when distributing aid because they do not trust them (JUKIC, July 2014). Indeed, international assistance actors are concern with possible
SEM 2015 198
Photo 5. Landslide rehabilitation in Vares by the “Cash for Work” programme.
Source: UNDP
corruption and chose to implement projects directly by themselves. Part of the money passed through public authorities at different levels, though. Confusion lingered with regard to the availability of those funds and governments were slow to disburse them (UN Heads of Missions Meeting, September 2014).
4. CONCLUSION AND RECOMMENDATIONS The widespread severe flooding and landslides in May 2014 certainly could not have been avoided, but it was possible to anticipate their occurrence, to prepare for such an event and to limit the damage. These events starkly shed light on the fact that socially vulnerable populations were living in flood-prone zones and are less resilient to such events. Evacuation was poorly managed and longer-term consequences of displacement were not tackled effectively. The following is a list of lessons learnt and recommendations to reduce Bosnians’ exposure to disasters:
4.1. Invest in prevention and preparedness
The May 2014 floods and landslides took local authorities by surprise. This means that meteorological data were either not good enough, or that the implications of such heavy rainfall had not been accurately envisaged or taken seriously. It furthermore suggests that the Bosnian authorities were not sufficiently aware of the vulnerability of the population and did not deal with it accordingly. Of course, natural hazards cannot be avoided, but, if with the correct preparation, the damage they cause can be limited. In the case in question, disaster risk reduction measures were clearly inadequate: fragile embankments, poor water management, especially concerning transboundary waters, dwellings built in banned zones, and weak capacities for early
SEM 2015 199
EUROPE
ELISE HAUMONT THE MAY 2014 FLOODS IN BOSNIA AND HERZEGOVINA: EVACUATION AND DISPLACEMENT
warning and alarm (HUSEINBASIC, 2014). The scale of this disaster should push politicians and administrations to implement much more goal-oriented measures in the near future. Concerning evacuation and displacement more specifically, it is striking that no preventive evacuation was planned. As such, along with better meteorological forecasting, a system of alert and organisation of evacuation before floods occur is needed. This goes hand in hand with better identification of vulnerable populations, namely people who will need special help to move and people who are most endangered should such a natural disaster occur. In addition, as discussed above, many buildings were transformed into ad hoc temporary accommodation facilities but were not adapted to be used as emergency shelters. It would certainly be too costly to build dedicated centres, but existing buildings that could serve as TAFs can be identified beforehand and an assessment of their characteristics would probably lead to better orientation of the prospective evacuees and displaced populations.
4.2. Coordinate all efforts
As for the humanitarian emergency phase, Samir Huseinbasic, from the Bosnian Ministry of Security, acknowledged before the Council of Europe in June that communication and information management have to be improved, as well as interagency coordination (be it vertical or horizontal). The Bosnian political and administrative structure is extremely fragmented, and improving the way the whole system works is another debate entirely. However, knowing who is responsible for what and facilitating information sharing is a minimum requirement. Furthermore, it is essential that international and local bodies should be able to trust each other. Foreign assistance delivered by international organisations and non-governmental organisations often bypassed local authorities. The former were concerned about a lack of efficiency and the misuse of aid, notably because of fears over corruption, while the feelings of the latter were hurt. This reciprocal mistrust prevents further improvements because it maintains Bosnia’s dependence on foreign aid, and international actors are generally less connected to the realities on the ground. Closer partnerships must thus be forged, so that local government cans improve their way of functioning under international influence, progressively diminishing the need for a foreign presence in BiH.
4.3. Making courageous and future-oriented choices in the recovery phase
Quick reconstruction after the war led to poor-quality housing being built in risky areas. Rebuilding after the disaster should take this into account by making the quality of the new dwellings a priority. Building robust houses in safe places may be costly in the short term, but doing so means much greater costs can be avoided in the long run. Closely linked to this issue are the disastrous consequences of the lack of property titles and housing insurance. Here again, the incentives for implementing strict legislation are not obvious for politicians seeking to be elected, but such action protects the safety of citizens, and the fact that houses are legally recognized and properly registered, also greatly facilitated the planning of risk-reduction measures.
SEM 2015 200
REFERENCES Reports –– Assessment Capacities Project (ACAPS), 22 May 2014, Briefing Note
–– http://www.theguardian.com/ world/2014/may/18/serbia-bosniaflooding-thousands-flee-river-sava
–– JUKIC Elvira, 28 July 2014, “Bosnia Prime Minister Bemoans Donors’ Mistrust” in Balkan Insight
–– BiH Floods, 2014 – Recovery Needs Assessment, conducted by the Bosnian authorities at all levels, with the support of the UN, the European Union and the World Bank, from 25 May to 17 June 2014
–– BIEBER Florian, 28 May 2014, “What the floods reveal: consequences of a disaster” in Balkan Insight
–– http://www.balkaninsight.com/ en/article/bosnia-prime-ministerbemoans-donors-mistrust
–– http://www.balkaninsight.com/ en/blog/what-the-floods-revealconsequences-of-a-disaster
–– JUKIC Elvira, 7 August 2014, “Freak Floods Wreak More Havoc in Balkans” in Balkan Insight
–– European Commission, 11 July 2014, “Floods in Serbia and Bonsia and Herzegovina – Humanitarian Aid and Civil Protection”, ECHO factsheet
–– DJURICA Marko, 17 May 2014, “Balkan Floods Force Mass Evacuation, Bodies Pulled From Homes” in World Post, from Reuters
–– http://www.balkaninsight.com/en/ article/balkan-floods-demolishedhouses-roads-bridges
–– European Commission, 16 September 2014, Eastern Europe: Floods –– IFRC, 13 December 2010, Bosnia and Herzegovina: Floods –– IOM, June 2014, Overview on IOM activities, Humanitarian Situation Report (Not available online. Transmitted by IOM Sarajevo) –– IOM, “Humanitarian situation report”, unknown date (end of May at the latest) –– UN Heads of Missions Meeting, 3 September 2014 (Not available online. Transmitted by IOM Sarajevo) –– UN, 11 August 2014, Bosnia and Herzegovina – Flood Disaster Situation Report –– World Health Organization, 25 May 2014, Floods in the Balkans: Situation Report –– HUSEINBASIC Samir, 12-13 June 2014, « Floods 2014 in BiH – Lessons to learn », presentation at the Council of Europe, Strasbourg –– Articles –– TURNER Wesli, September 2014, « Floods cause new displacement in Bosnia and Herzegovina » in IDMC blog –– http://www.internal-displacement. org/blog/2014/floods-cause-newdisplacement-in-bosnia-andherzegovina Press articles –– AFP, 18 May 2014, “Serbia and Bosnia flooding forces thousands to flee homes” in The Guardian
–– http://www.huffingtonpost. com/2014/05/17/balkanfloods_n_5343187.html –– GEARIN Mary, 20 May 2014, “Bosnian flood devastation ‘on scale of Balkan war’, foreign minister says” in abc.net –– http://www.abc.net.au/news/2014-0520/devastating-floods-affect-quarterof-bosnian-population/5463586 –– HORVAT Srecko, 22 May 2014, « Under the surface of the Balkan floods lies a social disaster » in The Guardian –– http://www.theguardian.com/ commentisfree/2014/may/22/ balkan-floods-social-disaster-formeryugoslavia
–– JUKIC Elvira, 30 October 2014, “Hundreds Still Homeless After Bosnia Floods” in Balkan Insight –– http://www.balkaninsight.com/en/ article/hundreds-still-homeless-afterbosnia-floods –– JUKIC Elvira, 30 October 2014, “Hundreds still homeless after Bosnia floods” in Balkan Insight –– http://www.balkaninsight.com/en/ article/hundreds-still-homeless-afterbosnia-floods –– NARDELLI Alberto, DZIDIC Denis and JUKIC Elvira, 8 October 2014, “Bosnia and Herzegovina: the world’s most complicated system of government ?” in The guardian
–– KUMPARAK Greg, 22 May 2014, “Airbnb now waiving charges for those displaced by the floods in SouthEast Europe” in TechCrunch
–– http://www.theguardian.com/ news/datablog/2014/oct/08/ bosnia-herzegovina-elections-theworlds-most-complicated-system-ofgovernment
–– http://techcrunch.com/2014/05/22/ airbnb-now-waiving-charges-forthose-displaced-by-the-floods-insoutheast-europe/
–– NIKOLAIDIS Andrej, 20 May 2014, “Floods have united the people of the Balkans” in The Guardian
–– JUKIC Elvira, 30 May 2014, “Transparency Urged in Bosnia Humanitarian Aid” in Balkan Insight –– http://www.balkaninsight.com/en/ article/transparency-urged-in-bosniahumanitarian-aid –– JUKIC, 3 June 2014, “Bosnia Probes Missing Flood Prevention Funds” Balkan Insight –– http://www.balkaninsight.com/en/ article/bosnia-tackles-flood-damageresponsibility
–– http://www.theguardian.com/ commentisfree/2014/may/20/floodspeople-balkans-yugoslavia –– PASIC Lana, 20 May 2014, “After the Balkan floods: Unity and compassion” in Aljazeera.com –– http://www.aljazeera.com/indepth/ opinion/2014/05/balkan-floodsbosnia-201452073456580374.html –– SUNJE Aida, 7 April 2015, “Many families affected by last year’s floods are still in need of help” in World Vision
SEM 2015 201
EUROPE
ELISE HAUMONT THE MAY 2014 FLOODS IN BOSNIA AND HERZEGOVINA: EVACUATION AND DISPLACEMENT
–– http://www.wvi.org/bosnia-andherzegovina/article/many-familiesaffected-last-year%E2%80%99s-floodsare-still-need-help –– YAN Holly and SANTIAGO Kisa Mlela, 20 May 2014, Epic flooding in Balkans raises fears about landmines surfacing in CNN –– http://edition.cnn.com/2014/05/19/ world/europe/balkans-flooding/ index.html# Websites –– Delegation of the EU to Bosnia and Herzegovina, page on EU Floods Recovery Programme (consulted 2 May 2015) –– http://europa.ba/FloodsRecovery. aspx?lang=EN –– Dialogue BiH, page on the floods (consulted 15 April 2015) –– www.dialoguebih.net/index.php/specialreport-floods2014/ –– European Commission, page on the International Donors’ Conference (consulted 2 May 2015) –– http://ec.europa.eu/enlargement/news_ corner/floods/index_en.htm –– Reliefweb, page on Balkan floods (consulted 15 April 2015)
SEM 2015 202
–– http://reliefweb.int/disaster/ff-2014000059-srb
–– UN in BiH: Floods Response Map – Humanitarian phase (interactive)
–– UN in Bosnia and Herzegovina, page on floods recovery (consulted 2 May 2015)
–– http://ba.one.un.org/content/unct/ bosnia_and_herzegovina/en/home/ what-we-do/joint-projects/floodsrecovery/floods-recovery-map0.html
–– http://ba.one.un.org/content/unct/ bosnia_and_herzegovina/en/home/ floods-recovery.html Interviews –– Interview with Mladen Kakuca, from IOM Sarajevo, conducted by phone on 1 May 2015 –– Legal texts –– European Commission, 6 June 2015, Decision ECHO/-BA/BUD/2014/01000 Maps –– ECHO and AFP: Deadly flooding across Southeast Europe –– European Commission: 4 June 2014: Bosnia and Herzegovina – Flood situation & UCPM and bilateral assistance –– European Commission: 23 May 2014: Bosnia and Herzegovina – Flood situation & UCPM assistance –– Politheor.net: Bosnia and Herzegovina’s administrative structure
–– UN in BiH: Floods Recovery Map (interactive) –– http://ba.one.un.org/content/unct/ bosnia_and_herzegovina/en/home/ what-we-do/joint-projects/floodsrecovery/floods-recovery-map.html Acknowledgements –– I am very grateful for the help of Mladen Kakuca, from IOM Sarajevo, who provided me with crucial documents for my study, especially regarding the analysis of displacement patterns. Despite being very busy and frequently on the move, he also kindly agreed to answer some questions over the phone. Many thanks also to Daria Mokhnacheva, from the Migration, Environment and Climate Change Division at IOM, who facilitated the contact.
MOLLY O’HARA
2014 Winter Olympics in Sochi: An Environmental and Human-Rights Disaster
T
ypically when we think of environmental migration, what comes to mind is the forced displacement of a certain population as a result of a natural disaster, such as a hurricane, earthquake, etc. However, with the term ‘environmental migration’ itself constituting a fairly new kind of migration categorization, the parameters are not entirely fixed. While migration in the wake of natural disasters is perhaps the most explicit form of environmental migration, forced displacement can also be a result of slow onset climate change, such as sea-level rise or drought. In addition, although political, social and economic factors already make it difficult enough to assess traditional migration, the situation is further complicated when climate change and environmental factors enter the equation. As research in this field continues to grow, this paper seeks to shed light on yet another facet of environmental migration. In addition to natural disasters and slow onset climate change, migration can result from anthropogenic impacts or, in other words, human interference. Therefore, let us draw our attention towards one event in particular that has a history of creating situations of environmental degradation and forced displacement, namely the Olympics. Ever since the environmental destruction that took place during the 1992 Albertville Winter Olympic Games, awareness has grown concerning the environmental degradation that can result from construction and preparation of such ‘megaevents’. Subsequently, in 1994, the issue of environmental influence was presented for the first time at the XII Olympic Congress in Paris, followed by the International Olympics Committee (IOC) recognizing environmental protection as it became officially included in the general principles of the Olympic Charter (Popelarova and Janiga 2008). As a result, the IOC Sport and Environment Commission was created in 1995, and the concept of sustainable event management was born. According to the Official Website of the Olympic Movement (2015), “The IOC has acknowledged its particular responsibility in terms of promoting sustainable development, and regards the environment as the third dimension of Olympism, alongside sport and culture.” However, if the results from the most recent 2014 Winter Olympics in Sochi are any indication of how successful this Commission on the environment can be, the future for ecosystems, biodiversity and local populations affected by the Olympics does not look so bright. This report will analyse the 2014 Sochi Olympics in order to discern the environmental damage and forced displacement that have occurred and to offer a more transparent picture of what has actually taken place than what the Russian government has been willing to disclose. Not only has preparation for these Olympics directly forced families to relocate, but the environmental destruction itself has also affected the living situation among the local population. Furthermore, when other political, social and economic factors are taken into account, from corruption to poverty, the gravity of the situation becomes even more apparent. However, since the Olympic Games are unlikely to be postponed or cancelled in the near future, understanding the complexities of such situations will be crucial in preventing their reoccurrence in future mega-events.
SEM 2015 203
EUROPE
MOLLY O’HARA 2014 WINTER OLYMPICS IN SOCHI: AN ENVIRONMENTAL AND HUMAN-RIGHTS DISASTER
Following the introduction and methodology, the first section of this report will analyse the background of the Sochi Winter Olympics, starting with the steps to elect Sochi as the host city, followed by a discussion of the environmental impacts during and post preparation for the event. The second section will examine the forced displacement that took place from evictions imposed by the government, as well as assess the situation for the population that was trapped and unable to relocate. The third section will evaluate the various responses from the Russian government, organisations and local populations in order to more thoroughly tackle issues related to political, social and economic factors. Finally, the report will conclude with a brief recap of the situation in Sochi, followed by a suggestion for how similar issues should be dealt with in upcoming mega-events.
1. BACKGROUND 1.1 Sochi’s Winter Olympic Bid
On July 4, 2007, Sochi was announced as the host city for the 2014 Winter Olympics. This was the result of the IOC’s two-year preparation process that assesses each city’s capacity to host the Games in a transparent process (Official Website of the Olympic Movement 2015). In 1994, Sochi officially bid to host the 2002 Winter Olympics but was ultimately rejected for economic reasons. The situation changed, however, when Russia experienced economic growth during Vladimir Putin’s presidency from 2000 onwards, and to the possibility of transforming Sochi into a world-class ski resort became much more feasible (Gazaryan and Shevchenko 2014). Following Putin’s accession to the Presidency, a series of events took place: in 2003, the Russian state gas company, Gazprom, began construction in the Sochi National Park to develop their own ski resort; in 2005, the Gornaya Carousel began development in Sochi National Park without an environmental impact assessment; in February 2006, the Russian government ordered a change in the functional zoning of the Sochi National Park; in 2006, the coerced seizure of land and property from inhabitants began; and, in January 2007, a road to the Pslukh ranger station in the Caucasus reserve began illegal construction. Finally, in July 2007, Sochi won the bid, despite 47 Russian environmental organisations appealing to the IOC to avoid inflicting irreversible damage by not choosing Sochi. This was the first time a host city was chosen that had none of the venues completed (Gazaryan and Shevchenko 2014).
1.2. Reactions
As previously mentioned, 47 Russian environmental organisations pleaded with the IOC to not choose Sochi as the host city since all Olympic venues were planned on valuable protected natural territories. Consequently, once Sochi was officially chosen, the IOC had to make numerous statements to justify its choice (Gazaryan and Shevchenko 2014). At this point, it was already becoming clear that this project would face considerable challenges and fervent opposition. Furthermore, today it is widelt recognised that the 2014 Winter Olympics in Sochi have been the most expensive Games in history. According to the Environmental Watch on North Caucasus (EWNC), “It was clear that no amounts of money would be spared for the project” (Gazaryan and Shevchenko 2014). With a bill totalling around $51 billion, some may wonder why so much money went into these particular Games. According to The Economist (2014), “[Vladimir Putin] spends much of his time at his Sochi residence and intends the games to be seen as proof of his mastery over nature and a symbol of his international legitimacy.” As Figures 1 and 2 illustrate, Russia’s Olympics were anything but cheap, costing more than twice as much as the Winter Games held in Nagano in 1998 (Business Insider 2014).
SEM 2015 204
Figure 1. Cost of Past Olympic Games 7.69
Seoul 1988
8.33
Vancouver 2010
13.98
London 2012
15.4
Barcelona 1992
17.59
Nagano 1998
Athens 2014
18.22 42.58
Beijin 2008
49.96
Sochi 2014 0
Cost in Billion (USD)
10
20
30
40
50
60
Source: Business Insider, 2014
Figure 2. Cost of Olympic Venues in Sochi
Source: Vanity Fair, 2014
Given that Sochi is the warmest part in Russia, the fact that it is located in a war zone in the Northern Caucasus, and it is known for attracting shady visitors and organised crime, the cost was always expected to be significant simply in order to make the necessary arrangements. According to Russian opinion polls, nearly 50% of Russians believe that the main reason for these exorbitant costs is political
SEM 2015 205
EUROPE
MOLLY O’HARA 2014 WINTER OLYMPICS IN SOCHI: AN ENVIRONMENTAL AND HUMAN-RIGHTS DISASTER
corruption, whereas 15% believe that the cost was genuinely due to the complexity of the project. Furthermore, an opinion poll by the Levada Center, an independent, Russian polling and research organisation, found that 38% of Russians feel that the real goal behind hosting the Winter Olympics in Sochi was to dispense state funds since less than 25% of the Russian population has felt any of the benefits (The Economist 2014). However, another poll by The Associated Press and NORC Center of Public Affairs Research (2015) found that 78% of Russians think the Olympics had a positive effect on Russia’s international image, and 51% reported that it had a positive economic effect. Having established the background into the context of the Sochi Winter Olympics, this study will seek to further understand the state of the environment as plans for the mega-event progressed.
1.3. Environmental Assessment 1.3.1. Zero Waste
When Sochi was chosen as the host city, the Russian government was well-aware of the Zero Waste standard imposed by the IOC, which uses the three “R’s” – reduce, reuse and recycle – to determine the Olympic city’s waste management policy. Although the Sochi 2014 Organizing Committee boasts on their website of having turned Sochi into a ‘city without landfills,’ the EWNC has questioned those cited figures, as well as Russian officials’ ability to understand the fundamental principles of the Zero Waste policy in the first place (Gazaryan and Shevchenko 2014). This report will provide evidence that this policy was, in fact, disregarded and has ultimately been a complete failure.
1.3.2. More Detailed Timeline
The first section of this study provided a brief timeline of events that took place leading up to the Sochi bid for the 2014 Games, which illustrated multiple activities that were undertaken without proper environmental assessment reports. The present section will explore these events more carefully and bring to light other environmentally damaging, sometimes illegal, activities that were supported by the government. The city of Sochi, which has a population of 400,000 people, is situated in the region of Krasnodar, the third largest in Russia. As illustrated in Figures 2 and 3, the Games were split into a coastal cluster and a mountain cluster in the Krasnaya Polyana Mountains. The first cluster, which consisted of all the ice venues, was built in the Imeretinskaya Valley along the coast of the Black Sea, whereas the second cluster, which was home to the skiing and sliding sports, was located in a compact area with only about 4 kilometres between the venues and the mountain village (Official Website of the Olympic Movement, 2015). The series of choices that represent the ongoing pattern of environmental neglect began in 2003 when the Prime Minister signed a Government Decree allowing valuable wilderness and lake areas in the Sochi National Park to be rented out for the construction of the sports resort and downhill ski projects. At the same time, plans were made for completing the reconstruction of an existing road from Adler to Krasnaya Polyana and bringing gas to the mountain village. Subsequently, Gazprom became the first beneficiary of the decree, and they began the construction for their ski resort before obtaining a completed environmental impact assessment. Despite the fact that the resort illegally encroached on the territory of the Caucasian State Biosphere Reserve, federal authorities never stepped in. Furthermore, regarding the gas line to Krasnaya Polyana, Gazprom used threats to pressure authorities to provide a positive environmental impact assessment and did not even bother waiting for necessary construction paperwork before destroying a protected area, a natural monument known as Kudepstinsky Canyon and about 2,000 protected box trees (Gazaryan and Shevchenko 2014).
SEM 2015 206
Figure 3. Location of the venues for the 2014 Winter Olympics in Sochi
Source: ABC, 2015
In 2004, another major player entered the picture named Vladimir Potanin, who announced plans to build the Rosa Khutor ski resort, adding that construction would require very little excavation and zero logging. However, as we see in Figure 4, this promise could not be kept due to the fact that the territory of the resort was actually covered in forest (Gazaryan and Shevchenko 2014). Photo 1. Clearing of Aibga for the Rosa Khutor Ski Resort
Source: Gazaryan and Shevchenko 2014
Still in the early stages of planning, the Sochi authorities created a plan in 2005 to develop the mountain-sea complex, 84% of which would fall within the Sochi Natural Park and Sochi State Natural Reserve. This project would include new ski complexes near the Krasnaya Polyana and Aibga villages, recreational facilities in the lower area of Sochi’s Adler district, resort construction in the Imeretinskaya lowland and infrastructure development. About a year later, the Russian government changed the zoning plan of the Sochi National Park so that area previously under strict protection
SEM 2015 207
EUROPE
MOLLY O’HARA 2014 WINTER OLYMPICS IN SOCHI: AN ENVIRONMENTAL AND HUMAN-RIGHTS DISASTER
became available for Olympic preparation. In the image below, all of the zones in yellow were released from strict protection. Consequently, since they were entirely removed from the strictly restricted zone and subject to Gazprom construction, the virgin forests on the Psekhako ridge made up the most environmentally sensitive site (Gazaryan and Shevchenko 2014). Subsequently, the Russian government continued to plan the construction of resorts and venues in environmentally susceptible areas and approved these plans without first obtaining the necessary environmental impact assessments, which constitutes illegal behaviour. In addition, a large portion of the social infrastructure that was planned, including an illegal road, was located in the Caucasus and Caucasian reserves. Moreover, the combined railroad and highway that would link the coastal and mountain clusters became the largest and most expensive Olympic site, totalling around $9 billion (West 2014). Its construction began without a positive conclusion from the environmental impact assessment and, thus, led to the following results: the road violated environmental legislation; it led to illegal deforestation; 1.5 million tons of gravel were illegally seized from the Mzymta River, leading to the degradation of the natural landscape and risk of floods and erosion; it contaminated the river with chemicals such as arsenic; and, lastly, it led to illegal soil dumping, which resulted in irreparable damage to aquifers and the disappearance of water from the Akhshtyr wells (Gazaryan and Shevchenko 2014).
1.3.3. Coastal Cluster
First, since the subtropical, Imeretinskaya lowland of the Northern Caucasus Black Sea was home to approximately 200 bird species, scientists attempted to develop a Natural Park conservation project in 2004. Instead, with Olympic construction in mind, officials promised to conserve the lakes and habitats of protected bird and plant species, as well as to construct an Ornithological Park. However, when construction for this park began in 2009, there was no room for the promised 300-hectare park due to the fact that the lowlands had already been allocated for construction and lakes had already been filled. As a result, the park was reallocated to storm drainage ponds, Northern wetlands and, most absurdly, abandoned farmland that was not even located within the borders of the Imeretinskaya lowland. Furthermore, although some of the area around the drainage ponds could have still become stopovers for migratory birds, the land that was allocated for the Ornithological Park was also used for an amusement park. Other promised compensation measures were also unfulfilled, such as the planting of 13,000 arboreal specimens and 28,000 bushes, given that these areas of the lowlands had been already destroyed (Gazaryan and Shevchenko 2014).
1.3.4. Mountain Cluster
Within the mountain cluster, the area targeted for construction consisted of the Sochi National Park and the Caucasian State Biosphere Reserve, which together make up the largest protected area in the Caucasus. Results of the construction include the 60 square kilometres of Caucasian Reserve that were estimated to have suffered from fragmentation, the confirmed destruction of rare species due to the main road that was built to the Rosa Khutor resort and committed acts of deforestation for natural habitats of wild plant species. In addition, although the 2014 Sochi Organizing Committee claims that 1.1 million trees were planted in Sochi, the EWNC Environmental Assessment found that the actual number of trees planted is closer to 200,000. Additionally, while large mammals, amphibians and reptiles were all negatively affected, it was the brown bear population that was most intensely impacted, given that it has seemingly disappeared altogether from the Sochi National Park area since 2013 (Gazaryan and Shevchenko 2014). Finally, it is important to note the impact that the construction and deforestation had on rivers and geological processes. Results from monitoring the Achipse,
SEM 2015 208
Laura and Mzymta Rivers have shown that pollution has led to complete fish loss, erosion and mudslides. Geologists also warned ski resorts of potentially hazardous geological processes, such as erosion, landslides, mudslides and landslips, as seen in Figure 6. Furthermore, reports have concluded that such exogenous geological processes are not the result of natural factors but, rather, have resulted directly from cutting slopes, reconstructing motorways and building service lines. Unfortunately, instead of diminishing with time, the number of hazardous geological developments continues to grow (Gazaryan and Shevchenko 2014). Photo 2. Ecological Effects
Source: Radio Free Europe Radio Liberty, 2014
2. MIGRATION 2.1. Forced Displacement by the Government
The following section of this report will begin an assessment of the families that were displaced during and after preparation for the 2014 Olympics. Unfortunately, forced displacement is not necessarily unusual for the Olympics, given that around 1.5 million people were moved during the 2008 Beijing Games, many against their will (Golubkova and Akin 2012). As we have already seen, some of the first reports of the coerced seizure of land and property from Sochi locals took place in 2006, once it had been decided that the land that had already been allocated for construction was insufficient (Gazaryan and Shevchenko 2014). Consequently, under legislation known as Law 301, the government had the right to seize and demolish privately owned land and buildings for the Olympics (Loiko 2014). This section seeks to provide more detail into the process by which Sochi residents were displaced, compensated and treated by the Russian government.
2.1.1. Examples from Sochi families
In order to better understand the types of situations Sochi locals found themselves in, we will look more closely into several stories from families who have been forcefully evicted, as they speak for many. To begin with, Human Rights Watch (HRW) (2012) defines forced eviction as follows:
SEM 2015 209
EUROPE
MOLLY O’HARA 2014 WINTER OLYMPICS IN SOCHI: AN ENVIRONMENTAL AND HUMAN-RIGHTS DISASTER
“Forced eviction, or the coerced or involuntary displacement of individuals from homes or lands that they occupy or depend on, without provision of and access to appropriate forms of legal or other protection as well as provision of reasonable compensation, is a serious violation of international law.” HRW (2015) has concluded that approximately 2,000 families have been evicted from their homes due to preparation for the Olympic venues and infrastructure. Furthermore, fair compensation was not provided for many families, while some families did not receive any compensation at all. The following two examples recount the stories of 63-year-old Nina Toromonyan and a 42-year-old real estate developer named Angela Zilberg. To begin with, Toromonyan and her 13 family members were thrown out of their home to make way for the Games. When officers arrived, armed and wearing black masks, they dragged Toromonyan’s older sister by the hair, attacked her husband for interfering and terrified the children into believing they would be killed. Despite Toromonyan’s legal proof of land-ownership since 1970, officials and judges concluded that Law 301 applied in this case and that her house and land were, in fact, interfering with the new highway. Of course, officials asserted that residents were offered either fair compensations or other housing. Yet, the three families that make up the Toromonyan clan could not even buy a house with the $152,000 in compensation, so they have been renting cheap apartments in Sochi. Nevertheless, Toromonyan still returns to the ruins of her old home every day to feed her family’s dogs and cats that are still there (Loiko 2014). Photo 3. Nina Toromonyan crying in the remains of her home
Source: Loiko, 2014
Similarly, when Zilberg found out that her two apartments in central Sochi were somehow in the way of the Olympics, she made the mistake of thinking she could challenge the ruling. Although the apartments were built in 2010 and were home to
SEM 2015 210
more than two-dozen families, officials claimed that they violated the building code. When the police and demolition teams arrived, they threw as much furniture as they could out into the pouring rain without even waiting for the conclusion of the appeal period. Moreover, when Zilberg met with the judge, he confessed to her that he would have been ‘rolled into concrete and asphalt’ if he had ruled in her favour. Zilberg later discovered that documents used against her in court were falsified, and neither she nor her tenants ever received compensation. Moreover, Zilberg was fined $100,000 per house for demolition, but she refused to pay (Loiko 2014). The third example involves Sergei Khlistov, who learned on September 14, 2012 that his home of 16 years in the Adler region of Sochi would be demolished for the construction of Olympic infrastructure. Furthermore, the Sochi administration sued the family on claims that the land and home were illegally used and refused to recognise the evidence proving otherwise, even though the regional prosecutor’s office did not agree. Because the court repeatedly failed to inform Khlistov about his hearings, he went back and forth with appeals for about a year until the court finally decided to move forward with the demolition. As a result, Khlistov and his wife, daughter, son-in-law and two grandchildren were evicted from the house and forced to watch as it was demolished. The family did not receive any compensation whatsoever (Human Rights Watch 2012). Although these stories hold true for approximately 2,000 families, not everyone is displeased with their forced evictions. In fact, some consider their situation to have improved thanks to the Olympics. The final example introduces Viktor Altunyan, an employee in the Sochi department of culture, who was forced out of his small house that he built himself and had lived in for fifteen years. However, he claims that the new village to which he moved with his mother, wife and young child was more than twice the size of his old house and better in terms of location, utilities, electricity and water (Golubkova and Akin 2012). According to Altunyan, “The president’s words came true for me…It’s only positive” (Golubkova and Akin 2012).
2.1.2. Government housing
The next section will examine in greater detail the villages provided by the government in greater detail in order to assess how fair they really are. Evidently, the Russian government defends its actions on the grounds that the residents subjected to forced evictions were offered either fair compensation or appropriate housing (West 2014). However, according to the article by Angus West (2014), “HRW also found that those who did receive new houses, in some instances, were relocated to buildings that lacked proper heating and had structural problems.” As a result, one might begin to wonder which reality is true: the reality for Altunyan, who could not be more pleased with his new housing, or the reality observed by HRW, in which living conditions in the new buildings were/are simply insufficient. In all probability both realities exist. While this is good news for those who are truly content with the outcome of these forced displacements, we must now turn our attention towards the other reality. According to Nils Bøhmer (2015), managing director and nuclear scientist at the Bellona Foundation, squatters currently occupy the majority of the new houses that were built for the displaced Sochi locals. For example, the villa community in Veseloye-Psou in the Adler district is made up of 79 houses, yet only 20 are occupied. The houses have never been guarded since construction work was finished in 2011, so they have been regularly plundered. Furthermore, the administration continues to claim that there is no vacant housing in the city (English Russia 2015). Above are a series of images from these ‘new,’ ‘non-vacant’ houses. One can only assume that the government did not intend for such conditions to befall these homes when they were originally built. However, as Bøhmer (2015) suggests, the reality for many evicted locals is to either accept living in an unsecure, looted area, as the photos portray, or to move somewhere else.
SEM 2015 211
EUROPE
MOLLY O’HARA 2014 WINTER OLYMPICS IN SOCHI: AN ENVIRONMENTAL AND HUMAN-RIGHTS DISASTER
When the Savelyev family, comprising Alexey and his wife Natalya, their two children and his mother Lyudmila, were evicted from their home due to construction on the new highway, they were denied adequate compensation. For the family of five, they were offered a temporary two-bedroom apartment with a shared kitchen. As compensation, they accepted a plot of land where they planned to eventually build another house. However, although Alexey owns a construction firm and has built a handful of schools in Sochi, officials refused to provide the family with a plot in Sochi. Even after 72 court appearances in the past four years, the family still does not know where they will be living in the future (West 2014). Photos 4-7. Villa Community in Veseloye-Psou
Source: English Russia, 2015
Another facet of this situation is the question of priority. In Russia, welfare benefits like monetary payments and land first go to those in the government, followed by the military and families with at least three children. After losing their home and their land, Alexey and Natalya were told by the mayor that if they had wanted to be given land, they should have had a third child (West 2014). Furthermore, according to Natalya, “We wanted to take our children to the mayor, but he told us, ‘don’t bother, it leaves me cold. Your children leave me cold’” (West 2014). Unfortunately, no matter how many similar stories arise, the evicted families in Sochi have not seen, and most likely will not see, their situation improve, especially not thanks to the government.
2.2. Trapped Population
Although HRW has suggested that around 2,000 families were displaced, it is uncertain whether this approximation only takes into account the families that were
SEM 2015 212
directly evicted by the government or if it includes all displacements, including those that occurred indirectly, such as from environmental damage. Nonetheless, what we know for certain is that this number most likely does not include families whose living conditions were negatively impacted by the Games, or even destroyed, yet have nowhere else to go. This group can be referred to as ‘trapped’ individuals or families.
2.2.1. Runaway Homes
The following section will examine the cases of families that became trapped as a result of environmental disruptions and damages caused by preparation for the Olympics. Many of the following cases will demonstrate why the trapped population would have preferred forced evictions to the helpless conditions in which they have found themselves.Due to the economic situation of the Sochi locals, unless the government had offered compensation or other housing, moving was not an option for those whose living conditions deteriorated as a result of the changes inflicted on the environment. As discussed above, environmental degradation from preparation for the Olympics includes biodiversity loss, deforestation, exogenous geological processes and pollution. For the Abzhan family, such forms of degradation became their reality when their home started to fall apart due to a landslide that was triggered by illegal dumping on a slope above their street (see Figure 12 below). Additionally, although the family was entitled to compensation through a court ruling, the compensation never arrived (Radio Free Europe Radio Liberty 2014). According to Abzhan, “There should be some future ahead, but the fact is we – local residents who were born here and grew up here – have effectively been left homeless” (Radio Free Europe Radio Liberty 2014). Next door to Abzhan lives an 85-year old woman named Polina Kalayzhan, whose home is slowly sliding down a hill. Although she shares her home with her 89-year old husband and 8 other relatives, Kalayzhan has been unable to obtain the compensation she has been promised. Despite writing to the President, Prime Minister and administration, all decisions remain in the hands of local authorities, a state of affairs that has left her feeling completely powerless (Radio Free Europe Radio Liberty 2014).
2.2.2. The Highway that Cost More than the Entire Vancouver Winter Olympics
Another major cause of ecological degradation has been the famous $9 billion, 50-kilometer combined railroad and highway, cited above due to the fact that it was the cause of many forced evictions. In addition, construction work around the highway has created a thick cement dust that has reached the nearby village of Akhshtyr. As a result, farming has been disturbed to such an extent that residents have been unable to sell their home-grown persimmons (Radio Free Europe Radio Liberty 2014). According to HRW (2015), “Many resettled residents lost a portion of their livelihoods because they depended on agriculture or income from seasonal rentals in their seaside homes.” Consequently, a similar phenomenon can be observed – the only difference being that, in the village of Akhshtyr, this phenomenon is happening among trapped, rather than resettled, residents. Furthermore, locals in the Akhshtyr village have lost access to public transportation to the Adler district of Sochi because authorities failed on their promise to build an access road to the new, expensive highway (Radio Free Europe Radio Liberty 2014). As stated by Alec Luhn (2014), “…Russian Railways had…built only a twisting footpath surrounded by barbed-wire fences and a crosswalk that Human Rights Watch has called unsafe.” Without a road out of the city, residents have become burdened with many concerns. For example, 65- year old Viktor Kolenin worries about how he will get to the hospital if need be, given that he was disabled from the Chernobyl nuclear disaster and now has a stain on his lungs from the construction dust. Kolenin is especially angered by the fact that his village, which used to be the cleanest in the
SEM 2015 213
EUROPE
MOLLY O’HARA 2014 WINTER OLYMPICS IN SOCHI: AN ENVIRONMENTAL AND HUMAN-RIGHTS DISASTER
Adler region, has been turned into a garbage dump. Additionally, 53-year old Yelena Runovich worries about how she will support her family since she had to quit her job in order to walk her young daughter through construction sites and across two highways simply to get home from school (Radio Free Europe Radio Liberty 2014). Photo 8. Dmitry Abzhan’s Family Home
Source: Radio Free Europe Radio Liberty, 2014
Photo 9. Mr. and Mrs. Kalayzhan
Source: Radio Free Europe Radio Liberty, 2014
Finally, the highway construction has caused extended electricity cuts within the regions of Sochi and interrupted the water supply to many villages. Concerning the electricity shortages, one resident wrote in her blog that the moon in Sochi has taken on a new significance ever since it became the main source of light in many villages. Residents claim that, for two months, local authorities have turned off electricity for twelve hours or more – sometimes even for two days (Radio Free Europe Radio Liberty 2014). In terms of water supply, as discussed above, illegal dumping and unsustainable construction have caused serious damage to aquifers, and this study will now examine how this damage has affected Sochi locals.
SEM 2015 214
Since most of the noticeable damage to wells and water supplies has been reported in the village of Akhshtyr, this village will serve as the point of reference to assess the situation more closely. In 2009, it was reported that Akhshtyr had already been without water for a year due to Olympics-related construction. As a result, the village depended on five remote, public wells that ran through the village for their water supply. However, construction on the combined railroad and highway caused four out of the five wells to be completely covered, while pollution, runoff and dirt from traffic rendered the fifth one unsafe. For months, the local population was without any kind of water supply (Human Rights Watch 2009). According to Bøhmer (2015), since the authorities failed to settle the problems with drinking water, people had to buy drinking water and transport it by car. Accordingly, when the locals in Akhshtyr were finally able to procure a truck, each resident was limited to 200 litres per week (Human Rights Watch 2009).
3. OTHER FACTORS The environmental damage, forced evictions and trapped populations caused by the Sochi Olympics have been exacerbated by political, social and economic factors. The next section, explore these three factors in greater detail and study the way in which they have impacted the case of environmental migration in Sochi.
3.1. Political Factors
As the previous examples have suggested, Sochi residents have been the victims of political corruption, a lack of transparency and outright injustice. The Russian government’s attitude to even the most protected, valuable parts of the environment, has proved just as deplorable. According to the report by the EWNC, “Under the pretext of realization of this ‘national project,’ lawmakers amended numerous laws that now allow practically any type of construction in a national park” (Gazaryan and Shevchenko 2014). While this statement specifically refers to the fact that the Russian government altered the zoning of the Sochi National Park in order to continue construction, it also alludes to the idea that, in the name of a ‘national project,’ laws do not have to be binding. Through illegal actions, such as undergoing construction without the legal paperwork, the government has repeatedly abused its power by using coercive measures to obtain cooperation. As Bøhmer points out (2015), a technical difference between a national park and a national reserve is that, in a national park, the government can do whatever it wants. He also suggests that the problem is not just that the government has relaxed controls over nature but that it is still doing so by cutting down natural forests to expand downhill slopes in the mountains (Bøhmer 2015). In addition, the system of compensation and forced evictions lacks transparency and is blighted by corruption. Concerning the example of Mrs Toromonyan, although her home was demolished after it was considered to be in the way of the new highway, one may wonder why her home was singled out, given that the two houses on either side of hers were not demolished nor even considered to be in the way (Loika 2014). Other non-transparencies by the local courts include their blatant disregard of official papers, the falsification of certain documents and the failure to disclose pertinent information, such as when a person’s court hearing will take place. The government is also guilty of unjust treatment towards its migrant workers. When HRW interviewed many of these migrant workers, the organisation found that the living situation was anything but sufficient. According to an HRW report (2013), “In all cases, housing and meals were provided to workers as a component of compensation… Often several dozen workers were living in one single-family house with one bathroom or outhouse.” Despite the government’s obligation under both
SEM 2015 215
EUROPE
MOLLY O’HARA 2014 WINTER OLYMPICS IN SOCHI: AN ENVIRONMENTAL AND HUMAN-RIGHTS DISASTER
national and international law to protect all workers from abuse, these obligations have been simply ignored (Human Rights Watch 2013). As Bøhmer (2015) points out, while the government has refused to make any policy changes, organisations’ scope for assistance is also limited in that, any attempts on their part to fix anything will lead to them being labelled enemies of the state. In some cases, migrant workers never received their wages at all. For example, when one private construction company was mysteriously liquidated and the man posing as general director disappeared, a total of 108 workers were deprived of their wages. One man so desperate for his wages even sewed his mouth shut in an act of protest (Radio Free Europe Radio Liberty 2014).
3.2. Social Factors
From deporting foreign migrant workers to imprisoning activists, the social situation in Sochi around the time of the 2014 Olympics was not especially positive. Sometimes, in addition to not being paid, foreign migrant workers were deported after completing their jobs, despite having legal working papers. As a result, thousands of migrants were detained in police stations and deported, while many others went into hiding or fled the country in order to avoid the risk of being caught (Radio Free Europe Radio Liberty 2014). In addition, the possibility of being harassed, beaten, or even arrested has become quite commonplace for anyone speaking out against what was taking place in Sochi; and activists, in particular, became targets. For instance, the leader of the EWNC, Andrei Rudomakha, was detained on his way to Sochi and prohibited from leaving the Krasnodar region because, a year earlier, he was quoted criticizing a judicial decision. Alexander Valov, the editor of a blog that features local activists, was also targeted and charged with fifty hours of corrective labour for allegedly planning a protest that never actually happened. The EWNC geologist, Yevgeny Vitishko, was accused of vandalism during a protest and convicted with a three-year suspended sentence (Luhn 2014). Photo 10. Nadya Tolokonnikova whipped and thrown to the ground by militiamen
Source: Bellona, 2014
During the same protest as a result of which Vitishko was arrested, – a protest that exposed an illegally built mansion in the Sochi National Park – Suren Gazaryan became a suspect of attempted murder and was forced to flee the country in 2012 and seek political asylum in Estonia. Gazaryan was not only an EWNC zoologist but also a co-author of the EWNC environmental assessment frequently cited in this report. For years, Gazaryan worked tirelessly with his colleagues to expose the political
SEM 2015 216
corruption, environmental devastation and human rights violations by the Russian government. They also exposed the IOC for their neglect in overseeing environmental sustainability through their “Zero Waste” policy and their neglect in taking action against other human-rights violations that were reported to them. In fact, as a result of his hard work, Gazaryan received the Goldman Environmental Foundation $175,000 award in 2014, which is essentially equivalent to an ‘environmental Nobel Prize.’ However, Gazaryan has been explicit in his desire to share the credit of his achievements with his colleagues at the EWNC. Furthermore, despite the sum of money bestowed with his award, Gazaryan’s life has not been easy post-asylum. Soon after the Sochi Winter Olympics officially began, Gazaryan’s colleague and friend, Vitishko, was arrested and imprisoned for allegedly swearing in public. The image above shows Nadya Tolokonnikova being whipped with horsewhips for performing a protest song in support of Vitishko. Consequently, Vitishko’s arrest came after both he and Gazaryan filed to have their suspended sentences overturned on the grounds that they were disproportionate punishment for spray-painting a construction fence during the protest. Conversely, rather than simply turning down the appeal, the court sentenced Vitishko to three years in a penal colony, while Gazaryan was not sentenced because he had not been in court that day (Bellona 2014). Currently, Vitishko remains in jail – or in Bøhmer’s words in a ‘labour camp’ – with little hope of a reprieve (Bøhmer 2015). In his last interview before going to jail, Vitishko said the following: “If going to a prison colony helps show the international community, or at least the International Olympic Committee, that they should give the Olympics to countries that can actually handle them responsibly, then I have succeeded in sending part of the message I want to send” (Bellona 2014). Although it goes without saying, Gazaryan has been left feeling angry and powerless, as are the countless others who have selflessly attempted to expose the injustices that have transpired. Photo 11. Vitishko and Gazaryan “in better times”
Source: Bellona, 2014
3.3. Economic Factors
The last section of this report will evaluate the economic factors that have affected the situation in Sochi, starting with the the current economic situation, particularly in terms of how the $51 billion was allocated in preparation for the Olympic Games. Despite possible alternative motives by the government, many Russians were
SEM 2015 217
EUROPE
MOLLY O’HARA 2014 WINTER OLYMPICS IN SOCHI: AN ENVIRONMENTAL AND HUMAN-RIGHTS DISASTER
optimistic that the Olympics would have a positive effect on the country’s economy (AP NORC 2015). Furthermore, these opinions were supported by the Russian President, himself, when he made a promise in 2007 to turn Sochi into a ‘world-class resort’ for a ‘new Russia’ and the rest of the world. Rather than a mere sporting event, President Putin considered the Olympics as a way to rejuvenate the entire Caucasus region (Yaffa 2014). Yet, many became suspicious as they scrutinised the overall budget in greater detail. Anti-corruption blogger and opposition politician, Alexei Navalny, asserted that there was a total cost over-run of 150-250%. He also suggested that the level of spending was ‘all the more extraordinary,’ given that some of the hotels have not yet been finished (The Economist 2014). Another report claims that building the new Olympic Stadium in Sochi would cost $19,000 per seated fan, whereas the average cost in previous games was only $6,000 (Koba 2013). In support of these assertions, Bøhmer (2015) further criticises the government for destroying valuable wetlands in order to build ‘economy-boosting hotels,’ all of which are currently empty except for one, which only welcomes around 40-50 guests at a time. Moreover, the $9 billion combined railroad and highway – that led to habitat destruction, biodiversity loss, depletion of water sources and the eviction from and demolition of countless homes – is reportedly used only once a day (Bøhmer 2015). Concerning the current economic situation in Sochi, it is important to understand that the city was not extremely affluent in the first place, and many Sochi locals made their living from farming. Therefore, losing access to their land not only left many families homeless, but it also left them jobless. Since residents have not received any support from the government, some have no choice but to restore to creative means in order to make a living and have even resorted to making moonshine (Bøhmer 2015). According to Vasilyeva (2015), the government has also begun imposing more taxes on residents now that the oligarchs (i.e. rich business men with political influence) want their money back. Subsequently, by taking into account the possible tax increases with a possible lack of transportation, drinking water, electricity, jobs and homes, it is safe to conclude that the economic situation in Sochi is declining, with little hope for improvement in the future.
4. CONCLUSION The present case study has closely examined the kind of environmental destruction, social injustices and environmental migration that can result from a manmade event. The first section of this report detailed the background of the Sochi Winter Olympics, including the process of electing Sochi and a discussion of the environmental impacts in preparation for the event. The second section analysed the forced displacement that took place from evictions imposed by the government, as well as the population that remained trapped and unable to relocate. The third section assessed the various responses from the government, organizations and locals to more thoroughly tackle issues related to political, social and economic factors. Finally, the conclusion provides a brief overview of the current situation in Sochi and suggests how similar issues should be dealt with in upcoming mega-events. In February 2014, HRW submitted a series of suggestions for policy changes and reforms to the IOC. These proposals suggested that the IOC take the necessary steps to strengthen the Olympic Host City Bid process, ensure that future host city contracts with governments include specific human rights pledges and amend Principle 6 of the Olympic Charter that prohibits discrimination so as to include sexual orientation and gender identity (Human Rights Watch 2014). Subsequently, in another document submitted to the IOC in April 2014, HRW called for more detailed policy changes. For example, the following human rights benchmarks should be
SEM 2015 218
included in host city contracts: media freedom, labour rights, freedom of expression and association, liberty and security and non-discrimination. As stated more explicitly under the liberty and security benchmark, the IOC should ‘guarantee that there will be no unlawful forced evictions of host city residents’ and ‘guarantee that there will be no arbitrary detentions and/or forcible removal from the host city of any population groups or individuals deemed undesirable on various grounds by the authorities’ (Human Rights Watch 2014). Consequently, the IOC has since introduced a specific anti-discrimination clause to the host city contract (Gibson 2014). However, the IOC has not been as successful in terms of overseeing the cleanup in Sochi. According to Bøhmer (2015), following meetings between the local organising committees and the IOC to discuss the issues remaining and organise a cleanup, 70 illegal dumpsites have been uncovered. Yet, because the local authorities have been inactive and there has been no follow-up by the IOC, the dumpsites still remain. Additionally, Bøhmer (2015) is critical of the impact that the upcoming 2018 World Cup will have in Russia, stating that the country already has a ghost stadium from the Olympics, and is now building another one for the World Cup. While the host city changes every four years the legacy of the Olympics will endure. According to Popelarova and Janiga (2008), “In some way all Olympics profit. Unfortunately the profit is often not felt by the residents in the area the Olympics touched; it is felt only by a narrow circle of interested corporations.” Although there is still much work to be done in Sochi, it is crucial that those who are responsible for overseeing such mega-events take note of the loopholes and mistakes. Concerning the environmental degradation, human-rights violations and environmental migration documented by this report, it would not be naïve to assume that such injustices may be repeated in the future unless serious, concerted action is taken to prevent them. Therefore, it is crucial that everyone, from sports fans to non-profit organizations to private businesses, media and governments, is not just aware of what happened in Sochi but is dedicated to creating a more environmentally compatible and beneficial experience. Photo 12. “The Rosa Khutor resort may be finished, but other venues slog toward completion.”
Source: Vanity Fair, 2014
SEM 2015 219
EUROPE
MOLLY O’HARA 2014 WINTER OLYMPICS IN SOCHI: AN ENVIRONMENTAL AND HUMAN-RIGHTS DISASTER
REFERENCES –– ABC, 2015, http://www.abc.net.au/ news/2014-01-22/venues-for-the-2014sochi-winter-olympics-map/5213616 (consulted on 9 May 2015). –– AP NORC. 2015. Public Opinion in Russia: Attitudes Toward Hosting The 2014 Olympics And 2018 World Cup. The Associated Press-NORC Center for Public Affairs Research. Retrieved from: http://www.apnorc.org/PDFs/ Russia%20Poll/Olympics%20%20 World%20Cup%20Brief%20_Draft%20 to%20DTP_FINAL.pdf –– Bellona, 2014, http://bellona.org/ news/russian-human-rightsissues/2014-04-sochi-olympicprotestor-gazaryan-winsenvironmental-nobel-ambivalentimpact (consulted on 10 May 2015). –– Business Insider, 2013, http://www. businessinsider.com/sochi-olympicscost-russia-51-billion-2013-2?IR=T (consulted in 9 May 2015). –– English Russia, 2015, http:// englishrussia.com/2015/04/15/anew-villa-community-in-sochi-getsplundered/ (consulted on 10 May 2015). –– Gazaryan, S. and Shevchenko, D. 2014. Sochi-2014: independent environmental report. Environmental Watch on North Caucasus. –– Gibson, Owen. 2014. Olympic antidiscrimination clause introduced after Sochi gay rights row. The Guardian. Retrieved from: http://www. theguardian.com/sport/2014/sep/25/ olympic-anti-discrimination-clausesochi-gay-rights-row.
–– Human Rights Watch, 2012, http:// www.hrw.org/news/2012/09/19/ russia-forced-eviction-tramplesolympic-ideals (consulted on 9 May 2015). –– Human Rights Watch, 2013, https://www.hrw.org/print/ reports/2013/02/06/race-bottom (consulted on 10 May 2015). –– Human Rights Watch, 2014, https:// www.hrw.org/news/2014/02/21/ russia-sochi-highlights-need-olympicreforms (consulted on 11 May 2015). –– Human Rights Watch, 2014, https:// www.hrw.org/sites/default/files/ related_material/HRW-submissionto-Olympic-Agenda%202020-Apr-2014. pdf (consulted on 11 May 2015). –– Human Rights Watch, 2015, https:// www.hrw.org/russias-olympianabuses (consulted on 9 May 2015). –– International Office for Migration, http://www.iom.int/cms/envmig (consulted on 22 April 2015). –– Interview with Nils Bøhmer, Bellona Managing Director/Nuclear Scientist, conducted on 24 April 2015 over Skype. –– Koba, Mark. 2013, Olympics: Going for the gold, spending in the red. CNBC. Retrieved from: http://www.cnbc. com/id/101163701. –– Loiko, Sergei. 2014. Sochi Olympic Winter Games at root of resident’s housing woes. Los Angeles Times. Retrieved from: http://articles.latimes. com/2014/feb/06/world/la-fg-sochidark-side-20140207.
–– Golubkova, Katya and Akin, Melissa. 2012. Sochi Olympics 2014: Construction and Forced Evictions Mark Olympic Showcase in Russia. The World Post. Retrieved from: http://www. huffingtonpost.com/2012/11/04/sochiolympics-2014_n_2070784.html.
–– Luhn, Alec. 2014. The Hidden Environmental and Human Costs of the Sochi Olympics. The Nation. Retrieved from: http://www. thenation.com/article/178051/hiddenenvironmental-and-human-costssochi-olympics?page=0,1.
–– Human Rights Watch, 2009, http:// www.hrw.org/news/2009/10/01/ letter-international-olympiccommittee-human-rights-concernsrelated-sochi-games (consulted on 10 May 2015).
–– Official Website of the Olympic Movement, 2015, http://www.olympic. org/content/the-ioc/bidding-for-thegames/past-bid-processes/2014-hostcity-election/ (consulted on 8 May 2015).
SEM 2015 220
–– Official Website of the Olympic Movement, 2015, http://www.olympic. org/sochi-2014-winter-olympics (consulted on 9 May 2015). –– Official Website of the Olympic Movement, 2015, http://www.olympic. org/sport-environment-commission (consulted on 8 May 2015). –– Popelarova, S. and Janiga, M. 2008. Winter Olympic Games as environmental problem. Oecologia Montana. Retrieved from: http://www.vuvb. uniza.sk/ojs2/index.php/OM/article/ viewFile/406/328. –– Radio Free Europe Radio Liberty, 2014, http://www.rferl.org/ contentinfographics/sochi-outsidethe-arena-olympics-russia/25229471. html (consulted on 9 May 2015). –– The Economist, 2014, http://www. economist.com/blogs/economistexplains/2014/02/economistexplains-2 (consulted 8 May 2015). –– Vanity Fair, 2014, http://www. vanityfair.com/news/politics/2014/02/ sochi-olympics-russia-corruption (consulted 9 May 2015). –– Vasilyeva, Nataliya. 2015. Sochi’s costly legacy: A year after Olympics, Russian oligarchs unload toxic assets on state as taxpayers pick up the bill. National Post. Retrieved from: http://news. nationalpost.com/sports/olympics/ sochis-costly-legacy-a-year-afterolympics-russian-oligarchs-unloadtoxic-assets-on-state-as-russiantaxpayers-pick-up-the-bill. –– West, Angus. 2014. Sochi residents ‘paved over’ by Olympic construction remain displaced and unpaid. Global Post. Retrieved from: http:// www.globalpost.com/dispatches/ globalpost-blogs/rights/Olympicsleaves-sochi-residents-displaced-andunpaid-part-1. –– Yaffa, Joshua. 2014. The Waste and Corruption of Vladimir Putin’s 2014 Winter Olympics. Bloomberg Business. Retrieved from: http:// www.bloomberg.com/bw/ articles/2014-01-02/the-2014-winterolympics-in-sochi-cost-51-billion#p1.
Biogra phies
SEM 2015 221
Editors
FRANÇOIS GEMENNE François Gemenne is the executive director of the interdisciplinary research programme Politics of the Earth at Sciences Po (Médialab) in Paris. A specialist of environmental geopolitics and migration dynamics, he is also a FNRS senior research associate at the University of Liège and at the University of Versailles (CEARC). He also lectures on environmental and migration policies in various universities, including Sciences Po and the Free University of Brussels. He has been involved in a large number of international research projects on these issues, including EACH-FOR, HELIX and MECLEP, for which he is the global research coordinator. He also coordinated the DEVAST project, one of the first international projects to examine the social and political consequences of the Fukushima disaster. In 2015, he was recipient of a Fulbright scholarship to pursue research at Princeton University. He holds a joint doctorate in political science from Sciences Po Paris and the University of Liège (Belgium). He also holds a Master in Development, Environment and Societies from the University of Louvain, as well as a Master of Research in Political Science from the London School of Economics. DINA IONESCO
Dina Ionesco is the Head of the Migration, Environment and Climate Change (MECC) Division at the International Organization for Migration (IOM). In this capacity she develops and oversees the institutional policies, programmes and publications on migration, environment and climate change and coordinates IOM’s contributions to policy
SEM 2015 222
processes, such as the climate change negotiations. Dina joined IOM in 2004 taking up different responsibilities, dealing with migration policies, research, development and diasporas. Since 2011 she has developed IOM’s environmental migration engagement and has written and overseen numerous articles and publications on this topic. Prior to joining IOM, Dina worked with the OECD in Paris from 1998 to 2004 as an Administrator on local development, job creation, social capital and entrepreneurship. Additionally, she has worked a university assistant, in an international non-governmental human rights organization, as an independent consultant and as a coach writer, in the UK, Switzerland and Denmark. CAROLINE ZICKGRAF Dr. Caroline Zickgraf is FNRS Postdoctoral Research Fellow at the University of Liège in Belgium and a lecturer at Sciences Po Paris in environment and migration. Her research focuses on the migratory impacts of environmental degradation and climate change, transnationalism, and immobility. Since 2013, Dr. Zickgraf has worked on the EU FP7 project ‘HELIX’(HighEnd cLimate Impacts and eXtremes), for which she conducted fieldwork on climate-related migration in Northern Senegal. She has also consulted for the World Bank, the Nansen Initative and the International Center for Migration Policy Development (ICMPD) on the links between climate change and migration in West Africa. In 2015, she was awarded the post of Postdoctoral fellow with the National Fund for Scientific Research. In this position, Dr. Zickgraf is conducting the project ‘IMMOBILE’ (Immobility and the Environment), which analyzes populations ‘trapped’ or who choose to stay in areas affected by environmental
CEMENT MÉTIVIER Clément Métivier is a graduate from Sciences Po Paris, where he completed a Master degree in International Affairs and Environmental Policy. He also studied at the University of California, Los Angeles (UCLA), and worked in the United States in order to promote French-American cooperation on environmental issues. In 2015, he is involved in the youth-led think and do tank CliMates, where he is the co-director of the COP in MyCity project, an international initiative aiming at raising awareness about climate change issues among youth and encouraging local environmental actions. In the next few years, Clement is planning on pursuing a career in the environmental sector. More specifically, he would like to work on the establishment and promotion of successful environmental policies. He is particularly willing to create and maintain connections among key stakeholders, including civil society, NGOs, businesses, local governments, states, and international organizations, in order to encourage the development of sustainable and decarbonized societies.
PIERRE WALTER
Pierre Walter is pursuing a Dual Master’s Degree in Environmental Science and Policy at the Paris School of International Affairs (PSIA / Sciences Po) and at the Université Pierre et Marie Curie (UPMC). Passionate about environmental and poverty reduction issues, Pierre is currently completing a six-month internship at the Agence Française de Développement (AFD, France’s bilateral development bank), where he has worked primarily on the assessment, management and monitoring of the environmental and social impacts of projects financed by AFD. As a student, he has been engaged in a wide range of activities, including volunteering for a sustainable farming project in Thailand. Upon graduation Pierre wishes to gain more work experience in the field of environment and development in France or abroad.
Contributors
changes and their relationships with those who go. For this project, she is conducting case studies in Senegal, Japan and Vietnam. Beginning in 2016, she leads the University of Liège in their partnership with Sciences Po-Paris and University of Economics Bratislava within the Horizon 2020 project ‘EDGE’ (Environmental Diplomacy and Geopolitics). Dr. Zickgraf holds a doctorate in political and social sciences from the University of Liège as well as degrees from Leiden University (MPhil) in the Netherlands and Michigan State University (BA) in the United States.
CLOTHILDE TRONQUET Clothilde Tronquet works at the Institute for Climate Economics (I4CE) on the contribution of forest and agriculture to climate change and on the policy and economic instruments related to mitigation and adaptation. Her expertise areas also include international climate negotiations, policy evaluation and energy policies. Before joining I4CE, she worked in an agribusiness company, at the French Embassy in Madrid and for the non-profit sector in Brazil. She is particularly interested in agricultural and forestry systems; issues related to sustainable consumption and environmental health. She aspires to new international experiences as a project manager. Clothilde holds an Environmental Policy Master of the Paris School of International Affairs of Sciences Po.
SEM 2015 223
Contributors
BIOGRAPHIES
CRISTINA ALVAREZ-QUINONES After 17 years of working in the stock markets, Cristina decided to change her professional career to work in the International Development field. In her opinion, the financial crisis that started in 2008, whose consequences are still taking place worldwide, has destroyed a tremendous amount of wealth and human values. This altered her personal and professional interests, now focused on creating value, not for investors, but for the needy. Before enrolling in Sciences Po’s Master in Development Practice, a cross-disciplinary program addressing the challenges of sustainable development, Cristina spent four months in Nepal, volunteering for several NGO’s concerned with orphan children and education. Extremely sensible to the difficulties that developing countries have to access the financial markets, she is now leveraging on her financial experience to serve these. She has recently started to work for a micro-finance institution to analyze and manage projects that will bring renewal energy solutions to developing countries. STEPHANIE LYONS. Before graduating with a Master’s degree in Development Practice (Summa Cum Laude, PSIA/Sciences Po), Stephanie Lyons worked as an analyst and policy adviser on climate change and sustainable development issues. She spent five years with the Australian Government, working primarily on climate, environment and water policy reforms in the Prime Minister’s department and the Department of Climate Change. She went on to work in the NGO sector in Vietnam, where she managed and advised on projects aimed
SEM 2015 224
at building urban communities’ resilience to the impacts of climate change. Stephanie also holds a bachelor’s degree in communication and received the University of Canberra Medal (2008) for her First Class Honors thesis analyzing media discourses on climate change. She is currently working as a consultant on climate and energy projects based in Southeast Asia and Europe. PIA VAN ACKERN Pia van Ackern is a Dual Degree Master’s student in International Public Management/ Political Science at the Paris School of International Affairs (PSIA/Sciences Po) and the Otto Suhr Institute of Political Science (Freie Universität Berlin), where she is specializing in migration, the relationship between natural resources and conflict as well as international public policy-making. She holds a Bachelor’s degree in Social Sciences from Heinrich Heine University in Düsseldorf (Germany), with a special focus on empirical research methods. Pia has interned at the German Federal Ministry for Economic Cooperation and Development in the division for refugees and migration, at the German Embassy in Bogotá (Colombia), where she has worked primarily on human rights and peacebuilding, and at an environmental advocacy organization in Australia, where she has been engaged in campaigning and communications. In the future, she hopes to further enhance her academic and professional experiences in the fields of migration, environment and diplomacy and wishes to commit herself to issues of sustainability and global justice.
Contributors
SHUYU JIANG
Shuyu JIANG is a student from Peking University-Sciences Po Dual Master’s Degree in International Relations. I studied international development in Sciences Po with the concentration on China and environment. I am interested in studies concerning vulnerable groups in response to global challenges, particularly in developing countries. To fulfil my pursuit, I have conducted field research and voluntary work in western part of China, Vietnam and Cambodia. I also devoted to internships in World Economic Forum and other international organizations. In this research, I examine the resettlement after the Ludian Earthquake, through which I further explore the environment migration as a positive and proactive way to environmental risks reduction, as well as climate change mitigation. JASON RIZZO
Before obtaining a Master’s degree in Development Practice from the Paris School of International Affairs (PSIA/Sciences Po), worked for eight years as a senior recording engineer and multimedia journalist in the United States, producing content for broadcast radio, television, feature films, and online news outlets. He attained a Bachelor’s degree in Audio Arts and Acoustics from Columbia College Chicago, where he later held the position of Adjunct Faculty in Audio for Visual Media studies. In applying his skillset to the development field, he first volunteered for an NGO in Kenya to assist in the establishment of their public relations and social media strategy. After recently completing a communications post with the Center
for Global Health at Institut Pasteur in Paris, he is most interested in continuing to research, implement, and promote sustainable development projects that interlink issues relating to global health, food security, and refugee rights. He can currently be found surveying the streets of Paris, bag of potato chips in hand, in search of good jazz and a glass of Bordeaux. ELISE HAUMONT
Elise Haumont graduated from Sciences Po Paris in June 2015, with a Master in International Public Management. She specialized in European and migration studies. Previously, she spent four months as an intern for the Office for Familial Immigration in the French Ministry of Interior where she worked on jurisprudence. She also worked as a junior researcher at the French Court for the Right of Asylum where she wrote a report on the extreme left in Turkey. In 2012-2013, Elise lived in Istanbul for ten months. She studied political science and international relations at Bogaziçi University as an Erasmus student. Elise is currently a volunteer teacher in French as a foreign language to adult migrants. She is currently working as a junior project manager at Le Comptoir de l’Innovation, a company which promotes supports and finances the development of social enterprises. Elise is Humanity in Action fellow and remains very interested by integration and multiculturalism issues.
SEM 2015 225
Contributors
BIOGRAPHIES
LINH NGUYEN
Linh Nguyen is a young Vietnamese who has educational background in Economics and Environmental Policy. She is interested in finding innovative solutions to protect the environment while improving living standard and social equality. Her study and work have been largely related to renewable energy and poverty reduction in developing countries. Before Sciences Po, she developed financial improvement strategy for ONergy, a social enterprise which provides affordable and renewable energy to the rural areas in Eastern India. Recently, she has been responsible for technological cooperation in “Energy Support Programme”, GIZ Vietnam to help scale-up wind power sector in the country. Her “next big plan” is to work in adaptation, with the focus on the poorest in developing countries such as Vietnam, Pakistan and Philippines, as they are the most vulnerable group to the climate change. She enjoys living in different countries to meet people from all walks of life and to learn about others cultures. ADRIANA CRUZ FELIX Adriana Cruz Felix is master student in Environmental Policy with concentration in Global Economic Policy at Sciences Po Paris class 2016. As part of her master program she is currently making an internship at the Green Climate Fund (GCF) based in South Korea, at the Country Programming Division, developing the strategy to strengthen stakeholders’ engagement with the GCF. Before attending Sciences Po, she was the Partnerships Coordinator at an international conservation NGO called Rare, where she supported
SEM 2015 226
the research and development of natural resources co-management projects in different countries in Latin America, which had a strong focus in creating community empowerment for the responsible management of fisheries and watersheds. Adriana plans to work in the development of projects focused on improving the capacity of the population to adapt and mitigate climate change impact, particularly interested in working in the development of bottom-up initiatives. She is Mexican and has a BA in International Relations. MOLLY O’HARA
Molly O’Hara recently graduated from the Paris School of International Affairs (PSIA/ Sciences Po) with a master’s degree in Environmental Policy, specializing in International Energy and European Studies. She began her graduate program specifically interested in how to harness the innovation and capacity of the private sector in order to solve global sustainability problems. While working at a private insulation company, she developed research skills pertaining to the public’s perception of a potentially environmentally hazardous flame retardant, the energy efficiency among residential building codes across the USA and the extent to which home builders prioritize and market energy efficiency features. In the private sector, Molly will continue seeking ways to deconstruct various environmental misconceptions, such as the widespread belief that going green means diminishing profits. Constructing more effective bottom-up solutions, Molly hopes to begin her career in a private company or consulting firm, where she believes the most progress can be achieved.
Editorial Team
OLIVA KAVISHE
Oliva Kavishe worked as an Intern for the Migration, Environment and Climate Change (MECC) team for a four months part-time Internship while attending the study abroad programme at Webster University pursuing her Bachelors in International Relations. Oliva studies International Affairs, International Economic Integration and Diplomatic Affairs EMILY SKOVRAN
Emily Skovran worked as an Intern with the Migration, Environment and Climate Change (MECC) team assisting with research and analytical work on migration and policy issues, in addition to editing and revising IOM MECC publications. Emily is in the process of earning a Bachelor’s degree in Economics and Global Health from the University of Wisconsin-Madison.
DARIA MOKHNACHEVA Daria Mokhnacheva is a thematic specialist at the Migration, Environment and Climate Change Division at IOM, where she focuses on the impacts of disasters and environmental change on societies, migration and development, and where she provides support to the elaboration of relevant programmes and projects.
The State of Environmental Migration 2015 A Review of 2014 Edited by François Gemenne Caroline Zickgraf Dina Ionesco
International Organization for Migration (IOM)
With the support of