Sep 28, 2006 - Germanium dioxide (GeO2) is a chemical analogue of SiO2. Furthermore, it is also to some extent a structural analogue, as the low and ...
arXiv:cond-mat/0609730v1 [cond-mat.mtrl-sci] 28 Sep 2006
The structure of amorphous, crystalline and liquid GeO2 M. Micoulaut1 , L. Cormier2 and G.S. Henderson3 1
Laboratoire de Physique Th´eorique de la Mati`ere Condens´ee, Universit´e Pierre et Marie Curie, CNRS UMR 7600, Boite 121, 4 place Jussieu, 75252 Paris Cedex 05, France 2
Institut de Min´eralogie et de Physique des Milieux Condens´es, Universit´e Pierre et Marie Curie, Universit´e Denis Diderot, CNRS UMR 7590, 4 place Jussieu, 75252 Paris Cedex 05 France 3
Department of Geology, University of Toronto, 22 Russell Street, Toronto, Ontario M5S 3B1, Canada
Abstract. Germanium dioxide (GeO2 ) is a chemical analogue of SiO2 . Furthermore, it is also to some extent a structural analogue, as the low and high-pressure short-range order (tetrahedral and octahedral) is the same. However, a number of differences exist. For example, the GeO2 phase diagram exhibits a smaller number of polymorphs, and all three GeO2 phases (crystalline, glass, liquid) have an increased sensitivity to pressure, undergoing pressure induced changes at much lower pressures than their equivalent SiO2 analogues. In addition, differences exist in GeO2 glass in the medium range order, resulting in the glass transition temperature of germania being much lower than for silica. This review highlights the structure of amorphous GeO2 by different experimental (e.g., Raman and NMR spectroscopy, neutron and x-ray diffraction) and theoretical methods (e.g., classical molecular dynamics, ab initio calculations). It also addresses the structure of liquid and crystalline GeO2 that have received much less attention. Furthermore, we compare and contrast the structural differences between GeO2 and SiO2 , as well as, along the GeO2 − SiO2 join. It is probably a very timely review as interest in this compound, that can be investigated in the liquid state at relatively low temperatures and pressures, continues to increase.
CONTENTS
2
Contents 1 Introduction
2
2 Crystalline GeO2 Polymorphs 2.1 Structure . . . . . . . . . . . . . . . . . . . . . . . . . . . . . . . . . . . 2.2 High pressure and temperature behaviour . . . . . . . . . . . . . . . . . .
3 3 4
3 GeO2 glass structure 3.1 Neutron and X-ray diffraction . . . . 3.2 Neutron and X-ray diffraction at high 3.3 Raman Spectroscopy . . . . . . . . . 3.3.1 GeO2 polymorphs . . . . . . . 3.3.2 GeO2 glass and liquid . . . . 3.4 Infra Red (IR) spectroscopy . . . . . 3.5 Increasing Pressure and Temperature 3.6 NMR spectroscopy . . . . . . . . . .
. . . . . pressure . . . . . . . . . . . . . . . . . . . . . . . . . . . . . .
. . . . . . . . . . and temperature . . . . . . . . . . . . . . . . . . . . . . . . . . . . . . . . . . . . . . . . . . . . . . . . . . . . . . . . . . . .
. . . . . . . .
. . . . . . . .
. . . . . . . .
. . . . . . . .
. . . . . . . .
4 Structure of densified liquid GeO2
7 7 9 12 12 14 17 18 19 19
5 Structure of the binary SiO2 -GeO2 glasses 20 5.1 EXAFS and X-ray scattering . . . . . . . . . . . . . . . . . . . . . . . . . 20 5.2 Raman spectroscopy . . . . . . . . . . . . . . . . . . . . . . . . . . . . . 21 5.3 Evolution with pressure . . . . . . . . . . . . . . . . . . . . . . . . . . . 22 6 Molecular simulations and theoretical approaches 6.1 Force field parameters . . . . . . . . . . . . . . . . 6.2 Simulation of liquid and amorphous germania . . . 6.3 Glass transition problem of strong glasses . . . . . . 6.4 Equation of state . . . . . . . . . . . . . . . . . . . 6.5 Pressurized germania . . . . . . . . . . . . . . . . . 6.6 Pressure induced rigidity and intermediate phases . 6.7 Ab initio studies of c-GeO2 and germania . . . . . . 7 Summary and Conclusions
. . . . . . .
. . . . . . .
. . . . . . .
. . . . . . .
. . . . . . .
. . . . . . .
. . . . . . .
. . . . . . .
. . . . . . .
. . . . . . .
. . . . . . .
. . . . . . .
23 23 24 26 27 28 30 32 32
1. Introduction Zachariasen [1] proposed the continuous Random network model (CRN) to explain the structure of oxide glasses, and it has subsequently received wide acceptance in describing glasses that form continuous random networks. To date the majority of studies of oxide glasses have involved the investigation of silica (SiO2 ) or borate (B2 O3 ) glasses with, to a lesser extent, germania (GeO2 ) glasses. The structure of the latter has generally been considered to be comparable to that of silica glass despite differences in bond lengths,
CONTENTS
3
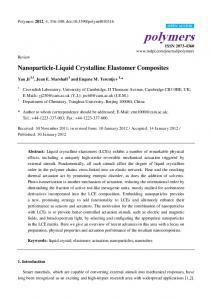
angles and the relative size of Ge versus Si. Experimental studies of amorphous GeO2 have generally involved either x-ray or neutron scattering and spectroscopic techniques such as x-ray absorption spectroscopy (EXAFS/XANES) and Raman spectroscopy. On the other hand, theoretical studies have generally employed classical or ab initio molecular dynamics calculations to gain insight into the structure of these materials. In both approaches, the results of the studies are often compared to the known crystalline polymorphs of GeO2 . Here we review the structure of amorphous GeO2 (glass and liquid) from both an experimental and theoretical perspective, as well as, comparing their structure with that of amorphous SiO2 (glass, liquid). Furthermore, we review the structure of the crystalline GeO2 polymorphs, both at room temperature and pressure and at elevated temperatures and pressures. 2. Crystalline GeO2 Polymorphs 2.1. Structure Crystalline GeO2 exists at ambient temperatures and pressures as one of two polymorphs (Figure 1): an α-quartz-like (P 32 21) trigonal (hexagonal) structure [2] or as a rutile-like tetragonal (P 42 /mnm) structure [3]. The α-quartz-like GeO2 structure has been shown to be the stable high temperature phase [4] and, while the structure is very similar to that of α-quartz, there are some distinct differences. In particular the GeO4 tetrahedra are more distorted due to greater variation in the O − Ge − O angles within the tetrahedron, which range from 106.3o to 113.1o with a Ge − O − Ge angle of 130.1o . This is in contrast to α-quartz where the O − Si − O angles within the SiO4 tetrahedron are relatively uniform ranging from 108.3o to 110.7o with a Si − O − Si angle of 144.0o [5]. These differences are important as it results in different mechanisms being responsible for the high pressure behaviour of α-quartz and α-quartz-like GeO2 . For α-quartz the tetrahedra are relatively rigid and compression of the structure occurs via cooperative rotation or tilting of the tetrahedra around the shared bridging oxygens. Conversely, for α-quartzlike GeO2 while compression does occur via tilting of the tetrahedra, distortion of each tetrahedron via changes in the individual O − Ge − O angles also plays a large role [5]. This behaviour is the reason why germanate analogues of silicate phases are useful in high pressure studies since they undergo pressure induced phase transformations at much lower pressures than their silicate analogues. The transformation of α-quartz to the high pressure rutile structure (Stishovite) occurs at 10 GPa while the equivalent transformation for α-quartz-like GeO2 to rutile-like GeO2 has been observed to occur at much lower pressures when the sample is heated: ≃ 1.8-2.2 GP a at 417 K [6]. As noted above, the stable room temperature GeO2 phase is the rutile GeO2 polymorph which transforms to the α-quartz-like structure at 1281 K ([4], [7] and references therein). The rutile GeO2 polymorph has a structure similar to that of stishovite [3] and, like stishovite, the 2 axial bonds within the GeO6 polyhedron are
CONTENTS
4
Ge Ge Ge
Ge Ge
Ge Ge Ge
Ge Ge Ge
Ge Ge Ge Ge
Ge Ge Ge
Ge Ge GeGe
Ge Ge
Ge Ge Ge Ge
Ge Ge Ge
Ge Ge Ge Ge
Ge Ge Ge
Ge Ge
Ge Ge Ge
Ge Ge Ge GeGe
GeGe
GeGeGe
Ge Ge Ge
a2 c Ge
Ge Ge
a1 Ge Ge Ge
a1
a2 c
Figure 1. Projection of the α-quartz-like structure (left) and rutile-like structure (right) onto the (001) plane.
˚ and 1.872 ± 0.001 ˚ longer than the 4 equatorial Ge − O bonds: 1.902 ± 0.001 A A, respectively. Conversely, the two independent Ge − O distances in the α-quartz-like GeO2 structure are similar at 1.737 ± 0.003 ˚ A and 1.741 ± 0.002 ˚ A [2]. 2.2. High pressure and temperature behaviour A number of studies have investigated the high pressure behaviour of the two GeO2 polymorphs. Iti´e et al. [8] investigated α-quartz-like GeO2 at ambient temperature. They observed an increase in the Ge − O bond length and Ge coordination number consistent with the formation of the rutile-like GeO2 phase between 7−9 GP a. However, subsequent studies have suggested that the transformation is to an amorphous phase rather than the crystalline rutile-like GeO2 polymorph [7], [9], [10], [11]. Furthermore, it has been suggested that the amorphization step is a precursor to subsequent transformation to the rutile polymorph [11]. More recently, Brazhkin et al. [12],[13], [14] have shown that with compression, α-GeO2 changes via a martensitic transition into a crystalline monoclinic (P 21 /c) phase. On the other hand, Haines et al. [15] suggest that there is no evidence for amorphization of the crystal. Instead a poorly crystalline monoclinic (P 21/c) phase forms consisting of edge sharing chains of GeO6 octahedra (Figure 2). The monoclinic phase is metastable up to 50 GP a. However, when combined with heating, it transforms to the rutile structure at pressures up to 22 GP a and above 43 GP a forms a mixture of CsCl2 -type and F e2 N-type (or α-P bO2 , see later) high pressure phases [12],[13],[15]. This monoclinic phase was also reported by Prakapenka et al. [16] between 7−52 GP a at room temperature but with laser heating it transforms to an orthorhombic CaCl2 -type structure above 36.4 GP a and an α − P bO2 -type structure
CONTENTS
5
Figure 2. Polyhedral representation of the (3 × 2)-kinked P 21 /c structure of GeO2 determined by Haines et al. [15]. Crystallographic axes are not to scale and are merely to show orientation of the structure. Green (light) octahedra are the fully occupied Ge positions while the blue (dark) octahedra are the Ge octahedra which exhibit partial occupancy.
at 41 GP a. Haines et al. [17] have also observed transformation of the rutile-like GeO2 phase to the orthorhombic CaCl2 -type structure above 25 GP a at ambient temperature while Ono et al. [18] observed the transition at high pressure and temperature. Ab initio calculations by Lodziana et al. [19] suggested that rutile-type GeO2 should transform to α-P bO2-type (above ≃ 36 GP a) and pyrite (Pa) type (above ≃ 65.5 GP a) structures and these were subsequently observed by Ono et al. [20], [21] around 44 and 90 GP a, respectively. A F e2 N-type (or defect Ni−As) phase at pressures larger than 25 GP a has been observed by Liu et al. [22] and Haines et al. [15]. This type of structure is similar to an α-P bO2-type structure but with the Ge sites disordered and has, more recently, been explicitly identified by Ono et al. [20] as being the α-P bO2-type structure. However, it should be noted that Prakapenka et al. [23] observe the defect NiAs structure when amorphous GeO2 is heated to 1000 − 1300 K at 6 GP a (see later). Structural refinements of the crystalline phases have been obtained by Shiraki et al. [24] and a phase diagram for crystalline GeO2 is given in Figure 3. In addition, another orthorhombic phase has been suggested to occur at ≃ 28 GP a and 1273 K by Ming and Manghnani [25]. They concluded that this phase was not the α-P bO2-type structure but it has not been observed subsequently. The phase transformation sequence of rutile-
CONTENTS
6
Figure 3. Phase diagram of crystalline GeO2 (after [20]).
like GeO2 → (25 GP a) CaCl2 -type → (44 GP a) → α-P bO2-type → (70 − 90 GP a) pyrite-type structures is consistent with the high-pressure behaviour of other group-IV element dioxides such as P bO2 , SnO2 , and SiO2 (cf., [26], [19], [16], [23]). Of interest is the way in which the α-quartz-like and rutile-like GeO2 structures respond to increasing pressure. As noted above, Jorgensen [5] observed that in the αquartz-like polymorph compression up to 2.5 GP a occurs predominantly via changes in the individual O−Ge−O angles and that tilting of tetrahedra was secondary. Yamanaka and Ogata [27] carried out a series of structural refinements on the α-quartz-like GeO2 polymorph up to 4.48 GP a and found that the GeO4 tetrahedra are relatively rigid with little change in the Ge − O bond length, consistent with the study of Iti´e et al. [8]. Yamanaka and Ogata [27] found that the dominant mechanism responsible for the observed pressure induced unit-cell volume change in the structure involved a decrease in the Ge−O−Ge angle from 130o to 125o . Conversely, Glinneman et al. [28] found that tetrahedral tilting was responsible for the 11% volume change of α-quartz-like GeO2 up to 5.57 GP a. The phase transformation of rutile-like GeO2 to the CaCl2 -type structure occurs via compression of the axial Ge−O bonds of the octahedron. The axial bonds are elongated relative to the equatorial bonds (see above). With increasing pressure there is increased compression of the axial relative to equatorial bonds [17] and the transformation at 25 GP a occurs during flattening of the octahedra [17], [24]. With transformation to the α-P bO2-type structure, the GeO6 octahedron becomes further deformed with the Ge atom displaced from the center of the octahedron and 2 of the six Ge − O bonds
CONTENTS
7
becoming elongated [24], as suggested by the numerical results of Lodziana et al. [19]. Transformation to the pyrite-type structure, however, results in GeO6 octahedra that are symmetrical with Ge in the centre. As noted above, the α-quartz-like polymorph is the stable high temperature phase and rutile-type GeO2 will transform to this polymorph above 1320 K; the transformation temperature being the highest of any of the quartz-like analogues. The high temperature (up to 1344 K) behaviour of this polymorph has been investigated by Haines et al. [29] who found that the intertetrahedral bridging angle (Ge − O − Ge) and tilt angles exhibit thermal stabilities that are amongst the highest observed for quartz-type analogues. With increasing temperature, expansion of the unit cell is highly anisotropic with expansion along a being 5 times greater than along c [29]. However, the α-quartz-like GeO2 polymorph is metastable at low temperatures ([30] provide a number of methods for growing the α-quartz-like GeO2 polymorph) but does undergo transformation to the rutile-type polymorph at around 1000 K although the reaction proceeds slowly due to the kinetics involved (cf. [31]). Finally, it should be noted that a cristobalite-like polymorph for GeO2 has been observed after long-time heating of GeO2 glass to 873 K [32] or by dehydration of ammonium hydrogen germanate ((NH4 )3 HGe7 O16.4 H2 O) between 853−873 K [33], however, this polymorph has not been observed in in-situ high pressure and temperature studies. In addition, the α-quartz-like polymorph at 1322 K mentioned by Leadbetter and Wright [34] and Desa et al. [35] based on the work of Laubengayer and Morton [4] and Sarver and Hummel [36] has also not been observed. 3. GeO2 glass structure 3.1. Neutron and X-ray diffraction Neutron and X-ray diffraction data are complementary tools for inferring structural information since the chemical sensitivity is different for the two techniques; Ge − O and Ge − Ge pairs are better resolved with X-ray and Ge − O and O − O with neutron. GeO2 glass structure has been studied using X-ray diffraction in the pioneering work of Warren [37], [38] and Zarzycki [39], [40]. It was found that the Ge atoms are arranged in basic tetrahedral units such as those found in the trigonal α-quartz-like GeO2 polymorph. X-ray diffraction data with higher real space resolution (Qmax = 17 ˚ A−1 ) confirmed these findings [34] and determined the first Ge − O and Ge − Ge distances at 1.74 ˚ A and 3.18 ˚ A, respectively, giving an intertetrahedral angle of ≃ 133o. The first neutron diffraction experiment (Qmax = 18 ˚ A−1 ) on vitreous GeO2 shows two A ascribed to Ge − O and O − O correlations, which A and 2.85 ˚ strong peaks at 1.72 ˚ is consistent with GeO4 tetrahedra [41]. The Ge − Ge peak, initially determined at 3.45 ˚ A [41], [42], was resolved in a high resolution neutron diffraction investigation (Qmax = 35.5 ˚ A−1 ) at 3.21 ˚ A, which is slightly higher than the Ge − Ge distance determined by X-ray diffraction due to the overlapping of Ge − O and O − O pairs [43], [44]. A recent neutron and X-ray diffraction investigation [35] has shown that the
CONTENTS
8
O − Ge − O intratetrahedral angle is more distorted in vitreous GeO2 than in vitreous SiO2 , with a distribution likely comparable to that of GeO2 α-quartz (106.3 − 113.1o). This is due to the larger radius of Ge than Si, allowing more accessible positions for O atoms around Ge atoms. The mean Ge-O-Ge intertetrahedral angle was estimated from the Ge-O and Ge-Ge distances to be 130.1o with a range of 121 − 147o. This mean value was confirmed at 133 ± 8.3o using high-energy X-ray diffraction [45]. This bond angle and its distribution are lower than in the case of vitreous silica. The smaller Ge-O-Ge angle probably results from the presence of increased numbers of 3-membered rings in the GeO2 network relative to vitreous SiO2 (cf. [35] and see later) since such planar rings have a Ge-O-Ge angle of 130.5o [46],[47]. The values for the main interatomic distances, coordination numbers and intertetrahedral angles found in these studies are reported in Table I. The structure of GeO2 can thus be viewed as continuous random network of corner sharing tetrahedral, as in silica, but with greater distortion of the tetrahedra and larger amounts of three-membered rings. The diffraction data (Fig. 4) of GeO2 are composed of three partial functions, GeGe, Ge-O and O-O. The first attempt to separate the three components was carried out using X-ray anomalous diffraction and neutron diffraction [48], [49]. The Ge-O, O-O and Ge-Ge distances are found at 1.73, 2.85, and 3.17 ± 0.04 ˚ A, respectively, and the average Ge-O-Ge intertetrahedral bond angle is estimated to have values between 129o and 139o. Recently, by combining neutron and X-ray diffraction, together with X-ray anomalous scattering, the three partial functions were fully separated up to Q = 9 ˚ A−1 [50],[51], though problems exist due to different instrumental resolution functions that appear especially at low Q values, and the necessity to improve the anomalous scattering terms [52]. The structure factors are dominated by peaks occurring at 1.54, 2.6 and ≃ 4.5˚ A−1 . The first feature at 1.54 ˚ A−1 (usually called first sharp diffraction peak, FSDP) corresponds to intermediate range ordering and is stronger in X-ray than in neutron data [53]. The FSDP is associated with a positive peak in SGeGe and SGeO and a shallow negative peak in SOO , indicating that cation correlations dominate the medium range order (Figure 5, [51]). The peak at 2.6 ˚ A−1 is strong and positive in SGeGe and SOO , and strong and negative in SGeO , and has been attributed to chemical short range order. The peak at 4.4 ˚ A−1 occurs predominantly in SGeGe and is due to topological short range order. The latter conclusion is usually extracted from BhatiaThornton structure factors [54] that show the correlations between number density and concentration fluctuations [55]. On this basis, the chemical and topological ordering in GeO2 can be rationalized in terms of an interplay between the relative importance of two lengthscales that exist in the glass [56]. There have been considerable efforts to compare diffraction data obtained on GeO2 glass with equivalent calculations based on the GeO2 crystalline polymorphs, with divergent results. Leadbetter and Wright [34] concluded that the intermediate range order in the glass closely resembles a quasi-crystalline model based on the α-quartz-like A but discrepancies appear beyond GeO2 structure with a correlation length of 10.5 ˚ ˚ 4 A. Bondot [49] obtained good agreement between the glass and the α- and β-quartz
CONTENTS
9 3 Ab initio Experiment Classical
2.5
N
S (Q)
2
1.5
1
0.5
0
0
10
5
15
-1
Q [A ]
Figure 4. Measured total structure factor (circles, [57]) together with calculated S(Q) from ab initio (solid line, [58]) and Classical Molecular Dynamics (broken line, [59]).
GeO2 polymorphs, which led to the conclusion that the glass contains six-membered rings. On the contrary, Konnert et al., [61] concluded that vitreous germania, like vitreous silica, possesses the same short range order as that found in the tridymite SiO2 polymorph. The vitreous GeO2 structure could thus be described as randomly oriented, slightly distorted tridymite-like regions having dimensions ranging up to at least 20˚ A [61]. However, these regions are not crystallographically ordered (i.e. not microcystals) but have similar bonding topology in the glass and in tridymite. In a more recent study [35], it was shown that, though similarities exists with crystalline α-quartz and α-cristobalite GeO2 polymorphs, diffraction data are not consistent with large volume fractions of quasi crystalline-like regions, due to an important distribution of torsion angles. 3.2. Neutron and X-ray diffraction at high pressure and temperature Due to the technical difficulties associated with performing in situ diffraction experiments, pressure effects have been mainly studied on pressure-released glasses, in which permanent densification is observed. Permanently densified glasses (up to 18 GP a) were studied by X-ray diffraction in the low Q-region (FSDP) which is sensitive to medium range order [63]. A shift to higher Q and an increase in width of the FSDP is observed above 6 GP a, a pressure corresponding to the threshold for coordination changes observed in in situ experiments (see below). However, comments on this study pointed out that changes in the diffraction peaks may not necessarily be associated with
CONTENTS
10
˚) R(˚ A) N σ(A Method Ref 1.733 ± 0.001 3.99 ± 0.1 0.042 ± 0.001 ND 1 1.744 ± 0.05 4.0 ± 0.2 0.11 ± 0.01 ND 2 1.73 ± 0.03 ND+AXS 3 1.74 ± 0.01 3.7 ± 0.2 ND 4 1.75 ND+AXS 5 1.73 HEXRD 6 1.739 ± 0.005 3.9 ± 0.1 D 7 1.73 AXS 8 1.74 XRD 9 O-O 2.822 ± 0.002 6.0∗ 0.100 ± 0.002 ND 1 2.84 ± 0.01 6.0 ± 0.3 0.26 ± 0.03 ND 2 2.83 ± 0.05 ND+AXS 3 2.84 ± 0.02 5.5 ± 0.5 ND 4 2.82 ND+AXS 5 2.838 6.0∗ 0.109 ND 7 Ge-Ge 3.155 ± 0.01 4.0 ± 0.3 0.26 ± 0.03 ND 2 3.16 ± 0.03 ND+AXS 3 3.18 ± 0.05 ND 4 3.18 ND+AXS 5 3.17 HEXRD 6 3.185 4.0* 0.163 ND 7 3.17 AXS 8 3.18 XRD 9 Angle Ge-O-Ge 132 ± 5o ND+AXS 3 133 ± 8.3o HEXRD 6 130.1o ND+XRD 7 o 133 XRD 9 Pair ij Ge-O
Table 1. Interatomic distances (R), Coordination numbers (N ), standard deviations (σ) and Ge-O-Ge intertetrahedral angle determined by diffraction methods. 1) Qmax = 50 ˚ A−1 , [57]; 2) Qmax = 50 ˚ A−1 , [62]; 3) Qmax = 9 ˚ A−1 , [51]; 4) −1 −1 −1 [53]; 5) 1 ˚ A ≤ Q ≤ 10 ˚ A , [50]; 6) 0.6 ˚ A ≤ Q ≤ 33.5 ˚ A−1 , [45]; 7) 0.22 ˚ A−1 ≤ Q ≤ 23.6 ˚ A−1 , [35]; 8) [49]; 9) 0.8 ˚ A−1 ≤ Q ≤ 17 ˚ A−1 , [34]. ND = Neutron diffraction; AXS = anomalous X-ray scattering; HEXRD = high energy X-ray ray diffraction; XRD = X-ray diffraction. * Fixed values.
CONTENTS
11
6
sGeGe(Q)
4 2 0 -2 0
2
4
6
8
10
0
2
4
6
8
10
0
2
4 6 -1 Q [A ]
8
10
6
sGeO(Q)
4 2 0 -2 -4 6
sOO(Q)
4 2 0 -2 -4
Figure 5. Left from top to bottom: Measured (circles, [51]) and calculated (solid line, [60]) partial structure factors, SGeGe (Q), SGeO (Q) and SOO (Q). Right : Partial correlation functions, gMM (r), gMO (r) and gOO (r) (from top to bottom), for the three atom pairs in vitreous GeO2 at room temperature (M = Ge, points), together with the corresponding functions from rescaled Molecular Dynamics simulation of vitreous SiO2 (M = Si, lines) (After [51]).
a coordination change [64]. GeO2 glasses densified up to 6 GP a at 673 K (densification of 16%) were investigated by neutron diffraction [57], while a glass densified at 10 GP a and 300 K (densification of 11%) was studied by neutron and X-ray diffraction (Figure 6) [65]. No evidence of six-coordinated Ge was observed. The GeO4 tetrahedra are distorted, with Ge − O distances increasing by 0.005 ± 0.001 ˚ A and O − O and Ge − Ge distances A, respectively [65]. The main change A and 0.019 ± 0.002 ˚ decreasing by 0.023 ± 0.002 ˚ is a shift of the Ge − Ge peak (at ≃ 3.1 ˚ A) to lower r values with increasing pressure compaction [57]. This indicates a reduction in the mean Ge − O − Ge bond angle with
CONTENTS
12
increasing density. Noticeable changes are seen for the FSDP in the neutron and X-ray structure factors: the FSDP shifts towards higher Q, broadens and become less intense on densification. This indicates a reduction of the network connectivity. By combining neutron and X-ray diffraction up to Q = 30 ˚ A−1 , it was shown [65] that variations of the FSDP are mostly associated with O − O correlations rather than Ge − Ge ones. This is attributed to a decrease in the average size of the network cages (these can be considered as holes in the structures, formed for instance, by the ring structures), yielding better packing of the GeO4 tetrahedra. In situ measurements have recently been obtained (Figure 6) by both neutron (up to 5 GP a) and X-ray (up to 15 GP a) diffraction [66]. The FSDP decreases and almost vanishes with increasing pressure in neutron measurements while it gradually shifts to higher Q in X-ray data. This is interpreted as a breakdown of the intermediate range order upon compaction of the tetrahedral network associated with changes in the oxygen correlations. In the X-ray correlation functions, a reduction of the Ge − O distance is observed below 6 GP a while it increases at further pressure, corresponding to GeO4 tetrahedra being converted to GeO6 octahedra. Based on molecular dynamics simulations, it was argued that stable five-fold units are present in the transition region, indicating a new intermediate form of the glass. The structure of the high pressure glass is based on edge- and corner-shared octahedra, which is not retained upon decompression. GeO2 in the liquid state has been investigated by X-ray diffraction [40], [67]. The Ge−O distance is unchanged in agreement with a small thermal expansion of the Ge−O bond similar to that for Si − O bonds. The GeO4 tetrahedra are preserved in the GeO2 A at A at room temperature to 3.25 ˚ melt but Ge − Ge distances are shifted from 3.16 ˚ o 1100 c, which is interpreted as a widening of the Ge − O − Ge bond angle. 3.3. Raman Spectroscopy 3.3.1. GeO2 polymorphs The Raman spectra of the crystalline polymorphs of GeO2 (Figure 7) were first reported by Scott [68]. The rutile-like GeO2 spectrum exhibits three strong bands in the 150 − 1200 cm−1 range at 173, 701 and 873 cm−1 . The band at 701 cm−1 is the A1g mode while the 873 cm−1 band is the B2g mode. The B1g mode is at 173 cm−1 . The Eg mode observed at 680 cm−1 by Scott [68] is not observed in the spectrum shown in figure 7. Alpha-quartz-like GeO2 has a number of additional bands including four symmetric modes of A1 symmetry and 8 doubly degenerate modes of E symmetry all split into transverse optic (TO) and longitudinal optic modes (LO) [68]. The α-quartz-like GeO2 spectrum of figure 7 is comparable to that first obtained by Scott [68]. Bands can be assigned following Scott [68] and Dultz et al. [69] as A1 modes at 263, 330, 444, and 881 cm−1 ; E modes at 123 (TO+LO), 166 (TO+LO), 212 (TO), 330 (TO), 516 (LO), 593 (LO), 860 (TO), 960 (TO), and 973 cm−1 (LO). E modes at 372 (LO), 385 (TO), 492 (TO), 583 (TO) and 949 cm−1 (LO) are too weak to be observed in the spectrum or are unlabelled for clarity.
CONTENTS
13
Figure 6. In situ structure factors (after [66] for (A) X-ray diffraction at 0, 3, 5, 6, 7, 10, and 15 GP a (bottom to top) and (B) neutron diffraction up to 5 GP a, with ambient-pressure data from Sampath et al. [65].
Trigonal GeO2
873
960 973
860 881
593
516
330
263
173
213
583
123 166
Intensity (Arbitrary Units)
701
444
Raman Spectra of Trigonal and Rutile GeO2
Rutile GeO2
200
400
600
800
-1
1000
1200
Raman Shift (cm )
Figure 7. Unpolarized Raman spectra of the trigonal and rutile GeO2 polymorphs. Bands are comparable to those of Scott [68] and Madon et al. [31]. For clarity not all bands are labelled.
CONTENTS
14
The effects of increasing pressure and temperature on the vibrational spectra of the GeO2 polymorphs has been investigated by Sharma [70], Madon et al. [31] and Mernagh and Liu [71]. With increasing pressure the Raman bands for the α-quartz-like polymorph shift to higher wavenumber and behave in a similar manner as the IR modes [31]. The mean frequency shift is ≃ 1 cm−1 /0.1 GP a for bands in 400−600 cm−1 region, 0.3 cm−1 /0.1 GP a for the bands in the 100 − 330 cm−1 region and the bands in the 850 − 970 cm−1 region do not shift at all up to 4 GP a except for the band at 961 cm−1 . The rutile Raman bands behave slightly differently [70] with the band at ≃ 173 cm−1 shifting to lower wavenumbers and the other two bands to higher wavenumbers. With increasing temperature, the Raman bands of the rutile-like polymorph transform to the α-quartz-like spectrum at ≃ 1313 K [31] while the Raman bands of the α-quartz-like polymorph show a nonlinear shift with increasing T. Madon et al. [31] observed a shift of −0.01 cm−1 /K for the bands in the low frequency region and −0.024 cm−1 /K in the mid- and high-frequency regions. For the rutile polymorph, the Raman bands above 600 cm−1 exhibit nonlinear shifts to lower wavenumbers whereas the 173 cm−1 band exhibits a shift to higher wavenumbers with increasing T [71]. In addition Mernagh and Liu [71] detect (by deconvolution) splitting of the A1g mode (701 cm−1 ) of the rutile-like polymorph with a new band observed at 684 cm−1 . 3.3.2. GeO2 glass and liquid The first Raman spectrum of GeO2 glass was described by Bobovich and Tolub [72] and Obikhov-Denisov et al. [73]. A Raman spectrum for GeO2 glass is shown in figure 8a. The Raman band assignments for GeO2 glass are similar to those of SiO2 glass but are shifted to lower frequencies (wavenumbers, cm−1 ) because of the larger mass of Ge relative to Si. Currently accepted band assignments for GeO2 are given in Table 2 and extensive discussion of Raman assignments and earlier literature can be found in [74], [75]. The high frequency bands observed at ≃ 860 and 998 cm−1 are the TO and LO split asymmetric stretching bands of the bridging oxygens (Ge − O − Ge). The Ge − O − Ge bending modes are observed in the broad region between ≃ 500 − 620 cm−1 and have also been assigned to TO (≃ 556 cm−1 ) and LO (≃ 595 cm−1 ) split modes associated with significant Ge and O motion [76]. A ”defect” band D2 occurs at ≃ 520 cm−1 . This defect mode is the equivalent of the D2 band observed in SiO2 glass at 606 cm−1 and is assigned similarly to an oxygen-breathing mode associated with 3-membered rings of GeO4 tetrahedra and this assignment has been recently supported by the study of Giacomazzi et al. [58] (Fig. 8c). The intensity of this band is much stronger relative to the main vibrational band at ≃ 420 cm−1 in comparison to the equivalent bands for SiO2 glass. This indicates that the GeO2 network, while being composed predominantly of 6-membered rings of GeO4 tetrahedra (see above) does have a larger proportion of 3membered rings relative to SiO2 glass. The relatively narrow band at around 420 cm−1 is the symmetric stretching mode of the Ge−O−Ge bridging oxygens. Its width is much narrower than the equivalent band observed in SiO2 glass at 440 cm−1 and indicates that the distribution of Ge − O − Ge intertetrahedral angles for GeO2 glass is narrower
CONTENTS
15
Ge-O-Ge symmetric (BO)
Relative Intensity (Arbitrary)
GeO2 Glass
D2
Ge motion
Ge-O-Ge bending
Asymmetric Ge-O-Ge (BO)
200
400
600
800
Raman Shift (cm-1)
1000
b
a
c
GeO2 Glass
Relative Intensity (Arbitrary)
HH-GeO2
200
400
600
800
1000
Raman Shift (cm-1)
Figure 8. a) Unpolarised Raman spectrum of GeO2 glass showing the main vibrational bands, b) a Raman spectrum of a Li2 O-containing germanate glass showing the high frequency BO and NBO bands: The insert is a curve fit (deconvolution) of the high frequency envelope into its discrete vibrational bands (see table 2), c) Unpolarised Raman spectrum of GeO2 glass (solid line) compared with calculated HH spectrum of GeO2 glass (dashed-dot line) from Giacomazzi et al. [58]. The calculated spectrum has been shifted so that the main vibrational band is coincident with the equivalent band of the experimental spectrum.
CONTENTS
16
Frequency
Attribution
≃ 60 cm−1
Boson peak; Acoustic mode? Related to glass fragility
347 cm−1 (D1)
Ge ”deformation” motion within the network
420 cm−1
Symmetric stretching of bridging oxygens (BO) in 6-membered GeO4 rings: Ge-O-Ge
520 cm−1 (D2)
”Defect” mode assigned to breathing motion of bridging oxygens in 3-membered GeO4 rings
500 − 620 cm−1
Bending modes: Ge-O-Ge, TO (556 cm−1 ) and LO split (595 cm−1 )
≃ 860 cm−1
TO asymmetric stretching of bridging oxygens: Ge-O-Ge (Q4 )
≃ 988 cm−1
LO asymmetric stretching of bridging oxygens: Ge-O-Ge (Q4 )
Q species vibrations NBO (non-bridging oxygen) vibrations that occur upon addition of network modifiers such as alkalis ≃ 865 cm−1
Q3 GeO4 tetrahedra with 3 BO and 1 NBO
780 cm−1
Q2 GeO4 tetrahedra with 2 BO and 2 NBO
Table 2. Raman band assignments for GeO2 glass and for the different Q species observed upon addition of a network modifier such as an alkali or alkaline-earth cation.
than that for SiO2 glass consistent with the neutron and X-ray data above. The origin of the Boson peak (BP) at 60 cm−1 (the peak occurs over a broad range between 40 − 60 cm−1 ) remains controversial. It has been assigned to acoustic-like harmonic modes, localized quasi-harmonic modes, and to the smallest energy van Hove singularity of the crystal (cf. [77], [78] and references therein). Most recently there seems to be a consensus that the origin of the BP is due to optic-like excitations related to nearly rigid SiO4 (or GeO4 ) librations through hybridization of the acoustic waves [79]. It exhibits a dependence on the fragility of the glass (fragile glasses have weak BP intensity), as well as, fictive temperature (for SiO2 the BP shifts to higher wavenumber with increasing fictive temperature). In addition, there is a monotonic frequency shift in the BP for pure SiO2 , to lower wavenumbers with the addition of GeO2 which may
CONTENTS
17
indicate that GeO2 substitutes isomorphously into SiO2 [78]. The Raman spectrum of GeO2 glass indicates that the T-O-T intertetrahedral angle and its distribution are narrower for GeO2 glass relative to SiO2 glass, consistent with the X-ray and neutron diffraction studies (see above). These latter studies also suggest that the medium-range structure of GeO2 glass consists of 6-membered rings of GeO4 tetrahedra, similar to those observed in the α-quartz polymorph of GeO2 , with a high proportion of small 3-membered GeO4 rings (relative to SiO2 glass). An interesting aspect of the medium-range structure was raised by Henderson et al. [74] and Henderson and Fleet [75] using Raman spectroscopy. They suggested that the mediumrange structure of GeO2 may actually consist of 4- rather than 6-membered GeO4 rings. This suggestion has not been explored further and there have not been any X-ray or neutron scattering studies that have compared GeO2 glass with structures containing predominantly 4-membered GeO4 rings. However, Giacomazzi et al. [58] recently used a model GeO2 structure that had exclusively 3 and 4-membered GeO4 rings. Their model reproduced the first sharp diffraction peak in the neutron static structure factor (indicative of medium range structure), and the infrared and Raman spectra of GeO2 glass (Figure 8c) reasonably well. The question of whether or not the medium-range structure of GeO2 glass consists of 6- or 4-membered rings remains unanswered and open for further studies. 3.4. Infra Red (IR) spectroscopy There have been relatively few infra-red studies of GeO2 glass primarily because the IR spectra are more difficult to interpret and obtain than the Raman spectra. One of the earliest is that of Kaiser et al. [80] while more recent studies have tended to use IR in high-pressure studies [81] for investigating the onset of amorphous to amorphous phase transitions (see below). The IR spectrum of GeO2 glass exhibits two peaks at 560 cm−1 and one at ≃ 870 cm−1 with a shoulder at ≃ 1000 cm−1 although the relative intensities for these two bands are reversed in the spectra of Galeener et al. [82]. The low frequency band at 560 cm−1 is the IR equivalent of the LO bending mode observed in the Raman spectrum at ≃ 595 cm−1 while the bands at 870 cm−1 and ≃ 1000 cm−1 are the IR equivalent TO (870 cm−1 ) and LO split asymmetric stretching of the bridging oxygens [82]. The data of Galeener et al. [82] also show a peak in their IR reflectance spectrum at ≃ 340 cm−1 which is the equivalent of the 347 cm−1 Raman band. Galeener et al. [82] assign this band however to an LO mode. In general the LO modes are more intense in the IR relative to Raman spectra while the TO modes are more intense in the Raman relative to IR spectra. With increasing pressure, the 560 and 870 cm−1 peaks broaden and the region between the bands (≃ 700 cm−1 ) exhibits an increase in intensity [81], although part of this increase is due to a shift in the 560 cm−1 band to higher wavenumbers with increasing pressure (up to 6 GP a). Teredesai et al. [81] also observe with increasing pressure a decrease in wavenumber for both high wavenumber bands. Above 6 GP a,
CONTENTS
18
all bands shift to higher wavenumbers coincident with the onset of the pressure induced coordination change of Ge noted by Iti´e et al. [8]. However glasses decompressed from 9.5 GP a exhibit a 30 cm−1 red shift in the position of the 870 cm−1 peak with no shift in position of the 560 cm−1 peak [81]. 3.5. Increasing Pressure and Temperature The effect of pressure on GeO2 glass at ambient temperature has been investigated by Ishihara et al. [83] and in situ by Durben and Wolf [84] and Polsky et al. [85]. Up to 6 GP a, Durben and Wolf [84] observe a shift of the main Raman band at ≃ 420 cm−1 to higher frequency with concomitant broadening and loss of intensity. Between 6 and 13 GP a the main Raman band broadens and losses intensity without a shift in frequency. In addition they observe the growth of a broad low frequency band at ≃ 240 cm−1 and no further spectral changes are observed beyond 13 GP a up to 56 GP a. However, upon decompression, the 520 cm−1 D2 band characteristic of 3-membered rings is enhanced relative to uncompressed GeO2 glass and indicates that 3-membered rings are formed during decompression from high pressure. Similar results were obtained by Polsky et al. [85] and both they and Durben and Wolf [84] observe subtle changes in the Raman spectra between 5 and 10 GP a characteristic of the pressure induced change in Ge coordination observed by in-situ EXAFS and XANES studies [8]. Up to 5 GPa, both Durban and Wolf [84] and Polsky et al. [85] suggest that compression of the GeO2 glass network is taken up be tetrahedral deformation with a smaller decrease in the intertetrahedral angle. In addition, they conclude that there is no increase in intensity of the 520 cm−1 D2 band. However, this conclusion is questionable given that the main Raman band at 420 cm−1 appears to move to higher wavenumbers with increasing pressure (above 4 GP a) and as Polsky et al. [85] themselves note, any apparent decrease in the intensity of the 520 cm−1 band may simply be a consequence of changes in the adjacent band at 420 cm−1 . Examination of Figure 2 of Durben and Wolf [84] shows that above 3.7 GP a the 420 and 520 cm−1 bands are merged and individual bands are unable to be discriminated. Below 3.7 GP a, the intensity of the D2 band also cannot be determined without some knowledge of how the spectra have been normalized but a cursory examination appears to indicate that the D2 intensity has increased relative to the maximum in the main 420 cm−1 band. Furthermore, Ishihara et al. [83], albeit using permanently densified GeO2 glasses, note that growth of the D2 band correlates with increasing pressure; higher pressures produce increased D2 intensity although there are no permanent structural changes for glasses decompressed from below 4 GP a [85]. High temperature studies have been performed by Magruder III et al. [86] and Sharma et al. [87]. With increasing temperature Magruder III et al. determined that the high frequency TO/LO split pair undergo a 2-fold loss of intensity between 1723 and 2023 K and that the D2 band intensity remains constant. The high frequency LO band at 988 cm−1 (figure 7a) loses intensity as the TO/LO splitting is lost with increasing
CONTENTS
19
temperature [87] but even in the melt phase two bands are observed at ≃ 818 and 940 cm−1 , respectively. However, Sharma et al. [87] observed an increase in intensity of the D2 band and a shift of the main Raman band at 420 cm−1 to higher wavenumbers combined with a loss of intensity while the low frequency band at 347 cm−1 shifts to lower wavenumbers but is observed up to 1623 K. Both studies clearly show that the Raman bands observed in GeO2 glass remain even in to the melt phase but that there are subtle changes in intensities and band positions as the glass is heated and eventually melts. 3.6. NMR spectroscopy The coordination environment of Ge in GeO2 and alkali-containing GeO2 glasses remains an area of intense interest from a glass perspective because of the unusual physical properties of alkali-containing germanate glasses and the possible role of Ge coordination in this behaviour [75], [88]. Ge NMR would normally be the technique of choice to investigate the coordination environment of Ge in glasses. Germanium has five naturally occurring isotopes (70 Ge, 72 Ge, 73 Ge, 74 Ge and 76 Ge) but only 73 Ge is suitable for NMR studies. However, while 73 Ge NMR has been successfully performed on solid crystalline compounds [89], [90], [91] it has not been useful for elucidating the structure of glasses [92], [93]. The 17 O MAS NMR spectra of GeO2 glass, and the α-quartz-like and rutile-like polymorphs of crystalline GeO2 have been obtained by Du and Stebbins [93]. The two crystalline polymorphs and GeO2 glass all exhibit a single crystallographic oxygen site similar to previous data obtained at lower magnetic fields [94]. The oxygen site in the GeO2 glass is comparable to that found in the α-quartz-like GeO2 polymorph indicating that the glass consists of a network of GeO4 tetrahedra, consistent with Xray and neutron scattering studies. 4. Structure of densified liquid GeO2 Melting curves at elevated pressures were first reported by Jackson [95] in the range 1100 − 1700oC and 0.5 − 2 GP a. The high-temperature part of the phase diagram was also studied in [96] where an observed flatening of the melting curve at P ≃ 2 − 4 GP a seems to be an indication of densification of the melt due to the transformation of a quartz-like liquid into a rutile-like one. Ordering of the melt structure in the same range of temperatures and pressures as above was also reported [97] from Raman scattering. Specifically, the lowering of the Raiyleigh line intensity from in situ high pressure and temperature liquid Raman spectra was found to be significantly lower than for a glass quenched at ambient pressure. This suggest an increased degree of short-range order on compression in the liquid and a more ordered network structure. However, it constitutes a major obstacle to studying liquid GeO2 at elevated pressures. Note that Moelcular Dynamics has not tried to simulate
CONTENTS
20
these experiments yet (see below). 5. Structure of the binary SiO2 -GeO2 glasses Germania and silica are prototype glasses for continuous random network models, based on the corner sharing connection of their SiO4 and GeO4 tetrahedra. The variations in the intertetrahedral angles and the presence of some structural defects (for instance dangling bonds in SiO2 glass) allows the formation of a three dimensional disordered network. Germanosilicate glasses are widely used as low-attenuation optical fibers, yielding numerous studies on their physical (optical) properties [98]. Structural studies are more scarce despite the need for an understanding of the relationship between glass properties and structure, particularly with respect to variation of the local site geometry, intertetrahedral angles, ring statistics and their relationship to chemical ordering, clustering and/or substitution. A fundamental question is to determine whether or not germanosilicate glasses form a homogeneous network or if there is some sort of clustering or phase separation. 5.1. EXAFS and X-ray scattering An early Ge K-edge EXAFS investigation [99] on 12.5GeO2 − 87.5SiO2 and 36.5GeO2 − 63.5SiO2 glasses calculated a Ge − O distance of 1.73 ± 0.01 ˚ A but no second neighbors were observed. A more extensive study using a combination of Ge K-edge X-ray absorption and wide angle X-ray scattering (WAXS) experiments were carried out on GeO2 − SiO2 glasses containing 16 − 36 mol% GeO2 [100]. They showed that the XANES spectra are similar with increasing GeO2 content and that EXAFS-derived distances are 1.72 ± 0.02 ˚ A for Ge − O. A Ge coordination number of 3.9 ± 0.2, consistent with Ge in tetrahedral sites as in vitreous GeO2 , and a mean Si−O distance of 1.62 ˚ A consistent with Si remaining tetrahedrally coordinated, were obtained from their WAXS data. These results seem to be contradicted by a high energy X-ray diffraction study on a 29GeO2 − 71SiO2 composition glass [101] that found a mean coordination number for Si and Ge of 3.4 ± 0.05. The authors explain this low coordination number by proposing that a considerable number of Ge atoms are connected with less than four oxygens or are highly distorted. Except for the latter study whose coordination number seems questionable, all structural studies are consistent with the presence of SiO4 and GeO4 tetrahedra in binary SiO2 − GeO2 glasses. The first peak observed in the X-ray radial distribution function is at higher distance A than would be expected assuming standard Si−O and Ge−O distance (1.62 and 1.72 ˚ respectively for tetrahedral environment [100]). This suggests that the binary glasses are not a simple physical mixture of SiO2 and GeO2 oxides. In germanosilicate glasses, no GeO2 clusters are observed and GeO4 tetrahedra are thus part of the SiO2 network. This is confirmed by the second shell of neighbors that has been observed in EXAFS data
CONTENTS
21
[100]. Indeed, this peak corresponds to Si and/or Ge neighbors and both its position and its intensity vary upon Si/Ge substitution. Ge atoms can thus be accommodated within the SiO2 network. Intertetrahedral angles were calculated from EXAFS and WAXS data and are between 139 − 149o, which is closer to 144o for SiO2 glass (albeit the magnitude of this angle remains controversial, cf. [102] than 133o for GeO2 glass. This suggests that at low GeO2 content, the Ge environment is constrained by the silicate network. These results are consistent with a substitutional model in which Ge substitutes randomly for Si in the vitreous SiO2 network with little Ge clustering. A random substitution model is further supported by recent 17 O multiple quantum NMR spectra on GeO2 − SiO2 binary glasses which show peaks for all three types of bridging oxygens (Ge − O − Ge, Ge − O − Si, Si − O − Si), in proportions at least roughly consistent with random mixing of the tetrahedral cations [103]. The binary SiO2 − GeO2 glass structure can be described by a continuous random network of corner sharing GeO4 and SiO4 tetrahedra. 5.2. Raman spectroscopy Information at the medium range structure such as ring statistics and the ordering of Si and Ge atoms, have been primarily obtained by Raman spectroscopic investigations of germanosilicate glasses. Important modifications appear between the Raman spectra of pure GeO2 and SiO2 and some specific structures are present in the spectra of the binary glasses. The band at low frequency shifts from 437 cm−1 in SiO2 to 416 cm−1 in GeO2 and becomes sharper [104]. This band is attributed to the T-O-T (T=Si or Ge) symmetric stretching mode and is thus characteristic of the distribution maximum in the T-O-T intertetrahedral angles [105]. Therefore, it can be concluded that the fluctuation in the intertetrahedral angle decreases as GeO2 is introduced into the silica network. A complete Raman study from pure SiO2 to pure GeO2 was carried out by Sharma et al. [104] in order to characterize the distribution of SiO4 and GeO4 tetrahedra. In the germanosilicate glasses, a weak band in the range 970 − 1010 cm−1 appears that is not present in pure SiO2 or GeO2 glasses. This band is attributed to the antisymmetric stretching motion of the bridging oxygen of Si − O − Ge linkages, while the corresponding modes for the Si − O − Si and Ge − O − Ge linkages appear at ≃ 1110 cm−1 and ≃ 880 cm−1 , respectively. The position of the band is at ≃ 1000 cm−1 for the 10GeO2 − 90SiO2 glass but decreases to ≃ 920 cm−1 for the 90GeO2 − 10SiO2 glass. This shift in position towards lower frequency is attributed to a decrease in the Si − O − Ge bond angle in the GeO2 -rich glasses [104]. In the 50GeO2 − 50SiO2 glass, the bands at 1100 and 880 cm−1 are stronger than the one at 980 cm−1 . This indicates the formation of Si − O − Ge bonds but also the existence of an important number of Si − O − Si and Ge − O − Ge linkages. According to these authors, the Si/Ge ordering is likely non-ideal, which supports a random distribution of SiO4 and GeO4 tetrahedra (see comment above regarding 17 O NMR). In a Molecular Dynamics simulation of a
CONTENTS
22
50GeO2 − 50SiO2 glass [106], a large fraction of Ge − O − Si bonds were found, as well as, Ge−O −Ge and Si−O −Si linkages. Based on the simulations, Bernard et al. [106] proposed that Ge/Si ordering occurred but not to the extent that phase separation was evident. They also showed that non-bridging oxygens (5%) were mainly localized in the Ge environment. With a small addition of GeO2 , the D1 and D2 lines of SiO2 glass at 495 and 606 cm−1 , attributed to four-membered and three-membered rings of the SiO4 tetrahedra in vitreous silica, are still observed but the intensity of the D1 line decreases sharply, while that of the D2 lines decreases slowly and broadens [107]. Nian et al. [107] suggested that the substitution of Ge for Si in the vitreous SiO2 network prevents the formation of these ring structures. This was explained by the disruption of the fourfold and threefold SiO4 rings to accommodate the larger GeO4 tetrahedra that distort the silicate network. Alternatively, the decrease in intensity of D1 and D2 lines could also be due to a change in polarizability of the Si − O bonds as Ge pulls electron density away from O attached to Si, which is an explanation more consistent with the preference for 3-membered rings in GeO2 relative to SiO2 as indicated by diffraction and Raman data (see above). With small addition of GeO2 , a new band appears at 710 cm−1 but its assignment is not clear [107]. Above 15 mol% GeO2 content, weak and broad shoulders are exhibited at ≃ 568 and ≃ 670 cm−1 and the band at ≃ 800 cm−1 decreases in intensity [104]. 5.3. Evolution with pressure The Ge coordination change in the tetrahedral framework SiO2 − GeO2 glasses is a reversible process that has to been studied by in situ high-pressure XAS measurements at the Ge K-edge [108]. The pressure-composition diagram in Fig. 9 shows the existence of three regions with distinct short-range structures. At low pressure, the region corresponds to a tetrahedral framework structure (T domain), then, an intermediate domain with a mixture of different sites, while, at higher pressure, the Oc region corresponds to a structure with [6] Ge. The [4] Ge to [6] Ge transformation is a reversible with an important hysteresis (a return back to the tetrahedral site below 4 GP a). The coordination change is dependent on the mean composition of the glasses and extends over higher-pressure range when the SiO2 content increases. The remarkable dependence of the Ge coordination change on the SiO2 content shows that the Ge local structure is strongly affected by Si. The disruption of the SiO2 tetrahedral network begins at 10 GP a, as evaluated by Raman spectroscopy [85], which is similar to the XAS data at high SiO2 content and indicates that Ge and Si convert to a sixfold coordination state simultaneously. This result suggests that the pressured-induced transformations occur homogeneously in the mixed network and may be driven by the oxygen atoms rather than by the Ge or Si atoms [85]. Indeed, in such fully polymerized networks, oxygens increase their coordination from two to three in the transformation. The transformation occurs at higher pressure and over a broader pressure range when the SiO2 content
CONTENTS
23
Figure 9. Pressure-composition diagram of the SiO2 − GeO2 glasses (after [108]) depicting the pressure-induced Ge coordination change. The horizontal dashed line separates the pressure-range explored. Diamonds are the pressure onsets of the coordination change and the dashed curves delimit the intermediate domain separating the low-density form (T for tetrahedral) and high-density form (Oc for octahedral).
increases. A careful analysis of both XANES and EXAFS signals supports a model of a mixing of [4] Ge and [6] Ge states in the transition region, in agreement with a kinetically hindered first-order process for the transformation at room temperature. 6. Molecular simulations and theoretical approaches 6.1. Force field parameters Several force field potentials have been proposed to describe either the crystalline phases of GeO2 or amorphous germania. All these potentials contain a long range Coulombic part, along with a short-range repulsive term and an additional van der Waals-like term Vij (rij ) =
Cij Zi Zj e2 + Aij e−rij /ρij − 6 rij rij
(1)
where Zi is the charge on ion i. The parameter ρij serve to determine the steepness of the short range repulsive potential and is known as the ”softness” parameter. The parameters Aij and Cij serve to adjust the positions of the first peak in each possible radial distribution function to experimental findings. Oeffner and Elliot [109] have fitted equ. (1) to obtain cell parameters, density and elastic constants of the trigonal α-quartz like and tetragonal rutile-like phases of GeO2 . Bond angles and bond lengths in both the
CONTENTS
24
low and high pressure phases are found to agree with experimental findings. The Raman and Infrared vibrational spectra are also simulated within the harmonic approximation using the bond-polarizability model of Long [110]. Analysis from the vibrational density of states of Ge − O − Ge motions shows that for α-quartz-like GeO2 , symmetric and asymmetric bending motions are mostly confined to medium and low frequency bands while symmetric stretching and bending motions can be reasonably simulated at the anticipated frequencies. Matsui and co-workers [111] have used the same kind of approach, i.e. the fitting of equ. (1), to simulate another structural phase transition, namely the pressure induced change from α-quartz-like GeO2 to rutile-like GeO2 which happens at 7.4 GP a. The structure obtained at this pressure appears to be quite similar to the structure calculated for SiO2 at 21.5 GP a [112]. Furthermore it is shown that α-quartz-like GeO2 close to the transition is mechanically unstable as some of the elastic moduli of the lattice become negative. Specifically, the decrease of the transverse elastic constant C44 leads to an unstable shear that originates the transformation to the rutile-like structure. For increased pressures, a post-rutile-like structure is found [11] that has a CaCl2 -like structure which consists of tilted GeO6 octahedra. This appears to be in agreement with Brillouin scattering results of α − GeO2 under pressure [113] which show that the shear constants are largely softened with respect to SiO2 and can be related to shear instability. More recently, an alternative model has been proposed by Van Hoang [114] for liquid and amorphous germania that is based on a Morse-like potential in a similar manner to the potential given by Kim for GeO2 [115]. We discuss below the structural predictions of the Van Hoang potential. For completeness, we mention also the model potential proposed by Nanba [116] to account for GeO2 − P bO − P bF2 glasses. However, it appears to show poor agreement with the rutile-like properties of GeO2 . Topological and geometrical approaches have also been proposed [117] in order to generate continuous random network models of GeO2 that reproduce the experimental density, bond angle distributions and neutron scattering data [35]. Araujo has used statistical mechanical techniques [118] to calculate the density of oxygen vacancies in GeO2 and the absorption coefficient with respect to temperature. 6.2. Simulation of liquid and amorphous germania Most of the work using the effective potentials described above, has been devoted to the description of the high temperature liquid where experimental data is lacking. Gutierrez and Rogan [119] have simulated GeO2 at 1500 K and 3000 K. At these temperatures, the system seems to be made of slightly distorted GeO4 tetrahedra which are linked by corners and have a Ge − O − Ge angle of 130o, similar to the experimental value in the amorphous phase (GeO2 glass). A volume collapse, in the range 4 − 8 GP a, is seen from the pressure-volume curve and may be the signature of a liquid-liquid phase transition, in analogy with water [120]. Van Hoang has carried out a similar study
CONTENTS
25
T(r) [arb. units]
20
10
0 0
2
4
6
8
10
gGeGe(r)
4 3 2 1 0
2
4
6
8
10
12
2
4
6
8
10
12
2
4
6 r [A]
8
10
12
gGeO(r)
15 10 5 0 5 gOO(r)
4 3 2 1 0
Figure 10. Upper panel: Simulated (dashed) Neutron structure [59] factor T (r) compared to experimental findings [57]. Lower panels: Partial structure factors of 300 K amorphous GeO2 using the Oeffner-Elliot (solid line) [109] and the Morse-like potential (broken line) [114].
CONTENTS
26
[121] under the same kind of conditions, i.e. in the high temperature (5000 K) liquid with changing density, and has suggested that a diffusion maximum should be attained for a density of about 5 g/cm3. This anomaly appears to be produced by competition between the breakdown of the tetrahedral network structure leading to an increase in atomic mobility, and the packing effects arising from densification that tend to reduce the mobility. The simulated structure of liquid GeO2 and SiO2 appears to be very similar when the partial atomic correlation functions are properly rescaled [122]. Micoulaut, Guissani and Guillot [59] have used the Oeffner-Elliot potential to study the glass and liquid phases and which allows comparison with experiments. In the glass, the structural properties can be simulated relatively well, even though some structural limitations of the potential appear. While the first structural peak due to Ge − O interactions can be modelled very well at the expected distance of 1.72 A, as can the O − O distance at 2.81 ˚ A, the Ge − Ge correlations appear to be slightly overestimated A) with respect to experimental values. This overestimation leads to a larger (3.32 ˚ calculated value for the intertetrahedral angle than that obtained experimentally; 159o versus 130o, respectively. It is now well known that simple ionic potentials such as the ones reported above [109], [11] results in Ge−O−Ge angles that are too wide, a situation that has been encountered and reported already for amorphous silica [123]. However, the absence of any Ge − Ge interaction in the effective Oeffner-Elliot potential, except in the Coulombic term, may be responsible for the increased distortion in germania with respect to silica. In spite of these deficiencies, the simulation correctly describes the structure factor S(Q) and the partial structure factors Sij (Q) (Figure 5) and allows one to infer the origin of the first sharp diffraction peak (FSDP) as mostly arising from Ge − Ge correlations. However, overall the potential is found to reproduce the features of neutron scattering functions (Figure 10) reported by different groups [35], [57]. Simulation using a Morse-like potential [114] provides a somewhat better agreement with the experimental partial atomic correlation functions (Figure 10) as the Ge − Ge distance is found to be 3.21 ˚ A at 300 K with correct bond angles (θO−Ge−O = 108o and θGe−O−Ge = 133o) whereas both Ge−O and O −O distances are slightly underestimated (1.69 ˚ A and 2.78 ˚ A respectively) relative to experimentally derived values. 6.3. Glass transition problem of strong glasses Enthalpy and glass transition temperature can be simulated rather well [59] with respect to calorimetric measurements [124]. With the Oeffner-Elliot potential, a Tg of 900 K, is found from the inflexion point of the potential energy. This value is close to the experimental derived Tg (850 K, [125]). This appears to be rather unusual as MD simulations on similar systems [126], [127] predict much higher glass transition temperatures than the corresponding experimental ones. This is partially due to the high quench rates applied. In the present simulated systems, onset of slow dynamics at the nanosecond scale occurs in the same range of temperatures (920 K) which corroborate the calculated Tg from the inflexion point of the energy profile.
CONTENTS
27 1×10
-8
Ge O -9
2 -1
D [m s ]
1×10
1×10
EGe=1.20 eV
-10
1×10
EO=1.12 eV
-11
0.4
0.5
0.6
0.7 0.8 3 -1 10 /T [K ]
0.9
1
Figure 11. Simulated diffusion for germanium and oxygen using the Oeffner-Elliot potential [59].
When put in contrast with silica, a more careful inspection of the self-diffusion coefficient D with respect to the viscosity behaviour [128] shows that the agreement between the simulated and experimentally measured Tg reveals an underlying failure of the simulation technique. The self-diffusion coefficient D is computed from the meansquared displacement of the germanium and oxygen atoms, and shows Arrhenius like behaviour D = D0 exp[Ei /T ] at low temperatures, whereas at higher temperatures (T > 1600 K) some curvature appears (Figure 11), similar to that found for molten silica [129]. However, the calculated oxygen diffusion constant for GeO2 at 1440 K is several orders of magnitude larger than the reported data for oxygen diffusion (DO = 7 × 10⁻¹⁴ m2.s−1 , [130]). A predicted diffusion D constant from viscosity data η using the Eyring relation kB T /ηD = λ (where λ is a hopping length of about several Angstroms, [131]) shows that both silica and germania overestimate the diffusion constants with respect to their simulated Tg ’s thus allowing the system to remain in a liquid-like behaviour to lower temperatures. This underscores both the limitation of the employed potentials and the size of the simulated systems (actually up to several thousands atoms) to accurately describe the glass transition of strong glass formers. 6.4. Equation of state The equation of state (EOS) of GeO2 has been reported by different authors, either on the basis of simulations [119] or from empirical models based on simple structural arguments [132]. In the latter, Smith and co-workers have shown that a two state function, taking into account the effect of the tetrahedral and octahedral character at low and high pressures, is able to describe the experimental equation of state at 300 K, whereas molecular dynamics simulations only succeed in simulating the EOS in the low
CONTENTS
28
pressure range. At higher temperatures and higher densities, Gutierrez and Rogan [119] have shown that for simulated GeO2 in the 3.5 − 5.6 g/cm3 and T = 1500 − 3000 K range, pressure displays a monotonic decrease with molar volume. In the same context, a Birch-Murnhagan type [133] of EOS has been used [59] to fit a set of 269 simulated state points in the thermodynamic diagram. The method allows the extraction of the isothermal compressibility κT as a function of temperature and density for density ranges lying between the ordinary glass density at 300 K (ρ = 3.66 g/cm3 , [67]) and about 2.5 g/cm3 . Progressive deviation of the Birch-Murnhagan EOS with respect to the simulated thermodynamic points appear for ρ < 2.5 g/cm3 at high temperatures. At 2000 K, the computed compressibility (κT = 9.13 × 10⁻¹¹ P a−1 ) is rather close to the experimentally measured value of Dingwell et al. (κT = 12.4 × 10⁻¹¹ P a−1 , [134]). Micoulaut and Guissani [59] have used a Direct Molecular Dynamics Method [135] to follow the equation of state at zero pressure, in order to predict the liquid-vapor coexistence curve of germania on the low (vapour) and high density (liquid) side in order to compare it with experimental results in the liquid up to 1440 K [67]. Furthermore, the method highlights the quality of the effective potentials employed at low temperature. At zero pressure and low temperature (300 K), the density of a simulated Oeffner-Elliot GeO2 glass [109] is indeed 3.70 g/cm3 whereas the density of a simulated GeO2 glass using an alternative potential [11] substantially disagrees with the experimental low temperature density of the liquid (ρ = 4.25 g/cm3 as compared to the experimental ρ = 3.66 g/cm3). Note however that this potential was used to study pressure induced rigidity in GeO2 (see below, [136]) and the density at zero pressure was found [137] to be 3.9 g/cm3 , i.e. much closer to the experimental value. The thermal history of the simulation appears therefore to be crucial in this case. Using a Wegner type expansion [138], a critical point for germania is predicted and is located at Tc = 3658 K, ρc = 0.59 g/cm3 and Pc = 40 MP a [139]. For the Tsuchiya potential [11], the location of the critical point seems to be much higher in temperature [140]. This shift may arise from the increased charges used in the effective potential. 6.5. Pressurized germania The application of pressure to amorphous germania seems to affect the structure stepwise. Experimentally a jump in bond distance from 1.72 ˚ A to 1.86 ˚ A is observed at around 9 GP a, signalling the conversion of tetrahedral to octahedral local structure as already described. However, numerical simulations show [60], at least in the low pressure range, that this conversion is somewhat more subtle. For pressures up to 2 GP a, long-range correlations are reduced, as seen from the shift to higher wave vector of the position of the FSDP; similar to experimental observations [141]. In addition, a reduction is observed in the intertetrahedral bond angle (Ge − O − Ge) and then for P = 3 GP a a sharp distortion of the GeO4 tetrahedron occurs (Figure 12). These results are accompanied by a global increase in the number of oxygen neighbours in the
CONTENTS
29
160
0.68
0.66
140
0.64
120 GeO2 SiO2
0.62
0
10 5 15 Pressure [GPa]
O-Ge-O
0
Mean bond angle
δX=dX-O/dO-O
Ge-O-Ge
100
10 5 15 Pressure [GPa]
Figure 12. Local structure of germania with applied pressure [60]. Right panel: Distortion parameter δX of regular GeO4 and SiO4 tetrahedra, as a function of applied pressure (X = Ge, open triangles). For comparison, the same parameter for SiO2 (X = Si, filled triangles) is shown. The broken horizontal line represents the value of p the perfect tetrahedron δ = 3/8. Right panel: Mean bond angles Ge − O − Ge and O − Ge − O with respect to compression (open and filled symbols) and decompression (broken curves).
vicinity of a germanium atom that parallel the increase in density [59]. Sharma and co-workers [142] have studied both the pressure induced structural changes of the α-quartz-like GeO2 polymorph and amorphous GeO2 using the OeffnerElliott potential in the (N,P,T) ensemble. The results show that both the average bond distance (Ge − O) and the average Ge coordination in α-quartz-like GeO2 undergo a sharp change at around 8 GP a under compression, similar to the experimental findings of Iti´e et al. [8]. On decompression, the denser phase transforms back to a lowerdensity phase at ≃ 2 GP a. The details of the number of oxygen neighbours around a Ge atom shows however, that the high density phase is not fully six-fold coordinated, as about 15% five-fold and 20% four-fold germanium can be found (Figure 13). Less abrupt changes are expected for vitreous GeO2 (Figure 13) where a majority of six-fold germanium only occurs for pressures larger than 20 GP a. The structural changes with pressure are more dramatic in liquid (1650 K) GeO2 as a sudden loss of five-fold germanium atoms and an almost six-fold coordinated structure is obtained for pressures larger than 12 GP a. Finally, it appears that the evolution of the intermediate range order with pressure or density is selective as MD simulated ring statistics [143] show that rings with more than six germania tetrahdera tend to disappear for densities larger than 5 g/cm3 whereas the growth of edge-sharing GeO6 octahedra signals a behaviour similar to T iO2 .
CONTENTS
30 1
α-quartz
0.8 0.6 0.4
4 5 6
% abundance Ge-O coordination
0.2 0 0
5
10
15
20
25
30
1
glass
0.8 0.6 0.4 0.2 0 0
5
10
15
20
25
30
1 0.8
liquid 1650 K
0.6 0.4 0.2 0 0
5
10
20 15 Pressure P [GPa]
25
30
Figure 13. Calculated variation with pressure [142] of the fractional abundance of Ge coordination in the α-quartz-like GeO2 polymorph, glassy (300 K) and liquid GeO2 (1650 K).
6.6. Pressure induced rigidity and intermediate phases Trachenko et al. [144], [145] have been investigating the network rigidity of GeO2 and SiO2 under pressure. Rigidity usually appears when the number of mechanical constraints per atom, arising from interatomic interaction (mostly bond stretching and bond bending) becomes greater than the number of degrees of freedom [146]. In network glasses, this is generally achieved by the addition of cross-linking elements such as germanium into a basic flexible structure containing e.g. selenium chains. This leads to an increase of the network mean coordination number r¯ (and to the increase of constraints) and produces a stiffening of the structure and ultimately a floppy to rigid
CONTENTS
31
Relative volume change (%)
0
Expt. SiO2 MD SiO2 MD GeO2
-2
-4
-6
-8
0
2
4 6 Pressure P [GPa]
8
10
Figure 14. Relative variation in volume in GeO2 and SiO2 glasses under pressure compared with experiments on SiO2 [136].
transition. The onset of rigidity and the way it percolates has been documented for various glass-forming systems. In recent years however, a reversibility window [147], [148] has been discovered located between the floppy and rigid phases, and which manifests itself by the loss of irreversibility (and hysteresis) of the heat flow when cycling through the glass transition temperature region. A similar state can be found in glassy GeO2 and SiO2 under pressure. Pressure induced rigidity in GeO2 glass using MD simulations has been addressed recently [136]. Here the increase in connectivity (or mean coordination number r¯) is achieved with the increase of the glass density or the application of pressure that produces a tetrahedral to octahedral conversion. Thus pressure introduces locally rigid higher-coordinated units in an otherwise flexible tetrahedral network of GeO4 tetrahedra. Densification with temperature under pressure can take place in a pressure window, centred around the rigidity percolation transition. The density change is about 7%. This new effect has been rather well documented for silica [144], [145] and compared successfully with experimental results, [149] and additional simulations showing the loss of low frequency modes in the effective vibrational densities of states at the same pressure where densification occurs. However, it has only been shown that the pressure window in germania is centred around 0.5 GP a, i.e. considerably lower than for silica (5 GP a) (Figure 14). However, it is another signature of the increased sensitivity to pressure change of GeO2 with respect to SiO2 . Indeed, the tetrahedral to octahedral conversion of amorphous SiO2 manifested by the jump in Si − O bond distances is found to be around 13 GP a [150] whereas the same jump is found to be at 8 GP a for GeO2 glass [8]. It is therefore not surprising at all that onset of rigidity manifests at lower pressures in GeO2 .
CONTENTS
32
6.7. Ab initio studies of c-GeO2 and germania One way to circumvent the possible failures of the above mentioned semi-empirical potentials, is the use of ab initio methods, especially under extreme conditions where the potentials are not necessarily reliable. Hafner and co-workers [19] have studied the high-pressure transformations up to 70 GP a of crystalline GeO2 , using density functional theory with a pseudopotential method, and a local density approximation. It appears from this computation that several high-pressure phases can exist in GeO2 which are a tetragonal CaCl2 type at 40 GP a, an alpha − P bO2-type at 40 GP a and finally a pyrite-type crystal at 70 GP a, similar to those observed experimentally (see above) (Figure 3). These transformations highlight the analogy of the phase transition sequence between SiO2 and GeO2 polymorphs at high pressure. Additional studies concerning the electronic properties of these polymorphs have been reported by Christie et al. [151], using the same tools. This allows determination of the lattice parameters, cohesive energy and bulk modulus by minimizing the total energy of the solid. In addition, an equation of state for the polymorphs can be fitted with a Birch-Murnhagan EOS [133], [152] or the density of states. Ab initio studies of amorphous germania have been only reported recently [58] using the same numerical scheme but with an improved density approximation (generalized gradient). This enables determination of the neutron structure factor (Figure 4), the infrared and the Raman spectra, all of which show good agreement with experimentally derived data (cf., Figure 8c). It furthermore provides insight into the 3-membered ring distribution and the so-called D2 line first described by Galeener and workers [82]. The projection of vibrational eigenmodes onto natural or isotopic substituted oxygen breathing motions in these rings shows that a broad peak centered at 520 cm−1 and corresponding to the experiment, is blueshifted with 18 O by 26 cm−1 . The number of these rings is found to be about 20% of the oxygen atoms. On the other hand, similar calculations do not seem to support the assignment of four-membered rings to the D1 line found at 347 cm−1 . Instead, this band seems to arise from coupled motions of Ge and O atoms. 7. Summary and Conclusions Studies on the structure of crystalline, liquid and glassy GeO2 continue to be of interest to a number of researchers in physics and glass, materials and geological sciences. This breadth of interest stems from the fact that while there are close similarities between GeO2 and SiO2 , there are also distinct differences which make GeO2 useful as an analogue for studying the high pressure behaviour of oxide glasses. Crystalline GeO2 polymorphs behave, with increasing temperature and pressure, in a manner similar to crystalline SiO2 polymorphs. However, pressure induced phase transformations generally occur at much lower pressures than equivalent SiO2 phases. This is because the larger GeO4 tetrahedron (relative to SiO4 tetrahedron) is more distorted due to
CONTENTS
33
greater variability in the O − Ge − O angles. This makes the use of GeO2 polymorphs attractive as SiO2 analogues in high pressure studies for studying possible pressure induced structural changes, since the pressure ranges required are much more accessible. GeO2 glass has also been considered as being somewhat similar to SiO2 glass. The first three interatomic distances in the glass are reasonably well resolved and indicate that, like SiO2 glass, the network is composed of tetrahedra linked together through their corner bridging oxygens. However, there are significant differences between the two glass networks. GeO2 glass has a much smaller mean Ge − O − Ge angle and a much higher proportion of 3-membered rings, relative to SiO2 glass. Furthermore, there may be differences in the intermediate-range structure with GeO2 glass possibly being composed of 4- membered rings, rather than the currently accepted 6-membered rings similar to SiO2 glass. In addition, application of high pressure readily converts 4-fold Ge to 6-fold Ge, via a transitionary 5-fold coordination, at much lower pressures than found for SiO2 glass. In the liquid state GeO2 retains 4-fold geometry to high temperature but with broadened Ge − O − Ge angles although numerical studies of liquid GeO2 indicate that while the GeO4 tetrahedra are distorted, the Ge − O − Ge angle remains similar to that found in the α-quartz-like GeO2 polymorph. Furthermore, simulation of pressure effects indicate that the pressure-induced transformation from 4to 6-fold Ge observed experimentally at ≃ 9 GP a, may be quite subtle. Onset of the simulated transition occurs at 2 GP a with loss of long-range correlations, a reduction in the Ge − O − Ge angle, followed by a sharp distortion of the GeO4 tetrahedra at 3 GP a. This is accompanied by the onset of rigidity at much lower pressure than observed for SiO2 glass. When Ge substitutes for Si along the GeO2 − SiO2 binary, there is no evidence for clustering or phase separation of the glass network and it is composed of SiO4 and GeO4 tetrahedra. The substitution is random with no heterogeneity induced in the combined network. However, with increasing pressure Ge undergoes a coordination change from 4- to 6-fold coordination. The pressure at which this occurs is dependent upon the SiO2 composition indicating that Si has an influence on the local structure of Ge. In addition, there is a broad pressure-composition range over which Ge is in both 4- and 6-fold coordination. Acknowledgements GSH acknowledges funding from NSERC via a Discovery grant. He also thanks his coauthors, the Institut de Min´eralogie et Physique des Milieux Condens´es (IMPMC), and the CNRS for a very enjoyable stay at IMPMC. The authors acknowledge discussions and correspondance with P. Boolchand, G. Calas, M.T. Dove, S.R. Elliott, G. Ferlat, L. Giacomazzi, B. Guillot, Y. Guissani, G. Hovis, A. Pasquarello, J.C. Phillips, D.L. Price, P. Richet, J.F. Stebbins and K. Trachenko.
[1] Zachariasen W.H. XIII. Uber die Kristallstruktur der wasserl?chen Modifikation des Germaniumdioxyd. Zeitschrift fur Kristallographie, 67:226–234, 1928.
CONTENTS
34
[2] Smith G.S. and Isaacs P.B. The crystal structure of quartz-like GeO2 . Acta Crystallographica, 17:842–846, 1964. [3] Baur W.H. and Khan A.A. Rutile-type compounds. IV. SiO2 , GeO2 and a comparison with other rutile-type structure. Acta Crist., B27:2133–2139, 1971. [4] Laubengayer A.W. and Morton D.S. Germanium. XXXIX. The polymorphism of germanium dioxide. J. Am. Ceram. Soc., 54:2302–2320, 1932. [5] Jorensen J.D. Compression mechanisms in α-quartz structures-SiO2 and GeO2 . Journal of Applied Physics, 49:5473–5478, 1978. [6] Ault K.M. and Secco R.A. High pressure conductivity study of the α quartz-rutile transformation in GeO2 . Solid State Comm., 98:449–452, 1996. [7] Yamanaka T. Sugiyama K. and Ogata K. Kinetic study of the GeO2 transition under high pressure using synchrotron x-radiation. Journal of Applied Crystallography, 25:11–15, 1992. [8] Itie J.P. Polian A. Calas G. Petiau J. Fontaine A. and Tolentino H. Pressure-induced coordination changes in crystalline and vitreous GeO2 . Phys. Rev. Lett., 63:398–401, 1989. [9] Wolf G.H. Wang S. Herbst C.A. Durben D.J. Oliver W.F. Kang Z.C. and Halvorson K. Pressure induced collapse of the tetrahedral framework in crystalline and amorphous GeO2 . In High Pressure Research: Applications to Earth and Planetary Sciences. Terra Scientific Publishing Company, 1992. [10] Kawasaki S. Ohtaka O. and Yamanaka Y. Structural change of GeO2 under pressure. Phys. Chem. Minerals, 20:531–535, 1994. [11] Tsuchiya T. Yamanaka T. and Matsui M. Molecular dynamics study of the crystal structure and phase relation of the GeO2 polymorphs. Phys. Chem. Minerals, 25:98–100, 1998. [12] Brazhkin V.V. Tat’yanin E.V. Lyapin A.G. Popova Tsiok O.B. and Balitskii D.V. Technology of high pressure: Proceedings of the International Conference on High Pressure Science and Technology. M.H. Manghnani W.J. Ellis M.F. Nicol Eds. (university Press Hyderabad India), 2000. [13] Brazhkin V.V. Tat’yanin E.V. Lyapin A.G. Popova Tsiok O.B. Balitskii D.V. and Pis’ma Zh. Martensitic transition in single-crystalline α-GeO2 at compression. JETP Lett., 71:293–297, 2000. [14] Brazhkin V.V. Lyapin A.G. Voloshin R.N. Popova S.V. Tat’yanin E.V. Borovikov N.F. Bayliss S.C. and Sapelkin A.V. Pressure-induced cross-over between diffusive and displacive mechanisms of phase transitions in single-crystalline a-GeO2 . Phys. Rev. Lett., 90:145503(1–4), 2003. [15] Haines J. Leger J.M. and Chateau C. Transition to a crystalline high-pressure phase in α-GeO2 at room temperature. Phys. Rev. B, 61:8701–8706, 2000. [16] Prakapenka V.B. Dubrovinsky L.S. Shen G. Rivers M.L. Sutton S.R. Dimitriev V. Weber H.-P. and Le Bihan T. α − pbo2 -type high-pressure polymorph of GeO2 . Phys. Rev. B, 67:132101, 2003. [17] Haines J. Leger J.M. Chateau C. and Periera A.S. Structural evolution of rutile-type and CaCl2 type germanium dioxide at high pressure. Physics and chemistry of Minerals, 27:575–582, 2000. [18] Ono S. Hirose K. Nishiyama N. and Isshiki M. Phase boundary between rutile-type and CaCl2 type germanium dioxide determined by in-situ x-ray observations. American Mineralogist, 87:99–102, 2002. [19] Lodziana Z. Parlinski K. and Hafner J. Ab initio studies of high-pressure transformations in GeO2 . Phys. Rev. B, 63:134106, 2001. [20] Ono S. Tsuchiya T. Hirose K. and Ohishi Y. Phase transition between the CaCl2 -type and a α − P bO2 -type structures of germanium dioxide. Phys. Rev. B, 68:014103, 2003. [21] Ono S. Tsuchiya T. Hirose K. and Ohishi Y. High-pressure form of pyrite-type germanium dioxide. Phys. Rev. B, 68:014103, 2003. [22] L-G. Bassett W.A. Liu and Sharry J. New high pressure modifications of GeO2 and SiO2 .
CONTENTS [23]
[24] [25] [26] [27]
[28]
[29]
[30]
[31] [32] [33] [34] [35] [36] [37] [38] [39] [40] [41] [42] [43]
[44]
35
Journal of Geophysical Research, 83:2301–2305, 1978. Prakapenka V.B. Shen G. Dubrovinsky L.S. Rivers M.L. and Sutton S.R. High pressure induced phase transformations of SiO2 and GeO2 : difference and similarity. J. Phys. Chem. Solids, 65:1537–1545, 2004. Shiraki K. Tsuchiya T. and Ono S. Structural refinement of high-pressure phases in germanium dioxide. Acta Crystallographica B, 59:701–708, 2003. Ming L.C. and Manghnani M.H. High-prssure phase transformation in vitreous and crystalline GeO2 (rutile). Phys. of the Earth and Planetary Interiors, 33:26–30, 1983. Teter D.M. Hemley R.J. Kresse G. and Hafner J. High pressure polymorphism in silica. Phys. Rev. Lett., 80:2145–2148, 1998. Yamanaka T. and Ogata K. Structure refinement of GeO2 polymorphs at high pressure and temperatures by energy-dispersive spectra of powder diffraction. Journal of Applied Crystallography, 24:111–118, 1991. Glinnemann J. King Jr. H.E. Schulz H. Han Th. La Placa S.J. and Dacol F. Crystal structures of the low -temperature quartz-type phases of SiO2 and GeO2 at elevated pressure. Zeitschrift fur Kristallographie, 198:177–212, 1992. Haines J. Cambon O. Philippot E. Chapon L. and Hull S. A neutron diffraction study of the thermal stability of the α-quartz-type structure in germanium dioxide. Journal of Solid State Chemistry, 166:434–441, 2002. Balitsky D.V. Balitsky V.S. Pisarevsky Yu.V. Philippot E. Silvestrova O. Yu. and Pushcharovsky D.Yu. Growth of germanium dioxide single crystals with α-quartz structure and investigation of their crystal structure, optical, elastic, piezoelectric, dielectric and mechanical properties. Ann. Chim. Sci. Mat., 26:183–192, 2001. Madon M. Gillet Ph. Julien Ch. and Price D.G. A vibrational study of phase transitions among the GeO2 polymorphs. Phys. Chem. Minerals, 18:7–18, 1991. Bohm H. The cristobalite modification of GeO2 . Naturwissenschaften, 55:648–649, 1968. Hauser E. Nowotny H. and Seifert K.J. Uber die GeO2 -Modifikationen (Zerfall) des Ammoniumhydrogermanates. Monatshefte fuer Chemie, 101:715–720, 1970. Leadbetter A.J. and Wright A.C. Diffraction studies of glass structure II. The structure of vitreous germania. J. Non-Cryst. Solids, 7:37–52, 1972. Desa J.A.E. Wright A.C. and Sinclair R. A neutron diffraction investigation of the structure of vitreous germania. J. Non-Cryst. Solids, 99:276–288, 1988. Sarver J.F. and Hummel F.A. Alpha to beta transition in germania quartz and a pressure temperature diagram for GeO2 . J. Am. Ceram. Soc., 43:336, 1960. Warren B.E. The diffraction of X-rays in glass. Phys. Rev., 45:657–661, 1934. Warren B.E. X-ray determination of the structure of glass. J. Am. Ceram. Soc., 17:249–254, 1934. Zarzycki J. Etude du r´eseau vitreux par diffraction des rayons X aux temperatures elevees, travaux IV. Congres International du Verre (Paris), pages 323–330, 1956. Zarzycki J. Sur l’angle de la liaison si-o-si de la silice vitreuse et celui de la liaison ge-o-ge de l’oxyde de germanium vitreux ou liquide. Verres et Refractaires, 11:3–8, 1957. Lorch E. Neutron diffraction by germania, silica and radiation-damaged silica glasses. J. Phys. C, 1969:229–237, 2(2). Ferguson G.A. and Hass M. Neutron diffraction investigation of vitreous germania. J. Am. Ceram. Soc., 53:109–111, 1970. Sinclair R.N. Johnson D.A.G. Dore J.G. Clarke J.H. and Wright A.C. Structural studies of amorphous materials using a pulsed neutron source. Nuclear Instruments and Methods, 117:445–454, 1974. Sinclair R.N. and Wright A.C. Diffraction studies of glasses using the Harwell electron LINAC pulsed neutron source, in: The Physics of Non-crystalline Solids. Trans Tech, Aedermannsdorf, 1977.
CONTENTS
36
[45] Neuefeind J. and Liss K.-D. Bond angle distribution in amorphous germania and silica. Ber. Bunsenges. Phys. Chem., 100(8):1341–1349, 1996. [46] Galeener F.L. Planar rings in glasses. Solid State Communication, 44:1037–1040, 1982. [47] Barrio R.A. Galeener F.L. Martinez E.and Elliott R.J. Regular ring dynamics in AX 2 tetrahedral glasses. Phys. Rev. B, 48:15672–15689, 1993. [48] Bondot P. Essai de s´eparation des distributions de paires dans GeO2 vitreux`a partir de l’effet de diffusion anomale. Acta Cryst., A30:470–471, 1974. [49] Bondot P. Study of local order in vitreous germanium oxide. Physica Status Solidi A, 22:511–522, 1974. [50] Waseda Y. Sugiyama K. Matsubara E. and Harada K. Partial structure functions for GeO2 glass determined by the anomalous X-ray scattering data coupled with neutron diffraction. Mat. Trans. JIM, 31:421–424, 1990. [51] Price D.L. Saboungi M.-L. and Barnes A.C. Structure of vitreous germania. Phys. Rev. Lett., 81:3207–3210, 1998. [52] Barnes A.C. Hamilton M.A. Buchanan P. and Saboungi M.-L. Combined X-ray and neutron diffraction from binary liquids and amorphous semiconductors. J. Non-Cryst. Solids, 250252:393–404, 1999. [53] Price D.L. Ellsion A.J.G. Saboungi M.-L. Hu R.-Z. Egami T. and Howells W.S. Short, intermediate-, and extended-range order in rubidium germanate glasses. Phys. Rev. B, 55:11249–11255, 1997. [54] Bhatia A.B. and Thornton D.E. Structural aspects of the electrical resistivity of binary alloys. Phys. Rev. B, 2:3004–3012, 1970. [55] Salmon P.S. Martin R.A. Mason Ph.E. and Cuello G.J. Topological versus chemical ordering in network glasses at intermediate and extended length scales. Nature, 435:75, 2005. [56] Salmon P.S. Barnes A.C. Martin R.A. and Cuello G.J. Glass fragility and atomic ordering on the intermediate and extended range. Phys. Rev. Lett., 96:235502(1–4), 2006. [57] Stone C.E. Hannon A.C. Ishirawa T. Kitamura N. Shirakawa Y. Sinclair R.N. Umesaki N. and Wright A.C. The structure of pressure-compacted vitreous germania. J. Non-Cryst. Solids, 293-295:769–775, 2001. [58] Giacomazzi L. Umari P. and Pasquarello A. Medium range structural properties of vitreous germania obtained through first-principles analysis of vibrational spectra. Phys. Rev. Lett., 95:075505, 2005. [59] Micoulaut M. Guissani Y. and Guillot B. Simulated structural and thermal properties of glassy and liquid germania. Phys. Rev. E, 73:031504(1–11), 2006. [60] Micoulaut M. Structure of densified amorphous germanium dioxide. J. Phys. Cond. Matt., 16:L131–L138, 2004. [61] Konnert J.H. Karle J. and Ferguson G.A. Crystalline ordering in silica and germania glasses. Science, 179:177–179, 1973. [62] Hoppe U. Kranold R. Weber H.-J. Neuefeind J. and Hannon A.C. The structure of potassium germanate glasses - a combined X-ray and neutron scattering study. J. Non-Cryst. Solids, 278:99–114, 2000. [63] Sugai S. Onodera A. Medium-range order in permanently densified SiO2 and GeO2 glass. Phys. Rev. Lett., 77:4210–4213, 1996. [64] Hemley R.J. Meade C. and Mao H.-K. Comments on medium range order in permanently densified SiO2 and GeO2 glass. Phys. Rev. Lett., 79:1420, 1997. [65] Sampath S. Benmore C.J. Lantzk K.M. Neuefeind J. Leinenweber K. Price D.L. and Yarger J.L. Intermediate-range order in permanently densified GeO2 glass. Phys. Rev. Lett., 90:115502(1– 4), 2003. [66] Guthrie M. Tulk C.A. Benmore C.J. Xu J. Yarger J.L. Flug D.D. Tse J.S. Mao H.-K. and Hemley R.J. Formation and structure of a dense octahedral glass. Phys. Rev. Lett., 93:115502(1–4), 2004.
CONTENTS
37
[67] Kamiya K. Yoko T. Itoh Y. and Sakka S. X-ray diffraction study of N a2 O − GeO2 melts. J. Non-Cryst. Solids, 79:285–294, 1986. [68] Scott J.F. Raman spectra of GeO2 . Phys. Rev. B, 1:3488–3493, 1970. [69] Dultz W. Quilichini M. Scott J.F. and Lehman G. Phonon spectra of quartz isomorphs. Phys. Rev. B, 11:1648–1653, 1975. [70] Sharma S.K. Applications of advanced Raman spectroscopic techniques in the earth sciences, volume 17B. Elsevier Science Publishers. Raman spectroscopy: sixty years on, Vibrational spectra and structure, 1989. [71] Mernagh T.P. and Liu L.-G. Temperature dependence of Raman spectra of the quartz and rutile-types of GeO2 . Phys. Chem. Minerals, 24:7–16, 1997. [72] Bobovich Y.s. and Tolub T.P. Raman spectra of alkali-germanate glasses. Optika I Spektroskopiya, 5:210213, 1958. [73] Obikhov-Denisov V.V. Sobolev N.N. and Cheremisinov V.P. Vibrational spectra of the modifications of germanium dioxide. Optika I Spektroskopiya, 8:267–270 (in Russian), 1960. [74] Henderson G.S. Bancroft G.M. Fleet M.E. and Rogers D.J. Raman spectra of gallium and germanium substituted silicate glasses: Variations in intermediate range order. American Mineralogist, 70:946–960, 1985. [75] Henderson G.S. and Fleet M.E. The structure of glasses along the N a2 O − GeO2 join. J. Non-Cryst. Solids, 134:259–269, 1991. [76] Galeener F.L. and Lucovsky G. Longitudinal optical vibrations in glasses: GeO2 and SiO2 . Phys. Rev. Lett., 37:1476–1478, 1976. [77] Pilla O. Fontana A. Caponi S. Rossi F. Viliani G. Gonzalez M.A. Fabiani E. and Arsamis C.P.E. Vibrational dynamics of strong glasses: the case of v-SiO2 and v-GeO2 . J. Non-Cryst. Solids, 322:5357, 2003. [78] Hubbard B.E. Tu J.J. Agladze N.I. and Sievers A.J. Optical activity of the boson peak and two-level systems in silica-germania glasses. Phys. Rev. B, 67:144201, 2003. [79] Courtens E. Foret M. Hehlen B. Ruffl´e B. Vacher R. The crossover from propagating to strongly scattered acoustic modes of glasses observed in densified glasses. J. Phys. Condens. Matter, 15:S1279–S1290, 2003. [80] Kaiser W. Keck P.H. and Lange C.F. Infrared absorption of oxygen content in silicon and germanium. Phys. Rev. B, 101:1264–1268, 1956. [81] Teredesai P.V. Anderson D.T. Hauser N. Lantzky K. and Yager J.L. Infrared spectroscopy of germanium dioxide (GeO2 ) glass at high pressure. Physics and chemistry of glasses, 46:345– 349, 2005. [82] Galeener F.L. Leadbetter A.J. and Stringfellow M.W. Comparison of neutron, Raman and infrared vibrational spectra of vitreous SiO2 , GeO2 and BeF2 . Phys. Rev. B, 27:1052–1078, 1983. [83] Ishihara T. Shirakawa Y. Iida T. Kitamura N. Matsukawa M. Ohtari N. and Umesaki N. Brillouin scattering in densified GeO2 glasses. Japanese Journal of Applied Physics, 38:3062–3065, 1999. [84] Durben D.J. Wolf G.H. Raman spectroscopic study of pressure-induced coordination change in GeO2 glass. Phys. Rev. B, 43:2355–2363, 1991. [85] Polsky C.H. Smith K.H. and G.H. Wolf. Effect of pressure on the absolute Raman scattering cross section of SiO2 and GeO2 glasses. J. Non-Cryst. Solids, 248:159–168, 1999. [86] Magruder III R.H. Morgan S. Kinser D.L. and Weeks R.A. Raman studies of the GeO2 glass preparation history. J. Non-Cryst. Solids, 94:56–61, 1987. [87] Sharma S.K. Cooney T.F. Wang Z. and Van der Laan S. Raman band assignments of silicate and germanate glasses using high-pressure and high-temperature spectral data. Journal of Raman Spectroscopy, 28:697–709, 1997. [88] Henderson G.S. and Wang H. Germanium coordination and the germanate anomaly. Eur. J. of Mineral., 14:733–744, 2002. [89] Verkhovskii S.V. Yakubovsky A. Yu. Trokiner A. Malkin B.Z. Saikin S.K Ozhogin V.I. Tikhomirov
CONTENTS
[90]
[91] [92]
[93]
[94]
[95] [96] [97] [98]
[99]
[100] [101] [102] [103] [104] [105]
[106]
[107] [108]
[109] [110]
38
A.V. Ananyev A.V. Gerashenko A.P. and Piskunov Yu. 73 ge NMR in germanium single crystals with different isotopic composition. Applied Magnetic Resonance, 17:557–576, 1999. Verkhovskii S.V. Yakubovsky A. Yu. Malkin B.Z. Saikin S.K. Cardona M. Trokiner A. and Ozhogin V.I. Isotopic disorder in Ge single crystals probed with 73 Ge NMR. Phys. Rev. B, 68:10421, 2003. Takeuchi Y. Nishikawa M. and Yammaoto H. High-resolution solid-state 73 Ge NMR spectra of hexacoordinated germanium compounds. Magnetic Resonance Chemistry, 42:907–909, 2004. Stebbins J.F. Du Lin-Shu Kroeker S. Neuhoff P. Rice D. Frye J. and Jakobsen H.J. New opportunities for high-resolution solid-state NMR spectroscopy of oxide materials at 21.1 and 18.8 T fields. Solid State Nuclear Magnetic Resonance, 21:105–115, 2002. Du L-S. and Stebbins J.F. Oxygen sites and network coordination in alkali-germanate glasses and crystals: High-resolution oxygen-17 and sodium-23 NMR. J. Phys. Chem. B., page in press, 2006. Hussin R. Holland D.and Dupree R. Does six-coordinate germanium exist in N a2 O − GeO2 glasses? oxygen-17 nuclear magnetic resonance measurements. J. Non-Cryst. Solids, 234:440– 445, 1998. Jackson I. Melting of the silica isotypes SiO2 , BeF2 and GeO2 at elevated pressures. Physics of the Earth and Planetary Interiors, 13:218–231, 1976. Brazhkin V.V. and Lyapin A.G. High-pressure phase transformations in liquids and amorphous solids. Journal of Physics: Condensed Matter, 15:6059–6084, 2003. Sharma S.K. Virgo D. and Kushiro I. Relationship between density, viscosity and structure of GeO2 melts at low and high pressures. J. Non-Cryst. Solids, 33:235–248, 1979. Duverger C. Turrell S. Bouazaoui M. Tonelli F. Montagne M. and Ferrari M. Preparation of SiO2 GeO2 : Eu+ planar waveguides and characterization by waveguide Raman and luminescence spectroscopies. Phil. Mag. B, 77(2):363–372, 1998. Lapeyre C. Petiau J. Calas G. Gauthier F. and Gombert J. Ordre local autour du germanium dans les verres du systeme SiO2 − GeO2 − B2 O3 − N a2 O: Etude par spectrometrie d’absorption X. Bull. Mineral., 106:77–85, 1983. Greegor R.B. Lytle F.W. Kortright J. Fischer-Colbrie A. Determination of the structure of GeO2 -SiO2 glasses by exafs and x-ray scattering. J. Non-Cryst. Solids, 89:311–323, 1987. Schlenz H. Neuefeind J. and Rings S. High-energy X-ray diffraction study of amorphous (Si0.71 Ge0.29 )O2 . J. Phys. Cond. Matt., 15:4919–4826, 2003. Henderson G.S. The structure of silicate melts: a glass perspective. Canadian Mineralogist, 43:1921–1958, 2005. Du L-S. and Stebbins J.F. written communication. Sharma S.K. Matson D.W. and Philpotts J.A. Raman study of the structure of glasses along the join SiO2 -GeO2 . J. Non-Cryst. Solids, 68:99–114, 1984. Martinez V. Martinet C. and Champagnon B. Light scattering in SiO2 -GeO2 glasses: quantitative comparison of Rayleigh, Brillouin and Raman effects. J. Non-Cryst. Solids, 345346:315–318, 2004. Bernard C. Chaussedent S. Monteil A. Balu N. Obriot J. Duverger C. Ferrari M. Bouazaoui M. Kinowski C. Turell S. Application of molecular dynamics techniques and luminescent probes to the study of glass structure: the Sio2 -Geo2 case. J. Non-Cryst. Solids, 284:68–72, 2001. Nian X. Zhisan X. and Decheng T. A Raman study of the ring defects in GeO2 -SiO2 glasses. J. Phys. Cond. Matt., 1:6343–6346, 1989. Majerus O. Cormier L. Iti´e J.-P. Galoisy L. Neuville D.R. and Calas G. Pressure-induced ge coordination change and polyamorphism in SiO2 -GeO2 glasses. J. Non-Cryst. Solids, 345346:34–38, 2004. Oeffner R.D. and Elliott S.R. Interatomic potential for germanium dioxide empirically fitted to an ab initio surface. Phys. Rev. B, 58:14791–14803, 1998. Long D.A. Intensities in Raman spectra. I. A bond polarizability theory. Proc. Royal Soc.
CONTENTS [111] [112] [113] [114] [115]
[116]
[117] [118] [119] [120]
[121] [122] [123]
[124] [125]
[126]
[127] [128] [129] [130] [131] [132]
39
London, Sect. A, 217:203–221, 1953. Tsuchiya T. Yamanaka T. and Matsui M. Molecular dynamics study of pressure induced transformation of quartz-type GeO2 . Phys. Chem. Minerals, 27:149–155, 2000. Bingelli N. Chelikowsky J.R. Wetzcovitch R.M. Simulating the amorphization of α-quartz under pressure. Phys. Rev. B, 49:9336–9340, 1994. Grismditch M. Polian A. Brazhkin V. and Balitskii D. Elastic constants of α-GeO2 . Journal of Applied Physics, 83:3018–3020, 1998. Van Hoang V. Static and dynamic properties of simulated liquid an amorphous GeO2 . J. Phys. Cond. Matt., 18:777–786, 2006. Kim D. Kawamura K. Enomoto N. and Nakagawa Z. Reproduction of pressure-induced structural transformation of α-quartz-type GeO2 in molecular dynamics simulations. J. Ceram. Soc. Japan, 104:10971099, 1996. Nanba T. Miyaji T. Takada J. Osaka A. Miura Y. and Yasui I. Computer simulation on the structure and vibrational spectra in Ge − P b − O − F glass. J. Non-Cryst. Solids, 177:131– 136, 1994. Wefing S. Modeling of continuous random networks: a case study for vitreous GeO2 . I. Model generation. J. Non-Cryst. Solids, 244:89–111, 1999. Araujo R. Oxygen vacancies in silica and germania glasses. J. Non-Cryst. Solids, 197:164–169, 1996. Guttierez G. and Rogan J. Structure of liquid GeO2 from a computer model. Phys. Rev. E, 69:031201(1–8), 2004. Giovambattista N. Stanley E.G. and Sciortino F. Phase diagram of amorphous solid water: Lowdensity, highdensity, and very-high-density amorphous ices. Phys. Rev. E, 72:031510(1–12), 2005. Van Hoang V. Anomalous diffusion in simulated liquid GeO2 . Physica B, page in press, 2006. Micoulaut M. A comparative numerical study of liquid GeO2 and SiO2 . Chem. Geol., 213:197– 205, 2004. Rustad J.R. Yuen D.A. and Spera F.J. The sensitivity of physical and spectral properties of silica glass to variations in interatomic potentials under high pressures. Phys. Earth Planet Inter., 65:210–230, 1991. Richet P. GeO2 vs SiO2 : Glass transitions and thermodynamic properties of polymorphs. Phys. Chem. Minerals, 17:79–88, 1990. Kiczenski T.J. Chris Ma Hammarsten E. Wilkerson D. Affatigato M. and S. Feller. A study of selected physical properties of alkali germanate glasses over wide ranges of composition. J. Non-Cryst. Solids, 272:57–66, 2000. Vashishta P. Kalia R.K. and Ebbsj? Structural correlations and phonon density of states in GeSe2 : a molecular dynamics study of molten and amorphous states. Phys. Rev. B, 39:6034– 6046, 1989. Vollmayr K. Kob W. and Binder K. Cooling rate effects in amorphous silica: a computersimulation study. Phys. Rev. B, 54:15808–15827, 1996. Sipp A. Bottinga Y. and Richet P. New viscosity data for 3d network liquids and new correlations between old parameters. J. Non-Cryst. Solids, 288:166–174, 2001. Horbach J. and Kob W. Static and dynamic properties of a viscous silica melt. Phys. Rev. B, 60:3169, 1999. Tokuda T. and Kingery W.D. Oxygen diffusion and vaporization rates for liquid and solid germanium dioxide. J. Appl. Phys., 34:2104–2105, 1963. Glasstone S. Laider K.J. and Eyring H. The theory of rate processes. McGraw and Hill, New York, 1941. Smith K.H. Shero E. Chizmeshya A. and Wolf G.H. The equation of state of a polyamorphic germania glass: A two-domain description of the viscoelastic response. J. Chem. Phys., 102:6851–6857, 1995.
CONTENTS
40
[133] Birch F. Elasticity and constitution of the earths interior. J. Geophys. Res., 57:227–286, 1952. [134] Dingwell D.B. Knoche R. Webb S.L. A volume temperature relationship for liquid GeO2 and some geophysically relevant derived parameters for network liquids. Phys. Chem. Minerals, 19:445–453, 1993. [135] Alejandre J. Tildesley D.J. and Chapela G.A. Molecular dynamics simulation of the orthobaric densities and surface tension of water,. J. Chem. Phys., 102:4574–4583, 1995. [136] Trachenko K.O. Dove M.T. Brazhkin V. and El’kin F.S. Network rigidity and properties of SiO2 and GeO2 under pressure. Phys. Rev. Lett., 93:135502(1–4), 2004. [137] Trachenko K.O. private communication. [138] Wegner F.J. Corrections to scaling laws. Phys. Rev. B, 5:4529–4536, 1972. [139] Micoulaut M. and Guissani Y. unpublished. [140] Guissani Y. private communication. [141] Sugai S. Sotokawa H. Kyokane D. and Onodera A. Bose peak in the Raman spectra of densified SiO2 and GeO2 glass under high pressure. Physica B, 219-220:293–295, 1996. [142] Shanavas K.V. Nandini Garg and Sharma Surinder M. Classical molecular dynamics simulation of behavior of GeO2 under high pressures and at high temperatures. Phys. Rev. B, 73:094120(1– 12), 2006. [143] Micoulaut M. Yuan X. and Hobbs L.W. Coordination and intermediate range order alterations in densified networks. J. Non-Cryst. Solids, submitted, 2006. [144] Trachenko K.O. Dove M.T. Hammonds K.D. Harris M.J. and Heine V. Low energy dynamics and tunneling states in silica glass. Phys. Rev. Lett., 81:3431–3434, 1998. [145] Trachenko K.O. Dove M.T. Harris M.J. and Heine V. Dynamics of silica: two-level tunneling states and low-energy floppy modes. J. Phys. Cond. Matt., 12:8041–8064, 2000. [146] Thorpe M.F. and Duxburry P.M. Rigidity theory and applications. Plenum Press/Kluwer Academic, 1999. [147] Selvenathan D. Bresser W.J. Boolchand P. Stiffness transition in Six Se1−x glasses from Raman scattering and temperature modulated differential scanning calorimetry. Phys. Rev. B, 61:15061–15076, 2000. [148] Boolchand P. Georgiev D.G. Goodman B. Discovery of the intermediate phase in chalcogenide glasses. J. OptoElectr. and Adv. Mater., 3:703–720, 2000. [149] Tsiok O.B. Brazhkin V.V. Lyapin A.G. and Khvostantsev L.G. Logarithmic kinetics of the amorphous-amorphous transformations in SiO2 and GeO2 glasses under high pressure. Phys. Rev. Lett., 80:999–1002, 1998. [150] Polian A. and Grimsditch M. Room-temperature densification of a-SiO2 versus pressure. Phys. Rev. B, 41:6086–6087, 1990. [151] Christie D.M. and Chelikowsky J.R. Electronic and structural properties of germania polymorphs. Phys. Rev. B, 62:14703–14711, 2000. [152] Murnhagan F.D. The compressibility of media under extreme pressures. Proc. Natl. Acad. Sci. U.S.A., 30:224247, 1944.