The Structure of Voluntary Disclosure Narratives: Evidence from Conference Calls
Kristian D. Allee* University of Wisconsin – Madison Matthew D. DeAngelis** Michigan State University
May 2014
*
Corresponding author. Department of Accounting and Information Systems, University of WisconsinMadison, 975 University Ave. Madison, WI 53706-1323. Phone: (608) 265-2985. Email:
[email protected] ** Department of Accounting and Information Systems, Michigan State University, 632 Bogue St. East Lansing, MI 48824-1121. Phone (517) 432-3032 Email:
[email protected] We are grateful for constructive comments by Ted Christensen, Fabio Gaertner, Ken Merkley, Holly Skaife, Tyler Thomas, Jim Wahlen, Terry Warfield and workshop participants at Michigan State University, the University of Arkansas, and the University of Wisconsin - Madison. We would like to thank the Wisconsin School of Business and the Eli Broad College of Business for financial support.
The Structure of Voluntary Disclosure Narratives: Evidence from Conference Calls Abstract
We examine tone dispersion (i.e., the degree to which tone words are spread evenly throughout a narrative) to evaluate whether narrative structure provides insight into managers’ voluntary disclosures and the response to these disclosures. We find that tone dispersion is both informative and subject to managers’ incentives to influence perceptions about performance. Consistent with tone dispersion being informative, we find that positive (negative) tone dispersion is (inversely) associated with improvements in disaggregated performance. We also find that negative tone dispersion is associated with poor future performance. Furthermore, we find that analysts and investors respond to negative tone dispersion. Consistent with managers using tone dispersion to influence perceptions, we find evidence that managers increase negative tone dispersion in order to emphasize bad news when firm performance is exceptionally high and reduce negative tone dispersion when they have a large amount of negative news to share. In addition, we find evidence that managers disperse positive tone in order to emphasize good aggregate performance, which may suggest strategic motivations on the part of managers. Keywords: voluntary disclosure, conference calls, tone, analysts JEL classification: M41, M49, G30
1. Introduction Disclosure narratives provide context for financial data and convey incremental information about firm performance (Kravet and Muslu [2013]; Merkley [2014]; Davis, Piger, and Sedor [2012]; Loughran and McDonald [2011]; Henry [2008]; Li [2006]; Price, Doran, Peterson and Bliss [2012]). However, extant research provides little evidence on how the structure of these words within disclosure narratives affects information content. In addition, with the exception of Li [2008] and related studies on readability, we know little about how managers’ choices regarding word order and narrative construction affect users’ response to the information presented. We examine whether tone dispersion, or the degree to which tone words are spread evenly throughout a narrative, provides additional insight into what information managers communicate and how users interpret that information. The structure of a narrative reflects the organization of inter-related ideas and helps users interpret and comprehend the preparers’ message (Strunk and White [1979]; Kintsch and Yarbrough [1982]; Spivey [1990]). When crafting disclosures, managers do not present “loose bits of information” (Spivey [1990]), but rather provide a carefully worded and thoroughly organized discussion of relevant information (Matsumoto, Pronk, and Roelofsen [2011]). Managers use narrative information in their financial reports to “tell a story” (Sedor [2002]), usually outlining the contribution of multiple components of performance to aggregate performance. As such, we predict that increased tone dispersion indicates the presence of positive or negative news in a greater number of these performance components. That is, when a firm experiences good (bad) performance related to components of aggregate earnings (e.g., financial statement line items, business or geographical segments), we expect positive (negative) tone dispersion to be higher because discussions of positive (negative) news are spread more evenly throughout the report. However, since prior research suggests that managers alter narrative structure strategically in order to obfuscate information (Li [2008]) or direct attention away from past performance (Rennekamp [2012]), we also expect managers to alter 1
tone dispersion in order to influence perceptions. For instance, managers may condense their discussion of bad news into one section in order to avoid drawing attention to it. We examine the role of tone dispersion in earnings conference calls because they are an increasingly important and value relevant channel of corporate communication (Frankel, Johnson, and Skinner [1999]; Bushee, Matsumoto, and Miller [2003]; Skinner [2003]). 1 Prior research examining information in conference calls has found that investors and other stakeholders react not only to (1) what managers say, but (2) how they say it, documenting significant responses to word choice (Price, Doran, Peterson and Bliss [2012]), vocal cues (Mayew and Venkatachalam [2012]) and conference call time (Chen, Demers, and Lev [2012]). In addition, since conference calls are interactive, with a question-and-answer period following management’s prepared remarks, using conference calls also allows us to examine the effect of the prepared narrative on the language used by analysts when questioning managers on firm performance. We test our predictions using a measure of linguistic dispersion from the computational linguistics literature, averaged reduced frequency (ARF), to measure the degree to which tone words are evenly distributed throughout the prepared remarks section of a conference call. 2 We hypothesize that tone dispersion is associated with news in current performance components and future performance. Consistent with our hypothesis, negative tone is less dispersed when the firm experiences improvements in income statement line items (sales, cost of goods sold, etc.) and when future earnings are higher, suggesting that negative tone dispersion reflects the presence of
1
Research has found that the prepared remarks (Frankel, Johnson, and Skinner [1999]; Bowen, Davis, and Matsumoto [2002]; Kimbrough [2005]) and interactive analyst sections of conference calls (Matsumoto, Pronk, and Roelofsen [2011]) elicit significant incremental information relative to those firms only issuing a press release associated with their quarter end. 2 We use Loughran and McDonald's [2011] word list to measure positive and negative tone because it is tailored specifically for financial reporting settings, unlike general tone word lists such as the Harvard IV-4 dictionary, and has been shown to perform better in these settings (Davis and Tama-Sweet [2012]; Price et al. [2012]). While Henry [2008] also develops a dictionary suited for financial reporting, it includes words like “increase” and “decrease”, the tone of which is dependent on what is increasing or decreasing (e.g., sales or costs). We acknowledge, however, that our results may be sensitive to the words used in measuring tone dispersion. In addition, our study depends on the “bag-of-words” approach accurately measuring tone.
2
disaggregated information about future value. In addition, we find that our measure of negative tone dispersion is not predictably associated with measures of aggregate firm performance (i.e., losses), suggesting that the dispersion of negative tone is associated primarily with bad news in earnings components as opposed to a poor aggregate earnings number. Finally, negative tone dispersion is actually inversely associated with the level of negative tone, inconsistent with a mechanical relation between the level of tone and our measure of tone dispersion. In contrast, positive tone is more dispersed when aggregate performance is above analyst expectations but is only weakly related to the number of line item improvements. This evidence suggests that managers use dispersed positive tone predominantly to discuss aggregate earnings realizations and not to emphasize good performance in individual income components or line items. Managers also discuss pro forma earnings to a lesser degree when positive tone is more dispersed, suggesting that positive tone dispersion reflects managers’ focus on aggregate GAAP earnings. While inconsistent with our hypothesis that positive tone dispersion is associated with news in components of performance, this result is consistent with Graham, Harvey, and Rajgopal's [2005] survey evidence. They document that CFOs devote the conference call to the positive aspects of a firm’s future prospects if they meet the earnings target. On the other hand, if the company fails to meet earnings guidance, the tone of the conference call becomes negative and the focus of the discussion shifts to talking about why the company was unable to meet the consensus estimate. We also hypothesize that tone dispersion is associated with managers’ incentives and financial reporting strategies to influence investors’ perceptions. Consistent with this notion, our results indicate that firms with extremely high performance disperse negative tone to a greater extent, thereby emphasizing and detailing bad news when they have an incentive to avoid future negative earnings surprises (Soffer, Thiagarajan, and Walther [2000]; Graham, Harvey, and Rajgopal [2005]). We also find that firms that hold conference calls after hours or on nontrading days, which prior research suggests may be associated with managers’ attempts to limit the market’s response to bad 3
news (Patell and Wolfson [1982]; Dellavigna and Pollet [2009]), disperse negative tone less. This evidence is consistent with managers’ providing less detail on bad news when they want to minimize negative returns. Additionally, we find that positive tone dispersion is associated with higher classification shifting (McVay [2006]; Fan, Barua, Cready and Thomas [2010]; Barua, Lin, and Sbaraglia [2010]), consistent with managers emphasizing aggregate earnings more when they have intervened to improve that number. Finally, our evidence that negative tone dispersion is inversely associated with the level of negative tone might suggest that managers condense their discussions of bad news as firm performance deteriorates. Given the observed relation with firm performance and financial reporting decisions, we next examine whether tone dispersion provides incremental information to analysts and investors. Consistent with information content in negative tone dispersion, analysts ask more negatively toned questions and investors respond more negatively to the call when negative tone in the prepared remarks section is more dispersed. 3 Consistent with positive tone dispersion providing no information beyond aggregate earnings and the level of positive tone, analysts and investors do not respond incrementally to positive tone dispersion. However, when we control for situations in which tone dispersion is inversely related to the level of tone (i.e., potential strategic tone dispersion), we find that some portion of positive tone dispersion is informative. Furthermore, we find that analysts respond more negatively when positive tone dispersion is accompanied by a lower level of positive tone, suggesting that analysts are more skeptical when managers emphasize a relatively small amount of positive news. Additionally, consistent with Matsumoto, Pronk, and Roelofsen [2011] and Price, Doran, Peterson and Bliss [2012], we find that investors’ responses to the conference call are more positive when analysts ask more optimistically toned questions, suggesting that investors respond
3
Cohen, Lou, and Malloy [2013] find that firms manipulate their conference calls by calling on analysts with the most optimistic views on the firm and that these firms appear to be hiding bad news. Therefore, an alternative interpretation of our findings could be that managers that condense negative tone may call disproportionately on favorable analysts.
4
both directly to negative tone dispersion in the disclosure narrative and indirectly to more optimistic analyst responses to that narrative. This study makes several contributions to the literature. First, we provide evidence on how the structure and tone of the narrative in conference call disclosures (1) is affected by the information presented and (2) influences analysts’ and investors’ reactions to that information. As such, our study unifies two strands of accounting and finance literature examining word choice and sentence structure. Whereas prior research uses word counts to measure information content and word and sentence structure to measure the costs of analyzing that information (e.g., Li [2008]; Lehavy, Li, and Merkley [2011]; Lee [2012]), ours is the first study in accounting to find evidence that narrative structure is important to understanding meaning. In doing so, we address a common concern that the so-called “bag-of-words” approach to textual analysis research ignores the context in which those words are used and to suggest a new line of research using statistical approaches to measure narrative structure. 4 Second, we contribute a useful measure of dispersion from computational linguistics into the financial reporting literature. Average reduced frequency, a measure originally designed to quantify the “commonness” of words within document collections (Savicky and Hlavacova [2002]), combines word placement with word choice to determine the distribution of words within a text. Although a relatively simplistic view of narrative structure, linguistic dispersion provides a useful first look at the effect of structure on meaning. By examining the dispersion of tone (structure), we also contribute to prior evidence that tone is informative for firm value. Finally, we contribute new evidence on managers’ financial reporting decisions. Prior research suggests that managers modify the components of firm performance that analysts and investors include in their estimates by suggesting that some components, usually those that result in
4
While prior studies have examined narrative structure in firm disclosures (e.g., Sydserff and Weetman [1999]), ours is the first, to our knowledge, to propose a measure of structure that does not rely on hand-coding by researchers.
5
poorer aggregate performance, are nonrecurring or misleading (Christensen, Merkley, Tucker and Venkataraman [2011]; Schrand and Walther [2000]; Curtis, McVay, and Whipple [2013]; Whipple [2014]). Our results suggest that managers are also more likely to disperse bad news than good news in their disclosure narratives when discussing recurring earnings components and that this dispersion is useful in predicting future performance. While managers’ motivations for these choices remain unexplored, the decision to voluntarily provide increased detail on bad news is consistent with prior research suggesting that bad news is more difficult to explain than good news (Bloomfield [2008]). However, our results also suggest that managers may present good news strategically by dispersing uninformative positive tone throughout their narratives. In addition, we provide novel evidence that managers may structure tone to lower expectations on future earnings. Together, these results shed light on managers’ use of disclosure narratives to shape users’ understanding of financial results. 2. Background and Hypotheses 2.1 BACKGROUND Accounting research has long acknowledged that structure is important for understanding financial reports. Research on firm communications has found that investors are more responsive to earnings metrics that managers emphasize (Bowen, Davis, and Matsumoto [2005]) and that managers can influence pro forma earnings exclusions by discussing those exclusions in their earnings guidance (Christensen, Merkley, Tucker and Venkataraman [2011]). In addition, audit research has found that auditors are influenced by the order in which information is presented (Boritz [1985]; Butt and Campbell [1989]) and the presentation of decision-irrelevant information with relevant information (Hackenbrack [1992]; Hoffman and Patton [1997]; Shelton [1999]). 5
5
Related to the importance of structure in understanding financial reports, prior research has documented that analysts and investors are influenced by the choice to present comprehensive income on the income statement instead of the statement of equity, paying greater attention to the same items when they are presented on the former than the latter (Hirst and Hopkins [1998]; Maines and McDaniel [2000]; Lee, Petroni, and Shen [2006]).
6
Structure is also important for understanding the role of words within disclosure narratives. Prior research has found that managers discuss multiple dimensions of firm performance in their disclosures (Li [2010]; Davis, Piger, and Sedor [2012]; Campbell, Chen, Dhaliwal, Lu and Steele [2010]; Li [2006]; Merkley [2014]; Kimbrough and Wang [2014]; Engelberg [2008]). Sedor [2002] notes that, while managers theoretically could present information about these various topics in the form of an unordered list, managers choose instead to structure their narratives to include “concrete details and causal orderings that link current states, planned actions, and anticipated future outcomes” (Sedor [2002, 738]). Within this ordering, the rhetoric and communication literature suggests that words are less likely to be topically related to one another as the distance between them within the narrative increases. 6 To the extent that managers use effective communication strategies in their disclosure narratives, we expect that observing two words in close proximity has very different narrative implications than observing the same two words at opposite ends of the text. We predict that managers will, in structuring their narratives, discuss components of performance sequentially as they build a story about aggregate performance. We choose to focus our investigation on the role of linguistic tone dispersion in understanding discussions of those components. Prior studies have established the pricing relevance of linguistic tone in a variety of settings (Davis, Piger, and Sedor [2012]; Price, Doran, Peterson and Bliss [2012]; Demers and Vega [2012]; Baginski, Demers, Wang and Yu [2012]; Loughran and McDonald [2011]; Durnev and Mangen [2011]; Balakrishnan and Bartov [2010]; Li [2010]). However, we know very little about how managers use tone to construct narratives about firm performance. We build on substantial evidence that managers use narratives to convey information and shape perceptions (Bowen, Davis,
6
Strunk and White [1979] suggest that each topic be assigned its own paragraph with smooth transitions between topics. In a well-structured narrative, then, words that share the same sentence, or sentences that share the same paragraph, are more likely to relate to one another than those that do not, and the same holds for adjacent paragraphs. Likewise, Strunk and White suggest that related words be kept together even within sentences, making adjacent words more likely to be related.
7
and Matsumoto [2005]; Li [2008]; Christensen, Merkley, Tucker and Venkataraman [2011]; Huang, Teoh, and Zhang [2013]) to examine the role of tone structure in these narratives. 2.2 HYPOTHESES We examine the structure of disclosure narratives in earnings conference calls. Conference call dialogues between managers and analysts have been increasingly scrutinized since the passage of Regulation Fair Disclosure (Skinner [2003]). Prior research has found that managers use these calls to provide supplementary information about earnings (Frankel, Johnson, and Skinner [1999]; Kimbrough [2005]; Matsumoto, Pronk, and Roelofsen [2011]) and that analysts and investors make decisions regarding their earnings estimates based on what managers choose to discuss (Black, Christensen, Kiosse and Steffen [2013]). As such, the disclosure narrative of the prepared remarks section of these calls is primarily about the future value implications of current period aggregate performance and line-item and segment components of that performance. Given our expectations regarding narrative structure, we predict that tone dispersion within the conference call narrative reflects managers’ choices about which performance components to discuss and how to frame the implications of those components. Managers may discuss performance components either to provide value-relevant information or to manage users’ perceptions about firm value. In general, news in performance components is informative for predicting future earnings (Ou and Penman [1989]; Fairfield, Sweeney, and Yohn [1996]). In addition, managers may call attention to value-relevant components that users might otherwise exclude from their value estimates (Elliott, Hobson, and Jackson [2011]) or one-time items that users might prefer to exclude (Elliot and Hanna [1996]; Bradshaw and Sloan [2002]; Bhattacharya, Black, Christensen and Larson [2003]). However, managers may also strategically use their disclosure narratives to manage perceptions of and expectations for the firm. Prior studies suggest that, given a certain level of good or bad news released with earnings, managers prefer that analysts and investors respond more
8
positively to good news and less negatively to bad news. 7 Managers may therefore prepare their disclosure narratives motivated partly by a desire to put a positive spin on performance (Bloomfield [2002]; Li [2008]; Davis and Tama-Sweet [2012]) or strategically alter benchmarks and reporting complexity in an effort to make it more difficult for investors to analyze firm performance (Schrand and Walther [2000]; Riedl and Srinivasan [2010]; Li [2008]). Managers may also structure their narratives to suggest that certain components of earnings are less persistent than others, leading to a measure of “street” earnings that is often higher than GAAP earnings (Bradshaw and Sloan [2002]) but excludes components of firm performance that are useful for predicting future cash flows (Doyle, Lundholm, and Soliman [2003]). Prior research finds evidence that this type of manipulation is effective. That is, market prices increasingly respond to street earnings to a greater degree than GAAP earnings and analysts are more likely to exclude recurring components of earnings when managers exclude those components (Christensen, Merkley, Tucker and Venkataraman [2011]; Bradshaw, Christensen, Gee and Whipple [2014]). Moreover, investors are less likely to exclude transitory components of earnings (Schrand and Walther [2000]; Curtis, McVay, and Whipple [2013]; Whipple [2014]) when managers do not exclude those components. If managers structure their narratives to discuss performance components sequentially, we expect that positive (negative) tone dispersion will increase (decrease) with disaggregated improvements in performance. In addition, we posit that informative tone dispersion will have implications for future performance. On the other hand, if managers structure their narratives strategically, we predict that tone dispersion will not be associated with firm fundamentals. Instead,
7 Soffer, Thiagarajan, and Walther [2000] find that, because the market responds more negatively to bad news when it is released with earnings, managers tend to release bad news prior to the earnings announcement in order to achieve a positive stock price reaction on the earnings announcement date. Richardson, Teoh, and Wysocki [2004] find that managers gradually “walk-down” expectations in order to beat earnings targets, noting that this may be because the firm is likely to issue new equity, and managers are likely to exercise stock options and trade in the firm’s stock, in the period immediately following the earnings announcement.
9
we hypothesize that managers will choose to emphasize good news by spreading positive tone throughout the report and minimize their discussion of bad news by condensing negative tone into certain sections. In addition to minimizing the amount of time that managers spend discussing bad news, condensing bad news may also reflect management’s desire to present separate pieces of bad news as one or a few (perhaps non-recurring) items (McVay [2006]). We predict that tone dispersion is a function of the information presented and managers’ incentives to manage impressions, leading to our first set of hypotheses stated in alternative form: H1 :
Tone dispersion is associated with news in components of performance and future performance.
H2 :
Tone dispersion is associated with managers’ incentives and financial reporting strategies to manage perceptions of firm value.
Earnings conference calls also provide an opportunity to test whether the structure of the call narrative affects analyst responses to the call. Prior research has found that analysts participate actively in the call, clarifying the information presented (Matsumoto, Pronk, and Roelofsen [2011]), challenging management’s assertions (Black, Christensen, Kiosse and Steffen [2013]) and providing more timely and accurate forecasts (Mayew, Sharp, and Venkatachalam [2013]). If narrative structure is informative regarding the implications of tone for firm value, or if managers are successful in using tone dispersion to influence analysts, we anticipate that more positive (negative) tone dispersion is associated with more positive (negative) tone on the part of analysts when they ask their questions. This logic leads to our third hypothesis, stated in alternative form: H3 :
Positive (negative) tone dispersion is associated with higher (lower) optimism in analysts’ questions.
Likewise, we anticipate that more positive (negative) tone dispersion is associated with a more positive (negative) market reaction. H4 :
Positive (negative) tone dispersion is associated with a higher (lower) market response to the conference call.
10
3. Sample, Descriptive Statistics, Research Design and Results on Tone Dispersion 3.1 SAMPLE We use textual analysis of earnings conference calls to examine our research questions and test our predictions. We select this setting because we expect managers to utilize a higher amount of discretion when disclosures are voluntary and the information being communicated is qualitative in nature. Frankel, Johnson, and Skinner [1999, 36] suggest this may be true by stating “conference calls, being less formal than written press releases, are subject to a lower standard of legal liability than statements made during press releases.” Thus, managers may be more willing to provide certain information during the presentation portion of the conference call than they would be willing to provide in a press release (Matsumoto, Pronk, and Roelofsen [2011]). In addition, positive and negative language in company disclosures is often specifically articulated with respect to aggregate performance (i.e. “earnings were better than expected”) or in terms of specific performance components (i.e., “we observed improvements in gross margins”). As a result, positive and negative tone in conference calls is likely to highlight components of performance more so than simply reporting changes in financial statement line items. To measure tone, we use word counts from the business-specific dictionaries of positive and negative tone words developed by Loughran and McDonald [2011]. 8 To examine our research questions, we use a measure from the corpus linguistics literature, average reduced frequency (Savicky and Hlavacova [2002]), to quantify tone dispersion. We calculate average reduced frequency (ARF) for positive (negative) words by dividing the prepared remarks section of the conference call transcript into equally-sized sections equal to the number of positive (negative) words. We count the number of sections containing at least one positive (negative) word and then divide by the total number of sections. As an example of how we 8
We eliminated the word “question” from our list of negative words because managers tend to refer to analyst questions in both the prepared remarks section and the Q&A. We also adjusted for negation and did not count the word “good” if it was followed by “morning”, “afternoon”, “evening” or “day”; the word “effective” if it was followed by “income”, “tax” or “rate”, the word “efficiency” if it was followed by “ratio”; or the word “closing” if it was followed by “remark” or “remarks”.
11
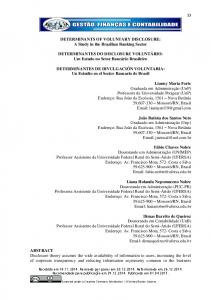
would calculate this measure (based on positive tone), we count all positive words in each transcript. We then divide the transcript into sections based on the number of positive words: if there are 50 positive words, then the corpus is divided into 50 sections of equal length. ARF is the proportion of these sections containing at least one positive word. In this example, if all of the positive words are clustered together into one section, then average reduced frequency is 1/50. Alternatively, if every section contains one positive word, then ARF is 50/50. Thus, a higher ARF (closer to 1) indicates that words are more “evenly” distributed throughout the transcript, while smaller values of ARF indicate a “chunkier” distribution. Figure 1 plots the relative placement of words in a few selected conference calls to demonstrate the idea of ARF. The first row of selected conference calls (Tickers: WLT, CHKP, and SPG) demonstrates conference call narratives that disperse positive tone more than negative tone. Walter Energy, Inc. (WLT) has an ARF of 0.63 with positive words but only has an ARF of 0.21 with negative words. Check Point Software Technologies (CHKP) and Simon Property Group (SPG) are two other examples of this type of disclosure narrative with positive ARF values (pos_arf) of 0.60 and 0.67 and negative ARF values (neg_arf) of 0.23 and 0.26, respectively. Note that, for these firms, negative words are far more likely to be placed together (as demonstrated by the spikes in percentage of tone words), relative to the placement of positive words. However, this phenomenon seems to vary by firm such that, according to our measure, the firms on the second row of Figure 1 (ACMR, ACTG, and AFG) all have identical placement of both positive and negative words and the third row of firms (RHI, TOL, FMCN) disperse negative tone more than positive tone. 9 Thus, Figure 1 and the descriptive statistics reported in Table 1 reveal that there is significant variability in the average reduced frequency measure between firms.
9
The following are the ARF values for the remaining firms in Figure 1: Row 2 – ACMR (pos_arf: 0.50, neg_arf: 0.50); ACTG (pos_arf: 0.50, neg_arf: 0.50); AFG (pos_arf: 0.60, neg_arf: 0.60); Row 3 – RHI (pos_arf: 0.29, neg_arf: 0.55); TOL (pos_arf: 0.33, neg_arf: 0.68); FMCN (pos_arf: 0.33, neg_arf: 0.70)
12
For our analysis, we collect 36,047 conference call transcripts from SeekingAlpha.com between 2004 (the earliest year available) and 2011. We use Perl to separate the conference call into three sections: the list of participants, the prepared remarks section and the question-and-answer section (Q&A). We only include a transcript in our sample if our Perl script is able to detect all three sections because some of the available transcripts either do not contain some of these sections or they use inconsistent formatting which reduces the sample to 34,115. To make sure our measures of tone contain only manager or analyst speech, we calculate ARF after cleaning the prepared remarks and Q&A sections of all HTML, special characters and comments by the operator. We then use Perl and the list of participants to separate the speech of managers and analysts in the Q&A section. In order to do this, we require at least one person from the list of participating managers to be identified in the Q&A, leaving 33,484 transcripts. Because the date that the transcript is posted to SeekingAlpha.com can differ from the date of the call itself, we require our Perl script to identify the date of the call in the transcript header. This eliminates 2,128 transcripts, leaving a sample of 31,893. We then match that sample to the Compustat database as of the closest date prior to, but within 3 days of, the call, leaving 20,339 transcripts with timely Compustat data available. We lose additional firm-quarter observations when matching with CRSP and IBES resulting in 18,306 observations with the requisite data for our analyses. 3.2 DESCRIPTIVE STATISTICS Table 1 contains descriptive statistics on the length (in words), tone, earnings news, variables of interest and conference call characteristics for the conference call sample used later in the multivariate regressions, as well as characteristics of the length of the Q&A session for the conference call, for both the analysts’ portion of the Q&A and managers’ portion of the Q&A. We find that the average (median) length of the prepared remarks in our sample is 3,025 (2,885) words, which is slightly longer than the 2,928 (2,798) words reported in Matsumoto, Pronk, and Roelofsen [2011]. This is on average about 7 single spaced pages when the disclosure narrative is written out. 13
There are substantially more positive words than negative words in the prepared remarks section, with a mean of 55.6 positive words and 29.9 negative words. Table 1 also indicates that 24 (35) percent of our firm quarter observations are loss (I/B/E/S miss) quarters and that the median firm beats analysts’ expectations by about 3.5 percent. Consistent with Chen, Demers and Lev [2012] we find that approximately 26 percent of our firms make conference calls at (or after) 5 PM EST or on a Saturday or Sunday. The descriptive statistics on the average reduced frequency measures indicate that there is a statistically significant difference between the extent to which firms disperse positive and negative tone, although the difference is very small. The mean (median) ratio of the difference in tone dispersion is 1.035 (1.016), which is statistically greater than one. Tests of the mean and median differences between positive and negative tone dispersion are consistent with good news being more dispersed than bad news (i.e., positive tone dispersion less negative tone dispersion is statistically greater than 0 at less than the 1% level). Additionally, consistent with Figure 1, there appears to be significant variation in firms’ tone dispersion. This evidence suggests that there are conference calls that seem to be prepared consistent with a strategy of dispersing good news and condensing bad news (Q3 ratio = 1.13) and others that are prepared contrary to these potential strategic motivations (Q1 ratio = 0.91). Table 1 also reports that analysts ask on average 24 questions with an average total word count of 1,078 words, indicating that analysts’ questions are approximately one-third the length of the prepared remarks section of the call. Managers’ responses to analysts’ questions are similar in length to the prepared remarks section, such that the word count of 2,817 (2,754) words is only a few hundred words less on average (on the median) than the prepared narrative. Managers are significantly more optimistic in their responses to analysts than are the analysts’ questions themselves. However, we do not find a large difference in managers’ net optimism between their prepared narrative and the responses to analysts’ questions during the Q&A. 14
3.3.1 MODELING THE DECISION TO VARY TONE DISPERSION In order to address our hypotheses, we model the decision to disperse tone as a joint function of whether managers vary the tone structure in the prepared narrative based on current and future earnings performance (H1) and managers’ incentives and strategies to manage perceptions of firm value (H2). We test these hypotheses by examining the association of our average reduced frequency measures, pos_arf, neg_arf, and tone_dispersion, with firm performance and financial reporting behavior. The variable pos_arf is the average reduced frequency of positive words as described above. The variable neg_arf is simply the average reduced frequency of negative tone words. For both pos_arf and neg_arf values closer to one (zero) suggest a more dispersed (condensed) distribution of tone words throughout the text of the conference call. Finally, tone_dispersion is the degree to which managers disperse positive tone more than they disperse negative tone: pos_arf divided by neg_arf. We define all variables included in our tests in Appendix A. To test H1, we first examine whether managers’ performance discussions in conference calls are related to disaggregated current performance. We calculate our measure of disaggregated current performance, disagg_perf, as the natural log of the number of items on the income statement that represent increases in income increasing items (e.g., sales) or decreases in income decreasing items (e.g., expenses), using all items reported in the COMPUSTAT quarterly database, common sized by sales. Thus, if firm performance relative to the same quarter the prior year improves along multiple dimensions, then the disagg_perf measure will increase. Consistent with H1, we predict that as managers have more positive items to discuss, our measures of positive (negative) tone dispersion will increase (decrease). We also calculate a measure based on the same quarter one year ahead (disagg_perform_f1) to examine whether tone dispersion might also be related to future improvements in firm margins. We note that tone dispersion may not be related to disagg_perform_f1 because we have rarely seen managers
15
talking about how current performance may be related to disaggregated future performance in their conference calls. We also include earnings performance news: an indicator variable coded one if the firm has negative earnings (loss); an indicator variable equal to one if the firm misses analyst expectations (ibes_miss), and the percentage difference between the firm’s actual earnings and consensus analyst expectations (%Δibeseps). 10 As linguistic measures have been found to convey incremental information about firm performance (Price, Doran, Peterson and Bliss [2012]), we include the log of the number of positive words (poscount), and the log of the number of negative words (negcount) in the prepared remarks section of the conference call to investigate whether tone is more dispersed as sentiment increases. Finally, as alternative profitability metrics, we include current return on assets (roa) and future return on assets (roa_f1). To examine H2, our tests include other attributes related to managers’ financial reporting decisions; %specialitems, accruals, pfcount, and fog, as well as measures of strategic reporting by managers; ratchet_down and nontrading. We include the magnitude of negative special items (%specialitems), calculated as negative special items as a percentage of sales, where positive special items are set equal to zero and negative special items are multiplied by -1 following McVay [2006]. Prior research has found that managers have incentives to report core expenses (defined as cost of goods sold and selling, general, and administrative expenses) as income decreasing special items in an attempt to inflate core profitability. Our negative word list contains many words related to these special items, such as “abandon,” “restructuring,” and “writedown.” Thus, discussions of special items in conference calls may be related to tone dispersion. We include accruals because Das, Kim, and Patro [2011] find that managers use earnings management and expectation management complementarily when managers’ ability to use earnings
10
Our results are robust to including alternative measures of earnings news such as standardized unexpected earnings (SUE) and unscaled unexpected earnings variables.
16
management is less restricted and as substitutes as the constraints on earnings management increase. Since many of our expectation management variables may depend on the use of earnings management, we include total accruals measured as the change in non-cash current assets (the change in current liabilities excluding the current portion of long-term debt − depreciation and amortization) divided by lagged total assets (Das, Kim, and Patro [2011]). 11 A positive coefficient on total accruals would suggest that tone dispersion is related to lower earnings quality. Managers often disaggregate performance in order to propose pro forma earnings adjustments, so managers’ discussions of pro forma earnings is also likely to affect our tone dispersion measures. We include pfcount, calculated as the natural log of the total number of pro forma words from Christensen, Merkley, Tucker and Venkataraman [2011], in the analysis to proxy for the amount of pro forma discussion. Finally, prior research has found that managers may want to strategically hide adverse information through less transparent disclosures (Li [2008]). Managers may therefore prepare their disclosure narratives motivated partly by a desire to make them more difficult for investors to uncover information (Bloomfield [2002]; Li [2008]) which may be related to our measure of tone dispersion. Thus, we include fog which is the Fog Index measure of the readability of the prepared remarks section of the conference call. We include ratchet_down, an indicator variable coded one if the value of actual EPS less than I/B/E/S consensus expectations is in the highest decile of all observations in the sample and zero otherwise. Prior research indicates that managers prefer to “ratchet down” expectations of future earnings when they report large earnings surprises (DeFond and Park [1997]; Graham, Harvey, and Rajgopal [2005]). As such, firms may want to provide additional detail regarding bad news when
11
We also tried using other measures of accruals: the Jones model (Jones [1991]); the modified Jones model (Dechow, Sloan, and Sweeney [1995]); the modified Jones model with book-to-market ratio and cash flows as additional independent variables (Larcker and Richardson [2004]); and the modified Jones model with either current-year return on assets (ROA) included as an additional independent variables (Das, Kim, and Patro [2011]). However, none of these accruals measures were related to our measures of tone dispersion in the multivariate models and we lost sample firms due to the inability to run the requisite models to calculate the accruals variables. Thus, we include total accruals with the caveat that when more sophisticated measures are used we do not see a relation with pos_arf or neg_arf.
17
doing so helps them to avoid future negative earnings surprises (Soffer, Thiagarajan, and Walther 2000). Prior research has found that managers disclose bad news after trading hours to mute the market response to the news (Patell and Wolfson [1982]; Francis, Pagach, and Stephan [1992]). These managers may strategically use tone dispersion as well. For this reason we include an indicator variable if the conference call was made during non-trading hours or weekends (nontrading). We include a number of additional variables to examine the relationship between tone dispersion and firm- and call-specific characteristics. The significant correlations among the control variables and the length and tone of the prepared remarks section of the conference calls documented in Panel B of Table 3 suggests the importance of controlling for these factors in the multivariate analyses. We include the log of the number of total words (totalcount) to control for instances where tone is more dispersed as disclosure length increases. We include a variable indicating whether the call is made late (late) in the day since Chen, Demers, and Lev [2012] find that tone is related to the timing of the conference call. We include firm size (sizemktvl) to control for whether the managers of large firms, who are likely more sophisticated, use tone dispersion to a greater degree than other managers. We include the firm’s book-to-market ratio (btom) to control for the possibility that managers of growth firms, which are under higher pressure to meet expectations (Skinner and Sloan [2002]), are more likely to use tone dispersion. Similar to Chen, Demers and Lev [2012] we include leverage (lev), defined as total liabilities divided by total assets, to proxy for the degree to which firm managers use debt versus equity to finance investments. Firms with more equity in their capital structure may be more sensitive to investors’ reaction to their earnings news. To control for the possibility that managers are more likely to use tone dispersion when uncertainty about the firm is high, we include the standard deviation of analyst forecasts prior to the call (stdfcasteps). Additionally, we include the degree of analyst coverage for the firm (an_following), calculated as the natural log of the number of analysts forecasting EPS estimates one month prior to the conference call, to control for interest in firm earnings by sophisticated market participants. We include 18
participantcount, which is the number of managers in the prepared remarks section of the conference call, to control for potential effects from multiple participants on the call affecting our measures of tone dispersion. Finally, prior research has found that managers may use voluntary disclosures to “walk down” analysts to a beatable consensus forecast (Soffer, Thiagarajan, and Walther [2000]; Richardson, Teoh, and Wysocki [2004]). Therefore, we include quarterly fixed effects in the model. 12 3.3.2 RESULTS ON MANAGERS USE OF TONE DISPERSION Table 2 Panel A presents the pairwise correlations between positive and negative ARF and predicted determinants. Consistent with H1, pos_arf is positively associated with disagg_perf and disagg_perf_f1, suggesting that positive tone is more dispersed as disaggregated firm performance improves and positively associated with future earnings, roa_f1. However, neg_arf is not significantly correlated with disaggregated performance in the univariate case, inconsistent with predictions. Both positive and negative tone dispersion are positively related to higher earnings (significantly positively correlated with roa and negatively correlated with loss and ibes_miss). Pairwise correlations between disaggregation of pos_arf and neg_arf and the number of positive and negative words (poscount and negcount) reveal that when managers have more positive things to say they tend to spread out good news (pos_arf and poscount correlation 0.12; p < 0.01), and managers tend to combine their discussions of bad news when they have more bad news to share (neg_arf and negcount correlation -0.09; p < 0.01). Regarding H2, pos_arf is significantly negatively associated with pfcount, suggesting that managers focus more heavily on GAAP earnings when positive tone dispersion is high. However, pos_arf is also positively correlated with accruals and fog, suggesting that tone dispersion reflects increased manager intervention in earnings and reduced disclosure transparency. Although we
12
We winsorize three of our variables (%Δibeseps, accruals, and stdfcasteps) at the 1 percent and 99 percent levels due to the influence of outliers; however, our results on variables of interest are identical when we include these outliers. The statistical significance of the %Δibeseps, accruals, and stdfcasteps variables differs significantly in some cases when the unwinsorized variables are used.
19
predicted that %specialitems would be a significant determinant of neg_arf, the variables are not significantly associated. However, we note that negcount is highly positively correlated with %specialitems, suggesting the need for caution in interpreting associations between our ARF measures and determinants without controlling for other aspects of the disclosure narrative, and particularly levels of tone. We further examine H1 and H2 in the multivariate setting. Table 3 reports the results of regressing the average reduced frequency of positive and negative toned words in the prepared remarks section of conference calls on our variables of interest. Column one reports the results for pos_arf, column two for neg_arf, and column three for tone_dispersion. 13 Consistent with H1, Table 3 indicates that pos_arf and neg_arf are significantly related to current and future firm performance. Specifically, managers’ tend to condense positive tone when they miss IBES expectations (ibes_miss) (t-stat = -4.95) and have more negative news to share (t-stat = -5.14). However, we find that pos_arf is only weakly associated with our measure of disaggregated performance. This evidence suggests that managers use positive tone more to reiterate improved aggregate performance than to disaggregate good news into earnings components. For negative tone dispersion, we find that the coefficient on neg_arf is smaller when firms have a larger number of improvements in components of earnings to report (t-stat = -2.85), but only marginally larger when the firm misses analysts’ expectations, consistent with our predictions in H1 that tone dispersion reflects managers’ insights about individual line items and segments. We also find that negative tone dispersion is significantly positively correlated with poor future earnings (tstat = -2.88), suggesting that negative tone dispersion is incrementally informative about future value. To investigate our evidence that managers appear to use positive tone dispersion to reiterate good aggregate earnings and negative tone dispersion to discuss bad news in earnings components,
13
We test for statistical significance of the parameter estimates by using heteroskedasticity robust standard errors in our regressions with errors clustered by firm.
20
we examine the topical distribution of the top tone words in our sample. Consistent with our statistical results, we find that positive tone dispersion is more highly correlated with words related to aggregate performance than disaggregated performance while negative tone dispersion is more highly associated with managers’ narrative disclosures about earnings components. We also find evidence that negative words relating to special items are commonly used in our setting. Since special items have been found to be reported (Bradshaw and Sloan [2002]) and used (Elliot and Hanna [1996]) very differently from recurring components of earnings, we examine these components separately in our empirical tests in later models. We include the full results of this analysis in Appendix B. In examining H2, Table 3 indicates, consistent with our univariate results, that managers focus more on low quality earnings when positive tone is more dispersed (t-stat = 2.02). Managers also discuss pro forma earnings to a lesser degree (t-stat = -3.21) when positive tone is more dispersed, suggesting that positive tone dispersion reflects managers’ focus on summary GAAP earnings. Managers also tend to condense positive tone when they have more negative special items to discuss (t-stat = -2.14). We will further examine the association between %specialitems and pos_arf in our examination of classification shifting. Finally, pos_arf is marginally associated with lower readability, suggesting an association between the management obfuscation hypothesis (Bloomfield [2002]) and positive tone dispersion. Our H1 tests indicate that negative tone dispersion reflects poor disaggregated current and poor aggregate performance. However, our multivariate test of H2 reveals that managers also appear to use negative tone dispersion to manage expectations downward when performance is extremely high. Specifically, the association between neg_arf and higher performance levels (ratchet_down) is significantly positive. We also find that managers disperse tone less when the conference call takes place outside of trading hours and when they have more negative news to share. These results are consistent with managers selectively emphasizing bad news, which suggests that managers may
21
structure negative tone strategically. Consistent with our expectations, we do not find an association between our measures and future year disaggregation of poor performance. We report the results for the regression on tone_dispersion in column 3. We examine tone dispersion because we are primarily interested in observing whether managers’ tendencies to disperse positive and negative tone can be examined together in one measure. That is, we investigate whether the joint test of a firms’ disclosure structure with good and bad news examined contemporaneously could be incrementally informative relative to the individual measures themselves. Note that the results on tone_dispersion are in essence identical to the individual measures and, in some cases, the joint measure obfuscates associations with the individual measures. Thus we drop further examinations on tone_dispersion. However, note that in the analyses on analyst optimism and the market reaction to tone dispersion the results are strongest when we use this joint measure of pos_arf and neg_arf. Results reported in Table 3 on the control variables suggest that ARF measures are also related to the size of the firm, analyst uncertainty, book-to-market ratios, and the number of analysts following the firm. One item of note is that larger firms seem to disperse negative tone less than smaller firms (t-stat = -3.56). This may suggest that the use of tone dispersion in reporting is related to the sophistication of management or the ability for managers of larger firms to hire editors for their prepared remarks. 14 We also note that the model fit increases significantly (from about 9 percent to 22 percent) when firm fixed effects are included, suggesting that tone dispersion has a significant firm specific component. 3.4.1 MODELING USE OF CLASSIFICATION SHIFTING AND TONE DISPERSION
14 In addition to managerial sophistication, size may also proxy for operating complexity, since larger firms may have more business or geographical segments. This potentially confounds our results, as the dispersion of positive and negative words could be due to good or bad news at individual segments instead of managers’ choices to segregate or integrate. To test this alternative explanation, we include the number of business and geographical segments into our models and the results we observe on variables of interest are qualitatively similar to those reported in Tables 3, 5, and 6.
22
To provide additional evidence for H2, we examine whether tone dispersion is associated with classification shifting by managers. McVay [2006] provides evidence that managers reclassify positive non-recurring items as core earnings and negative recurring items as special items in order to inflate perceptions of firm performance. Managers who engage in classification shifting may be reluctant to disaggregate total earnings into its components, as doing so may reveal these manipulations. On the other hand, some disaggregation is necessary in order to suggest negative special items that managers want analysts and investors to exclude from their estimates of core earnings. In order to investigate whether tone dispersion is related to classification shifting, and thus to expectation management, we follow the testing procedure in McVay [2006] and Fan, Barua, Cready and Thomas [2010]. Specifically, we calculate expected core earnings (sales minus cost of goods sold and SG&A, scaled by sales) by regressing core earnings on core earnings from the prior year and quarter, asset turnover, accruals from the prior quarter and year, current year change in sales, the magnitude of negative sales (equal to sales if sales are negative and zero otherwise) and returns for the current quarter and the quarter previous. We estimate this regression by industry and quarter-year and exclude the firm quarter-year of interest for each regression. Unexpected core earnings is calculated as the actual value of core earnings minus this estimate. In order to test the relationship between tone dispersion and classification shifting, we regress unexpected core earnings on the percentage of negative special items (%specialitems). We then interact tone dispersion with %specialitems to examine whether tone dispersion moderates the relationship between negative special items and unexpected core earnings. Fan, Barua, Cready and Thomas [2010] note that a positive coefficient on the interaction, which suggests a more positive relationship between negative special items and unexpected core earnings, is consistent with higher classification shifting in the presence of the variable of interest. We also include and interact the length of the prepared remarks section and the total number of positive and negative words in order to see whether levels of tone and disclosure are associated with classification shifting, and control for 23
size, book-to-market ratio, leverage, whether the call is held during trading hours, and analyst following and the standard deviation of analyst forecasts. Note the univariate correlation between neg_arf and %specialitems is not significant. As a result, multicollinearity makes it difficult to interpret the coefficient on the interaction. Since both neg_arf and %specialitems are significantly associated with the total number of negative words, however, we isolate the portion of neg_arf that is associated with negative special items by regressing negcount on %specialitems. We include the fitted values from this regression, negcount_si, in our model in place of negcount. We then obtain an adjusted neg_arf by regressing neg_arf on the residual from this regression and taking the residual, which we include in our model as neg_arf_si. 3.4.2 RESULTS ON MANAGERS’ CLASSIFICATION SHIFTING AND TONE DISPERSION Table 4 presents the results of our classification shifting analysis. Consistent with the results in Fan, Barua, Cready and Thomas [2010], we find an overall negative association between %specialitems and unexpected core earnings. The coefficient on the interaction between pos_arf and %specialitems is significantly positive, suggesting that managers disperse positive tone when they engage in classification shifting. Consistent with our results above, which suggest that positive tone dispersion is related to reiterations of positive but lower quality aggregate performance, this result suggests that managers emphasize good aggregate performance when that performance excludes negative recurring items. Even after adjusting for the portion of neg_arf that is unrelated to negative special items, we do not find an association between classification shifting and negative tone dispersion, inconsistent with strategic structuring of negative tone. We also find that managers use fewer overall words but more tone words when classification shifting is higher. 4. Research Design and Results on the Consequences of Tone Dispersion 4.1.1 MODELING ANALYSTS’ REACTION TO TONE DISPERSION We test whether analysts’ tone in their questions during the Q&A is influenced by the structure of tone within the narrative disclosed by managers. Consistent with prior research, we 24
measure analyst tone using the number of positive and negative tone words in their questions. We model analysts’ tone as a function of financial reporting news, firm characteristics, and the reduced frequency measures, pos_arf and neg_arf. We also include the length and sentiment of managers’ answers to analysts’ questions to control for alternative explanations for our results. The dependent variable of the regression model to examine analysts’ tone in the Q&A section of the conference call is analystnetopt (the total number of positive words minus the total number of negative words as a percentage of the total number of positive and negative words in analysts’ Q&A). 15 The variables of interest in this regression are the tone dispersion variables (pos_arf and neg_arf). A significantly positive coefficient on pos_arf and a significantly negative coefficient on neg_arf would indicate that managers’ dispersion of good (bad) news is associated with more (less) optimistic tone in analysts’ questions, consistent with H3. We also repeat our analysis after including two indicator variables (hnc_lneg_arf and lpc_hpos_arf) in order to control for the potential effects of strategic managerial reporting on analysts’ net optimism. We code hnc_lneg_arf (lpc_hpos_arf) if the firm is in the top (bottom) three deciles of negcount (poscount) and is also in the bottom (top) three deciles of neg_arf (pos_arf) and zero otherwise. The premise of these variables is that managers might choose to spread out good news when good news is scarce or condense bad news when bad news is plentiful. These variables capture the influence of the tone level in conjunction with the tone dispersion on analysts. If managers are successful in managing perceptions in this way, we should observe significantly positive coefficients on hnc_lneg_arf and lpc_hpos_arf. Note, however, that a significantly positive coefficient on hnc_lneg_arf could also indicate that dispersed negative tone has more negative implications for future performance than condensed negative tone. We include the control variables for earnings news and firm and conference call characteristics from the prior analysis and add additional control variables to reflect characteristics of
15
Results are identical when we use the natural logarithm of one plus analystnetopt.
25
the Q&A section of the conference call. First, we include the total number of analysts’ words in the Q&A (analysttotalcount) and the total number of analysts’ questions (qcount) as we expect that the use of tone words increases with the level of analysts’ dialog and questions. Second, we also include variables to control for characteristics of management’s answers to analysts’ questions because analyst tone in later questions will likely be affected to some extent by managers’ responses to their earlier questions. Hence, we calculate mgrqatotalcount as the natural log of the total number of words used by managers in the Q&A section of the conference call and mgrqaposcount (mgrqanegcount) as the natural log of the number of positive (negative) words used by managers in the Q&A section of the conference call. 16 4.1.2 ANALYSTS’ REACTION TO TONE DISPERSION Table 5 reports the results from regressing analyst net optimism on our variables of interest. Column one (two) presents the results when we include (exclude) firms with negative special items. These results suggest that analysts’ net optimism is associated with the degree to which managers disperse tone in the prepared remarks section of the conference call. Specifically, analysts’ ask questions with fewer negative words when managers condense their discussions of bad news. 17 This result is consistent with H3, that is, analysts’ responses to managers’ disclosures appear to be associated with the degree of tone dispersion in those disclosures. Columns three and four present the results when we include two indicator variables (hnc_lneg_arf and lpc_hpos_arf) in order to examine the influence of strategic managerial reporting on analysts’ net optimism. The results suggest that when managers spread out scarce good news (lpc_hpos_arf) analysts react more pessimistically, suggesting that they are not influenced by
16
Because management response in the Q&A is largely extemporaneous we do not hypothesize that their answers are structured like that in the prepared narratives. 17 Including qcount, analysttotalcount and mgrqatotalcount in the equation raises concerns about multicollinearity because these variables are highly correlated. For example, the variance inflation factor scores (VIFs) are above 5 for the first specification in column one. When excluding these variables the models are not subject to multicollinearity issues as all VIFs are below 5 (Belsley et al. [1980]). The exclusion of these variables from equation (2) does not affect the results on the variables of interest.
26
managers’ attempts to permeate the disclosure with good news. However, when managers condense plentiful bad news (hnc_lneg_arf) analysts seem to be more optimistic, suggesting that analysts understand the implications of dispersed negative tone for future performance. Also, when we include these variables in the model pos_arf is significantly positive (t-value = 2.07) in the regression including firms with negative special items. Given our evidence that positive tone dispersion reflects managers’ reiteration of aggregate earnings realizations throughout the conference call and that pos_arf is associated with classification shifting, this result may suggest that managers are successful in drawing attention away from classification shifting through tone structure. We note that these multivariate results differ from the univariate results reported in Table 2 for the analyst response variables and their association with neg_arf. Thus, the first order effect of tone dispersion on analysts’ perceptions is different than the association we observe after controlling for the many other factors that may affect the use of positive and negative words by analysts in the Q&A section of these conference calls. This evidence is consistent with our argument that the relative dispersion of tone language should be both less informative about firm value and less salient to analysts than the content of the conference call. 4.2.1 MODELING THE MARKET REACTION TO TONE DISPERSION Finally, to examine H4, we model how ARF in narratives may affect investor perceptions of firm value. We include adjret_3 and adjret_60 as dependent variables in our regression analysis to examine this hypothesis. These variables are the three-day and sixty-day market-adjusted cumulative abnormal returns (CARs) surrounding the conference call date, respectively. 18 We define all variables in Appendix A. The results are consistent with H4 if pos_arf and neg_arf are priced by the market. 4.2.2 THE MARKET REACTION TO TONE DISPERSION
18
Results are qualitatively similar if returns are calculated using a market model with the Fama French three factors plus a momentum factor. The sixty-day CAR is included in the analysis based on prior comments from readers that wondered whether the impact of ARF is temporary or whether the implications persist for more than the day after the conference call date. Thus our window for the sixty-day CAR is one day before the conference call to fifty-eight days after the call.
27
Column one (two) of Table 6 present the results when we include (exclude) firms with negative special items. Following Dellavigna and Pollet [2009], we exclude announcements made during non-trading hours. 19 Table 6 documents that the market appears to react to the degree to which managers disperse negative tone in their prepared remarks. Specifically, three-day CARs are statistically significantly lower when negative tone is dispersed. 20 The results are strongest when we exclude firms with negative special items (columns two and four) or when we extend the returns window to 60 days (columns three and four). Thus, either (i) investors react appropriately to dispersed negative tone as incremental information or (ii) managers are able to draw attention away from bad news by condensing negative tone. This result is consistent with H4. However, inconsistent with H4, we do not find strong evidence of an association between pos_arf and the market’s response to the conference call. Since neg_arf has implications for firm value that pos_arf does not, this result suggests that investors see through managers’ attempts to strategically structure tone. We also note that market returns are positively (negatively) associated with positive (negative) analyst and manager tone. Since we find that analysts ask more optimistic questions when positive (negative) tone is dispersed (condensed), this evidence suggests that the effect of tone dispersion on analysts’ perceptions of firm value may have market implications. 5. Conclusion We examine whether the structure of disclosure narratives provides insight into the information reported in disclosure narratives and how users respond to that information. Specifically, we investigate the determinants and consequences of tone dispersion, or the extent to which positive and negative words are distributed throughout a disclosure and how users respond to the dispersion of
19
Including these firms reduces the significance of the results on neg_arf such that the marginal significance reported in column one on neg_arf is no longer significant at conventional levels. The results in the remaining columns are significant at the 0.10 level, at least. 20 Including qcount, analysttotalcount and mgrqatotalcount in the equation again raises concerns about multicollinearity because these variables are highly correlated. When excluding these variables the models are not subject to multicollinearity issues as all VIFs are below 5 (Belsley et al. [1980]). The exclusion of these variables from does not affect the results on the variables of interest.
28
tone. We find evidence suggesting that positive tone dispersion is associated with improvements in aggregate performance while negative tone dispersion is associated with declines in components of current performance and future performance. We interpret these results to suggest that positive tone dispersion may reflect attempts by managers to draw attention to good performance in poor quality earnings, while negative tone dispersion reflects managers’ attempts to inform users. However, we also find some evidence that managers structure negative tone to draw attention to or away from bad news under certain circumstances. We also find, consistent with negative tone dispersion being incrementally informative, that analysts and investors respond more negatively to firm disclosures when negative tone is dispersed. There are several limitations to our study that we acknowledge. First, the dispersion of tone within disclosure narratives is a potentially noisy measure of the information that managers are communicating and how users respond to those communications. Our analysis cannot directly identify positive or negative news items a firm discusses. Second, our measure of linguistic dispersion, average reduced frequency, is new to the literature and is difficult to benchmark against other studies. Finally, often it is difficult to decipher whether managers use of tone dispersion is merely natural, an intent to inform market participants about their own expectations for the firm, and/or opportunistic in nature. However, despite its limitations, this study makes several contributions to the literature. First, it sheds light on managers’ use of language to convey information about firm performance. Second, we identify differences between managers’ usage of positive and negative words that may prove useful for future research on tone disclosure. Third, we provide insight into disclosure behaviors that suggest whether managers are being informative or opportunistic. Finally, we identify a characteristic of disclosure narratives that affects how analysts and investors respond to firm disclosures.
29
REFERENCES BAGINSKI, S., E. DEMERS, C. WANG, and J. YU. 2012. “Understanding the Role of Language in Management Forecast Press Releases.” Working Paper. BALAKRISHNAN, K., and E. BARTOV. 2010. “Analysts’ Use of Qualitative Earnings Information: Evidence from the IPO Prospectus’ Risk Factors Section.” BARUA, A., S. LIN, and A. M. SBARAGLIA. 2010. “Earnings Management Using Discontinued Operations.” Accounting Review 85 (5): 1485–1509. BELSLEY, D. A., E. KUH, and R. E. WELSCH. 1980. Regression Diagnostics: Identifying Influential Data and Sources of Collinearity. New York, NY: John Wiley & Sons. BHATTACHARYA, N., E. L BLACK, T. E CHRISTENSEN, and C. R LARSON. 2003. “Assessing the Relative Informativeness and Permanence of pro Forma Earnings and GAAP Operating Earnings.” Journal of Accounting and Economics 36 (1–3). Conference Issue on: 285–319. BLACK, E., T. CHRISTENSEN, P. V. KIOSSE, and T. STEFFEN. 2013. “Does Management Discussion of pro Forma Earnings in Press Releases and Conference Calls Influence Street Earnings Exclusions?” Working Paper, April. BLOOMFIELD, R. 2008. “Discussion of ‘Annual Report Readability, Current Earnings, and Earnings Persistence.’” Journal of Accounting and Economics 45 (2-3): 248–52. BLOOMFIELD, R. J. 2002. “The `'Incomplete Revelation Hypothesis' and Financial Reporting.” Accounting Horizons 16 (3): 233–43. BORITZ, J. E. 1985. “The Effect of Information Presentation Structures on Audit Planning and Review Judgments*.” Contemporary Accounting Research 1 (2): 193–218. BOWEN, R. M., A. K. DAVIS, and D. A. MATSUMOTO. 2002. “Do Conference Calls Affect Analysts’ Forecasts?” The Accounting Review 77 (2): 285–316. ———. 2005. “Emphasis on Pro Forma versus GAAP Earnings in Quarterly Press Releases: Determinants, SEC Intervention, and Market Reactions.” Accounting Review 80 (4): 1011–38. BRADSHAW, M., T. CHRISTENSEN, K. GEE, and B. WHIPPLE. 2014. “Empirical Evidence on the Effects of Measurement Error in Non-GAAP Earnings Research.” Working Paper. BRADSHAW, M. T., and R. G. SLOAN. 2002. “GAAP versus The Street: An Empirical Assessment of Two Alternative Definitions of Earnings.” Journal of Accounting Research 40 (1): 41–66. BUSHEE, B. J., D. A. MATSUMOTO, and G. S. MILLER. 2003. “Open versus Closed Conference Calls: The Determinants and Effects of Broadening Access to Disclosure.” Journal of Accounting and Economics 34 (1–3): 149–80. BUTT, J. L., and T. L. CAMPBELL. 1989. “The Effects of Information Order and HypothesisTesting Strategies on Auditors’ Judgments.” Accounting, Organizations and Society 14 (5–6): 471–79. CAMPBELL, J, H. CHEN, D. S. DHALIWAL, H. LU, and L. STEELE. 2010. “The Information Content of Mandatory Risk Factor Disclosures in Corporate Filings”. SSRN Scholarly Paper ID 1694279. Rochester, NY: Social Science Research Network.
30
CHEN, J., E. DEMERS, and B. LEV. 2012. “Oh What a Beautiful Morning! The Effect of the Time of Day on the Tone and Consequences of Conference Calls”. SSRN Scholarly Paper ID 2186862. Rochester, NY: Social Science Research Network. CHRISTENSEN, T. E., K. J. MERKLEY, J. W. TUCKER, and S. VENKATARAMAN. 2011. “Do Managers Use Earnings Guidance to Influence Street Earnings Exclusions?” Review of Accounting Studies 16 (3): 501–27. COHEN, L., D. LOU, and C. MALLOY. 2013. “Playing Favorites: How Firms Prevent the Revelation of Bad News” Working Paper Harvard Business School and NBER. CURTIS, A., S. E. MCVAY, and B. C. WHIPPLE. 2013. “The Disclosure of Non-GAAP Earnings Information in the Presence of Transitory Gains.” The Accounting Review, December 2013. DAS, S., K. KIM, and S. PATRO. 2011. “An Analysis of Managerial Use and Market Consequences of Earnings Management and Expectation Management.” Accounting Review 86 (6): 1935– 67. DAVIS, A. K., J. M. PIGER, and L. M. SEDOR. 2012. “Beyond the Numbers: Measuring the Information Content of Earnings Press Release Language*.” Contemporary Accounting Research 29 (3): 845–68. DAVIS, A. K., and I. TAMA-SWEET. 2012. “Managers’ Use of Language Across Alternative Disclosure Outlets: Earnings Press Releases versus MD&A*.” Contemporary Accounting Research 29 (3): 804–37. DECHOW, P. M., R. G. SLOAN, and A. P. SWEENEY. 1995. “Detecting Earnings Management.” The Accounting Review 70 (2): 193–225. DEFOND, M. L., and C. W. PARK. 1997. “Smoothing Income in Anticipation of Future Earnings.” Journal of Accounting and Economics 23 (2): 115–39. DELLAVIGNA, S., and J. M. POLLET. 2009. “Investor Inattention and Friday Earnings Announcements.” The Journal of Finance 64 (2): 709–49. DEMERS, E., and C. VEGA. 2012. “Linguistic Tone in Earnings Announcements: News or Noise?” SSRN Scholarly Paper ID 1152326. Rochester, NY: Social Science Research Network. DOYLE, J. T., R. J. LUNDHOLM, and M. T. SOLIMAN. 2003. “The Predictive Value of Expenses Excluded from Pro Forma Earnings.” Review of Accounting Studies 8 (2-3): 145–74. DURNEV, A., and C. MANGEN. 2011. “The Real Effects of Disclosure Tone: Evidence from Restatements”. SSRN Scholarly Paper ID 1650003. Rochester, NY: SSRN. ELLIOT, J. A., and J. D. HANNA. 1996. “Repeated Accounting Write-Offs and the Information Content of Earnings.” Journal of Accounting Research 34 (3): 135–55. ELLIOTT, W. B., J. L. HOBSON, and K. E. JACKSON. 2011. “Disaggregating Management Forecasts to Reduce Investors’ Susceptibility to Earnings Fixation.” Accounting Review 86 (1): 185–208. ENGELBERG, J. 2008. “Costly Information Processing: Evidence from Earnings Announcements”. SSRN Scholarly Paper ID 1107998. Rochester, NY: Social Science Research Network. FAIRFIELD, P. M., R. J. SWEENEY, and T. L. YOHN. 1996. “Accounting Classification and the Predictive Content of Earnings.” The Accounting Review 71 (3): 337–55. 31
FAN, Y., A. BARUA, W. M. CREADY, and W. B. THOMAS. 2010. “Managing Earnings Using Classification Shifting: Evidence from Quarterly Special Items.” Accounting Review 85 (4): 1303–23. FRANCIS, J., D. PAGACH, and J. STEPHAN. 1992. “The Stock Market Response to Earnings Announcements Released During Trading versus Nontrading Periods.” Journal of Accounting Research 30 (2): 165–84. FRANKEL, R., M. JOHNSON, and D. J. SKINNER. 1999. “An Empirical Examination of Conference Calls as a Voluntary Disclosure Medium.” Journal of Accounting Research 37 (1): 133–50. GRAHAM, J. R., C. R. HARVEY, and S. RAJGOPAL. 2005. “The Economic Implications of Corporate Financial Reporting.” Journal of Accounting and Economics 40 (1–3): 3–73. HACKENBRACK, K. 1992. “Implications of Seemingly Irrelevant Evidence in Audit Judgment.” Journal of Accounting Research 30 (1): 126–36. HENRY, E. 2008. “Are Investors Influenced By How Earnings Press Releases Are Written?” Journal of Business Communication 45 (4): 363–407. HIRST, D. E., and P. E. HOPKINS. 1998. “Comprehensive Income Reporting and Analysts’ Valuation Judgments.” Journal of Accounting Research 36 (January): 47–75. doi:10.2307/2491306. HOFFMAN, V. B., and J. M. PATTON. 1997. “Accountability, the Dilution Effect, and Conservatism in Auditors’ Fraud Judgments.” Journal of Accounting Research 35 (2): 227– 37. HUANG, X., S. H. TEOH, and Y. ZHANG. 2013. “Tone Management.” The Accounting Review, December, 131219095011009. JONES, J. J. 1991. “Earnings Management During Import Relief Investigations.” Journal of Accounting Research 29 (2): 193–228. KIMBROUGH, M. D. 2005. “The Effect of Conference Calls on Analyst and Market Underreaction to Earnings Announcements.” Accounting Review 80 (1): 189–219. KIMBROUGH, M. D., and I. Y. WANG. 2014. “Are Seemingly Self-Serving Attributions in Earnings Press Releases Plausible? Empirical Evidence.” Accounting Review 89 (2): 635–67. KINTSCH, W., and J. C. YARBROUGH. 1982. “Role of Rhetorical Structure in Text Comprehension.” Journal of Educational Psychology 74 (6). KRAVET, T., and V. MUSLU. 2013. “Textual Risk Disclosures and Investors’ Risk Perceptions.” Review of Accounting Studies, no. Forthcoming (May): 1–35. LARCKER, D. F., and S. A. RICHARDSON. 2004. “Fees Paid to Audit Firms, Accrual Choices, and Corporate Governance.” Journal of Accounting Research 42 (3): 625–58. LEE, Y. J., K. R. PETRONI, and M. SHEN. 2006. “Cherry Picking, Disclosure Quality, and Comprehensive Income Reporting Choices: The Case of Property-Liability Insurers.” Contemporary Accounting Research 23 (3): 655–700. LEE, Y. J. 2012. “The Effect of Quarterly Report Readability on Information Efficiency of Stock Prices.” Contemporary Accounting Research 29 (4): 1137–70. 32
LEHAVY, R., F. LI, and K. MERKLEY. 2011. “The Effect of Annual Report Readability on Analyst Following and the Properties of Their Earnings Forecasts.” Accounting Review 86 (3): 1087– 1115. LI, F. 2006. “Do Stock Market Investors Understand the Risk Sentiment of Corporate Annual Reports?” SSRN eLibrary, April. http://papers.ssrn.com/sol3/papers.cfm?abstract_id=898181. ———. 2008. “Annual Report Readability, Current Earnings, and Earnings Persistence.” Journal of Accounting and Economics 45 (2–3): 221–47. ———. 2010. “The Information Content of Forward-Looking Statements in Corporate Filings: A Naive Bayesian Machine Learning Approach.” Journal of Accounting Research 48 (5): 1049– 1102. LOUGHRAN, T., and B. MCDONALD. 2011. “When Is a Liability Not a Liability? Textual Analysis, Dictionaries, and 10-Ks.” The Journal of Finance 66 (1): 35–65. MAINES, L. A., and L. S. MCDANIEL. 2000. “Effects of Comprehensive-Income Characteristics on Nonprofessional Investors’ Judgments: The Role of Financial-Statement Presentation Format.” The Accounting Review 75 (2): 179–207. MATSUMOTO, D., M. PRONK, and E. ROELOFSEN. 2011. “What Makes Conference Calls Useful? The Information Content of Managers’ Presentations and Analysts’ Discussion Sessions.” The Accounting Review 86 (4): 1383–1414. MAYEW, W. J., N. Y. SHARP, and M. VENKATACHALAM. 2013. “Using Earnings Conference Calls to Identify Analysts with Superior Private Information.” Review of Accounting Studies 18 (2): 386–413. MAYEW, W. J., and M. VENKATACHALAM. 2012. “The Power of Voice: Managerial Affective States and Future Firm Performance.” The Journal of Finance 67 (1): 1–43. MCVAY, S. E. 2006. “Earnings Management Using Classification Shifting: An Examination of Core Earnings and Special Items.” Accounting Review 81 (3): 501–31. MERKLEY, K. J. 2014. “Narrative Disclosure and Earnings Performance: Evidence from R&D Disclosures.” Accounting Review 89 (2): 725–57. OU, J. A., and S. H. PENMAN. 1989. “Financial Statement Analysis and the Prediction of Stock Returns.” Journal of Accounting and Economics 11 (4): 295–329. PATELL, J. M., and M. A. WOLFSON. 1982. “Good News, Bad News, and the Intraday Timing of Corporate Disclosures.” The Accounting Review 57 (3): 509–27. PRICE, S. M., J. S. DORAN, D. R. PETERSON, and B. A. BLISS. 2012. “Earnings Conference Calls and Stock Returns: The Incremental Informativeness of Textual Tone.” Journal of Banking & Finance 36 (4): 992–1011. RENNEKAMP, K. M. 2012. “The Influence of Performance and Reporting Goals on Managers’ Choice of Reporting Complexity in Disclosures.” SSRN eLibrary, July. RICHARDSON, S., S. H. TEOH, and P. D. WYSOCKI. 2004. “The Walk-down to Beatable Analyst Forecasts: The Role of Equity Issuance and Insider Trading Incentives.” Contemporary Accounting Research 21 (4): 885–924.
33
RIEDL, E. J., and S. SRINIVASAN. 2010. “Signaling Firm Performance Through Financial Statement Presentation: An Analysis Using Special Items*.” Contemporary Accounting Research 27 (1): 289–332. SAVICKY, P., and J. HLAVACOVA. 2002. “Measures of Word Commonness.” Journal of Quantitative Linguistics 9 (3): 215. SCHRAND, C. M, and B. R. WALTHER. 2000. “Strategic Benchmarks in Earnings Announcements: The Selective Disclosure of Prior-Period Earnings Components.” The Accounting Review 75 (2): 151. SEDOR, L. M. 2002. “An Explanation for Unintentional Optimism in Analysts’ Earnings Forecasts.” Accounting Review 77 (4): 731–53. SHELTON, S. W. 1999. “The Effect of Experience on the Use of Irrelevant Evidence in Auditor Judgment.” Accounting Review 74 (2): 217. SKINNER, D. J. 2003. “Should Firms Disclose Everything to Everybody? A Discussion of ‘Open vs. Closed Conference Calls: The Determinants and Effects of Broadening Access to Disclosure.’” Journal of Accounting and Economics 34 (1–3): 181–87. SKINNER, D. J., and R. G. SLOAN. 2002. “Earnings Surprises, Growth Expectations, and Stock Returns or Don’t Let an Earnings Torpedo Sink Your Portfolio.” Review of Accounting Studies 7 (2-3): 289–312. SOFFER, L. C., S. R. THIAGARAJAN, and B. R. WALTHER. 2000. “Earnings Preannouncement Strategies.” Review of Accounting Studies 5 (1): 5–26. SPIVEY, N. N. 1990. “Transforming Texts Constructive Processes in Reading and Writing.” Written Communication 7 (2): 256–87. STRUNK, W., and E.B. WHITE. 1979. The Elements of Style. 3rd ed. New York, NY: MacMillan Publishing Company. SYDSERFF, R., and P. WEETMAN. 1999. “A Texture Index for Evaluating Accounting Narratives: An Alternative to Readability Formulas.” Accounting, Auditing & Accountability Journal 12 (4): 459–88. WHIPPLE, B. 2014. “Non-GAAP Earnings and Recurring Item Exclusions.” Working Paper.
34
FIGURE 1 Dispersion of Positive and Negative Words in Various Conference Calls
35
FIGURE 2 Top 50 Companion Words for Each of the Most Common Positive and Negative Tone Words
36
APPENDIX A Variable Definitions Variable Definition Dependent Variables pos_arf Relative placement of positive words (LM 2011) in the prepared remarks section of conference calls. neg_arf Relative placement of negative words (LM 2011) in the prepared remarks section of conference calls. tone_dispersion pos_arf divided by neg_arf (i.e., the ratio of pos_arf over neg_arf). Unexpected_ Unexpected core earnings as calculated in Fan et al (2010) by regressing core CoreEarnings earnings on its determinants by industry quarter-year, excluding the firm yearquarter of interest, and subtracting the actual value of core earnings from the fitted values of that regression. analystnetopt The total number of positive words less total number of negative words divided by total number of positive and negative words (LM 2011) in analysts Q&A. Adjret_3 Equal to the three-day market-adjusted holding period returns surrounding the conference call date (-1,0,1). Adjret_60 Equal to the sixty-day market-adjusted holding period returns surrounding the conference call date. Independent and Additional Variables of Interest totalcount Logarithm of total word count in prepared remarks section of the conference call. poscount Logarithm of total number of positive words (LM 2011) in prepared remarks section of the conference call. negcount Logarithm of total number of negative words (LM 2011) in prepared remarks section of the conference call. netopt Total number of positive words less total number of negative words divided by total number of positive and negative words (LM 2011) in prepared remarks section of the conference call. %specialitems Negative special items as a percentage of sales, where positive special items are set equal to zero and negative special items are multiplied by -1. disagg_perform Logarithm of the count of the number of items on the income statement that represent increases in income increasing items (e.g., sales) or decreases in income decreasing items (e.g., expenses) using all items reported in the COMPUSTAT quarterly database. The measure is calculated by common sizing all items (except sales) by sales and comparing these margins to the same quarter last year. We also calculate a measure based on the same quarter one year ahead (disagg_perform_f1). accruals Total accruals are measured as (the change in non-cash current assets-the change in current liabilities excluding the current portion of long-term debt-depreciation and amortization)/lagged total assets. pfcount Logarithm of total number of pro forma words from Christensen et al (2011). fog The Fog Index of the prepared remarks section of the conference call. loss One if actual EPS is less than zero; zero otherwise. ibes_miss One if actual EPS less than IBES consensus expectations; zero otherwise. ratchet_down One if the value of actual EPS less than IBES consensus expectations is in the highest decile of all observations in the sample; zero otherwise.
37
APPENDIX A — Continued Variable %Δibeseps
Definition Percent difference in actual EPS relative to IBES consensus expectations, calculated as actual EPS less than IBES consensus expectations divided by the absolute value of median IBES consensus expectations unless median IBES consensus expectations equal zero in which case mean IBES consensus expectations are utilized. hnc_lneg_arf One if the firm is in the top three deciles of negcount while also being in the bottom three deciles of neg_arf; zero otherwise. lpc_hpos_arf One if the firm is in the bottom three deciles of poscount while also being in the highest three deciles of pos_arf; zero otherwise. late One if the conference call occurs after 4 PM EST; zero otherwise. nontrading One if the conference call occurs after 5 PM EST or on a weekend; zero otherwise. roa Return on Assets calculated as quarterly net income divided by average quarterly total assets (average of total assets and lagged quarterly total assets). We also include a forward lagged (same quarter one year ahead) ROA variable (roa_f1) in our regressions. sizemktvl Market capitalization calculated one month prior to conference call. btom Book-to-market ratio calculated as total current equity divided by sizemktvl one month prior to conference call. lev Total Liabilities to Assets ratio calculated one month prior to conference call. stdfcasteps Standard deviation of analysts’ forecasts one month prior to conference call. an_following Number of analysts forecasting EPS estimates one month prior to the conference call. qcount Number of questions asked by analysts in the Q&A of the conference call. participantcount Number of managers speaking on the prepared section of the conference call. (It doesn’t include those that answered questions but did not speak, does it?) analysttotalcount Logarithm of total word count in analysts’ questions in the Q&A of the conference call. mgrqaposcount Logarithm of total number of positive words (LM 2011) used by managers in Q&A of the conference call. mgrqanegcount Logarithm of total number of negative words (LM 2011) used by managers in Q&A of the conference call. mgrqanetopt Total number of positive words less total number of negative words divided by total number of positive and negative words (LM 2011) used by managers in Q&A of the conference call.
38
APPENDIX B Word Associations In order to investigate our first research question, we examine the narrative context of our most common tone words. 21 Panel A lists the most common positive and negative tone words. We select the top three words from each category 22 and examine words that occur within the same sentence of these tone words in order to investigate the context in which these words are used. Panel A: Most Common Tone Words Positive Negative Tone Tone strong loss good decline improve restructuring positive negative opportunities difficult
Panel B presents the most common words that occur within the same sentence as each tone word (for brevity, we refer to these as “companion” words). Unsurprisingly, the word “quarter” tends to co-occur very frequently with both positive and negative tone words. For positive words, companion words like “growth” and “performance” seem likely to relate to total earnings, while words like “sales,” “cost,” and “cash” relate to components of performance. In addition, the word “expect” suggests that “improve” is associated with future earnings, while the word “continue” suggests that both “good” and “improve” are associated with managers’ benchmarking current performance against past performance. For negative words, the word “loss” appears to reflect mostly aggregate earnings per share and comparisons with prior period earnings. The words “decline” and “negative,” however, are associated with performance components such as “sales,” “revenue,” and “cash.” strong quarter growth cash sales performance
Panel B: Most Common Companion Words good improve loss decline quarter continue quarter quarter growth quarter net sales continue expect share revenue progress performance per due performance cost compared lower
negative quarter impact sales cash positive
While informative, this analysis only reveals the most common contexts for each word. To match our prediction that tone dispersion reflects discussions of multiple performance components, we further examine the diversity of topics associated with each tone word. Figure 2 presents the top 50 companion words for each positive and negative tone word, respectively, along with the fraction of sentences in which the companion word occurs. A more skewed distribution suggests that a particular tone word is associated with fewer topics, while a more even distribution suggests that a tone word is used in a variety of contexts. For positive words, the word “strong” is heavily skewed towards its top two companion words, “quarter” and “growth,” suggesting that managers use “strong” more to describe aggregate 21
We do not require the WRDS database data to examine the context of tone and word associates so the analyses in this section is on the sample of 31,893 conference call transcripts described above. 22 We do not investigate the word “restructuring” because its context is relatively clear.
39
performance than components of earnings. The word “improve,” on the other hand, is much less skewed, indicating strong associations with such words as “cost,” “margins,” “operating,” “market,” and “customers,” all words that we would associate with components of earnings. The word “good” is somewhat less skewed than “strong” and more skewed than “improve,” suggesting that “good” is associated with both aggregate earnings and earnings components. For negative words, the skewness of the word “loss” towards discussions of total earnings is even more pronounced than the word “strong,” with the word “quarter” co-occurring in more than 60% of sentences. The word “decline,” on the other hand, is much less skewed and is associated with “sales,” “revenue,” “margin,” and “operating.” Similar to the word “good,” the word “negative” appears to be associated with both aggregate earnings and earnings components. Given these results, we then examine whether tone dispersion is more highly associated with tone words used to discuss total earnings or earnings components. Panels C and D present the correlations between our measures of positive and negative tone dispersion and counts of their companion words. For Panels C and D, Spearman correlations are reported above the diagonal and Pearson correlations are reported below the diagonal. BOLD denotes significantly different from zero at the 10 percent level or better (two-tailed). Contrary to our expectations, positive tone dispersion is more positively associated with the word “strong”, which we associate with discussions of aggregate performance, than the word “improve”, which we associate with discussions of performance components. These correlations suggest that managers reiterate good news about aggregate earnings throughout their disclosure narratives and tend to condense their discussions of earnings components. Panel C: Correlations between Positive Tone Dispersion and Top 3 Companion Words pos_arf pos_arf strong good improve
0.13 0.07 0.02
strong 0.13 0.26 0.09
good 0.07 0.20
improve 0.01 0.08 0.05
0.05
Panel D: Correlations between Negative Tone Dispersion and Top 3 Companion Words neg_arf neg_arf loss decline negative
-0.09 -0.01 -0.02
loss -0.10 0.06 0.07
decline -0.02 0.05
negative -0.03 0.04 0.12
0.13
Negative tone, on the other hand, is more dispersed throughout disclosure narratives when managers use the word “decline,” which we associate with discussions of performance components, than when they use the word “loss,” which appears to be used predominantly to discuss aggregate earnings. Together, these results suggest that dispersed negative tone is the result of managers reporting bad news spread evenly across accounts and lines of business, while dispersed positive tone reflects good news in total earnings repeatedly emphasized by managers. In addition, the presence of the word “restructuring” in Panel A suggests that negative tone dispersion is affected by non-recurring components of earnings. We incorporate this finding when we design our statistical tests.
40
TABLE 1 Descriptive Statistics Variable
Mean
Median
Relative Frequency Measures: pos_arf 0.5737 neg_arf 0.5671 tone_dispersion 1.0345 Current Performance Variables: disagg_perf 6.0496 loss 0.2357 ibes_miss 0.3483 %Δibeseps -0.3913 poscount 55.6343 negcount 29.9066 roa 0.0054 Future Performance Variables: disagg_perf_f1 5.9247 roa_f1 0.0049 Financial Reporting Variables: %specialitems 0.0247 accruals -0.1202 pfcount 3.2655 fog 14.6656 Strategic Reporting Variables: ratchet_down 0.1016 nontrading 0.2554 Additional Variables: totalcount 3,025.0 late 0.1270 sizemktvl 8,465.8 btom 0.7554 lev 0.5512 stdfcasteps 0.0521 an_following 9.7944 participantcount 3.5967
41
Std
Q1
Q3
0.5758 0.5649 1.0161
0.0595 0.0840 0.1942
0.5385 0.5143 0.9091
0.6111 0.6154 1.1333
6.0 0 0 0.0353 50.0 25.0 0.0099
2.1785 0.4244 0.4764 8.3496 31.1054 20.5923 0.0534
4.0 0 0 -0.1020 34.0 16.0 0.0006
8.0 0 1 0.1818 71.0 38.0 0.0224
6.0 0.0092
2.1907 0.0502
4.0 0.0000
8.0 0.0208
0 -0.0353 1.0 14.6608
0.0955 0.9073 5.1331 1.5059
0 -0.0792 0 13.7080
0.0078 -0.0072 4.0 15.6415
0 0
0.3021 0.4361
0 0
0 1
2,885.0 0 1,623.3 0.5305 0.5477 0.0200 8.0 3.0
1,179.2 0.3329 25,653.4 1.8402 0.2656 0.0906 6.7887 1.3680
2,216.0 0 455.9 0.3049 0.3733 0.0100 4.0 3.0
3,642.0 0 5,820.7 0.8847 0.7084 0.0500 14.0 4.0
TABLE 1 — Continued Variable Q&A Variables: analysttotalcount analystposcount analystnegcount analystnetopt qcount mgrqatotalcount mgrqaposcount mgrqanegcount mgrqanetopt Market Returns: adjret_3 adjret_60
Mean
Median
1,078.0 9.7810 8.2570 0.0892 24.07 2,816.7 36.2309 19.4661 0.2983 0.0020 0.0205
Std
Q1
Q3
1,046.0 457.2 9.0 5.9017 7.0 5.5932 0.1000 0.3438 23.0 10.4748256 2,754.0 1,263.4 33.0 20.3724 17.0 12.7082 0.3253 0.2788
741.0 5.0 4.0 -0.1429 16.0 1,880.0 20.0 10.0 0.1250
1,375.0 13.0 11.0 0.3333 31.0 3,645.0 49.0 26.0 0.5000
-0.0005 0.0000
-0.0477 -0.1066
0.0502 0.1122
0.1036 0.2592
Notes to Table 1: Descriptive statistics above are calculated using the 18,306 observations used in Tables 3 and 5. %Δibeseps, accruals, and stdfcasteps are winsorized at 1st and 99th percentile due to concerns with outliers. See Appendix A for variable descriptions.
42
TABLE 2 Correlations (1) (1) pos_arf (2) neg_arf (3) tone_dispersion (4) dissagg_perf (5) loss (6) ibes_miss (7) %Δibeseps (8) poscount (9) negcount (10) roa (11) dissagg_perf_f1 (12) roa_f1 (13) %specialitems (14) accruals (15) pfcount (16) fog (17) ratchet_down (18) nontrading
0.04 0.53 0.06 -0.07 -0.08 0.06 0.12 -0.04 0.06 0.03 0.05 -0.03 0.02 -0.02 0.02 -0.01 -0.04
(2) 0.04 -0.79 -0.01 -0.06 -0.03 0.03 0.00 -0.12 0.06 -0.01 0.04 0.01 0.00 -0.01 -0.03 0.01 -0.01
(3) 0.52 -0.79 0.04 0.01 -0.02 0.01 0.08 0.09 -0.01 0.02 -0.01 -0.02 0.01 0.00 0.04 -0.02 -0.02
(4) 0.06 0.00 0.05 -0.18 -0.19 0.20 0.08 -0.13 0.17 -0.02 0.07 0.10 0.05 0.02 -0.01 0.05 -0.04
(5) -0.06 -0.06 0.01 -0.18 0.27 -0.25 -0.07 0.17 -0.72 0.08 -0.41 0.21 0.03 -0.02 0.12 0.00 0.02
(6) -0.08 -0.04 -0.02 -0.19 0.27 -0.83 -0.15 0.17 -0.31 0.05 -0.22 0.05 0.01 -0.13 0.03 -0.25 -0.05
(7) 0.00 0.00 0.00 0.04 -0.13 -0.13 0.11 -0.14 0.25 -0.05 0.15 -0.07 0.03 0.09 -0.03 0.52 0.06
(8) 0.12 0.00 0.04 0.08 -0.08 -0.14 0.02 0.34 0.08 0.04 0.09 0.12 -0.03 0.22 0.22 0.00 0.01
43
(9) -0.04 -0.09 0.00 -0.12 0.18 0.17 -0.06 0.32 -0.25 0.02 -0.14 0.19 0.01 0.01 0.13 -0.01 -0.11
(10) 0.04 0.05 -0.01 0.13 -0.51 -0.19 0.16 0.05 -0.13 -0.12 0.60 -0.22 -0.14 0.02 -0.14 -0.06 0.00
(11) 0.03 -0.01 0.02 -0.01 0.07 0.05 -0.02 0.05 0.03 -0.07 0.19 -0.02 0.00 0.02 0.05 -0.01 -0.05
(12) 0.03 0.01 0.01 0.04 -0.26 -0.11 0.02 0.06 -0.03 0.28 0.14 -0.05 -0.20 0.04 -0.10 -0.07 -0.02
(13) -0.05 -0.02 -0.02 -0.01 0.34 0.10 -0.18 -0.01 0.14 -0.53 -0.01 -0.06 -0.10 0.21 0.07 -0.01 -0.01
(14) 0.04 0.01 0.00 0.01 0.01 -0.02 0.01 0.03 0.05 0.00 0.00 -0.03 -0.01 -0.12 0.07 0.07 -0.04
(15) -0.04 0.00 -0.02 0.00 -0.01 -0.13 0.02 0.17 -0.03 -0.01 -0.01 0.01 0.06 0.00 0.04 0.00 0.13
(16) 0.02 -0.03 0.03 -0.01 0.12 0.03 -0.01 0.20 0.12 -0.10 0.04 -0.08 0.04 0.03 0.03 0.00 0.07
(17) -0.01 0.02 -0.01 0.05 0.00 -0.25 0.09 0.00 0.00 0.02 -0.01 -0.01 -0.02 -0.01 0.00 0.00 0.02
(18) -0.04 0.00 -0.01 -0.04 0.02 -0.05 0.02 -0.01 -0.10 -0.02 -0.06 -0.03 0.01 -0.05 0.19 0.08 0.02
TABLE 2 — Continued (1) (1) pos_arf (2) neg_arf (3) tone_dispersion (4) totalcount (5) late (6) sizemktvl (7) btom (8) lev (9) stdfcasteps (10) an_following (11) participantcount (12) analysttotalcount (13) analystnetopt (14) qcount (15) mgrqatotalcount (16) mgrqanetopt (17) adjret_3 (18) adjret_60
0.04 0.53 0.05 0.00 0.12 -0.08 0.04 -0.02 0.06 0.00 0.03 0.05 0.00 0.06 0.06 0.03 0.02
(2) 0.04 -0.79 -0.04 0.00 0.02 -0.01 -0.02 -0.02 0.02 -0.04 0.03 0.02 0.04 0.03 0.03 0.01 0.00
(3) 0.52 -0.79 0.07 0.00 0.06 -0.04 0.05 0.01 0.02 0.03 -0.01 0.01 -0.03 0.02 0.02 0.00 0.01
(4) 0.04 -0.04 0.02 -0.02 0.23 -0.05 0.09 0.05 0.23 0.19 0.00 0.00 -0.10 0.12 0.07 -0.01 0.00
(5) 0.00 0.00 0.01 -0.02 -0.07 -0.05 -0.13 -0.07 -0.02 -0.01 -0.03 0.03 -0.01 -0.02 0.05 0.01 0.00
(6) 0.06 -0.01 0.04 0.16 -0.02 -0.29 0.14 0.14 0.65 0.19 0.37 0.05 0.19 0.38 0.10 0.04 -0.01
(7) -0.03 0.00 -0.03 -0.02 -0.02 -0.05 -0.05 0.18 -0.23 0.04 -0.11 -0.20 -0.05 -0.13 -0.25 -0.04 0.02
(8) 0.05 -0.02 0.03 0.08 -0.12 0.02 -0.05 0.27 0.00 0.14 0.01 -0.13 0.00 0.01 -0.15 0.02 0.01
(9) -0.04 -0.03 -0.01 0.03 -0.03 0.02 0.10 0.18 0.14 0.17 0.08 -0.11 0.08 0.05 -0.17 -0.02 -0.01
(10) 0.06 0.03 0.01 0.21 0.01 0.36 -0.10 -0.03 0.00 0.14 0.43 0.08 0.25 0.43 0.13 0.02 -0.01
(11) 0.01 -0.03 0.03 0.16 -0.01 0.00 0.01 0.10 0.09 0.10 0.07 -0.03 0.04 0.05 0.00 0.00 -0.01
(12) 0.03 0.04 -0.01 -0.01 -0.03 0.11 -0.04 -0.01 0.03 0.38 0.07 0.01 0.86 0.60 0.01 0.00 0.00
(13) 0.04 0.03 0.02 -0.01 0.03 0.02 -0.09 -0.12 -0.12 0.08 -0.04 0.02 -0.04 0.02 0.39 0.13 0.06
(14) 0.01 0.04 -0.03 -0.11 -0.01 0.01 -0.02 -0.01 0.04 0.19 0.04 0.85 -0.04 0.47 -0.07 0.00 -0.01
(15) 0.06 0.03 0.01 0.11 -0.01 0.14 -0.05 0.00 0.00 0.39 0.06 0.58 0.03 0.45 0.05 -0.01 0.00
(16) 0.05 0.04 0.02 0.06 0.05 0.08 -0.09 -0.13 -0.18 0.14 -0.02 0.02 0.39 -0.06 0.07 0.09 0.04
(17) 0.02 0.01 0.01 -0.02 0.01 0.00 -0.02 0.03 -0.01 0.00 0.00 -0.02 0.12 -0.02 -0.02 0.08
(18) 0.00 0.00 0.00 0.00 0.00 -0.02 0.07 0.02 0.01 -0.04 -0.01 -0.03 0.04 -0.02 -0.02 0.01 0.44
0.43
Notes to Table 2: Correlations reported above are calculated using the 18,306 observations used in Tables 3 and 5. Pearson correlations are presented above the diagonal and Spearman correlations are presented below the diagonal. BOLD denotes significantly different from zero at the 10 percent level or better (two-tailed). See Appendix A for variable descriptions.
44
TABLE 3 Tone Dispersion Regressions Dependent Variable Current Performance Variables: disagg_perf loss ibes_miss %Δibeseps poscount negcount roa Future Performance Variables: disagg_perf_f1 roa_f1 Financial Reporting Variables: %specialitems accruals pfcount fog Strategic Reporting Variables: ratchet_down nontrading Additional Variables: totalcount late sizemktvl btom lev stdfcasteps an_following participantcount Firm Fixed Effects Year Fixed Effects Qtr Fixed Effects Adj. R Square n
pos_arf Coeff t-stat
neg_arf Coeff t-stat
0.003 -0.002 -0.006 0.000 -0.003 -0.007 -0.005
-0.007 -0.003 0.003 0.000 -0.008 -0.038 0.015
1.92* -0.92 -4.95*** -0.48 -1.24 -5.14*** -0.30
0.002 0.014
1.17 -0.001 1.24 -0.048
-0.016 0.002 -0.003 0.001 0.000 0.001
tone_dispersion Coeff t-stat
-2.85*** 0.020 -1.08 0.005 1.84* -0.016 0.14 0.000 -2.57** 0.007 -15.97*** 0.039 0.81 -0.032 -0.26 -2.88***
3.35*** 0.85 -3.89*** -0.47 0.94 7.16*** -0.57
0.005 0.111
0.99 2.95***
-2.14** 0.014 2.02** 0.001 -3.21*** -0.002 1.85* 0.001
1.61 -0.052 0.64 0.001 -1.50 -0.001 1.08 0.000
-2.40** 0.38 -0.21 -0.22
-0.24 0.006 0.73 -0.005
2.14** -0.013 -1.82* 0.009
-2.07** 1.52
0.009 2.30** 0.039 7.06*** 0.001 0.32 0.002 0.52 0.001 0.41 -0.008 -3.56*** -0.001 -1.81* 0.000 -0.90 0.003 0.32 0.009 0.90 -0.021 -2.22** -0.007 -0.70 0.000 -0.10 0.007 2.56** 0.000 -0.41 -0.001 -1.66* Included Included Included Included Included Included 22.29% 15.50% 18,306 18,306
-0.055 -4.00*** -0.002 -0.25 0.016 3.11*** -0.001 -0.92 -0.008 -0.36 -0.025 -0.96 -0.015 -2.24** 0.002 1.14 Included Included Included 13.80% 18,306
Notes to Table 3: The dependent variables in the fixed effects regression models estimated above are listed as column headers. See Appendix A for variable descriptions. ***, **, and * indicate statistical significance at the 1, 5, and 10 percent levels, respectively (two-tailed). We test for statistical significance of the parameter estimates by using heteroskedasticity robust standard errors in our regressions with errors clustered by firm. %Δibeseps, accruals, and stdfcasteps are winsorized at 1st and 99th percentile due to concerns with outliers.
45
TABLE 4 McVay (2006) Regression with Tone Dispersion Unexpected_CoreEarnings Coeff t-stat -94.418 -2.39** -0.068 -1.93* 0.013 0.63 0.008 0.97 -0.009 -1.69* 39.246 2.42** 0.877 2.13** -0.393 -0.93 -0.330 -2.35** 0.222 2.00** 16.642 2.42** 0.003 2.42** -0.001 -0.64 0.010 1.41 0.000 -0.12 -0.035 -1.06 -0.002 -0.77 -137.580 -2.35** 1.20% 6,245
Dependent Variable %specialitems pos_arf neg_arf totalcount poscount negcount_si %specialitems×pos_arf %specialitems×neg_arf_si %specialitems×totalcount %specialitems×poscount %specialitems×negcount_si sizemktvl btom lev nontrading stdfcasteps an_following Intercept Adj. R Square n
Notes to Table 4: The dependent variable in the regression model estimated above is unexpected core earnings. Standard errors are adjusted for heteroskedasticity. Results are qualitatively similar when standard errors are clustered by firm, but the significance of the variables of interest is reduced. See Appendix A for variable descriptions, except for negcount_si, which is calculated by regressing the count of negative words in the prepared remarks section on %specialitems and taking the fitted values; and neg_arf_si which is calculated by regressing neg_arf on the residual from the above regression and taking the residual. ***, **, and * indicate statistical significance at the 1, 5, and 10 percent levels, respectively (two-tailed). The stdfcasteps variable is winsorized at 1st and 99th percentile due to concerns with outliers.
46
TABLE 5 Analyst Q&A Net Optimism Regressions on Tone Dispersion Measures Dependent Variable Tone Dispersion Variables: pos_arf neg_arf Current Performance Variables: disagg_perf loss ibes_miss %Δibeseps poscount negcount roa Future Performance Variables: disagg_perf_f1 roa_f1 Financial Reporting Variables: %specialitems accruals pfcount fog Strategic Reporting Variables: ratchet_down nontrading lpc_hpos_arf hnc_lneg_arf Additional Variables: totalcount late sizemktvl btom lev stdfcasteps an_following participantcount analysttotalcount mgrqatotalcount mgrqaposcount mgrqanegcount Firm Fixed Effects Year Fixed Effects Qtr Fixed Effects Adj. R Square n
analystnetopt
analystnetopt
analystnetopt
analystnetopt
Coeff
t-stat
Coeff
t-stat
Coeff
t-stat
Coeff
t-stat
0.057 -0.082
1.17 -2.58**
0.003 -0.123
0.04 -2.69***
0.115 -0.068
2.07** -2.06**
0.053 -0.119
0.68 -2.53**
0.020 0.026 -0.050 0.000 0.088 -0.081 -0.153
2.36** 2.68*** -7.57*** 0.05 7.48*** -10.24*** -1.97**
0.007 0.016 -0.054 0.000 0.088 -0.084 -0.243
0.54 1.01 -5.65*** 1.04 5.24*** -7.31*** -1.83*
0.020 0.026 -0.050 0.000 0.081 -0.083 -0.151
2.36** 2.71*** -7.55*** 0.02 6.80*** -10.34*** -1.95*
0.007 0.016 -0.054 0.000 0.084 -0.085 -0.242
0.54 1.02 -5.65*** 0.97 4.83*** -7.25*** -1.82*
0.036 0.060
4.22*** 1.00
0.018 0.079
1.39 0.90
0.036 0.060
4.19*** 1.00
0.018 0.077
1.36 0.89
-0.069 0.000 0.001 -0.004
-1.89* -0.06 0.22 -1.18
— 0.004 0.001 -0.005
— 0.62 0.13 -1.02
-0.068 0.000 0.001 -0.004
-1.86* -0.08 0.22 -1.16
— 0.004 0.001 -0.005
— 0.62 0.14 -1.02
0.036 0.001 — —
3.72*** 0.11 — —
0.037 0.000 — —
2.60*** -0.02 — —
0.036 0.001 -0.025 0.017
3.70*** 0.12 -2.06** 1.77*
0.037 0.000 -0.019 0.006
2.57** -0.02 -1.19 0.40
-0.043 -2.11** -0.006 -0.38 0.048 6.10*** 0.001 0.56 -0.019 -0.52 -0.003 -0.07 -0.013 -1.29 -0.006 -2.31** 0.011 1.19 0.042 3.02*** 0.093 11.26*** -0.137 -20.62*** Included Included Included
-0.031 -1.07 0.000 -0.01 0.044 3.55*** 0.000 -0.04 -0.059 -1.13 0.028 0.38 -0.015 -1.02 -0.010 -3.11*** 0.002 0.14 0.022 1.18 0.102 8.97*** -0.129 -13.54*** Included Included Included
-0.042 -2.06** -0.006 -0.35 0.048 6.11*** 0.001 0.57 -0.020 -0.54 -0.003 -0.06 -0.013 -1.28 -0.006 -2.30** 0.010 1.13 0.042 3.03*** 0.093 11.24*** -0.137 -20.63*** Included Included Included
-0.031 -1.05 0.000 0.01 0.044 3.57*** 0.000 -0.03 -0.059 -1.13 0.027 0.38 -0.015 -1.01 -0.010 -3.10*** 0.002 0.12 0.022 1.19 0.102 8.94*** -0.129 -13.54*** Included Included Included
26.79% 18,306
26.37% 10,744
26.82% 18,306
26.37% 10,744
Notes to Table 5: The dependent variable in the fixed effects regression models estimated above is analyst net optimism (in their questions) in the Q&A session of the conference call. See Appendix A for variable descriptions. ***, **, and * indicate statistical significance at the 1, 5, and 10 percent levels, respectively (two-tailed). We test for statistical significance of the parameter estimates by using heteroskedasticity robust standard errors in our regressions with errors clustered by firm. %Δibeseps, accruals, and stdfcasteps are winsorized at 1st and 99th percentile due to concerns with outliers.
47
TABLE 6 Market Return Regressions on Tone Dispersion Measures Dependent Variable Tone Dispersion Variables: pos_arf neg_arf Analyst Net Optimism: analystnetopt Prior Model Variables: disagg_perf loss ibes_miss %Δibeseps poscount negcount roa disagg_perf_f1 roa_f1 %specialitems accruals pfcount fog ratchet_down lpc_hpos_arf hnc_lneg_arf totalcount late sizemktvl btom lev stdfcasteps an_following participantcount analysttotalcount mgrqatotalcount mgrqaposcount mgrqanegcount Firm Fixed Effects Year Fixed Effects Qtr Fixed Effects Adj. R Square n
adjret_3 Coeff t-stat
adjret_3 Coeff t-stat
adjret_60 Coeff t-stat
adjret_60 Coeff t-stat
0.035 -0.022
1.47 -1.81*
0.036 -0.039
1.02 -2.37**
0.029 -0.075
0.47 -2.53**
0.059 -0.125
0.69 -3.15***
0.023
6.19***
0.027
5.01***
0.047
5.08***
0.057
4.35***
0.011 2.87*** -0.001 -0.33 -0.036 -14.01*** 0.000 2.17** 0.021 4.25*** -0.003 -1.08 0.050 1.25 -0.002 -0.60 0.003 0.09 0.001 0.06 -0.003 -0.57 -0.001 -0.24 -0.001 -0.81 0.032 7.17*** -0.003 -0.66 0.002 0.47 -0.022 -2.89*** 0.001 0.13 -0.006 -1.28 -0.003 -3.01*** 0.045 2.69*** 0.043 1.82* -0.011 -2.66*** -0.001 -0.71 -0.001 -0.32 0.002 0.52 0.001 0.42 -0.007 -2.85*** Included Included Included 11.09% 13,628
0.009 1.60 -0.003 -0.45 -0.038 -10.75*** 0.000 4.16*** 0.023 3.47*** -0.006 -1.33 0.105 2.10** -0.001 -0.24 -0.009 -0.21 — — -0.002 -0.29 -0.002 -0.39 -0.002 -1.09 0.029 4.30*** -0.006 -1.09 0.003 0.54 -0.022 -2.02** -0.003 -0.31 -0.008 -0.97 -0.003 -1.06 0.051 1.99** 0.061 2.00** -0.010 -1.78* -0.001 -0.34 0.004 0.76 -0.002 -0.35 0.005 1.37 -0.007 -2.00** Included Included Included 13.62% 7,935
0.019 1.90* -0.015 -1.33 -0.042 -6.87*** 0.000 0.97 0.035 2.72*** -0.030 -3.83*** -0.015 -0.09 0.033 3.73*** 0.168 1.85* 0.098 1.57 -0.006 -0.77 0.006 0.93 0.002 0.74 0.044 3.76*** 0.002 0.14 0.007 0.62 -0.015 -0.80 -0.032 -2.01** -0.247 -14.92*** 0.006 1.08 0.026 0.46 0.113 1.53 -0.016 -1.24 0.000 -0.13 0.012 1.43 0.021 1.64 0.001 0.14 -0.022 -3.23*** Included Included Included 15.51% 13,628
0.016 1.14 -0.017 -1.03 -0.041 -4.76*** 0.002 5.70*** 0.050 3.10*** -0.041 -3.48*** 0.186 1.31 0.031 2.40** 0.140 0.96 — — -0.010 -1.17 0.011 0.82 0.005 1.18 0.031 1.79* -0.008 -0.53 0.006 0.43 -0.046 -1.80* -0.055 -2.50** -0.267 -9.24*** 0.005 0.64 0.006 0.08 0.077 0.99 -0.027 -1.52 0.002 0.54 0.009 0.72 0.007 0.42 0.012 1.28 -0.014 -1.64 Included Included Included 15.13% 7,935
Notes to Table 6: The dependent variables in the fixed effects regression models estimated above are listed as column headers. See Appendix A for variable descriptions. ***, **, and * indicate significance at the 1, 5, and 10 percent levels, respectively (two-tailed). We test for statistical significance of the parameter estimates by using heteroskedasticity robust standard errors in our regressions with errors clustered by firm. %Δibeseps, accruals, and stdfcasteps are winsorized at 1st and 99th percentile due to concerns with outliers. Regressions run on firms that issued the conference call during trading hours (i.e., nontrading=0).
48