... and the viscosity was measured using calibrated Cannon-Ubbelohde viscometers. ..... [5] M. P. Brenner, J. Eggers, K. Joseph, S. R. Nagel and X.D. Shi, Phys.
The Two Fluid Drop Snap-off Problem: Experiments and Theory Itai Cohen∗ , Michael P. Brenner† , Jens Eggers‡ , Sidney R. Nagel∗ ∗
arXiv:physics/9902071v1 [physics.flu-dyn] 24 Feb 1999
‡
James Franck Institute, University of Chicago, Chicago, IL 60637 † Department of Mathematics, MIT, Cambridge, MA 02139 Universit¨ at Gesamthochschule Essen, Fachbereich Physik, 45117 Essen, Germany
We address the dynamics of a drop with viscosity λη breaking up inside another fluid of viscosity η. For λ = 1, a scaling theory predicts the time evolution of the drop shape near the point of snap-off which is in excellent agreement with experiment and previous simulations of Lister and Stone. We also investigate the λ dependence of the shape and breaking rate.
When a fluid droplet breaks, as shown in Figure 1, a singularity develops due to the infinite curvature at the point of snap-off [1]. Near such a singularity, the axial and radial length scales become vanishingly small, allowing, independent of initial conditions, a local analysis of the flow equations. Such a separation of scales implies that near snap-off the profiles should be self-similar: on rescaling by the axial and radial scales the profiles near the singularity should collapse onto a universal curve. [2] The character of the singularity depends on which terms in the Navier-Stokes equations are dominant at the point of breakup. If the drop breaks up in vacuum, surface tension,viscous stresses, and inertia are balanced asymptotically, although the motion may pass through other transient regimes, depending on viscosity [3,4,2,5,6]. In this paper, we investigate the situation where the viscous effects of the inner and outer fluid are included as are the pressure gradients produced by the curvature in the surface separating them; the inertial terms are taken to be insignificant so that we are in the Stokes regime [7–9]. Assuming that molecular scales are not reached first, this is the final asymptotic regime describing flows near snap-off for any pair of fluids even in the case of arbitrarily low viscosity. This paper uses experiments, simulations and theory to characterize the self similar approach to snap-off in this regime. [FIG. 1 about here.] We consider the rupture of a fluid of viscosity λη surrounded by another fluid of viscosity η. The interface between the two fluids has surface tension γ. At a time t∗ before the rupture, dimensional analysis suggests that all length scales have the form H(λ)γη −1 t∗ where H(λ) is a function yet to be determined. Hence, if drop profiles near rupture are rescaled by t∗ , they should collapse onto a universal curve, independent of the initial conditions. However, Lister and Stone [8] noticed that the long-ranged character of the Stokes interaction leads to logarithmic corrections in the velocity field. They simulated equations (1)-(3) below for drops having various unstable initial conditions, and demonstrated collapse if the logarithmic term was subtracted. (See also Loewenberg et al. [9].) Herein, we demonstrate that this collapse also works for experiments, and construct a scaling theory to explain the profile shapes, by incorporating the nonlocal contributions into a local similarity description. Figure 2 shows the collapse of rescaled profiles at λ = 1 for both experiments and numerical simulations using a numerical technique similar to that of Lister and Stone. They are superimposed on the scaling theory developed below (black line). [FIG. 2 about here.] The experiment used 9.5 St Glycerin dripping through 10 St PDMS. The viscosities are large enough that the experiment is in the Stokes-flow regime even at macroscopic scales. The surface tension γ was measured using the pendant drop method [10] and the viscosity was measured using calibrated Cannon-Ubbelohde viscometers. We used a Kodak Motion Corder Analyzer to capture ten thousand frames per second. These images were then analyzed using an edge-tracing program, and smoothed [11]. In rescaling the experimental profiles, we shifted the origin so that the locations of the minima in the profiles lined up. Because the profiles were relatively flat along the axial direction there was some uncertainty in the determination of these minima. We therefore shifted each rescaled profile in the axial, ξ, direction to minimize the cumulative deviation in H(ξ). The inset of Figure 2 shows that near snap-off hmin (t) is a linear function of t∗ . By fitting the prefactor of this linear dependence, we obtain hmin = (0.031 ± 0.008)γη −1t∗ , in excellent agreement with the result hmin = 0.0335γη −1t∗ from numerical simulations [8] and the scaling theory constructed below. Scaling Theory Since the Stokes equation is linear, the fluid surface velocity can be expressed as an integral over the surface of the fluid-fluid interface. At λ = 1 the equation is [12] Z v(S) (z, t) = −γ κ(z ′ )J(z, z ′ )n(z ′ )dz ′ , (1) 1
where n is the outward normal, κ is the curvature, z is the axial coordinate, and the tensor J is � Z 2π � I rr 1 + 3 dθ J(z, z ′ ) = 8π 0 r r
(2)
with r the vector between the two points on the surface, I the identity matrix, and the integration is over the azimuthal angle θ . Physically, equation (2) represents the response of the surface tension forcing the interface. For unequal viscosities λ 6= 1, eq. (2) must be amended by an additional term, which accounts for the jump in viscosity. Given the radial vr and axial vz components of the surface velocity, the interface advances according to ∂t h(z, t) + vz ∂z h = vr ,
(3)
which states that the surface at a given axial position can deform by radial motion and axial advection. Motivated by the simulations of Lister and Stone [8], we try the similarity ansatz h(z, t) = vη t∗ H(ξ), ξ = vη−1 (z ∗ /t∗ ) + b ln t∗ + ξ0 ,
(4)
where z ∗ is the axial distance from the singularity, b is a constant, and the factors of vη ≡ γ/η have been inserted to make H and ξ dimensionless. The shift b ln t∗ in the similarity variable ξ results from the logarithmic divergence of the axial velocity field [8], and ξ0 will be shown to be an arbitrary constant which depends on the boundary conditions. Since the solution near snap-off must match onto the outer profile, which varies slowly on the time-scale t∗ H(ξ) ∼ s± ξ, as ξ → ±∞. Here we define s− as the slope of the shallow side of the pinch region, which by convention we place to the left of the minimum, and s+ as the steep slope. The subtle feature of this problem is the interplay of the local singularity with the nonlocal fluid response from the Stokes flow. The principal nonlocal effect is that the surface tension force from the cones produces a logarithmically diverging axial velocity field at the pinch point, ξ = 0 [8]. For a local scaling theory, this singularity must be ′ ′ absorbed. We fix two points ξ− and ξ+ within the linear part of the solution to the left and right of ξ = 0. Splitting the contributions to the velocity on the surface into a contribution from ξ− < ξ < ξ+ and from the rest of the drop, and converting to similarity variables, we find # " Z ′ ∗ ξ+ /t
V(S) (ξ, t∗ ) = −
κ(ξ ′ )J(ξ, ξ ′ )n(ξ ′ )dξ ′ − b ln t∗ ez ,
(5)
′ /t∗ ξ−
where V(S) = (v(S) − b ln t∗ ez )/vη and ez is the unit vector along the axial direction. Because of the cones, the axial component of the J-integral in angular brackets diverges logarithmically as t∗ → 0. For the special choice b = −(s+ (1 + s2+ )−1 + s− (1 + s2− )−1 )/4 the singularity cancels and the term in angular brackets remains finite for t∗ → 0. It is straightforward to extend this scaling theory to arbitrary λ; in this case the amplitude of b only depends on λ through s+ , s− . The remaining constant in (5) depends on the detailed shape of the drop as well as on the choice ′ ′ of ξ− , ξ+ . Inserting the similarity form (4) into the equation of motion for the interface (3) gives −H +
dH (Vz + ξ − ξ0 − b) = Vr , dξ
(6)
where we have absorbed the constant advection velocity b ln t∗ into Vz . ′ ′ The system (5)-(6) now has to be solved in the limit ξ+ /t∗ → ∞, ξ− /t∗ → −∞, for the interval −∞ < ξ < ∞ and with boundary conditions H ∼ ξ as ξ → ∞. Changing the constant ξ0 + b only results in a constant shift of the similarity function H(ξ). The computation involves solving an integro-differential equation with a nonlocal constraint: the parameter b in (5) must be determined self consistently with the solution H(ξ) according to relation (5). The difference between this scaling theory and others developed for fluid rupture is that here the parameters in the similarity equation must be determined self consistently with the solution to the similarity equation. We solved this system by discretizing H(ξ) in an interval ξ ∈ [−ξin , ξin ] and approximated all derivatives and the integral by second-order formulas. At ξ = −ξin , ξin we demand H ′′ = 0. Using a linear approximation for H outside the interval [−ξin , ξin ], the logarithm is subtracted explicitly. A numerical solution of the full PDE’s provided an initial condition for Newton’s iteration, which converged in a few steps. The iteration always converges to the same solution for any given ξ0 . The calculation gives H0 (λ = 1) = 0.0335, s− = −0.105, s+ = 4.81, where s+,− are the asymptotic slopes at ±∞. These results are in good agreement with both the simulations of [8] and experiments (Fig. 2
2). Although the theory has been solved only for λ = 1, by continuity we expect that solutions exist for a range of λ and that hmin obeys the law hmin = H0 (λ)vη t∗ . It is noteworthy that droplet breakup between fluids of equal viscosities is not plagued by the iterated instabilities found for droplet breakup in vacuum [13]: neither experiments nor simulations observe such instabilities. The reason for this can be found by stability analysis of the similarity solution, following the same procedure as [14]. The result is that perturbations around the similarity solution can be amplified by a factor of ≈ 150, which is much smaller than the corresponding amplification factor for rupture in vacuum, where it is 104.7 (t∗ )−1.5 [14]. The reasons for the differences between the two problems are that (i) For λ = 1 Tomitoka’s formula [15] implies that the maximum linear growth rate for perturbations is approximately (t∗ )−1 . On the other hand for λ = ∞, the maximum growth rate is approximately 5(t∗ )−1 . (ii) The λ = ∞ problem has a time dependent amplification factor because the axial length scale has a different scaling with t∗ than the radial length scale. This implies that the closest a perturbation can be to the stagnation point depends on t∗ , even when expressed in similarity variables. Arbitrary λ We now extend features of the above results to arbitrary λ. Using Glycerin/water mixtures (1 St < η < 9.5 St) and silicone oils (1 St < η < 600 St) we were able to cover a range of λ between 0.002 and 30. The same procedure as used above verified self-similar data collapse in experiments with 0.02 < λ < 30 [11]. In all these experiments, the conical profile associated with s− collapsed for all analyzed profiles. This corresponds to a time interval of at least 0.1 seconds prior to and all the way up to the point of snap-off. This can be seen in Figure 2 for λ = 1. In contrast, as also seen in that figure, the conical profile associated with s+ showed a time-dependent collapse with the region of self-similarity growing as the point of snap-off is approached. This time dependence changes as we vary λ, slowing down as λ → 1. Figure 3 shows the cone angles s± , and the dimensionless breaking rate H0 as a function of λ. As shown by Figs. 3a-b, the cone angles appear to obey a power law over an extended range of λ: s+ ∼ λ0.21±0.05 and s− ∼ λ−0.23±0.07 . (Due to measurement difficulties, the range for s− is reduced from that for s+ [11].) Within error, the analyses performed on both the snap-off event near the nozzle and the snap-off event near the bulb lead to the same results. This agreement implies that the results are robust and independent of small variations in the surrounding flows. Note that our findings are in qualitative disagreement with lubrication-type scaling arguments [7,8], which predict s± ∼ λ−1/2 for the slope on either side of the minimum. On the other hand, the trends in our data are consistent with recent numerical simulations of the full Stokes equations by Zhang and Lister [19]. This is yet another indication of the breakdown of one dimensional models in describing the dynamics of two fluid rupture. [FIG. 3 about here.] A Simple Theory for H0 (λ) follows by noting that (assuming the shape of the drop is slender near hmin ) the maximum rate that the drop can break is given by the maximum linear growth rate Ω(hmin ) for a cylinder of uniform radius hmin . Namely, we have the upper bound Ω(hmin ) >
d dt (hmin )
hmin
=
1 . t∗
(7)
By using Tomotika’s formula [15] for Ω(hmin ) with hmin = H0 (λ)vη t∗ , this equation turns into an upper bound for H0 (λ). This upper bound is compared with the experimental data for H0 (λ) in Fig. 3c. All of the data obeys the bound; moreover, in the range 0.1 < λ < 10 the agreement is nearly exact. Note that while most of the experimental data (and the upper bound equation (7) can be fit with a power law of exponent −0.53 ± 0.05, a significant trend with an overall negative curvature is observed in the experimental deviations. The agreement of the experiments with the upper bound in the range 0.1 < λ < 10 is reminiscent of the marginal stability hypothesis, as formulated for the selection of traveling waves propagating from a stable to an unstable state [16]. Both experiments and numerical simulations show that the breaking rate is approximately equal to the growth rate of linear instabilities around a cylinder of radius hmin . The upper bound in equation (7) should apply to all problems involving singularity formation in a system with a local instability. We have tested this upper bound on similarity solutions from several other examples including spherically symmetric gravitational collapse [17] and chemotactic collapse of bacteria [18]; the upper bound is obeyed in each case, giving a reasonable estimate for the prefactor. Hence, this principle appears to be of rather general applicability. To conclude, we have (i) constructed a similarity solution for rupture at λ = 1, agreeing with previous numerical simulations [8]; (ii) shown that experiments agree quantitatively with this similarity solution, both in the form of the profile and its time dependence; and (iii) presented a simple argument which quantitatively predicts the breaking rate. Experiments have also shown self-similar behavior for the range 0.02 < λ < 30. There are many unresolved issues: Among them, there is no solid simple argument for the λ-dependence of the slopes s− , s+ . Finally, our results 3
suggest that the scaling (4) holds even in the limit λ → ∞, while a different set of scaling exponents is found for a Stokes fluid breaking up in vacuum (λ = ∞) [4]. In addition, the profiles are asymmetric for λ → ∞, as also found in a recent numerical simulation [20], but are symmetric for breakup in vacuum [4], making this a singular limit. Preliminary experimental results of an inviscid fluid breaking up in a viscous fluid suggest that the snap-off shape is different from that in Stokes flow with λ → 0 implying that this limit is singular as well. We thank J. R. Lister, H. A. Stone, Q. Nie, L. P. Kadanoff, V. Putkaradze and T. Dupont for discussions. MB acknowledges support from the NSF Division of Mathematical Sciences, and the A.P. Sloan foundation. JE was supported by the Deutsche Forschungsgemeinschaft through SFB237. SRN and IC were supported by NSF DMR9722646 and NSF MRSEC DMR-9400379.
[1] [2] [3] [4] [5] [6] [7] [8] [9] [10] [11] [12] [13] [14] [15] [16] [17] [18] [19] [20]
For a recent review, see: J. Eggers, Rev. Mod. Phys. 69, 865, (1997). J. Keller and M. Miksis, SIAM J. Appl. Math. ,43, 268, (1983). J. Eggers, Phys. Rev. Lett. 71, 3458, (1993). D. T. Papageorgiou, Phys. Fluids 7, 1529, (1995). M. P. Brenner, J. Eggers, K. Joseph, S. R. Nagel and X.D. Shi, Phys. Fluids, 9, 1573, (1997) R. F. Day, E. J. Hinch, J. R. Lister, Phys. Rev. Lett., 80,704, (1998). J. R. Lister, M.P. Brenner, R. F. Day, E. J. Hinch and H. A. Stone, In IUTAM Symposium on Non-linear Singularities in Deformation and Flow, (ed. D. Durban and J. R. A. Pearson), Kluwer (1997). J. R. Lister, H. A. Stone, Phys. Fluids 10,2759, (1998). J. Blawzdziewicz, V. Cristini and M. Loewenberg, Bull. Am. Phys. Soc., 42, 2125, (1997). F.K. Hansen, G. Rodsrud, J. Colloid interface sci. 141, 1, (1991). I. Cohen and S. R. Nagel, to be published. J. M. Rallison and A. Acrivos, J. Fluid Mech. 89, 191, (1978). D.M. Henderson, W.G. Pritchard and L.B. Smolka, Phys. Fluids,9 3188(1997); X. D. Shi, M.P. Brenner and S.R. Nagel, Science, 265, 219, (1994). M. P. Brenner, X. D. Shi, and S. R. Nagel, Phys. Rev. Lett. 73, 3391, (1994). S. Tomotika, Proc. Roy. Soc. London Ser. A 150, 322, (1935). W. van Saarloos, Phys. Rev. A 39, 6367, (1989) R. B. Larson, Mon. Not. Roy. astr. Soc., 145, 271, (1969). E. O. Budrene and H. C. Berg, Nature, 349, 630, (1991). W. Zhang and J.R. Lister, Bull. Am. Phys. Soc., 1998. C. Pozrikidis, preprint (1998).
4
List of Figures
1 2 3
. . . . . . . . . . . . . . . . . . . . . . . . . . . . . . . . . . . . . . . . . . . . . . . . . . . . . . . . . . . . . . . . . . . . . . . . . . . . . . . . . . . . . . . . . . . . . . . . . . . . . . . . . . . . . . . . . . . . . . . . . . . . . . . . . . . . . . . . . . . . . . . . . . . . . . . . . . . . . . . . . . . . . . . . . . . . . .
5
6 7 8
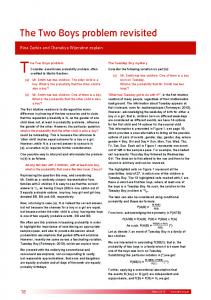
FIG. 1. A drop of 9.5 St Glycerin dripping through 10 St PolyDimethylSiloxane (PDMS) near snap-off. The nozzle diameter is 0.48 cm.
6
1.0
hmin (µm)
H(ξ)
1.5
0.5 0.0 -1.5
30 15 0
0
25
50
t*(ms)
-1.0
-0.5
ξ
0.0
0.5
FIG. 2. The inset shows the minimum radius, hmin (t), as a function of time for the drop shown in Fig. 1. The solid line is the theoretical prediction. The main figure shows the similarity function H(ξ) as defined by (4). The dots are rescaled experimental profiles corresponding to the times indicated as arrows in the inset. The solid line is the theory, and the x’s mark the final simulation profile.
7
101
H0
10-1
s-
s+
10-1
100
a
10-3 10-2 10-1 100 101 102
λ
10-2 10-1
10-2
b 100
λ
101
c
10-3
102
10-2
10-1
100
λ
101
102
FIG. 3. The asymptotic slopes s+ , s− , and the rescaled minimum radius H0 as a function of viscosity contrast λ. The dashed lines are a fit to the experimental data, in the right most graph the solid line is the result of our stability argument.
8