21 Locations of the Four Colored Doors . ...... magenta door (Traction) to the red door (EDD) and considered coincidence. Thus, even though the percentage ...
THE USE OF A VIRTUAL ENVIRONMENT AS A METHOD OF WAYFINDING RESEARCH IN ARCHITECTURE by ADETANIA PRAMANIK
A THESIS IN ARCHITECTURE Submitted to the Graduate Faculty of Texas Tech University in Partial Fulfillment of the Requirements for the Degree of MASTER OF SCIENCE
Approved
Saif-ul- Haq Chairperson of the Committee
Glenn Eugene Hill
Zane D. Curry Accepted
John Borrelli Dean of the Graduate School May, 2006
© 2006, Adetania Pramanik
ACKNOWLEDGEMENTS
I would like to thank my thesis committee members- Dr. Saif Haq, Prof. Glenn Hill, and Dr. Zane Curry. Thank you for all your patience, critical insights, and feedback. The completion of this thesis and related publications would not have been possible without the encouragement and assistance from Dr. Haq. Thank you again. This 2nd thesis is again, dedicated to my parents. Thank you for all the wisdom along the journey. My brothers, Anom and Ari, thanks for listening and all the inputs. This is yours too! My dearest old friends, Stephanie, Arthi, Neerja, Andre, and Feli for sticking up and helping out with lots of my emotional burden. My dearest new friend, Nana for the support and stats inputs from the other side of the world. And most importantly: God.
ii
TABLE OF CONTENTS
ACKNOWLEDGEMENTS...........................................................................................................ii LIST OF FIGURES.........................................................................................................................v LIST OF TABLES........................................................................................................................ vii ABSTRACT ................................................................................................................................ viii CHAPTER I. INTRODUCTION ...................................................................................................................... 1 Virtual Environment in Environment Behavior Research .................................................. 1 Wayfinding Research in Architecture .................................................................................... 3 The Study ................................................................................................................................... 4 II. LITERATURE REVIEW ........................................................................................................... 6 Virtual Environment................................................................................................................. 6 Definition ............................................................................................................................... 6 Elements of VE ...................................................................................................................... 7 Apparatus and Limitations.................................................................................................. 8 Applications of VE .............................................................................................................. 15 Wayfinding Research in Architecture .................................................................................. 18 Wayfinding Research and Virtual Environment ................................................................ 21 III. METHODOLOGY................................................................................................................. 23 VE Development ..................................................................................................................... 23 Hardware Interface to the user: Input (how the computer ‘sees’ the user) ................ 24 Hardware Interface to the user: Output (how the user ‘sees’ the VE)......................... 26 Software Components: System presentation to the user............................................... 35 iii
Wayfinding Experiment in VE .............................................................................................. 43 Participants .......................................................................................................................... 43 Procedure ............................................................................................................................. 43 Pilot Study............................................................................................................................ 47 Measurement ........................................................................................................................... 48 IV. RESULTS ................................................................................................................................ 51 Ability to Create VE for Wayfinding Study ........................................................................ 51 Data Comparison of Wayfinding in VE and Real Environment ...................................... 52 Similarities in the Number Corridors Used for Exploratory Search............................ 52 Similarities in the Number Intersections Used for Exploratory Search ...................... 55 Similarities in Finding Destinations ................................................................................. 57 Similarities in Average Pointing Errors ........................................................................... 60 Analysis of the VE development .......................................................................................... 62 V. CONCLUSIONS ..................................................................................................................... 65 Building a VE Setting for an Architectural Wayfinding Study ........................................ 65 Replicating a Real Environment in a VE.......................................................................... 65 Conducting Similar Tasks as the Ones in a Real Environment Experiment .............. 67 Similarities of the results from VE and in a real environment ......................................... 68 Extranous Variables ............................................................................................................ 69 Technological Limitations.................................................................................................. 70 Limitations and Future Studies............................................................................................. 72 REFERENCES.............................................................................................................................. 75
iv
LIST OF FIGURES
1 Human's FOV ........................................................................................................................... 11 2 Gravis Blackhawk Joystick ..................................................................................................... 25 3 Logitech Freedom Cordless 2.4 .............................................................................................. 25 4 Logitech Wingman Attack 2 Joystick .................................................................................... 26 5 Room 07..................................................................................................................................... 27 6 Room 507................................................................................................................................... 28 7 Room 508................................................................................................................................... 28 8 The Cart with The Computer, The Projector, and The Joystick ........................................ 29 9 ViewSonic PJ551....................................................................................................................... 30 10 FOV Projection ....................................................................................................................... 34 11 FOV Monitor........................................................................................................................... 35 12 AutoCAD Floorplan Showing the Corridors Considered in This Study ....................... 37 13 Pictures from The Real Environment .................................................................................. 38 14 Pictures from The Virtual Environment ............................................................................. 38 15 The 3D model with 6083 polygon count............................................................................. 39 16 Back face culling..................................................................................................................... 40 17 Example of recorded path using tracking information .................................................... 42 18 Collision Box ........................................................................................................................... 43 19 Pre-training Environment..................................................................................................... 44 20 Locations of the Two Entrances ........................................................................................... 45 21 Locations of the Four Colored Doors .................................................................................. 46 22 The 24 Corridors..................................................................................................................... 52
v
23 The Average Use of Corridors in Open Exploration ........................................................ 53 24 The 28 Intersections ............................................................................................................... 55 25 Total Uses of Intersections Per Person in Open Exploration ........................................... 56 26 Average Percentages of Wayfinding Success in the Twelve Destinations .................... 59 27 Average Pointing Errors ....................................................................................................... 61
vi
LIST OF TABLES
1 Advantages and Disadvantages of the Three Rooms ......................................................... 31 2 Similarities and Dissimilarities Between Real and Virtual Hospital ................................ 36 3 Similarities and Dissimilarities of the Tasks between Haq’s and the Present Study ..... 47 4 Measurements and Experimental Tasks that were used to answer the Research Questions .................................................................................................................................. 50 5 The Twelve Search Combinations ......................................................................................... 58
vii
ABSTRACT Virtual environment (VE) and wayfinding research are two emerging areas in architecture. Wayfinding studies have postulated that the built environment plays a significant role in the wayfinding process. Unfortunately, these studies were constrained by the inability to systematically control extraneous environmental variables. VE technology has the potential to create similar research conditions as in real environments and limit extraneous variables. The purpose of this study is to examine the appropriateness of VE as a tool for wayfinding research and to compare the outcomes of similar research done in a VE and a real environment. A simulation technique was used. A VE was created from an actual hospital corridors used in Haq’s (2001) wayfinding experiment. Thirty-two subjects carried out the same tasks in the VE as those in Haq’s experiment. The data from the experiment was used to measure the percentage of subjects who were successful in completing the VE experiment, and the similarities found in the use of corridors and intersections in exploratory search, success in finding destinations, and pointing errors in the VE and the real environment. Ninety percent of the participants success in completing all the experimental tasks in the VE demonstrated the ability to replicate a real-environment wayfinding experiment. This study also found that the participants’ movements in exploratory search and the overall averages of wayfinding success in both environments were similar. The differences were explained by the technological limitations and the presence of extraneous variables in the real environment. These findings indicated that VE could be a valuable tool for controlling and investigating environmental variables in the wayfinding process.
viii
CHAPTER I INTRODUCTION
The purpose of this study is to investigate the relevance of a virtual environment (VE) as a technique to provide a controlled environment in wayfinding research. Virtual environment and wayfinding research are two growing areas in architecture. VE has been identified as an effective tool in various fields such as military, aviation, entertainment, and e-commerce. Empirical studies in wayfinding have discovered initial results that wayfinding is also associated with the elements in built environments. It is reasonable to employ VE as a tool to investigate the role of architecture in the wayfinding process. This chapter discusses the significance of these two areas (i.e. VE and wayfinding research) in architecture and any problems that they have as developing fields, which leads to the rationale of this study.
Virtual Environment in Environment Behavior Research The advancement of computational technology and its use in the area of architecture can be seen from the introduction of sketchpad in 1960s through computeraided design (CAD) at present (Bertol, 1997 and Dong & Gibson, 1998). The use of CAD has been commonly known in the architectural practice since around the 1970s (Fallon, 1998). However, Pinet (1997) had recently suggested that there is a need for more advanced technology in architectural practice. He said, “…I would able to pick up and move a computer simulated chair with the help of a computerized data glove…”; similarly, “…I can move around the furniture in my living room…” This vision describes user manipulation of objects in a VE. According to Bertol (1997), VE seems to
1
be the next logical technology to incorporate in architecture as presentation and evaluation tools. The word ‘virtual’ applies to “…something that can be done or seen using a computer and therefore without going anywhere or talking to anyone…” (Cambridge University Press, 2006). Thus, VE can be defined as the present of environments simulated by a computer that can be experienced (Sherman & Craig, 2003). VE will allow humans to actively interact with the environment such as walking, opening doors, etc. It can also be used to display unseen building forces such as airflow and structural load transfer. VE permits individuals to have more direct interaction when evaluating an environment rather than just viewing a walkthrough animation, where the movement through an environment has been set up by an operator or designer beforehand. VE has been applied to a wide range of different fields such as military and aircraft training, planning, and entertainment (Wolff, Roberts, & Otto, 2004). It has been used in the e-commerce sectors for simulating and marketing their products (Amaran, 2004). In a research area, de Kort, Ijsselsteijn, Kooijman, and Schuurmans (2003) reported that VE could be a prospective tool for environmental behavior research. According to Riecke, van Veen, and Bülthoff (2002) VE offers experimental research conditions that are easy to define, control, and duplicate. Also, VE is able to create experimental research conditions that would be difficult to create in the real environment (Péruch, Gaunet, Thinus-Blanc, & Loomis, 2000). Some studies have reported the use of VE for investigating individuals’ orientation abilities and behavior as parts of the environmental behavior research (Bartella, Marchi, and Riva, 2001; Dalton, 2001; Riecke
2
et al., 2002). Therefore, it is reasonable to anticipate the use of VE for investigating the environmental behavior research from the point of view of the environment itself. However, with such a promising technological features that the VE offered, the current technology is still not able to create the same experience as in the real environment. Some differences that are noted by de Kort et al (2003) such as the absence of a physical body, the limitations of VE presentation, and the unnatural experiences from using various devices, have raised a question on whether or not these differences will affect the applicability of VE in the environmental behavior research.
Wayfinding Research in Architecture Wayfinding research in architecture is one important area in environment behavior research. Wayfinding has been described as an act of information processing, decision-making, and decision execution in order to reach a destination, whether in a familiar or an unfamiliar environment (Arthur & Passini, 1992). Even though the built environment plays a significant role in the wayfinding process, there has not been some conformity of which environmental elements are important in the process. Various studies (Lynch, 1960; Weisman, 1981; and Peponis, Zimring, & Choi, 1990) have proposed different environmental elements. From such studies, one may note a similarity; this is the problem of measuring environmental variables objectively. This is clearly illustrated in studies by Weisman (1981), Abu-Ghazzeh (1996), and Passini, Pigot, Rainville, and Tetreault (2000). These studies relied on inter-subjective measurements for evaluating important elements in the environment. Therefore, they are difficult to repeat and test in different situations with different populations.
3
Some wayfinding studies have considered ways to measure variables objectively. Peponis et al.(1990), O’Neil (1991), and Haq (2001) proposed a method by focusing on one element of environmental variable, floor plan configuration. However, these studies were conducted in the real environment where extraneous variables such as noises, people, and scents could not be controlled. Haq (2001) stated that one way to investigate the role of a particular environmental variable in the wayfinding process is to control other variables in the study. One way to perform a controlled environment is to apply a simulation technique to a wayfinding study. VE technology has the potential to create similar wayfinding research condition as the one in real environment and will also allow the researcher to limit extraneous variables. However, since the VE application is still developing and restricted to existing technology, Stanney and Zyda (2002) advised the necessity for carrying out additional research to demonstrate the significant benefits for using VE application in architecture.
The Study The purpose of this study is to investigate the relevance of a VE application as a technique to provide a controlled environment in wayfinding research. According to de Kort, et al, (2003), when individuals behavior in a VE is comparable with the one in the real environment, VE will be a useful tool for architectural wayfinding research. Therefore, a previous wayfinding study, which was conducted in a real environment, was replicated in the VE to investigate the comparability of people’s behavior and performance in both environments. This process of replicating a real environment from
4
a wayfinding study in a VE and comparing the behavioral and performance results from the studies in both environments are the two objectives in this study. Two research questions were formulated, they are: 1. Can a VE replicate a real environment (used in a previous wayfinding study) with sufficient resolution, detail, immersiveness, and interactivity to duplicate the wayfinding tasks done earlier? 2. What would be the similarities and differences of the tasks in the two environments? The hypotheses are that VE will allow the creation of the environment and duplication of the experiment and that the results will be similar. A literature review of VE and wayfinding in architecture is reported in the next chapter. The second chapter also discusses more contemporary effects of VE for wayfinding research. Chapter III describes the methodology used for the study. The creation of a simulation study is presented. A VE was created based on the setting of a previous wayfinding study done in a real environment. The results of the study are examined in chapter IV. It discusses the success or failure of the VE creation for a wayfinding study and the similarities and differences between the results found on wayfinding study in VE and in a real environment. Finally, conclusions, limitations, recommendations, and possibilities of further research are discussed in chapter V.
5
CHAPTER II LITERATURE REVIEW
This chapter presents a literature survey regarding virtual environment (VE) and its required components, followed by wayfinding research in architecture. In addition, it analyzes previous wayfinding studies that had been performed in real environments in order to select one to be replicated in a VE for this research. It is concluded by discussing VE’s ability as a tool for architectural wayfinding research.
Virtual Environment Existing literature gives different meanings of VE and its elements. This is probably because of the evolving nature of such studies. Therefore, this section starts with defining VE, outlining the elements of VE, and then focuses on the apparatuses needed to provide a backbone for using VE in the research and their technological limitations.
Definition The word ‘virtual’ applies to “…something that can be done or seen using a computer and therefore without going anywhere or talking to anyone…” (Cambridge University Press, 2006). Thus, VE can be defined as the present of environments simulated by a computer that can be experienced (Sherman & Craig, 2003). de Kort et al.(2003) added that this simulated environment can provide a sense of being there to an individual. The term VE and virtual reality (VR) are used interchangeably in this study since these words are still evolving in the computational world (The Free
6
Dictionary.com, 2004). Burdea and Coiffet (2003) defined virtual reality as “…a high-end user-computer interface that involves real-time simulation and interactions through multiple sensorial channels…” Probably Stanney and Salvendy (1998) described a suitable definition of VE that is relevant for this study, “…an advancing computer interface medium that allows its users to become immersed in and interact with computer-generated worlds.” The elements that define VE will be explored in the next segment.
Elements of VE From the definitions above, it may be concluded that the important elements to create VE are: the medium, sense of being in the environment, user-computer interface, and interaction. These four key elements are highly integrated. Sherman and Craig (2003) used different terms for the same elements. They are: virtual world, immersion, sensory feedback, and interactivity. For this thesis, Sherman and Craig’s terminology will be used. First, a virtual world is needed in VE; it is the content conveyed by a medium. It is a representation of real or imaginary world. The technical definition is “…a set of geometry, the spatial relationship of the geometry to the user or users, and the change in the geometry in response to the user actions and as time progresses.” (Kessler, 2002) In architecture, some examples for virtual world could be a room, a corridor of a hospital, or complete representation of a mall. Providing some immersion or the illusion of reality of the environment is another element in virtual environment. Immersion can be achieved by providing the same visual cues as in the real world. A simple example is when an individual moves
7
closer to an object in a virtual world, that object will appear bigger. This is considered a key element that separates virtual environment with any other media. Since immersion is such an important element, some research even takes it as a basis of designing the other elements (Slater, Linakis, Usoh, & Kooper, n.d., Shim & Kim, 2003, deKort et al., 2003, Stanney & Salvendy, 1998). This approach was given to the goal of VE “…to fool the user into believing that one is, or is doing something, ‘in’ the synthetic environment.” (Shim & Kim, 2003) In order to create immersion, the computer needs to have a method for tracking an individual’s movements and translating it in the virtual world. This method creates a sensory feedback of his/her movements, which is another important element in VE. For example, the use of joystick will allow a computer to translate individual’s movements into the VE system so that the individual can visually see and/or feel his/her movements to an object in the virtual world. The final key element in VE is interactivity. The level of interactivity has been noted for affecting the degree of immersion (Stanney & Salvendy, 1998 and Shim & Kim, 2003). The ability of an individual to move freely in a virtual world and to observe the environment is an example of an interaction between the individual and the computer. This interaction can create the sense of depth and therefore enhance a sense of immersion or being in the environment (McKenna and Zelter, 1993).
Apparatus and Limitations The apparatus vary from hardware interface to the user and software components. The hardware interface demonstrates how the computer ‘sees’ individuals’
8
actions (Input) and how individuals see the virtual world in the computer (output) (Sherman & Craig, 2003). The software components are where the virtual world is built. VE apparatus depends on processing power of the computer hardware. Amaran (2004) reported that most commercially available off the shelf computers at present offers adequate rendering speed and computational power, which meet the need of the fidelity and quality of the gaming industry and can support the simulation of VE. The construction of VE apparatus depends on the goal to meet the elements of VE and the adjustments that are based on limitations of the present technology. According to deKort et al.(2003), the technology for creating VE has developed to a more realistic experience, but unfortunately still creates different experiences. One example of VE limitations that in need of attention is occurrence of motion sickness. Stanney and Salvendy (1998) reported that motion sickness had caused some level of discomfort to 80-90% of the VE users and among them, 5-30% could not continue the task. Stanney and Salvendy also noted that the shortcomings of VE might not necessarily harm the effectiveness of human performance. More studies to investigate this phenomenon are needed. Various apparatuses with their desirable outcomes and limitations will be discussed below.
Output Interface For output interface, VE display is the apparatus most considered because visual sense is mostly used in experiencing VE (deKort et al., 2003 & Kessler, 2002). Some devices for displaying VE are desktop display, Head Mounted Device (HMD) or Binocular Omni-Orientation Monitor (BOOM), and projection screen(s) display such as
9
Computer Automatic Virtual Environment or CAVE (Ruddle, Payne, & Jones, 1999, Jansen-Osmann & Wiedenbauer, 2004). HMD and desktop displays have been used quite often in environmental behavior research (Waller, Beall, & Loomis, 2004, Jansen-Osmann & Wiedenbauer, 2004, Ruddle et al., 1999, Satalich, n.d., and Tlauka & Wilson, 1996). A HMD is considered an immersive display because individuals can move their head freely as if they are looking around in the real world. A desktop display is known to lack proprioceptive sensory information (Jansen & Wiedenbauer, 2004). Proprioceptive means the sense of connection with individual’s position resulted from his/her movements of parts of the body (Wikipedia The Free encyclopedia, n.d.). Hence, an additional device is needed to assist individuals in moving their head and body in a virtual world such as a joystick or keyboard (i.e. user interface). This use of an additional device prevents the same sense of movement as experienced in the real environment. Some researchers compared HMD and desktop displays to investigate the differences in individuals cognitive abilities. Waller et al. (2004) applied VE to investigate accuracy of distance estimation and found no significant difference between the use of HMD and desktop displays. Ruddle et al.(1999) also investigated the use of HMD and desktop displays and found no significant difference on estimated orientation between the two. These studies investigated the two displays that consider the most immersive (i.e. HMD display) and the least immersive (i.e. desktop display). However, limited number of studies investigated the use of projection screen display (Shim & Kim, 2003, and deKort et al., 2003). The application of VE display is related to the ability to afford a necessary Field of View (FOV). Shim & Kim (2003) suggested that FOV is an important aspect in VE to
10
achieve the sense of being in an environment and performance. Figure 1 illustrates that the normal field of view (FOV) for human is approximately 200 degrees, with 120 degrees of binocular overlap (Sherman & Craig, 2003). A 21” monitor display has around 40 degrees horizontal FOV and HMD display has approximately 50 degrees horizontal FOV (Ruddle et al., 1999). The ranges of FOV for projection screen displays are usually wider than desktop’s FOV. CAVE environment is capable of creating human’s FOV.
Figure 1 Human's FOV The validity of using other displays with smaller FOV than the human’s FOV in VE needs to be investigated. Narrow FOV has been reported to cause perceptual distortion because an individual perceives the narrow FOV as the full FOV (Witmer & Kline, 1998). Witmer and Kline also stated that narrow FOV also intensifies individual’s head movement, which can cause simulator sickness. In a comparison between HMD and desktop displays, Ruddle et al. (1999) noticed a more frequent head movement in participants using a desktop display and more likeliness to move past something
11
without realizing it. However, the difference on individuals’ navigational and spatial knowledge in desktop and HMD displays was not found. Regarding projection screen(s) display, one finding demonstrated that a 180 FOV projection screen display had more accuracy on turning errors than a HMD display (Conroy, 2001). It should be kept in mind that different projection display(s) can create different range of FOV, and thus can provide different range of immersion. Unfortunately, there is a lack of research regarding performance of projection screens.
Input Interface The user interface is the apparatus where individuals are able to send their actions to the computer as an input/feedback to the computer. In navigating through a VE, the selection of VE display also influences the selection of the user interface. The use of a HMD display allows individuals to physically orient their head in a HMD and to use an abstract interface such as keyboard, mouse, or joystick for translating body movements in VE (Ruddle et al., 1999). In a desktop display and a projection display, an abstract interface is needed for both translating directions and movements (Ruddle et al., 1999). Various studies have discussed each trait of the different interfaces. Peterson’s study (as cited in Conroy, 2001) reported the degree of navigational abilities between two interfaces: a body-controlled device and a joystick. Route learning was reported equivalent between the two, but navigational accuracy was higher with a joystick device. Spatial orientation task was equal in a simple environment, but was better with a body-controlled device as the environment became more complex. Witmer and Kline (1998) reported that using joystick created an artificial experience but still considered
12
suitable for navigational task. This conclusion was based on the evidence that the participants were able to find a relationship between their hand movement on the joystick with the walking movement in the virtual world. Witmer and Kline also noted that a treadmill provided a more natural walking movement and thus it offered a more realistic proprioceptive feedback. However, based from Slater, Usoh, and Steed’s study (as cited in Ruddle et al., 1999) stated that it was not clear if the more natural movement with the treadmill was carried over to the navigation task. Ruddle et al. (1999) stated that having similar body movement in the VE as in the real environment would assist the development of spatial knowledge. However, the outcome to the individual’s ability to navigate was not yet identified. Conroy (2001) informed that the more physical controls offered in VE (e g. eyes, fingers, and hand movements, and much more) would decrease the computational response capabilities. This means, the computer will not have enough power to update these individual’s movements and will create some lag time between the expected position and the position that is represented in the display. Thus, the selection of an interface depends on the technological availability and an understanding of the traits of each interface to the research goals. The use of a joystick was considered suitable for this study even though the interface offered an artificial sense and lack of proprioceptive sensory information. On a positive note, Jansen-Osmann and Wiedenbauer (2004) noted that the lack of proprioceptive feedback was not a critical state in spatial learning.
13
Software Components Kessler (2002) discussed the capabilities needed to create a virtual world, those were: adequate detail for the user to identify the environment and responsive virtual world with the user’s actions alongside with the continuous update to the current view. The creation of full detailed features of the real environment is needed for the purpose of generating the sense of being in a real environment. This process will acquire a great amount of time to model and a high-end computational technology to render the features quickly and constantly (Kessler, 2002). In order to create an efficient virtual world with the existing computational technology, Kessler (2002) focused on creating low-primitive geometries such as polygons, lines, and texts to replace the higher-level geometries. Ruddle et al. (1999) applied texture-maps onto the low-primitive geometries to avoid modeling small details of objects. This technique prevents the use of too many polygons and therefore reduces the rendering time significantly. A technique called back-face culling was also suggested to reduce rendering time of the polygons (Kessler, 2002). Back-face culling is a technique where the rendering process of polygons is limited to the face of the polygons that are facing the viewer. Shim and Kim (2003) reported that representations of real life behaviors in VE would enhance the sense of realism. Ruddle et al (1999) and Satalich (n.d.) provided collision detection as a behavior for all the walls so that the user could not walk through them. Satalich found that by failing to provide collision detection behavior to the objects in the virtual world caused disorientation.
14
Applications of VE The advantage of using VE is that it can be applied to a wide range of activities such as training, planning, and entertainment (Wolff et al., 2004). At present, the application of VE can be seen in the military and the aircraft related industry where the uses of flight simulator are well known. The entertainment industry is another area that has applied VE for creating video games (The Board of Trustees of the University of Illinois, 1995). Currently, the use of VE in the e-commerce sectors for simulating and marketing their products are growing (Amaran, 2004). VE can also be a prospective tool for environmental behavior research (de Kort et al., 2003). According to Riecke et al.(2002) VE offers experimental research conditions that are easy to define, control, and duplicate. Also, VE is able to create experimental research conditions that would be difficult to create in the real environment (Péruch et al., 2000). There are two areas regarding the use of VE in environmental behavior research that are discussed in this section. First, studies that investigated whether or not VE application can produce an equivalent research performance as the ones that use real conditions. Second, studies that utilized VE to investigate environmental behavior variables. Even though VE seems as a favorable tool for environmental behavior research, the differences between VE and real environment needs to be noted and whether or not these differences present different outcome needs to be investigated. De Kort et al. (2003) noted several differences between VE and real environment: •
The absent of physical body in VE causes the limitation of human senses that are exposed in VE.
15
•
The limitation of VE presentation such as resolution of the projection and level of detail presents different visual information in comparison with the real environment.
•
The use of devices for providing sensory feedback to the computer provides an unnatural experience to the individual.
According to deKort et al (2003), if people’s behavior in a VE is comparable with the one on the real environment then VE will be a helpful tool for environmental psychology research as it replaces the real environment. A number of studies attempted to investigate the similarities and dissimilarities of people’s behavior between the two environments: •
Lindsey and McLain-Kark (1998) conducted an experiment that focused on observing a space from one location in a real environment, a VE, and a VE with some altered items in the space. A HMD is used for observing the VE. The study found that despite the technology limitations, there was no difference of perceptions on the visibility of objects, the ability to reach specified object, and the ability to share or communicate with other person between real environment and VE.
•
Waller, Beal, and Loomis (2004) investigated the use of VE for examining the accuracy and precision of directional knowledge in a large familiar environment. The experiment was conducted by comparing the pointing errors generated by university students in educational setting using five different methods: real world setting, immersive VE setting, desktop VE setting, a panorama photograph, and the traditional paper and pencil method. The immersive VE setting was generated by a simulation of a 360° panoramic photograph and viewed by using a HMD with a 50° FOV. A mouse was used for the desktop VE setting. The result demonstrated a 16
significant similarity in the directional knowledge between VE settings and real world setting. •
A study by Rohrmann and Bishop (2002), using an appraisal questionnaire, found that representation of environmental features (i.e. lighting, shadow, and sound) on walk-through simulation of a suburban area was appropriate. The study did not find the less detailed presentation of simulated environment to be critical for studies in environmental behavior.
•
Satalich’s study (n.d.) compared individuals’ ability in learning an environment using VE and using a map as a control group. A HMD with a 30° FOV and a joystick that were assigned to move forward, backward, and set up speed were the VE apparatuses. Participants were asked to perform exploration, orientation, distance estimation, and wayfinding tasks. The study found that the VE users performed equally or worse than the control group. Some explanations presented due to these findings were the lack of exploration time in VE, the unfamiliarity with the novel technology of VE, the unnaturalness of experiencing VE, and the disorientation caused by the ability to pass through walls.
•
de Kort et al. (2003) investigated the comparability of real and VE by requesting information on estimation, opinion, and sketch map. The apparatuses used were a back projection screen and a joystick with 12 buttons and 3 degree of freedom. The results found that people using VE tended to underestimate size and heights; cognitive mapping in real environment was significantly better than VE. Some reasons offered for these findings were the cognitive load posed by the medium of VE and operating the joystick, small FOV (using desk-top display), and the unnaturalness of navigating through VE. 17
Satalich (n.d.) recommended more studies to validate the use of VE for environmental behavioral research. Other studies have utilized VE as a method of environmental behavior research. Dalton (2001) used VE to investigate individuals’ behaviors in choosing directions. Riecke, et al. (2002) utilized VE for investigating individuals’ navigation and spatial abilities. Bartella et al.(2001) not only investigated humans’ orientation abilities but also used VE as diagnosing and learning tools for individuals with topographical orientation disorder. Jansen-Osmann and Wiedenbauer (2004) applied a VE method for investigating spatial cognition on children and adults. These studies demonstrate that VE has been used for environmental behavior research, specifically for investigating individuals’ orientation abilities and behavior. It is reasonable to anticipate the use of VE for environmental behavior research with a focus on the environment. Wayfinding research in architecture is one important area in the environment behavior research.
Wayfinding Research in Architecture Trying to find one’s way to a certain destination is a process that people go through every day. This process is recognized as wayfinding. The wayfinding process is important because failing to perform this task may cause loss of time and create stress. Wayfinding has been described as an act of information processing, decisionmaking, and decision execution in order to reach a destination, whether in a familiar or an unfamiliar environment (Arthur & Passini, 1992). Therefore, in order to find one’s way to a specific destination, an individual needs to be able to gather information from the environment, process the information, decide which way to go, and carry out that decision. The two variables involved in the wayfinding process are the individual and
18
the environment. While wayfinding research in psychology deals with the individual variable, wayfinding research in architecture concentrates on the role of the built environment. Even though the built environment plays a significant role, there is little conformity regarding which environmental elements are important in wayfinding process. Various studies have proposed different environmental elements. •
Lynch (1960) described five distinct elements for a ‘legible’ city, which provide organized patterns in the process of wayfinding: paths, edges, districts, nodes, and landmarks.
•
Weisman (1981) found architectural plan configuration as environmental variables for orienting the users. His study was judged by independent raters, with relations with wayfinding behavior, and based on self-report data.
•
Garling, Böök, and Lindberg (1986) proposed that the complexity of spatial layout, degree of differentiation, and degree of visual access are important physical-setting variables.
•
Dogu and Erkip (2000) hypothesized the importance of signage rather than building configuration for wayfinding and orientation in shopping mall. The study found a relationship between signage and wayfinding without confirming the hypothesis.
•
Werner and Schindler (2004) considered the orientation of geometrical property of buildings as a significant variable contributing to wayfinding.
These studies are considered to be at the developmental stage, where new concepts are introduced and normally were obtained from a small sample. For instance, 19
Lynch (1960) considered his study as a preliminary exploration because his results were based only from the use of three cities and small group of people in the data collection. Weisman’s study (1981) is another example of a preliminary exploration study, where he recognized the use of subjective measurement for grouping these forms of plan configuration, even though he found a significant result. With preliminary exploration studies, more researches are needed to verify these conceptual ideas of different environmental variables and in the end could provide generalization and agreement of the kind of environmental variables are important in wayfinding process. Abu-Ghazzeh’s study (1996) is an example of a study that attempted to verify the various environmental variables proposed by Lynch (1960) and Garling et al. (1986) in university settings. However, Abu-Ghazzeh discouraged any attempt to generalize his findings for other architectural settings. Other studies attempted to verify one particular environmental variable in wayfinding process. Peponis et al.(1990) acknowledged the subjectivity of Weisman’s study (1981) and proposed an objective measurement of building layout. This analytical measurement provided a tool for understanding the structure of individuals’ wayfinding behavior. Still, Peponis et al. recognized the study’s constraint that was derived from only utilizing one hospital setting. This method of measurement by Peponis et al. was confirmed by Haq (2001) as an important wayfinding variable. Utilizing three hospital settings, Haq’s study looked at the relationship of environmental understanding with environmental form (i.e. building layout) and patterns of search. The experiment was conducted with 128 volunteers in three complex urban hospitals in the U.S. The volunteers provided a self report on their wayfinding strategies, performed open
20
explorations, where they attempted to become familiar with the settings, wayfinding tasks, where they were asked to reach specific locations, pointing to unseen but previously visited destinations, estimating distance, completing cognitive mapping tasks such as sketching a map of the hospital’s main corridors and routes. His analysis revealed that the form of building layout is a good predictor for wayfinding processes in both exploration and directed search. The study supported the strong relationship between building layout and wayfinding process as reported earlier in Peponis et al. study. Hence, Haq’s study provides strong indication of building layout as an important variable in wayfinding process and the reliability of analytical measurement for wayfinding studies in the architectural field. For the purposes of this thesis, Haq’s study was used as a precedent.
Wayfinding Research and Virtual Environment Previous studies (Weisman, 1981; Peponis et al., 1990; O’Neil, 1991; and Haq, 2001) found that floor plan configuration is an important environmental variable in wayfinding success. Some of these studies also found objective ways to measure the floor plan configuration. However, these studies were conducted in the real environment where extraneous variables such as noises, people, and scents could not be controlled (Satalich, n.d.). Peponis et al. (1990) acknowledged that a populated space appears more attractive to individuals who are performing wayfinding process. Haq (2001) noted the results of his study might also be influenced by light and color variations. Haq (2001) stated that one way to investigate the role of a particular environmental variable in the wayfinding process is to control other environmental
21
variables in a wayfinding study. One way to perform a controlled environment is to apply a simulation technique to a wayfinding study. O’Neil’s study (1991) utilized a collection of slides illustrating the photograph of different intersections in a real environment for the purpose of constraining the extraneous variables. However, using photographs would only give information according to the researcher’s point of view and not from that of the sample population. VE will allow the sample population to move freely to gather appropriate information and also allow the researcher to limit the extraneous variables. This study will investigate the use of VE as a technique to provide a controlled environment in wayfinding research.
22
CHAPTER III METHODOLOGY
This chapter describes the methodology used to investigate the relevance of a VE as a technique to provide a controlled environment in wayfinding research. According to Groat and Wang (2002), a simulation study can be used to demonstrate the empirical result of a conceptual idea or a theory. In this study, the conceptual idea is that VE is a useful tool for wayfinding research in architecture. A VE created for this study was the representation of a real environment that was used in Haq’s study (2001). This study was chosen because it takes into account lessons learned from previous studies, has been carried out in three different settings with similar results, has verified the consistency of an objective measurement for an environmental variable, and most importantly, the researcher has access to the raw data collected. The present study used VE technology to create one of the hospital settings used in Haq’s (2001) experiment, which used 42 volunteers, and attempted to determine if the procedures from Haq’s experiment could be replicated in the VE. Therefore, the VE setting was created first, followed by the set up of for the replication of Haq’s experiment in that VE. VE Development This section describes the set up of user interface for wayfinding study in virtual environment (VE) using technologies that were available in the College of Architecture at Texas Tech University. The segment begins with the preparation of the hardware interface to the user. This interface demonstrated how the computer ‘sees’ the user
23
(Input) and how the user sees the virtual world (output) (Sherman & Craig, 2003). Then, the virtual world was built with the use of appropriate software components in order to create immersion and data for the wayfinding study. These hardware and software were set up on a Pentium4 computer with 512 MB RAM and a GeForce4 MX440 64MB video card.
Hardware Interface to the user: Input (how the computer ‘sees’ the user) Physical Control User monitoring is real-time monitoring of the participant’s actions in a VE experience (Sherman & Craig, 2003). Physical controls such as joystick, mouse, and keyboards are some of active ways for the user to input information into the systems. In this setting, a joystick was selected in consideration that this control is simple to understand for both users who are familiar and not familiar with computer. Witmer and Kline (1998) commented that the VE user has the ability to relate the movement of the joystick with the movement in the virtual world (e.g. pushing the joystick forward means the user moves forward). Three brands of joysticks were analyzed. The first one was ‘Gravis Blackhawk Joystick’ (See Figure 2). The movement of the joystick was not stable, which caused inaccurate movement in the VE. Another problem found was that its design did not have basic resistance in the movement of the joystick. The absence of resistance in the movement of the joystick would be perceived as running in the VE, while in actuality the movement was set off into walking speed. It was decided that the users would find difficulties in relating their hand movement with the walking movement in the virtual world.
24
Figure 2 Gravis Blackhawk Joystick The second joystick analyzed was ‘The Logitech Freedom cordless’ (see Figure 3). This joystick was considered because of the ability to place the joystick at a long range from the computer without any cable interrupting the platform. However, from the pilot study, it was found that there was a sensor interruption between the joystick and the receiver. This interruption had caused delays between the user’s movements and the display of the user’s position on the screen based on those movements. This delay created missing propriceptive feedback to the user and had created some level discomfort to 90% of the participants in the pilot study where 27% of them experienced disorientation to the point they could not continue the experiment.
Figure 3 Logitech Freedom Cordless 2.4 The second joystick analyzed was ‘Logitech Wingman Attack 2’ (See Figure 4). This joystick was stable and could represent an accurate movement in the VE. The
25
movement of the joystick also provided resistance, which could be perceived as a suitable representation for the user’s walking speed.
Figure 4 Logitech Wingman Attack 2 Joystick Therefore, ‘Logitech Wingman Attack 2’ was selected because no significant problem was found. The joystick wire had a limited length but it was quite adequate to meet the minimum distance from the place where the user sat to the CPU. For this study, the input information from the joystick was limited to x and y position. The movements were set up to forward, backward, and roll right and left (i.e. push forward to move forward, push back to move backward, and push left or right to rotate to the left or right). This limitation was applied to the joystick so that the participants did not have to process too much information on how to use the joystick. To operate the joystick, the participants were only required to press the front button of the joystick before moving the handle to the desired directions.
Hardware Interface to the user: Output (how the user ‘sees’ the VE) Platform Platform is the part of the VE system where the participant is situated. A platform could be designed to mimic a real-world environment such as a replica of a cockpit of a plane or simply provide a generic place to sit or stand (Sherman & Craig,
26
2003). In this experiment, three generic places were analyzed to determine the appropriate place to conduct the study. These three places were three rooms in the College of Architecture building at Texas Tech University: room 07 (See Figure 5), room 507 (See Figure 6), and room 508 (See Figure 7). Rooms 07 and 507 were used as lecture rooms while room 508 was a graduate office.
Figure 5 Room 07
27
Figure 6 Room 507
Figure 7 Room 508
28
None of the rooms had a computer to load the VE simulation. Since these rooms were not intended specifically for this experiment, a cart was built to transfer the computer to different rooms (See Figure 8).
Figure 8 The Cart with The Computer, The Projector, and The Joystick Room 507 and room 508 did not have a projector. Therefore, a projector was set up and was stored on the cart. The projector was ‘ViewSonic PJ551’ (See Figure 9). It is a commercial projector used for general presentations. As a standard projector, it is manufactured as a front-table projector (i.e. projector that is placed on the table and projected onto the front of the screen). Placing the projector at the regular table height would capture participant’s shadow since the participants were seated very close to the front of the screen for the purpose in obtaining a maximum FOV. An ideal projector to
29
use in this type of condition is a rear projector or a front-ceiling projector. Thus, an adjustment was made in order to deal with the limitation of the available projector. The adjustment was to raise the projector as high as possible to avoid capturing shadow. A 2’X2’X2’ box was built and placed on top of the cart to bring the projector up to six feet in height and positioned to avoid the shadow.
Figure 9 ViewSonic PJ551 Table 1 illustrates the advantages and disadvantages of the three platforms selected.
30
Table 1 Advantages and Disadvantages of the Three Rooms Room 07
Advantages
Disadvantages
Big screen (9’6”X 6’8”) provided more
The quality of the projector was poor
immeriveness.
and produced a flickering effect on the screen, which resulted headache and dizziness. (from the pilot study)
The projector used was permanently
The room was for large lecturers. The
placed on the ceiling, so it allowed
large space could provide the sense of
the person to stand. The ability to
walking in a hall instead of corridors.
stand was more similar to a person walking in an environment, therefore might provide more realistic sense of ‘walking’ The room could be reserved
It was more complicated to set up the
exclusively for the experiment, thus
equipment. (I e., set the CPU with
there was privacy.
existing cable in the room, transform the digital output into TV output, and setup the platform with a box for a stage and a stand for the joystick) Small FOV: 58 degree. The FOV was small because the participants needed to stand farther from the screen to avoid shadow.
31
Table 1 Continued Easy to set up the experiment because 507 the CPU was placed in the same floor
The person sitting might provide less immerse sense of ‘walking’
Medium projection screen (7’8”X5’9”) Bigger FOV: 79 degree The room was not too small and not too big and could provide the sense of walking in the hospital’s corridors. The room could be reserved exclusively for the experiment, thus there was privacy. 508
Easy to set up the experiment because
Small projection screen (4’6”X3’3”)
the CPU was stored in the same room
There was no privacy for conducting the experiment because the room was an office with having other students working. The person sat between two dividers (for office cubicles). This condition could cause the sense of walking in very small corridors instead of the larger hospital corridors. The person sitting might get less immerse sense of ‘walking’ Small FOV: 61 degree
32
Room 07 had its own front-ceiling projector (i.e., Sony 1271 CRT video projector). This provided ability for the participant to stand, thus producing a more realistic sense of walking. The large projection screen also created a sense of being in the hospital environment. This was demonstrated when the users moved their head more often than in the other rooms, perhaps as they would have done in the real environment. The main concern was the poor quality of the projector, which had created motion sickness to the user. Even though the projector screen in this room was the largest out of the three rooms, surprisingly it provided the smallest FOV. This phenomenon was caused by the inability of placing the participant closer to the screen to avoid shadows from the participant’s head. Room 508 was convenient for setting up the equipment, but there was no privacy there. This problem would add an extraneous variable and affect the result of the experiment. The small FOV was also another factor not selecting this room as the platform for the experiment. After analyzing the advantages and disadvantages of each room, room 507 was selected as the platform for this study. The important factor for selecting this room was the largest FOV offered. Other factors for this choice were the medium size of the room, ease of setting up the equipment, privacy for conducting the experiment and avoidance of as many extraneous variables as possible.
VE Display It has been recognized in the literature that additional studies are needed to investigate the use of projection-based displays. The most important concern is that the different range of FOVs could provide different ranges of immersion. Furthermore, not
33
many studies have dealt with the role of projection screen display in human behavios. However, Conroy (2001) has revealed that a 180 FOV projection screen display has more accuracy on the turning errors than a HMD display. A use of projection-based display in this study should also shed some light on this problem. The selection of the projection-based display was also supported by Sherman and Craig’s (2003) notion that this type of display will increase the range of FOV and permit users to remain in the virtual environment for longer periods. The projectionbased display used in the three platforms analyzed had a range of FOV from 58 – 79 degree (See Figure 10). In comparison, regular monitor-based display had only 44 degree FOV (See Figure 11). For the present study, the projection-based display that produced the largest FOV (79° FOV) was used.
RM 07
RM 508
Figure 10 FOV Projection
34
RM 507
Figure 11 FOV Monitor Software Components: System presentation to the user The building Model The environment in VE is a set of geometries, the spatial relationship of the geometry to the user(s), and the change in the geometry in the response to the user actions as time progresses (Kessler, 2002). The environment for this experiment was a hospital building from prior wayfinding study (Haq, 2001). The model was a representation of corridors from the second floor of the hospital. The model was created using 3D MAX 5 from an existing AutoCAD floor plan (See Figure 12) by using some guidance from several pictures taken in the real environment (See Figure 13) and discussion with Haq. 3D Max 5 is a software package that was used to generate the 3D VE content. Since Haq (2001) considered movement paths in the corridors only and did not include other variables, the corridors in VE was created as simple as possible to limit any extraneous environment variables such as signage, color, lighting, and furniture (See Figure 14). However, two built-in reception desks and filing cabinets were created. Additionally, four doors were colored red, blue, green, and magenta to correspond to the locations that were used in Haq’s experiment. Table 2 summarized the similarities and differences between real and virtual corridors of the hospital.
35
Table 2 Similarities and Dissimilarities Between Real and Virtual Hospital Real hospital
Virtual hospital
Pictures on walls
No picture on walls
Multiple levels
Only second floor of the hospital
Contains furniture
Only built-in reception desks and filing cabinets
Some areas were closed to general public
The same areas were closed to the users. They were not modeled
Presence of other people
No people
Different characteristics of surfaces (walls,
One type of surface for walls, floors and
floors, ceilings) in different areas
ceilings (except around some of the entrance areas) and four types of doors (i.e. room, service, elevator, and colored doors)
Different floor heights
Same floor heights
Varied lighting
Constant lighting
Cannot pass through walls
Cannot pass through walls
Mode of traveling: walk (cannot fly)
Mode of traveling: walk
Can move up through stair but the
Cannot move up through stair because
participant were constrained to go up and
only one floor was considered
down
The model from 3D Max 5 was exported as a 3ds file and imported in EON Reality 4. EON Reality is another software package that acts as VE editor to provide interactivity. Unlike VRML software, which needs the knowledge of programming 36
language, EON Reality software uses a Graphical User Interface (GUI) so significant programming skills are not required. In order to correspond with the unit base used for the existing floor plan, the display unit scale was imperial standard, but the scene unit scale was metric standard because the model was then exported to EON Reality 4 software which had metric standard as the unit base.
Figure 12 AutoCAD Floorplan Showing the Corridors Considered in This Study
37
Figure 13 Pictures from The Real Environment
Figure 14 Pictures from The Virtual Environment Geometry The model was built from very simple geometries (rectangular shapes). According to Kessler (2002), the best method for building the VE model, which will maximize the capability of recent computational technology, is to translate higher-level geometries such as boxes, spheres, and curved surfaces into lower-level geometries such
38
as polygons, lines, and text. Lower-level geometries will be rendered quickly and will also avoid the large capacity on rendering intricate details, thus providing a smooth VE simulation. Therefore, the model was created with as few polygons as possible (i e. 6083 polygons) (See Figure 15). This technique is called polygon-bound.
Figure 15 The 3D model with 6083 polygon count Another method used to limit rendering the intricate details were the use of an image containing a picture of the detail (Kessler, 2002). Some examples of this application in the model were the texture of the walls, floors, ceilings, and the detail of doorjambs and lighting fixtures. One other technique called back-face culling (Kessler, 2002) was used to limit rendering the polygons that not face the viewer. EON Reality 4 rendered surfaces of
39
polygons that faced the viewer and those polygons’ surfaces that were not facing the viewer were not rendered (See Figure 16).
Figure 16 Back face culling Walking Speed and Lighting North and Miller (2002) determined that the average walking speed for individuals is one meter per second. This was used to calibrate the joystick and the software so that subjects could not ‘walk’ at more than one meter per second. On the subject of lighting, the model was exported from 3D Max 5 to EON Reality 4 without any light. EON software provided an equivalent ambient light across the corridor spaces. There was no shadow created because generally a software package that deals with rendering at interactive rates does not calculate lights that are obstructed by objects in the environment (Kessler, 2002).
Behavior (how objects interact with each other and with the user) Two behaviors were utilized to achieve the desired conditions in the experiment. The first behavior was tracking attribute. Tracking devices are used to report the position and orientation of a “tracker” in relationship to a particular reference frame (Kessler, 2002). In this particular experiment, the tracking device was used to report
40
positions of the camera (the user) in the environment at a range of time the user ‘walked’ in that environment. According to Kessler, this behavior is considered an environmentindependent behavior, where the object’s (camera) behavior described a change in the environment over time or at a certain point of time (i.e. time-based behavior). EON Reality 4 had the ability to track information of time, x-position, y-position, z-position, roll-position, pitch-position, and yaw-position (i.e., 6-Degree of Freedom). For this study, x-position and y-position were the only tracking information needed. The data from EON software was a .dat file. This data was copied to Microsoft excel and the data of x-points and y-points was transformed into a comma-delimited format for the purpose of transferring the ‘X,Y’ data into AutoCAD software as lines. These lines illustrated the path that the user completed in a period of time within the building floor plan (See Figure 17).
41
Figure 17 Example of recorded path using tracking information The second behavior employed was a collision detection feature. The environment will look more ‘realistic’ if the user cannot pass through the walls (i.e., collision detection). Satalich (n.d.) found that by failing to provide collision detection behavior to the objects in the virtual world had caused some disorientation. However, “…simulating a world…” that obey such a physical law “…and producing an accurate view of the objects at interactive rates, is a job beyond the ability of most computers in existence today.” (Kessler, 2002). Some system provides assistance to apply some physical laws to objects. For this particular behavior, EON Reality 4 provided invisible boxes, which would provide collision behavior if the user (the camera) collided with the sides of the boxes (See Figure 18). According to Kessler, this behavior is considered as an
42
environment-dependent behavior, where object’s behavior changes in response to events initiated by users or other objects (i.e., event-driven behavior).
Figure 18 Collision Box Wayfinding Experiment in VE Participants A total of 32 undergraduate and graduate students from various departments at Texas Tech University, primarily from architecture and interior design, participated. All of these participants volunteered and the majority of them received course credit for their participation.
Procedure The experiment consisted of six tasks and was expected to take no more than 120 minutes. All of the experiments took place in room 507. The experiment started with filling out a self-report about individual wayfinding strategies in an unfamiliar building. The second task consisted in getting comfortable using the joystick and navigating within a virtual environment (i.e. Pre-training). The pre-training consisted of navigating in a virtual environment room 72’X72’ with 16- 8’X8’ rooms (See Figure 19).
43
The participants had approximately 5 minutes to accomplish this task and were allowed to stop earlier if they felt comfortable with the experimental tools.
Figure 19 Pre-training Environment The virtual model of a real hospital was shown on the third task. The participants were asked to navigate within the model of the hospital using the joystick in order to understand the layout of the building. This task was called an open exploration and it lasted a maximum of 15 minutes. Two starting points were assigned randomly to the participants. These starting points were two entrances used in the real hospital environment (See Figure 20).
44
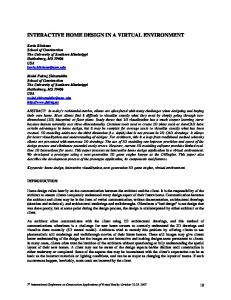
Figure 20 Locations of the Two Entrances In the fourth task was called the directed search. The participants were taken to one of the four colored doors (i.e. red, blue, green, and magenta) and then were asked to walk to another colored door. These four colored doors (See Figure 21) were representation of four destinations in the real environment (i.e. Emergency Department Director, MRI, Chapel, and the Traction room) that were used in Haq’s (2001) study. The participants were given a maximum of 10 minutes to accomplish this task. If after 10 minutes they failed to find the destination, they were escorted to that destination.
45
Figure 21 Locations of the Four Colored Doors At each destination, the participants were asked to point to the location that they had come from. This task was called the pointing task. From these searches of four destinations, marked as colored doors, twelve search combinations were formed. Four search combinations were assigned randomly to the participants. The idea was for each participant to complete the directed search and the pointing task until he/she had walked to all the four colored doors. In order to record separate data of the paths for each the directed search, separate VE files were created. After the exploration task, the participants were escorted to one of the four colored doors. In front of the colored door, facing north, the previous file was closed and the new file that started with the same colored door and facing the same direction, was opened. This procedure was repeated for each directed search of all
46
the four colored doors. Thus, each participant generated five data files of the recording paths, one file for the open exploration and four for the directed search. Finally, the last task, named sketch map, consisted in drawing the corridors of the hospital, as the participants remembered them, in a plan-like view on an 8½ by 11 white paper. The idea of setting up these tasks was to match the ones that were carried out in Haq’s (2001) study. Table 3 illustrates the similarities and differences of the tasks between Haq’s and the present study. Table 3 Similarities and Dissimilarities of the Tasks between Haq’s and the Present Study Haq’s Study Self-report on wayfinding ability
Present Study Self-report on wayfinding ability Pre-training
Open Exploration (Randomly assigned
Open Exploration (Randomly assigned
into two starting points)
into two starting points)
Directed Search (Participants were
Directed Search (Participants were
searching for four specific locations which
searching for four specific locations, which
were represented by signage)
were represented by four colored doors)
Pointing Task
Pointing Task
Distance Estimation Task Sketch map
Sketch map
Pilot Study Twelve undergraduate and graduate students volunteered for the pilot study. These students were given a course credit for participating. Two tasks were omitted
47
from this study. They were the directed search and the pointing task. The major modification that was carried out in the experiment were: •
The replacement of ‘The Logitech Freedom cordless’ joystick with ‘Logitech Wingman Attack 2’. ‘The Logitech Freedom cordless’ joystick did not have a strong signal from certain position, which caused a lag time or even loss of control between the participant’s hand movement and the view in the projection display. From the 12 volunteers, seven had problem with the joystick and three of them could not continue because of disorientation.
•
The height of camera (i.e. the eye of the participants) was found to be lower that the common eye’s height (i.e. 1.175 m). The height height to 1.4m for the experiment.
Measurement The measurement was formed to answer two questions: Can a VE replicate a real environment, used in Haq’s (2001) study, with sufficient resolution, detail, immersiveness, and interactivity to duplicate the wayfinding tasks done earlier and What would be the similarities and differences of the tasks in the two environments? This measurement was looking at the degree of success in replicating Haq’s earlier wayfinding experiment. It was expected that the data from Haq’s and VE experiment should illustrate similar results. Table 4 presents the data measurements collected to answer the two research questions for this study, together with which tasks were used to collect those measurements. The first measurement, the percentage of subjects who were successful in
48
completing the experiment, was a measurement to find out whether or not a VE can be created for a wayfinding study. In order to find out how effective a VE was for a wayfinding study in comparison with the use of real environment, four measurements was gathered from the three tasks conducted in the experiment. The similarity on subjects’ success in finding destinations was the measurement collected from the directed search task. The similarity on the average pointing errors was the measurement collected from the pointing task. The similarities on the number corridors and the similarity on the number intersections used for exploratory search were the measurements gathered from the open exploration task. The results of these measurements are reported and analyzed in the next chapter.
49
Table 4 Measurements and Experimental Tasks that were used to answer the Research Questions
Research Questions
Measurement
Experimental Task
Can a VE replicate a real
The percentage of participants
Completing all the
environment in Haq’s
who will be successful in
tasks
study to duplicate the
completing the experiment.
wayfinding tasks done earlier? What would be the
The similarities found from the
similarities and
number corridors used for
differences of the tasks in
exploratory search in Haq’s
the two environments?
study and in VE. The similarities found from the
Open Exploration
Open Exploration
number intersections used for exploratory search in Haq’s study and in VE. The similarities found in
Directed Search
participants’ success in finding destinations. The similarities found in the average pointing errors in Haq’s study and in VE.
50
Pointing Task
CHAPTER IV RESULTS
The purpose of this study was to investigate the relevance of a VE application as a technique to provide a controlled environment in wayfinding research. The data from the experiment were collected and analyzed based on the two research questions. They were: Can a VE replicate a real environment, used in Haq’s (2001) study, to duplicate the wayfinding tasks done earlier and What would be the similarities and differences of the tasks in the two environments? Five measurements were established to address the questions. The first question was measured by the percentage of subjects who were successful in completing the experiment. The second question was measured by the following: the similarity of participants’ success in finding destinations, the similarity of the average pointing errors, the similarities of corridor use, and the similarity of the intersection use in the exploratory search. According to deKort et al. (2003), if individuals’ behavior in a VE is comparable with the one on the real environment then VE will be a helpful tool for environmental psychology research as it replaces the real environment. It was expected that the data from Haq’s and VE experiment would illustrate similar patterns.
Ability to Create VE for Wayfinding Study The ability to create a VE for a wayfinding study was measured by how many subjects were successful in completing the experiment. Ninety percent of the participants were able to complete all six tasks of the experiment. Three participants
51
(10%) were not able to complete all of the tasks. They had to stop in the middle of experiment because they experienced severe discomfort such as headache and nausea.
Data Comparison of Wayfinding in VE and Real Environment Similarities in the Number Corridors Used for Exploratory Search Twenty-four corridors in the building were accessible for the open exploration task. Numbers were assigned to these corridors for easy analysis (See Figure 22). The data was gathered by looking at how many times each corridor was used by 42 participants in the real environment and 32 in the VE (Total Use of Corridors). Figure 23 illustrates the average use of the corridors in both environments.
Figure 22 The 24 Corridors
52
4.5 4 3.5 3 Average TUofC in OE_Real
2.5 2
Average TUofC in OE_VE
1.5 1 0.5 0 1
3
5
7
9
11
13
Corridor's #
15
17
19
21
23
Figure 23 The Average Use of Corridors in Open Exploration The average use of corridors in both environments seemed to demonstrate a similar pattern. In general, the corridors that displayed a high average use in the real environment also displayed a high average use in the VE. Similar patterns could also be seen in the low average use of corridors. The average discrepancy from both environments was 0.46, which was significantly small (t=-0.56, α=0.001). The use of corridors number 7, 9, 15, 21, and 22 revealed a different pattern between the real environment and the VE. One possible reason for the zero use of corridor 7 in the real environment was it might be that all the information needed in that corridor could be gathered by looking at it from its the intersection with corridor 6. This ability for gathering information in the real environment was probably caused by the wide range of human FOV, which was not so in the VE. The limited range of FOV in the VE probably also caused by the little use of corridor 9 in the VE. According to Ruddle et
53
al. (1999), there was a possibility that participants moved past something without realizing it because of the limited FOV. The extreme use of corridor number 15 in the VE was probably affected by the placement of a blue door and reception desk that might have attracted the participants to walk into the corridor. A large number of glass doors and windows placed in this area, which served as the entrance design, could have also played apart in attracting the participants. These variables in the VE created attention that might not have been the case in the real environment. In the real environment, other extraneous variables might be more appealing for the participants for traveling to different corridors. The participants could recognize the entrance from the intersection with corridor 11 because they could see the outside view from the glass doors and windows with the addition of the signage and probably did not feel the necessity to travel and explore that area. In the VE, the participants did not recognize the glass doors and windows as the entrance, because the outside view and the signage were not created. The absence of this information might have caused the participants’ eagerness to travel to corridor 15. However, the placement of some windows in corridor number 22 did not create the same traveling behavior as in corridor 15. The use of corridor 21 and 22 was more frequent in the real environment that in the VE. Limited FOV in the VE was considered to be the cause of this phenomenon. Because of the limited FOV, the participants moved past corridors 21 and 22 and continued walking straight to the corridor number 13. In the real environment, participants traveled in corridor 21 and 22 instead of corridor 13. There are staff elevators that open into corridor 13. There are clear signs which say: ‘Staff Only’. This is why people did not go to that corridor in the real environment. The possibility of the daylight that came from the windows, which created different lighting
54
levels and the presence of other people, would also influence the frequent use of these two corridors. The area in the corridor number 22 was an area where the main elevators were located and was considered an entrance access for visitors who came from the 1st floor.
Similarities in the Number Intersections Used for Exploratory Search Twenty-eight numbers were assigned to the intersections of the corridors for easy analysis (See Figure 24). The data was gathered by looking at how many time the intersections (Total Use of Intersections) were used by the 42 participants in the real environment and 32 in the VE. Figure 25 illustrates the average use of the intersections in both environments.
Figure 24 The 28 Intersections
55
3.5 3 2.5 Average TUof I in Real
2 1.5
Average TUof I in VE
1 0.5 0 1
3
5
7
9
11
13
15
17
19
21
23
25
27
Intersection's #
Figure 25 Total Uses of Intersections Per Person in Open Exploration The average use of intersections in both environments also demonstrated a similar pattern. Intersections that displayed a high, intermediate, or low use in the real environment also displayed a high, intermediate, or low use in the VE. The average discrepancy from both environments was 0.44, which was significantly small (t=-0.22, α=0.001). However, the average use of some intersections displayed a different pattern. Intersections number 15, 16, 17, 20, 21, and 22 were being used more often in the real environment. The average use of these intersections was smaller in the VE possibly because of the unnaturalness and the difficulty to explore those areas using the joystick and the limited FOV. The rotation speed to the right and left of the joystick was set to slow to avoid motion sickness. However, because of the slow rotation for getting visual information from the right and the left of the participants, they were reluctant to look
56
around. Thus, the participants in the VE probably tended to just walk straight towards areas that were displayed in front of them (i.e. Intersections number 13, 18, and 19). Two other intersections revealed a reverse of the pattern that discussed above. Intersections number 11 and 14 demonstrated more use in the VE rather than in the real environment. One possible reason for the high discrepancy was that in intersection number 11 in the VE the participants were traveling back and forth to and from the entrance located close to that intersection. Since the participants could not walk beyond the entrance, they were required to turn back. This behavior might be caused by the inability to recognize this area as one of the entrances due to the lack of signage or people and/or the rendering quality that was displayed in the VE. The high use of intersection 14 in the VE was probably because of the same reason as that of corridor 15, which were the effect of the blue door and a reception desk that might have attracted the participants to walk into that intersection.
Similarities in Finding Destinations There were four destinations that each participant was required to find in the directed search task. Twelve search combinations were obtained from those four destinations (See Table 5). The average percentages of participants’ wayfinding success in all twelve combinations are illustrated in figure 26. Overall, the average percentage was 79% in the real environment and 76% in the VE with variations in individual searches (Std. Dev: 0.23 in the real environment and 0.14 in the VE). This similar value between both environments was considered significant (t=0.75, α=0.001). The different patterns in their individual searches are discussed below.
57
Table 5 The Twelve Search Combinations Real Environment
VE
MRI to EDD (MRI-EDD)
Blue to Red (B-R)
Chapel to EDD (C-EDD)
Green to Red (G-R)
Traction room to EDD (T-EDD)
Magenta to Red (M-R)
MRI to Chapel (MRI-C)
Blue to Green (B-G)
Traction room to Chapel (T-C)
Magenta to Green (M-G)
EDD to Chapel (EDD-C)
Red to Green (R-G)
MRI to Traction room (MRI-T)
Blue to Magenta (B-M)
Chapel to Traction room (C-T)
Green to Magenta (G-M)
EDD to Traction room (EDD-T)
Red to Magenta (R-M)
Chapel to MRI (C-MRI)
Green to Blue (G-B)
Traction room to MRI (T-MRI)
Magenta to Blue (M-B)
EDD to MRI (EDD-MRI)
Red to Blue (R-B)
58
100% 90% 80% 70% 60%
Percentage Avg. in Real Environment
50% 40%
Percentage Avg. in VE
30% 20% 10%
M RI -E
D D C/ ED B-R D /G TED -R D /M M RI -C R /B T- -G C ED /M D -C G /R M -G RI -T /B C- -M T ED /G -M D -T C- /R M RI M / TG M ED RI B / D -M M-B RI /R -B
0%
Path Destinations
Figure 26 Average Percentages of Wayfinding Success in the Twelve Destinations The finding success in the real environment was very high (100%-90%) within six path combinations that generated from two destinations. They were: three path combinations to the Chapel (MRI-C, T-C, and EDD-C) and three path combinations to the MRI (C-MRI, T-MRI, and EDD-MRI). Two path combinations, which were directed toward the Traction room, demonstrated a rather low (below 50%) wayfinding success (MRI-T and EDD-T). These findings showed that there were wayfinding patterns within particular destinations. There were good wayfinding successes to the Chapel and MRI and a fair to poor wayfinding success to the Traction room. In VE, most combinations had a rather equal average and above finding success (50-80%) except for two path combinations where all the participants could find the destinations (Blue to Magenta and Green to Red). No obvious wayfinding patterns were found for particular destinations. There was no obvious similarity in the individual search patterns between
59
the two environments. The only one combination search that appeared similar was from magenta door (Traction) to the red door (EDD) and considered coincidence. Thus, even though the percentage averages in both environments were similar, the dispersions between them were different (Std. Dev. in real environment: 0.23; in VE: 0.14). One explanation that may be suggested is that other environmental variables such as signage in the real environment might have affected the participants’ wayfinding success. This is supported by the fact that in the real hospital, there were plenty of directional signs to guide the subjects to the chapel and MRI and lack of them to guide the subjects to the traction room. Another interesting finding based on this data was that when the environment variables were constrained to only building layout in VE, most of the participants’ finding success was rather in the similar range of success. This finding demonstrated that the ability to find all destinations was equally easy or hard, unlike the real setting where signage obviously played a part.
Similarities in Average Pointing Errors The average pointing errors in the VE was almost twice than that in the real environment (See Figure 27). A t-test found a significant difference between pointing errors in the two environments (t=-3.90, α=0.001).
60
Average Pointing Errors
61.82758621
37.16683333
Real Env. VE
Figure 27 Average Pointing Errors It was observed that during the pointing tasks, there seemed to be a lot of hesitation in using the joystick to look around while trying to determine the direction of the starting location. In the real environment, the participants could easily turn their head around. Thus, they determined the direction of the starting location based on their current understanding of the building layout in relation with visual information gathered from looking around at the current location. Since the projection screen in the VE provided limited FOV of the destinations’ surroundings and the participants hesitated to look around, they relied on their current understanding of the building layout in relation with their recollection of the current location. Having access to more information in the use of the real environment may be in factor of less error in pointing accuracy.
61
Analysis of the VE development According to the findings, the development of VE using technologies that were available in the College of Architecture at Texas Tech University was adequate for a wayfinding study. The use of a projection screen display and a joystick appeared appropriate for this experiment. An informal observation found that some participants moved their head to observe the environment as they would do when observing the real environment. This behavior indicated that the current VE offered some degree of immersion. The model of the existing hospital corridors could be replicated in a VE and the animation ran smoothly by using a combination of polygon bound technique, the application of images containing pictures with details, and back-face culling technique. The researcher noticed that the simulation ran slightly slower in the area where the stair was. This was perhaps caused by more polygons that were used for creating the stair. However, the participants seemed unaffected by this phenomenon. The VE model managed to create a controlled environment, which was built from very simple components, but still recognizable as corridors of an environment. The participants commented that they could identify the environmental components such as walls, different type of doors, windows, reception desk, filing cabinets, and the stair. Often times they utilized these simple components as landmarks to memorize and find certain places. The VE experiment was also able to replicate the procedural tasks carried out in Haq’s experiment. Two procedural adjustments were carried out. In the open exploration task, the participants were asked to explore the building and learn the layout of the building as best as possible so they would be ready to find particular destinations in the next task. This task took 15 minutes or until they felt that they had
62
understood the layout. In the real environment, numerous environmental variables were present throughout the building and caused the participants to give their attention to those variables in the time of the exploration task. However, because the extraneous environment variables in the VE were limited, the entire environment appeared identical, thus a number of participants in the pilot study expressed a degree of boredom and demonstrated a desire to complete the task earlier. In order to avoid the inclination to stop early, an adjustment was made where the participants were asked to explore the building and to pay attention to the four colored doors that were placed throughout the building. These doors were the destinations that were used for the next task. With this approach, the participants used the 15-minute time to learn the layout of the building or at least until they had seen the four colored doors. Another procedural adjustment was carried out for the purpose of collecting the data in the directed search task. In the real environment, the participants were required to face north at the front of a destination, as a start point and direction to find the next destination. In the VE, when the participant was facing north at a destination and ready to find the next destination, the simulation was stopped. Then, a new simulation was opened at the same place and facing the same direction. This procedure was necessary for the organization of data gathering. Informal observation indicated that this procedure did not seem to affect their performance or orientation. An informal observation also found that some participants required time to get used to the joystick and. They had to press the front button to move forward to go to the desired directions. The difficulty to work the joystick caused them to look down to make sure that the joystick was working properly. This prevented them from keeping a
63
continuous eye on the virtual world. This interruption could influence the degree of immersion.
64
CHAPTER V CONCLUSIONS
Virtual environment and wayfinding research are two areas that are emerging in the field of architecture. The literature revealed that a virtual environment could be a prospective tool for wayfinding research because of the ability to control the different variables of the environment and provide similar movement experience as the experiments in the real environment. The state of the current technology initiated a research question regarding whether or not VE is an appropriate tool for architectural wayfinding research. In order to respond to the research question, two research objectives were established: to determine the ability of building a VE setting for an architectural wayfinding study, and to examine the similarities of the results collected from earlier wayfinding studies of the same environment in a real environment to those collected in a VE. In this section, the results are summarized, the limitations of the study are reported, and a number of recommendations are suggested. Building a VE Setting for an Architectural Wayfinding Study The success of creating a VE setting for an architectural wayfinding study was broken down to the ability to replicate a real environment in a VE and the ability to conduct the similar wayfinding tasks as the ones that carried out in a real environment experiment.
Replicating a Real Environment in a VE The current study found that with the available technology, it is possible to create a VE and is able to replicate a controlled environment of a real hospital to meet
65
the purpose of a wayfinding experiment. The technology included the hardware, such as joystick, projector and projector screen, platform, and computer processor. These hardware devices were already “off the shelf” for gaming and media presentation purposes. The technology of the software included those that generated the VE content (i.e. 3D MAX5) and one that served as the VE editor (i.e. EON Reality 4). Because the software packages were Graphic User Interface (GUI) software, which do not require any significant programming skills to build the VE, this is particularly useful for architects who normally do not have programming knowledge. A number of techniques that could reduce the rendering time significantly such as polygon bound, applying texture-maps, and back-face culling, which were employed by Kessler (2002) and Ruddle et al. (1999), were also effective for creating a smooth running VE. The real hospital replicated in VE was the environment used in Haq’s (2001) wayfinding study. The environment of the corridors of the real hospital was controlled as much as possible to the building layout to meet the rationale of Haq’s study, which looked at the relationship of environmental understanding with building layout only and patterns of search. Any extraneous variables such as the presence of people, signage, and various lighting levels were omitted. The use of colors and materials on the building elements were limited. Based on informal observations of the participants’ movements in the VE environments and their comments, they demonstrated the ability to recognize the environmental elements such as walls, different type of doors, windows, reception desk, filing cabinets, and the stair. Thus, it could be concluded that the real hospital corridors could be replicated and controlled by creating only simple building elements in a VE.
66
Another informal observation found that some participants moved their head to observe the environment as what they would do when observing the real environment. This behavior indicated that the current VE offered some degree of immersion. The degree of immersion recognized in this experiment was considered as the level of engagement (Sherman & Craig, 2003). The level of engagement is where the participants are able to concentrate on their actions in the VE and feel to be somewhat a part of the VE even though they are still aware being in the real environment and could differentiate between the real and the virtual environment. However, the use of a joystick was found to be problematic in creating a degree of immersion. The participants were required to press the front button of the joystick in order to move forward. This condition was found to be tiring to the participants’ hand. A solution for not pressing the front button of the joystick will simplify the participants’ thought process in translating their hand movement in the joystick with their walking movement in VE. In addition, omitting the joystick’s button should go a long way towards reducing hand fatigue.
Conducting Similar Tasks as the Ones in a Real Environment Experiment In addition to the ability for replicating the real hospital in a VE, it was also designed to replicate the procedural tasks carried out in Haq’s experiment. An adjustment of the directed task in the VE experiment was done in order to obtain the required data for the measurements. This adjustment of opening a new simulation in the same place and orientation where the participants were before the previous simulation was closed did not seem to affect their performance. However, a reliable measurement is
67
needed to investigate the effect to the participants knowledge and orientation of the environment. The ability to create a VE for a wayfinding study was measured by the number of participants who were successful in completing the procedural tasks of the experiment. A ninety percent success of participants’ completion has demonstrated that a VE could be built for wayfinding research in architecture. The ten percent of the participants who could not complete the tasks were anticipated according to Stanney and Salvendy (1998), who had stated that a 5 to 30% dropout was expected in any area that uses VE. The ten percent dropouts were caused by experiencing severe discomfort such as headache and nausea. These symptoms are known as motion sickness. Motion sickness in VE, which is still being studied, can occur with a wide range of reasons, within individual’s susceptibility and VE systems (Stanney & Salvendy, 1998). For this study, narrow FOV was considered to play a role in creating motion sickness. Witmer and Kline (1998) reported that narrow FOV caused motion sickness because it intensified participant’s head movement. One interesting motion sickness’ occurrence in the experiment was that one participant reported more severe motion sickness when the surrounding was in complete darkness. Notions of lighting levels and intensities should be considered and used as additional information for any research area related in motion sickness in VE.
Similarities of the results from VE and in a real environment Consistent with Haq’s experiment, four measurements were used to examine the relationship of environmental understanding with building layout and patterns of search. Three out of the four measurements indicated similar patterns between the real
68
environment and the VE. These measurements were the average use of corridors, the average use of intersections, and wayfinding success. The greatest similarity found was the average use of corridors and intersections. Certain corridors and intersections that were used frequently by the participants in the real environment also showed use that is more frequent in the VE. This pattern was also visible when the corridors or intersections were use moderately or occasionally. The success of wayfinding task was also found to be similar between the VE and the real environment. However, it should be noted that the percentage of wayfinding success in the real environment included combinations of high percentages of success in certain destinations and moderate successes in others. While in the VE, the wayfinding success in every path destinations had a moderately high percentage rate.
Extranous Variables The similarities from these three measurements were accompanied by some differences. The differences found were possibly caused by extraneous variables in the real environment and the technological limitations in the VE. The extraneous variables identified from the real environment were signage, lighting levels, people’s presence, and views to the outside of the building. The analysis of the wayfinding success task demonstrated apparent influence of extraneous variables in the real environment, especially the important role of signage for the more successful destinations. When those variables were limited in the VE experiment, all four destinations had a similar result in wayfinding success. This supports Haq’s concern (2001) that the results of his experiment in the real environment were also affected by extraneous variables.
69
Technological Limitations The two major technological limitations identified were limited FOV and the difficulty for using the joystick. These limitations are in concordance with the limitations mentioned by de Kort et al (2003). Studying participants using a desktop display, Ruddle et al. (1999) had pointed out that the restricted FOV caused by frequent head movement and more likeliness to move past something without realizing it. An informal observation found the participants in the experiment also moved past certain corridors a number of times and that many of them required time to get used to the joystick. The difficulty in working with the joystick caused the participants to look down at it, making sure that it was working properly. This prevented the participants from looking at the screen. This additional effort might contribute to the differences in search patterns between the VE and the real environment. The pointing errors were the one out of the four measurements that demonstrated an apparent divergence. A significantly less error was demonstrated in the real environment experiment than in the VE. This result concurs with de Kort et al. (2003) study, where cognitive mapping task (i.e. size and height estimations) in the VE was worse than in the real environment. Possible reasons for the higher pointing error were VE display and control device. Witmer and Kline (1998) acknowledged the impact of narrow FOV in participants’ perceptual distortions. A participant perceives the narrow FOV as the full FOV. Thus, high pointing errors were likely to happen in the VE setting. de Kort et al. (2003) suggested that one cause for the poor result in cognitive task was the use of joystick, since it caused additional cognitive load. The difficulty with the joystick was apparent when the participants seemed to hesitate using the joystick to look around and gather information from the surrounding even though they were advised to
70
do so. Thus, in the pointing error task, the participants relied on their recollection of the current location in relation with their current understanding of the environment. The high errors in pointing in the VE was also caused by the participants’ slow development of the Euclidian relationship in the environment when the variable was constraint to only building layout (Haq, Hill, & Pramanik, 2005). An inclusive look at the findings demonstrated that the current VE technology was appropriate to particular wayfinding measurements, such as open exploration and directed search. Measuring cognitive mapping tasks such as pointing errors, estimating destinations, and estimating heights were still not appropriate to be carried out in the VE setting. Furthermore, the similarities found in the average use corridors and intersections indicated that in the open exploration task, these corridors and intersections as elements of building layout played an important role. The findings from the directed search indicated that apart from the presence of the extraneous variables in the real environment, i.e. when the environment was constrained to only building layout, the results of the average wayfinding success were similar. However, the slightly higher average of wayfinding success in the real environment and the different patterns between both environments indicated that, signage and the presence of people still played roles in the directed search. In summary, the two research objectives were met by revealing two promising findings: a real environment could be replicated in a VE for an architectural wayfinding study and most of the data collected in a VE demonstrated similar results with the ones in a real environment. The similarities of these measurements demonstrated that the participants’ behaviors and performance in the VE were comparable with the behaviors in the real environment. When individuals’ behavior in a VE is comparable with the one
71
in the real environment, then VE will be a useful tool for architectural wayfinding research (deKort et al., 2003). These findings indicated the relevance of a VE application as a technique to provide a controlled environment in wayfinding research. In addition, the results of this study could also be used to confirm the reliability of Haq’s study by demonstrating its repeatability.
Limitations and Future Studies Some limitations were noted and could be used as factors for establishing future studies. The experiment was conducted with students most of whom were majoring in architecture and interior design. The limited diversity of these participants raised an issue of the external validity of the study, which was the problem of generalizing the results. In addition, students with these particular majors might be expected to have better skills in understanding building layouts, even though such bias was not found in this study. Conducting additional experiments with different types of participants will confirm the results of this study. In the VE setting, limited environmental variables appeared to cause boredom to the participants and perhaps created the tendency to stop early in the open exploration task. An adjustment to the instruction for the open exploration task that was given to the participants was expected to avoid different levels of acquired knowledge between both environments. The adjustment, however, was at the cost of revealing the four destinations that would be used later for the next task. The four destinations were not revealed during the open exploration in Haq’s study. Even though in this task the participants were not asked to find any destination, the adjustment made to the VE experiment raised a question of whether or not this adjustment affected the outcome.
72
Different ways of presenting the environment, such as the use of shadow or the use of stereo projection system, which can create the sense of depth, might prevent the sense of flatness and boredom. In addition, presenting the four destinations with more nature colors or with smaller size of color at the doors might influence the similarities or dissimilarities of the measurements with the real environment. Based on an informal observation, VE technology used was found as one of the reasons for the differences in the results. A well-structured measurement, such as a formal observation, an interview, and/or a questionnaire, are needed to investigate which elements of the technology would affect participants’ performance and cause the dissimilarities with the experiment in the real environment. Such data was not collected in this study for three reasons: the objectives of the study did not require such a measurement, the researcher was not able to find or establish the appropriate measurement, and conducting such measurements would require more time for the participants to complete the experiment, which could cause fatigue Another limitation that continues to occur in the application of VE technology was the loss of participants because of motion sickness. Motion sickness in VE is continuously studied. The current experiment found one phenomenon where a participant reported a severe motion sickness when the surrounding area was completely dark. This finding can be beneficial for any research area related in motion sickness in VE. The two major technological limitations in this study were the limited FOV and the difficulty of joystick use. Previous studies have pointed out navigational problems when using a desktop display (Witmer & Kline, 1998 and Ruddle et al, 1999). Since a limited number of studies utilize projection displays, this study noted that problems
73
were found with the use of a 79-degree FOV projection screen display. Additional studies are needed to investigate the use of output interface with wider FOV. Previous studies (Witmer & Kline, 1998 and Ruddle et al, 1999) have noted a number of drawbacks for using a joystick, but still considered it appropriate for navigational tasks. In this study, the use of a joystick seemed to somewhat restrain the participants’ movement but was overall successful. Additional studies are also proposed to investigate the effectiveness of other input interfaces available for wayfinding study. A comparison study between participants’ previous experiences in these interfaces and their performances in the VE will inform later studies of any threats to their internal validity.
74
REFERENCES Abu-Ghazeh, T. M. (1996). Movement and wayfinding in the King Saud Univerity built environment: A look at freshmen orientation and environmental information, Journal of Environmental Psychology. 16, 303-318. Amaran, A. (2004). Interactive virtual architecture as a tool for online branding of e-stores. Unpublished Master Thesis, Texas Tech University, Lubbock. Arthur, P. & Passini, R. (1992). Wayfinding: People, signs, and architecture. New York: McGraw-Hill Book Company. Bertella, L., Marchi, S., & Riva, G. (2001). Virtual Environment for Topographical Orientation (VETO): Clinical rationale and technical characteristics. Presence, 10(4), 440-449. Bertol, D. (1997). Designing digital space. New York: John Wiley & Sons, Inc. Burdea, G. C., & Coiffiet, P. (2003). Virtual reality technology (2nd ed). Willey-IEEE Press. Cambridge University Press (2006). Cambridge advanced learner’s dictionary. Retrieved March 10, 2005, from http://dictionary.cambridge.org. Conroy, R. (2001). Spatial navigation in immersive virtual environments. Unpublished PhD Dissertation, University of London, London. Dalton, R. C. (2001). The secret is to follow your nose: Route path selection and angularity. Proceedings of the 3rd International Space Syntax Symposium Atlanta, GA, 47. Dogu, U., & Erkip, F. (2000). Spatial factors affecting wayfinding and orientation: A case study in shopping mall. Environment and Behavior, 32(6), 731-755. de Kort, Y. A. W., Ijsselsteijn, W. A., Kooijman, J., & Schuurmans, Y. (2003). Virtual laboratories: Comparability of real and virtual environments for environmental psychology. Presence, 12(4), 360-373. Dong, W., & Gibson, K. (1998). Digital graphics for architecture and interior visualization. Portland, OR: Book News, Inc. Fallon, K. K. (1998, December). Look for higher technology benefits. Architectural Record, 139-142. Garling, Y., Böök, A., & Lindberg, E. (1986). Spatial orientation and wayfinding in the designed environment: A conceptual analysis and some suggestions for postoccupancy evaluation. Journal of Architectural and Planning Research, 3(1), 5564.
75
Haq, S. (2001). Complex Architectural settings: An investigation of spatial and cognitive variables through wayfinding behavior. Unpublished PhD Dissertation, Georgia Institute of Technology, Atlanta. Haq, S., Hill, G., & Pramanik, A. (2005). Comparison of configurational wayfinding and cognition correlation in real and virtual settings. Proceedings of the 5th International Space Syntax Symposium Delft, The Netherlands, 387-405. Jansen-Osmann, P., & Wiedenbauer, G. (2004). The representation of landmarks and routes in children and adults: A study in a virtual environment. Journal of Environmental Psychology, 24, 347-357. Kessler, D. G. (2002). Virtual environment Models. In K. M. Stanney (Eds.) Handbook of virtual environments: Design, implementation, and applications (pp. 255-276). Mahwah, NJ: Lawrence Erlbaum Associates, Inc. Lindsey, P. F., & McLain-Kark, J. (1998). A comparison of real world and virtual world interior environments. Journal of Interior Design, 24(1), 27-39. Lynch, K. (1960). The image of the city. Cambridge, MA: Harvard University Press. McKenna, M., & Zelter, D. (1993). Three dimensional visual display systems for virtual environments. Presence, 1(4), 421-458. North, H. J., & Miller, R. J. (2002). A Comparison of Real World and Computer Animated Environments. Journal of Interior Design, 28(2), 26-36. O'Neil, M. J. (1991). Evaluation of a conceptual model of architectural legibility. Environment and Behavior, 23(3), 259-284. Passini, R. Pigot, H., Rainville, C., & Tetreault, M. (2000). Wayfinding in a nursing home for advanced dementia of the Alzheimer's type. Environment and Behavior, 32(5), 684-710. Peponis, J., Zimring, C., & Choi, Y. K. (1990). Finding the building in wayfinding. Environment and Behavior, 22(5), 555-590. Péruch, P., Gaunet, F., Thinus-Blanc, C., & Loomis, J. (2000). Understanding and learning virtual spaces. In R. Kitchin & S. Freundschuh (Eds.), Cognitive mapping: Past, present, and future (pp. 108-124). New York: Routledge. Pinet, C. (1997). Design evaluation based on virtual representation of spaces. ACADIA 1997. Association of Computer Aided Design in Architecture: 111-120. Riecke, B. E., van Veen, H. A. H. C., & Bülthoff, H. H. (2002). Visual homing is possible without landmarks: A path integration study in virtual reality. Presence, 11(5), 443-473.
76
Rohrmann, B., & Bishop, I. (2002). Subjective responses to computer simulations of urban environments. Journal of Environmental Psychology, 22, 319-331. Ruddle, R. A., Payne, S. J., & Jones, D. M. (1999). Navigating large-scale virtual environments: What differences occur between helmet-mounted and desk-top displays? Presence, 8(2), 157-168. Satalich, G. A. (n.d.). Navigation and wayfinding in virtual reality: Finding proper tools and cues to enhance navigation awareness. Retrieved March 9, 2005, from http://www.hitl.washington.edu/publications/satalich/ch.1.html Sherman, W. R., & Craig, A. B. (2003). Understanding virtual reality: Interface, application, and design. San Francisco, CA: Morgan Kaufmann Publishers. Shim, W., & Kim, G. J. (2003). Designing for presence and performance: The case of the virtual fish tank. Presence, 12(4), 374-386. Slater, M., Linakis, V., Usoh, M., & Kooper, R. (n.d.). Immersion, presence, and performance in virtual environments: An experiment using tri-dimensional chess. Retrieved April 21, 2005, from http://www.cs.ucl.ac.uk/staff/m.slater/Papers/Chess/ Stanney, K., & Salvendy, G. (1998). Aftereffects and sense of presence in virtual environments: Formulation of research and development agenda. International Journal of Human-Computer Interaction. 10(2), 135-187. Stanney, K. M., & Zyda, M. (2002). Virtual Environments in the 21st century. (Ed.), Handbook of Virtual Environment: Design, Implementation, and Applications, 1-14. The Board of Trustees of the University of Illinois. (1995, October). Virtual reality: History. Retrieved February 22, 2005, from http://archive.ncsa.uiuc.edu/Cyberia/VETopLevels/VR.History.html. The Free Dictionary.com. (2004, October 12). Retrieved October 23, 2004 from http://encyclopedia.thefreedictionary.com/Virtual+environment. Tlauka, M., & Wilson, P. N. (1996). Orientation-free representations from navigation trhough a computer-simulated environment. Environment and Behavior, 2(5), 647664. Waller, D., Beall, A. C., & Loomis, J. M. (2004). Using virtual environments to assess directional knowledge. Journal of Environmental Psychology, 24, 105-116. Weisman, G. (1981). Evaluating architectural legibility: Way-finding in the built environment. Environment and Behavior, 12(2), 189-204. Wikipedia The Free encyclopedia (n.d.). Retrieved August 5, 2005 from http://en.wikipedia.org/wiki/Proprioception.
77
Witmer, B. G., & Kline, P. B. (1998). Judging perceived and traversed distance in virtual environments. Presence, 2(2), 144-167. Wolff, R., Roberts, D. J., & Otto, O. (2004). Collaboration around shared objects in innersive virtual environments. Eighth IEEE International Symposium on Distributed Simulation and Real Time Applications: 206-209. Werner, S., & Schindler, L. (2004). The role of spatial reference frames in architecture: Misalignment impairs way-finding performance. Environment and Behavior, 36(4), 461-482.
78
PERMISSION TO COPY
In presenting this thesis in partial fulfillment of the requirements for a master’s degree at Texas Tech University or Texas Tech University Health Sciences Center, I agree that the Library and my major department shall make it freely available for research purposes. Permission to copy this thesis for scholarly purposes may be granted by the Director of the Library or my major professor. It is understood that any copying or publication of this thesis for financial gain shall not be allowed without my further written permission and that any user may be liable for copyright infringement.
Agree (Permission is granted.)
Adetania Pramanik Student Signature
4/26/2006 Date
Disagree (Permission is not granted.)
_______________________________________________ Student Signature
_________________ Date