Ondrej Zizlavsky
ISSN 2071-789X 41 RECENT ISSUES IN ECONOMIC DEVELOPMENT
Zizlavsky, O. (2016), The Use of Financial and Nonfinancial Measures within Innovation Management Control: Experience and Research, Economics and Sociology, Vol. 9, No 4, pp. 41-65. DOI: 10.14254/2071-789X.2016/9-4/3
THE USE OF FINANCIAL AND NONFINANCIAL MEASURES WITHIN INNOVATION MANAGEMENT CONTROL: EXPERIENCE AND RESEARCH
Ondrej Zizlavsky, Brno University of Technology, Brno, Czech Republic, E-mail:
[email protected]
ABSTRACT. The paper deals with the issue of innovation performance measurement and management control and takes as its starting point the current state of affairs and specific conditions arising from today’s business environment. Based on the findings from longterm empirical research carried out under the auspices of the Faculty of Business and Management, Brno University of Technology and Czech Scientific Foundation it provides an overview of the issues related to innovation performance measurement and management control. On the basis of desk-based research and empirical studies, a management control system approach to innovation performance measurement suitable for Czech business environment called the Innovation Scorecard is being proposed.
Received: March, 2016 1st Revision: June, 2016 Accepted: October, 2016
DOI: 10.14254/2071789X.2016/9-4/3
JEL Classification: C18, D22, M21, O32, P47
Keywords: financial measures, nonfinancial measures, management control, innovation scorecard.
Introduction – Why to Measure? Innovation contributes to the winning of competitive advantages (Kozubikova & Zoubkova, 2016; Lahovnik & Breznik, 2014). Substantial evidence exists that innovation process and resulting innovation outputs are the important determinants of company performance, indicating that innovators outperform non-innovating companies (Baldwin & Gellatly, 2003; Calabrese et al., 2013; Gronum et al., 2012; Guo et al., 2005; Klomp & van Leeuwen, 2001; Li & Atuahene-Gima, 2001; Mansury & Love, 2008; Pittaway et al., 2004; Rosenbusch et al., 2011; van Wijk et al., 2008; Zhou, 2006). Innovations are not separate activities in the company, but they proceed in the form of processes that encourage change and have to be successfully terminated (Cooper, 1998; Greve, 2003; Tidd et al., 2005). Successful innovations are the result of management, marketing, scientific, technological, organisational, financial, business and other types of activity. Market participants act together with employees, technologies and environmental influences, all of them being dynamic and relatively independent. For business success company’s management has to regularly evaluate the performance of their innovations. This evaluation must be carried out comprehensively. In each phase of the innovation process (see Figure 1) the question must be asked as to whether
Economics & Sociology, Vol. 9, No 4, 2016
Ondrej Zizlavsky
ISSSN 2071-789X X 42 N ECONOM MIC DEVELO OPMENT RECENT ISSUES IN
it makes sense to continue c wiith the task and not jusst from a technical perrspective bu ut also in marketing terms. It I is essentiial to ascerttain whetheer the set of o technical parameterss can be achieved and whethher innovattion has anyy prospects of success at some maarket. In addition, it is necesssary to anaalyse deviatiions from thhe expected d costs, term m changes annd their cau uses, and to assign responsibbility for wh hat has caussed them. The aim is to o learn how w to better co ope with the innoovation proocess and th hus build kknowledge upon u experrience gaineed. If the company c does noot use this approach, a th hen there i s a risk thaat it will repeat the sam ame mistakees in the future.
Figure 11. Innovatioon process T Therefore, the t cognitiv ve aim of thhis study is to present knowledge and finding gs in the field off innovationn performan nce and man anagement control c as these areas are currenttly being dealt w with in Czeech as welll as foreiggn expert literature l and in the practice of Czech manufaccturing inddustry. Therre are manny indicatorrs for assesssing comppany’s success in a wider seense but if we w refer to innovations i s it can be difficult d to ch hoose the riight ones. T Then, the creative c aim m is to contrribute to thee study of innovation m managemen nt with a proposaal of a coonceptual performance p e measurem ment and managemeent framew work for innovatiion processses suitablee for Czecch business environmeent. The frramework is i based specificcally on prroject manaagement, thhe input‒prrocess‒outp put‒outcom mes model (Brown, 1996), the Stage Gate appro oach (Coopper, 1998) and the Baalanced Scoorecard (Kaplan & Norton, 1996). T The study begins b with theory and definition of the essen ntial terms. The theorettical part is folloowed by ann empirical analysis iinvestigatin ng the curreent state oof affaird in n Czech manufaccturing. Onn the basis of desk-bbased researrch and em mpirical stuudy, a man nagement control system appproach to inn novation peerformance measuremeent suitable for Czech business environnment calledd the Innovaation Scoreccard is prop posed in the discussion section. T The researcch presented d in this studdy is valuab ble for several reasons.. Firstly, it is i one of the few w compreheensive stud dies to adddress the qu uestion of what methhods of inn novation perform mance measuurement aree implemennted in inno ovative Czeech manufaacturing com mpanies. Secondlly, the reseearch takes into accouunt the speecifics of th he investigaated issue, such as measureement in sooft systems, the core miicrolevel off measurement, and thee specifics of o Czech businesss environm ment after th he financial crisis. Thirrdly, only a few recentt studies pro ovide an attempt to develop a Balanced d Scorecard framework k for innovaations. Garciia Valderram ma et al.
Economics Ec & SSociology, Vol. Vo 9, No 4, 20016
Ondrej Zizlavsky
ISSN 2071-789X 43 RECENT ISSUES IN ECONOMIC DEVELOPMENT
(2008a) developed a general Balanced Scorecard model limited to innovations, and both GarciaValderrama et al. (2008b) and Eilat et al. (2008) also proposed an integrated data envelopment analysis and Balanced Scorecard approach to evaluating innovation projects. The paper has the following unique outcomes: • Key insights and tools derived from the latest academic research, consulting companies’ publications and practitioners’ experience. • Key results on how Czech companies measure and control the performance of their innovation processes. • A discussion about the current situation and possible development trends in innovation performance measurement and management control. • A road map to developing a management control system called Innovation Scorecard. 1. Literature Review The significance of innovation was highlighted as early as the beginning of the 20th century by Schumpeter (1912). His concept of innovation became the basis for numerous studies and modern concepts in the sphere of innovation (e.g. Drucker, 1985; OECD, 2005; Porter, 1990; Rothwell, 1992; Valenta, 1969). Innovation is in this study understood in line with the Oslo Manual (OECD, 2005), which is the foremost international source of guidelines for the collection and use of data on innovation activities in industry (Gault, 2013). The Oslo Manual defines four types of innovation that encompass a wide range of changes in companies’ activities: (i) product innovations, (ii) process innovations, (iii) organisational innovations and (iv) marketing innovations. Thus innovation is the culmination of a whole series of scientific, research, technical, organisational, financial and commercial activities that collectively constitute the innovation process (Vlcek, 2002). Measuring efficiency and contribution to value of innovation has become a fundamental concern for managers and executives in the last decades. Many studies have been written aimed at discussing the issue and suggesting possible approaches to the performance measurement, innovation and R&D management literature (e.g. Bassani et al., 2010; Chiesa & Frattini, 2009; Merschmann & Thonemann, 2011; Wingate, 2015). Despite this there are no uniform guidelines in the professional literature for measuring the performance of innovations. Every innovation is unique, specific, and intended to bring competitive advantage and company growth (Bonner et al., 2001). Therefore, how to measure innovation? What kind of metrics to choose? Empirical studies give various approaches to use: • A number of implemented innovation (e.g. Garcia & Calantone, 2002; Danneels & Kleinschmidt, 2001). • Bibliometric indicators (e.g. Thomas & McMillan, 2001; Verbeek et al., 2002). • Technometric patent data (e.g. Acs et al., 2002; Chiesa & Frattini, 2009). • R&D expenditure (e.g. Brouwer & Kleinknecht, 1996; Doukas & Switzer, 1992; OECD, 2009; Zizlavsky & Karas, 2014). • Economic metrics (e.g. Chiesa & Frattini, 2009; Cooper et al., 2004; Hauschildt & Salomo, 2007; Ryan & Ryan, 2002; Thomaschewski & Tarlatt, 2010). Unlike most of the previous studies on innovation, in this study we not only measure innovation through R&D expenditure, patents or implemented innovations. There are several well known limitations for these measurement (Brouwer & Kleinknecht, 1996; Griliches, 1990; Patel & Pavitt, 1995). The importance of other dimensions of innovation, such as managerial or organisational change, investment in design or skills and management of the innovation process itself is increasingly acknowledged (OECD, 2009). Therefore the paper
Economics & Sociology, Vol. 9, No 4, 2016
Ondrej Zizlavsky
ISSN 2071-789X 44 RECENT ISSUES IN ECONOMIC DEVELOPMENT
deals with economic indicators. For clarity they are divided into financial and nonfinancial indicators. Financial indicators are indispensable for assessing business performance. Just they can inform the managers about the company’s capability of creating value and allow them to check whether any employed measures contributed to the creation of value. Methods for economic analysis are currently the most diffused methods for evaluation of innovation projects (Ryan & Ryan, 2002). Although the existing methods largely differ in their implementation, they all share a common principle, that is, the capital budgeting approach for calculating the economic return of a project as a sequence of discounted cash flows (Chiesa & Frattini, 2009). Other popular performance innovation metrics in industry are the percentage of revenues from new products, percentage of growth in new products, and overall profits generated by new products (Cooper et al., 2004). However, assessing the results of innovations only in terms of its economic benefits may not be the most advantageous way. The development and improvement of measurement systems therefore took the path of supplementing financial indicators with many other non financial indicators used by companies seeking to measure and evaluate the development of basic success factors in their respective strategic areas (Ittner & Larcker, 1998; Kaplan & Norton, 1996; Neuman et al., 2008; Vaivio, 1999). It was clear that traditional systems of measuring performance could not succeed in the changing conditions of global business (Johnson & Kaplan, 1987). Then, many authors have concluded that, due to the complexity of the concept to be measured (i.e. innovation processes), multiple integrated measurements of output need to be utilised (Tipping et al., 1995; Utunen, 2003; Werner & Souder, 1997) in order to obtain both a quantitative and qualitative measurement and, in the meantime, more information on the effectiveness of the innovations measured (Werner & Souder, 1997). Therefore the concept of performance measurement used in this study – Innovation Scorecard – refers to the use of a multi dimensional set of performance measures for the planning and management of a business and follows principles of performance measurement system design (see Table 1). Table 1. Principles for performance measurement system design Globerson (1985) Performance criteria must be chosen from the company’s goals. Performance criteria must make possible the comparison of companies that are in the same business. The purpose of each performance criterion must be clear. Data collection and methods of calculating the performance criterion must be clearly defined. Ratio based performance criteria are preferred to absolute numbers. Performance criteria should be under the control of the
Maskell (1991) The measures should be directly related to the company’s manufacturing strategy. Nonfinancial measures should be adopted. It should be recognised that measures vary between locations – one measure is not suitable for all departments or sites. It should be acknowledged that measures change as circumstances do. The measures should be simple and easy to use. The measures should provide fast feedback. The measures should be designed so that they
Bourne et al. (2003) Performance measurement refers to the use of a multidimensional set of performance measures. Performance measurement should include both financial and non-financial measures, internal and external measures of performance and often both measures which quantify what has been achieved as well as measures which are used to help predict the future. Performance measurement cannot be done in isolation. Performance measurement is only relevant within a reference framework against which the efficiency and effectiveness of action can be judged. Performance measures should be developed from strategy. Performance measurement has an
Economics & Sociology, Vol. 9, No 4, 2016
Ondrej Zizlavsky
ISSN 2071-789X 45 RECENT ISSUES IN ECONOMIC DEVELOPMENT
stimulate continuous evaluated organisational improvement rather than unit. Performance criteria should simply monitor. be selected through discussions with the people involved (customers, employees, managers, etc.). Objective performance criteria are preferable to subjective ones.
impact on the environment in which it operates. Starting to measure, deciding what to measure, how to measure and what the targets will be, are all acts which influence individuals and groups within the company. Once measurement has started, the performance review will have consequences, as will the actions agreed upon as a result of that review. Performance measurement is being used to assess the impact of actions on the stakeholders of the company whose performance is being measured.
2. Methodology The research framework is based on four primary research projects carried out in Czech innovative companies under the auspices of the Faculty of Business and Management of Brno University of Technology and one comprehensive research project supported by the Czech Science Foundation. A total of 53 mostly production companies participated in the first project called Research into the Level of Development of Innovation Potential, Creation and Evaluation of the Innovation Strategy of Medium-Sized and Large Machine-Industry Companies in the South Moravian Region in the Czech Republic (Reg. No. AD 179001M5) conducted in 2009. This project uncovered several unfavourable findings on the state of management of innovative activities. Therefore this area was examined in detail in three subsequent research projects called Development of Knowledge for Improvement of Information Support of the Economic Management of Company Development in Accordance with Development of the Business Environment (Reg. No. FPS10-17) undertaken in 2010, Development of Knowledge for Improvement of Information Support of the Economic Management of a Company (Reg. No. FP-S-11-1) in 2011 and Efficient Management of Companies with Regard to Development in Global Markets (Reg. No. FP-S-12-1) in 2012. These projects became the bases for in-depth research carried out in 2013-2015 within the Czech Scientific Foundation post-doc research project Innovation Process Performance Assessment: a Management Control System Approach in Czech Small and Medium-sized Enterprises (Reg. No. 13-20123P) in the field of innovation performance measurement and management control. The fundamental unit of research interest is the company. This study presents a shift from a macroeconomic level of exploration to the sector and especially the level of the individual business. This level of investigation requires in particular the application of qualitatively based methodological procedures and allows a deeper understanding of the analysed phenomena. The concept of the innovation performance solutions in this study depends on the following premises: • The company is the source of innovation. • Innovation performance, that is the ability to carry out the desired innovation, can be seen as one of the most significant factors in the competitiveness and efficiency of a company.
Economics & Sociology, Vol. 9, No 4, 2016
Ondrej Zizlavsky
ISSN 2071-789X 46 RECENT ISSUES IN ECONOMIC DEVELOPMENT
•
Innovations are, in the context of the subject of the research, in the economic/organisational (not technical) category. • Innovative outputs from companies cannot be restricted to the innovation of products, as steadily greater significance is being ascribed to the remaining types of innovation (according to the Oslo Manual (OECD, 2005)) and that is true even in companies of a production character. • Innovation is not just a matter of the company’s outputs but also changes in the sources of the internal environment of the concern and relations between these and changes in relationships with relevant entities in the external environment. • The condition for innovative outputs (products and services) is comprehensive innovation, which represents a purposeful chain of all the mentioned changes in the internal and external environments of the company. Research work relies mainly on a systemic approach, which is normally applied for its ability to consider the situation in the context of external and internal circumstances. It employs a combination of different methods and techniques from various scientific disciplines ‒ triangulation. In this study two types of triangulation are taken into account: • Data ‒ the use of varied data sources: (i) information made available publicly; (ii) information from questionnaire surveys; (iii) information from interviews. • Methodological ‒ the use of a combination of data gained with the aid of questionnaires, analysis of available materials and semi-structured interviews. Analysis is used as a method for obtaining new information and its interpretation. When processing secondary data, the method of secondary analysis was utilised. A source of secondary data was the professional literature, especially foreign – books, journals and articles from scientific and professional databases (Web of Science, Scopus, Emerald, EBSCO, DOAJ etc.) with respect to their professional level and relevance. The theoretical background for the solving of the issues in question is made up not only of innovation management but also financial management, performance measurement and management control. The methodological background and to a certain extent also the framework is made up of standard methods for the evaluation of the business environment, innovation performance and the quality of sources. A questionnaire-based survey was implemented to gather information and determine the real state of solved issues of performance measurement and management control of innovations in Czech companies. It was decided to carry out the research via a random selection of various-sized innovative companies from manufacturing industry in the Czech Republic. This choice is related to the fact that managerial tools primarily originated and subsequently developed in manufacturing companies. The second feature was the fact that manufacturing industry is considered the most significant industry for the development of the Czech economy since it is the largest sector. This allows a sufficient number of companies to be contacted to participate in the study. It is estimated that the target population consists of over 11,000 manufacturing companies. Synthesis is primarily used to announce the results, formulate conclusions, and produce a methodological proposal for the management control of innovation process performance. Induction is utilised especially when generalizing all the findings achieved in the questionnaire survey, and it is also applied when general principles are defined for the methodological proposal for the assessment of innovation process performance based on specific data from individual companies. Verification of dependencies found was verified by the application of deduction. The feedback method allows a reconsideration of every step in research to make sure the research does not deviate from its original aim and its starting points. Statistical methods
Economics & Sociology, Vol. 9, No 4, 2016
Ondrej Zizlavsky
ISSN 2071-789X 47 RECENT ISSUES IN ECONOMIC DEVELOPMENT
are utilised when analysing primary data and their results are presented in tables and charts in following section. 3. Research Results Companies for surveys were selected from the databases Technological Profile of the Czech Republic, Kompass and Amadeus database provided to the company Bureau Van Dijk. The real return rates can be considered as very good because return rates of mail-back questionnaires are usually less than 10%. The detailed statistics of the questionnaire inquiries are shown in Table 2. Table 2. Overall statistics of the questionnaire surveys Research 2009 Target population Research sample Number of addressed companies a) By e-mail b) By personal visit Number of undelivered emails Number of partially filled questionnaires Number of completely filled questionnaires Real return
Research 2010
Research 2011
Research 20132015
Manufacturing enterprises in the Czech Republic Innovative manufacturing enterprises in the Czech Republic 250 230 30
800 750 50
650 650 0
2,877 2,807 70
13
35
27
98
4
9
13
153
53
139
212
354
21.2%
17.4%
34.1%
12.30%
Source: Own research. As stated in beginning of this study, the need of management control system is crucial in innovations. Therefore, a key area of surveys were the questions of evaluation for innovative projects – whether and how it is decided the innovation is viable. When asked whether the companies had evaluated the implemented innovative projects, the vast majority answered affirmatively in all period under consideration, 79%, 64% and 79% of respondents, respectively (see Figure 2). Besides what is disquieting is the fact that this area is neglected by ca one third of the respondents even though innovations are implemented by them.
Economics & Sociology, Vol. 9, No 4, 2016
Ondrej Zizlavsky
ISSN 2071-789X 48 RECENT ISSUES IN ECONOMIC DEVELOPMENT
100% 90% 80% 70% 60% 50% 40% 30% 20% 10% 0%
4%
8%
14%
17%
13% 22%
32% 51% 40% 47%
Research 2009 (n=53) Yes (1)
24%
28%
Research 2010 (n=139)
Research 2013-2015 (n=354)
Rather yes (2)
Rather no (3)
No (4)
Figure 2. Evaluation of innovative projects Source: Research 2009, 2010, 2013-2015. Here, the initial presumption that companies vary in innovation project evaluation depending on their size is going to be tested by Kruskal-Wallis test for each research project (see Table 3). For this purpose, following hypotheses are set. Null hypothesis: Level of innovative activity evaluation is equal for all categories of company size. Alternative hypothesis: Level of innovative activity evaluation is not equal for all categories of company size. Table 3. Results of Kruskal-Wallis test Research 2009 (n=53) Size Micro (1) Small (2) N 7 11 Median 3.000 2.000 Ave Rank 39.2 33.5 Z 2.25 1.57 H = 10.12 DF = 3 P = 0.018 H = 11.81 DF = 3 P = 0.008 (adjusted for ties) Research 2010 (n=139) Size Micro (1) Small (2) N 27 32 Median 3.000 2.000 Ave Rank 88.7 76.9 Z 2.69 1.11 H = 11.97 DF = 3 P = 0.007 H = 13.15 DF = 3 P = 0.004 (adjusted for ties) Research 2013-2015 (n=354) Size Micro (1) Small (2) N 26 101 Median 2.000 2.000 Ave Rank 210.8 179.9 Z 1.72 0.28 H = 4.81 DF = 3 P = 0.186 H = 5.71 DF = 3 P = 0.127 (adjusted for ties)
Medium (3) 16 1.500 25.1 -0.58
Large (4) 19 1.000 20.3 -2.36
Overall 53
Medium (3) 40 2.000 65.6 -0.81
Large (4) 40 2.000 56.2 -2.57
Overall 139
Medium (3) 158 2.000 178.1 0.10
Large (4) 69 2.000 160.1 -1.58
Overall 354
Economics & Sociology, Vol. 9, No 4, 2016
27
70.0
177.5
Ondrej Zizlavsky
ISSN 2071-789X 49 RECENT ISSUES IN ECONOMIC DEVELOPMENT
Research 2009: The test statistic (H) has a p-value of 0.018 unadjusted, resp. 0.008 adjusted for ties, indicating that the null hypothesis can be rejected at 0.05 levels higher than 0.018, resp. 0.008 in favour of the alternative hypothesis of at least one difference among the treatment groups of company size. Research 2010: Analogously as Research 2009, the test statistic (H) has a p-value of 0.007 unadjusted, resp. 0.004 adjusted for ties, indicating that the null hypothesis can be rejected at 0.05 levels higher than 0.007, resp. 0.004 in favour of the alternative hypothesis of at least one difference among the treatment groups of company size. Research 2013-2015: Data and results of Kruskal-Wallis did not confirm alternative hypothesis, i.e. it has not been proved that level of innovative activity evaluation is not equal for all categories of company size. However, this result contradict previous result as well as general knowledge and experience in management control. Therefore, gained data are modified and Spearman's rank correlation is calculated (see Table 4). Table 4. Calculated Spearman's correlation coefficient Category2009 & Size2009 Category2010 & Size2010 Category2015 & Size2015
No. 53 139 354
Spearman R -0,465196 -0,306548 -0,105305
t(N-2) -3,75297 -3,76954 -1,98674
P-Value 0,000449 0,000242 0,047726
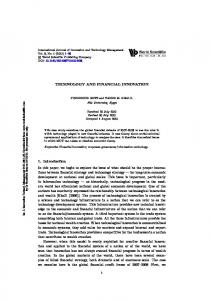
Here, it has been proved that there exists significant relationship between size of the company and innovative activities evaluation at a 5% significance level. In other words, the larger company is the innovative activity evaluation is performed. In 2010 for businesses which responded affirmatively (n=89) to the above question, the method of evaluating the innovative activities has been examined. The results are shown in the diagram below (see Figure 3). The prevailing approach is the monitoring of financial indicators or, more precisely, the monitoring of costs with respect to operating profit and the fulfilment of turnover based on the sales plan. Other data and indicators have not been essential for the surveyed enterprises. In 23% of respondents, the objectives and strategies of innovative activities are transformed into a comprehensive system of measurable financial and nonfinancial indicators. Although it should be noted that after overcoming the barriers and reluctance of the managers to communicate more detailed information about their systems of innovation evaluation, these systems proved not to be very appropriate, while being biased in favour of financial indicators.
Economics & Sociology, Vol. 9, No 4, 2016
Ondrej Zizlavsky
ISSSN 2071-789X X 50 N ECONOM MIC DEVELO OPMENT RECENT ISSUES IN
4% 23% 31%
42% C Complex system m of metrics
Cost and operating profiit metrics
R Revenue plan
Other
Figure 33. Ways of innovation i evaluation ((n=89) Source: Research 2010. 2 T Therefore, within w reseaarch surveyy 2013-2015 5 the period d since wheen has the company c implem mented innovvation manaagement conntrol system m (MCS) was w examineed (281 resp pondents in total)). Table 5. Period of innovation i MCS impleementation (n=281) ( Categoryy (Numberr of employeees) Less thann 5 years From 5 tto 10 years From 11 to 15 years More thaan 15 years Total
Micro (1-9) 12 57.14 7 33.33 2 9.52 0 0.00 21 100.00
No. % No. % No. % No. % No. %
Small (10-49) 29 35.80 33 40.74 14 17.28 5 6.17 81 100.00
Medium m (50-249) 25 20.00 0 56 44.80 0 36 28.80 0 8 6.40 125 100.00 0
Lar arge (>2250) 8 14 .81 225 46 .30 115 27 .78 6 11 .11 554 1000.00
Total 74 26.33 121 43.06 67 23.84 19 6.76 281 100.00 1
2 Source: Research 2013-2015. A Another innitial presum mption Larrge compan nies have implementeed their inn novation manageement contrrol system for fo a longer time than SMEs S is going to be teested. Indep pendence statistical testing of two qu ualitative chharacters iss carried out o for stattistical dep pendency verificaation. The nuull hypothesis is goingg to be tested d that rando om values aare not depeendent in compariison with thhe alternativ ve hypothes is. N Null hypothhesis: Size of the comp mpany and longer l period of innovvation management control system implementation n are not re lated to eacch other. A Alternative hypothesiss: Size off the comp pany and longer perriod of inn novation manageement controol system im mplementatiion are rela ated to each other.
Economics Ec & SSociology, Vol. Vo 9, No 4, 20016
Ondrej Zizlavsky
ISSN 2071-789X 51 RECENT ISSUES IN ECONOMIC DEVELOPMENT
Table 6. Relation research of period of MCS implementation and size of the company (n=281) Period of MCS implementation/Size of company SMEs Less than 5 years 66 From 5 to 10 years 96 From 11 to 15 years 52 More than 15 years 13 nj 227 Calculated test criterion: Chi-Sq = 5.835; DF = 3; P-Value = 0.120
Large 8 25 15 6 54
ni 74 121 67 19 281
Source: Research 2013-2015. For a selected significance level α = 0.05 a quantile chi-sq (3) is determined = 7.815. Because the value of test criterion was not realized in the critical field (5.835 < 7.815 and pvalue = 0.120) the alternative hypothesis is rejected on five percentage level signification and null hypothesis is accepted. In other words, companies evaluate innovation processes no matter what the period of MCS implementation. Then, the relevant reasons for innovation MCS implementation and their importance were surveyed for the same group of respondents. Moreover, they evaluated the importance of these reasons. The measurement instrument used in the questionnaire to estimate the importance of reasons for innovation MCS implementation was evaluated a five- item Likert scale: 1 – very important, 2 – important, 3 – neutral, 4 – not important, 5 – completely unimportant. In the summary of the percentage ratio of positive answers, i.e. values 1 (very important) and 2 (important), the order of individual possibilities was determined (see Table 7). Table 7. Reasons for innovation MCS implementation (n=281)
Motivation and remuneration Business strategy planning Reduction of wasting resources Idea improvement Communication Legitimacy to innovation Stakeholders relationship
4 not important
5 unimportant
1 very important
2 important
No.
%
No.
%
No.
%
No.
%
No.
%
99
35
117
42
48
17
10
4
7
2
0.9840
123
44
82
29
45
16
23
8
8
3
0.9819
126
45
77
27
38
14
26
9
14
5
0.9826
91
32
104
37
43
15
28
10
15
5
0.9814
101
36
75
27
56
20
33
12
16
6
0.9813
74
26
88
31
52
19
44
16
23
8
0.9865
58
21
74
26
87
31
32
11
30
11
0.9823
3 neutral
Cronbach's Alpha
Source: Research 2013-2015. Respondents gave following most important reasons for innovation MCS: motivation and remuneration, business strategy planning, reduction of wasting resources, idea
Economics & Sociology, Vol. 9, No 4, 2016
Ondrej Zizlavsky
ISSN 2071-789X 52 RECENT ISSUES IN ECONOMIC DEVELOPMENT
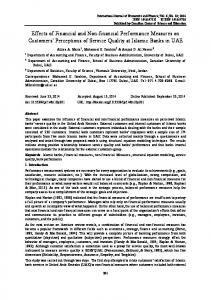
improvement and communication, respectively. Cronbach’s alpha coefficient for each construct is above 0.98, and for all seven factors it equals to 0.9853. This means strong internal consistency and good reliability of scale. In addition, respondents were asked to indicate their use of the evaluation techniques they use within innovative activities to provide the information for decision-making and control. The questionnaire focused on the 16 core project level evaluation metrics (financial and nonfinancial) of innovation performance. This set of metrics was formed after the literature review of the most frequently innovation management control tools (Carenzo & Turolla, 2010; Cokins, 2009; Davila et al., 2013; Niven, 2005; Skarzynski & Gibson, 2008; Tzokas et al., 2004).
Patents Customer satisfaction indicators Number of new customers EBITDA, EBIT Revenues from innovation Budget Budget
Revenues Number of from EBITDA, EBIT new innovation customers 59,19% 28,16% 34,33%
Customer satisfaction indicators 23,45%
Patents
Micro (1-9)
67,45%
Small (10-49)
72,46%
74,28%
30,45%
32,73%
17,33%
10,47%
Medium (50-249)
84,27%
83,45%
36,19%
47,20%
22,50%
28,49%
Large (>250)
100,00%
100,00%
34,85%
52,48%
26,67%
36,96%
7,81%
Figure 4. Top 3 innovation evaluation methods from financial and nonfinancial tools (n=281) Source: Research 2013-2015. Here again in 2013-2015 results showed that in Czech economics most managers still use mainly financial indicators to assess innovation performance and its components (see Figure 4). Budget, revenues from innovation and EBITDA are the most frequently applied indicators. Since we are studying the Czech manufacturing business environment, i.e. for profit sector, innovation evaluation must always be based on a group of logically interrelated financial indicators. On the other hand, the majority of managers in Czech manufacturing companies also feel that non financial indicators should be used to monitor the undertaken innovative efforts and projects. The managers should rely more on non financial indicators than on the financial ones because these indicators provide a better assessment of progress in real time and of the probability of success. Thus the use of complex innovation indicators is the best option. Among all the performance measurement systems, e.g. Performance Measurement Matrix (Keegan et al., 1989), the Performance Pyramid (McNair et al., 1990), the Integrated Performance Measurement Systems (Bititci et al., 1997), the Performance Prism (Neely & Adams, 2001), Data Envelope Analysis (Charnes et al., 1978), Quantum Performance Measurement (Hronec, 1993), EFQM Excellence Model (European Foundation for Quality Management, 1999), the Tableau de Bord (Lebas, 1994) or Productivity Measurement and
Economics & Sociology, Vol. 9, No 4, 2016
Ondrej Zizlavsky
ISSSN 2071-789X X 53 N ECONOM MIC DEVELO OPMENT RECENT ISSUES IN
Enhanceement System (Pritchaard, 2008), the Balanced Scorecard seems m most approp priate for introduccing a compplex system m of measuuring innovaation perforrmance for an entire company c (e.g. Brremser & Barsky, B 2004 4; Donovann et al., 199 98; Horvath h & Partnerrs, 2016; Kaplan K & Norton, 1996; Kapplan & Norton, 2001; K Kerssens-vaan Drongelen & Cook, 1997; Li & Dalton, 2003; N Niven, 2005; Niven 201 14; Pearson et al., 2000 0). N Nonethelesss the introdu uction of a comprehensive Balancced Scorecar ard system, although a its philoosophy is siimple and logical, is tooo challeng ging for mosst Czech buusinesses – in terms of timee, organisaation, and finance. T The empiriccal evidencce from 22013-2015 research demonsstrates the low l adoptio on rate of tthe Balanceed Scorecarrd. A gap bbetween micro and small coompanies annd medium m and large ccompanies was found. In the firstt two group ps (micro and smaall companiies) Balanceed Scorecarrd is implem mented only y in minoritty group. Less L than 3% of respondents adopted this t methodd. Most Czzech compaanies, especcially mediium and large, m monitor perrformance of innovattion by usiing specificc financial and non financial f measurees but withoout any log gical link beetween them m. In other words onlyy a small nu umber of compannies, especiaally large on nes and thoose having different d perrspectives, actually understand the impportance of the cause and a -effect rrelationship p between metrics. m Herre, the gap between global aand Czech companies c has been diiscovered (ccf. Davila et e al., 2009;; Chiesa & Frattini, 2009; H Hendricks ett al., 2012). W While a com mpany may y not choosee to adopt a formal Balanced Scorrecard management system, it can learrn and use the key cooncepts. Thee Balanced Scorecard helps man nagers to implem ment strategyy through the t developpment of an n integrated d set of releevant finan ncial and non-finaancial meassures. The non-financia n al measures, if properly y selected, sshould be drivers d of sustaineed profitabiility. The author a therrefore advisses integrattion of sellected featu ures and indicatoors of the Balanced B Sccorecard andd to create one’s own specific Inn nnovation Sccorecard that woould best caapture the factors andd metrics of o innovatio on activitiess of the in ndividual companny is suggeested. The selection oof the relevant indicaators must be tailored d to the companny as each innovation is i unique, sppecific, and d intended to t bring com mpetitive ad dvantage and com mpany grow wth (e.g. Bon nner et al., 22001; Hart et al., 2003; Hauser & Zettelmeyeer, 1997; Vahs ett al., 2010). H Hence next section pro oposes on thhe basis of literature l rev view and em mpirical research an originall managemeent control system appproach to asssessment of innovationn performan nce on a micro-leevel suitable for Czech h business ennvironmentt, called the Innovationn Scorecard.. nceptual Frramework 4. Innovvation Scorrecard Con T The basic structure of o the Innoovation Sccorecard drraws on H Horvath’s lo ong-term experiennce (Horvath & Partneers, 2016) w with the im mplementing g of the BSSC and invo olves the followinng phases: (i) ( defining innovation strategy; (ii) setting strategic goalls; (iii) consstructing a relatioonship of caause and eff ffect with thhe help of a strategic map; m (iv) thee choice of metrics; (v) estaablishing taarget valuess. In contennt these fiv ve phases co ollectively form an in ntegrated whole. This gives rise to a saample approoach, conceeived in thee form of cooncrete insttructions for the pprocess of im mplementin ng the Innovvation Scorecard.
Figure 55. Innovatioon Scorecard d implemenntation (mod dified from Horváth & Partnes, 20 016)
Economics Ec & SSociology, Vol. Vo 9, No 4, 20016
Ondrej Zizlavsky
ISSSN 2071-789X X 54 N ECONOM MIC DEVELO OPMENT RECENT ISSUES IN
D Due to the scope of the paper thiss section is focused on nly on the de design of conceptual innovatiion perform mance measurement fraamework. Therefore, T itt is based oon the presu umptions that: The companny has alreaady definedd its innovattion strategy y (accordinng to e.g. Beessant & • T T Tidd, 2011;; Bonner et al., 2001; H Hayes, 2007 7; Kerssenss-van Dronggelen & Bilderbeek, 1999; Lafleey & Charan, 2008; P Pearson et al., 2000; Skarzynski ki & Gibson n, 2008; Tidd et al., 2005; Vahss et al., 20100). T Thomascheewski & Tarrlatt, 2010; T • T The compaany has alrready set pperformancee goals and d fine-tunedd the balan nce (e.g. K Kaplan & Norton, N 1993; Porter, 19998; Skarzy ynski & Gib bson, 2008) . • T The companny has alreaady establisshed its inno ovation business modeel (e.g. Daviila et al., 22013). F Following the t Stage Gate G model by Cooper (1998; 200 08), the inpuut‒process‒ ‒output‒ outcomees model (B Brown, 199 96), perform mance meassurement sy ystem desiggn rules (Azzone et al., 19991; Bourne et e al., 2003 3; Dixon et al., 1990; Globerson, G 1985; Goolld, 1991; Kaplan K & Norton, 1992; Maaskell, 1991; Neely eet al., 1996) and thee methodollogy of Inn novation Scorecaard, the innoovation process can bee divided in nto distinct stages s and sshould be separated by mannagement deecision gatees. This meaans an effective as weell as an effficient apprroach, so that the new producct can be moved m from iidea to laun nch in a systtematic wayy. E Every stagee is precedeed by one ggate. At eacch stage info ormation is gathered to o reduce project uncertaintiees and riskss which is tthen evaluatted at the following fo gaate. Gates represent r bles (what th the innovatiion team brings to the decision po oint) and decisionn points witth deliverab must m meet/should meet criterria where thhe compan ny can decid de if it willl proceed with w the innovatiion project or if it is to o be stoppedd, held or reecycled. Th hus gates aree also referrred to as “Go/Noo Go check points” wh here a deciision to inv vest more or o not is maade (Coopeer, 1998; 2008). At the gattes below average a proojects shou uld be stopped and reesources sh hould be p prrojects. allocateed to other promising B By compariing models of the innoovation proccess (Zizlavsky, 2013) and for the original purposee ‒ to createe a simple innovation i pperformance measurem ment system m framework k for the Czech bbusiness environment ‒ five distinnct evaluation gates arre selected:: (i) idea sccreening; (ii) projject selectioon; (iii) inn novation preeparation an nd market test; t (iv) annalysing maarket test results, after launchh assessmen nt; and (v) post implem mentation review r (see Figure 6). Each of these phhases is impportant for th he success oof innovatio on. W While the entire e innovation proceess is describ bed as being linear, it m moves in no on linear cycles aand must taake place allong the spiiral of the long-term l growth g of a company (Kopcaj, ( 2007; M Moss, 1989)). The linearr models off innovation n are useful for describbing key step ps in the innovatiion processs (Carlsson et al., 19766). Rather, the t innovatiion processs is chaotic and non linear (A Anderson ett al., 2004).
Figure 6. Modifieed Stage Gate G processs (Cooper, 1998, p. 108) accord rding to inn novation process (Zizlavsky, 2013, p. 5)
Economics Ec & SSociology, Vol. Vo 9, No 4, 20016
Ondrej Zizlavsky
ISSN 2071-789X 55 RECENT ISSUES IN ECONOMIC DEVELOPMENT
Before the evaluation of the innovation process, an essential factor of innovation assessment has to mentioned. Timing is key for innovation success as well as the reason for most failures in the context of innovation (e.g. Berth, 1993; Thomaschewski & Tarlatt, 2010). One challenge here is that promising projects – with the wrong timing – can be killed off in a very linear stage of project. If an idea falls through the innovation processes then it is just gone, even though it might hold promise at a future point when the company is better prepared to execute it. A solution could be an “Innovation incubator” ‒ if the projects are interesting, but the timing is off, then the competent manager can catch the falling projects in the innovation incubator (Lindegaard, 2015). Gate 1 consists of measurement inspiration related to activities which are devoted to identification of ideas for innovation projects. This phase is divided into factors which depend on whether ideas are actively generated or collected from existing resources, as well as if they originate from internal or external stakeholders. Therefore idea screening is the first of a series of evaluations of whether the idea is according to the strategy of the company. It begins when the collection of inventive ideas is complete. It is an initial assessment to weed out impractical ideas. This initial evaluation cannot be very sophisticated as it is concerned with identifying ideas that can pass on to the applied R&D stage to be developed into concepts and can be evaluated for their technical feasibility and market potential. The influence of innovation ideas is generally still very unclear and technical or economic success is therefore difficult to estimate. The typical innovation killer is a question like “How profitable is this new opportunity?” Of course, asking detailed questions about profitability is not wrong but many companies tend to ask this question very early ‒ at a stage when it is impossible to answer it. There are only rough economic estimates and data collection concentrates primarily on the sales volumes of overall and submarkets as well as the distribution of market shares. Risk analyses are regularly carried out in the initiation phase as regards technical feasibility and economic success (Gaiser et al., 1989). Precise cost and revenue estimations and allocations can still not be made since the use of the innovation and its associated products or services has not been specified yet. The recorded values cannot be allocated to the innovation yet. The recording process only indicated possible leeway. The extent to which this can be filled by the innovation remains open in this phase. The project proposals which are considered best are chosen and innovation projects are started for proof-of-concept and prototype development. At Gate 2 the project is reevaluated based on the criteria of Gate 1 and additional variables such as market potential. At the end of the inventive phase in the innovation process the company may have a list of many projects that senior management would like to complete. Each project may (or may not) possibly require different degrees of innovation. If current funding will support only a few projects, then how does a company decide which of the twenty projects to work on first? This is the project selection and prioritization process. At this early stage the investment appraisal methods are still not applied since they require much more detailed information on the time of occurrence of input values. The estimate is limited to a basic comparison of investment costs and the revenue and growth potential of the market addressed, augmented by risk-related statements. The cost sheet is to provide an idea of the financial and organisational expenses to be expected. Demanding a lot of financial precision about a promising project, particularly during the embryonic stages of experimentation, is highly counterproductive. Rather than making a quick decision about an idea at a very early stage, the goal should be to create an extremely fast iterative cycle that allows prospective innovators to get started, quickly test whether their
Economics & Sociology, Vol. 9, No 4, 2016
Ondrej Zizlavsky
ISSN 2071-789X 56 RECENT ISSUES IN ECONOMIC DEVELOPMENT
hypotheses are valid or invalid, see what they learn from their experimentation and rapidly iterate that learning. At the end of this applied R&D stage the product is finally developed physically. The result of this stage is a tested prototype. Apart from technical and qualitative aspects it is important to involve the customers or users for feedback in order to better understand their unmet and unspoken needs and problems and benefits sought in the innovation. Economic data and plans, e.g. production and marketing plans, are reviewed. Based on this in Gate 2 the product is tested again for overall operability. This includes testing the product in the market. Cooper (2008) suggests field trials, pre tests or test markets in order to assess customers‘ reactions and calculate approximate market share or revenues. Choosing the right projects is only half of the way to ensure a company’s long‑term competitiveness. Even if the right innovation projects are selected it remains important to assess whether the execution of every single project is successful. More precisely companies face the challenge of measuring the performance of innovation projects. Therefore the planning phase is used to prepare and develop innovation concepts. These concepts build the framework for the values to be considered in this phase. Forecast, potential revenues from products and services and OPEX form the basis for the calculation. Depending on the nature and design of the innovation, revenues can be broken down into detailed reference values such as customer groups or sub-segments. Gate 3 assesses the product a last time before its launch. In order to assure performance of innovation projects a number of tools can be applied such as milestone trend analysis, project reporting, project status analysis or cost trend analysis. Another tool which can be applied is target costing. This strategic cost management allows the entire life cycle of product and influencing the performance of innovation project in the early stages of product development to be considered (e.g. Sakurai, 1989). The specified product concepts are launched on the market using traditional marketing tools and on the basis of the product launch processes in the commercialization phase. At Gate 4 the product is assessed once more. Actual performance is compared to forecasts. Internal accounting provides cost and service allocation and forecasts as basic information for this phase. The innovation profitability analysis focuses on individual products, service offers, product bundles, dedicated customer segments and sales areas in this phase. There is already a clear idea of production costs and willingness to pay, enabling detailed data to be recorded. As the data pool improves, the relationship between innovation and origin of cost gradually becomes clearer. Specifically the level of detail and the specific nature of the data make it easier to allocate innovations. Cost accounting becomes increasingly helpful and offers more precise information, especially with regard to OPEX and the determination of flat rates. Company accounting and the company‘s planning systems provide a wide range of tools in this phase with which both cost and revenue-related planning and control can be achieved. In the measurement, the project-induced revenues must be compared with capital expenditure over time. Data for the forecast revenues and investment costs should be agreed with the product owners. For interconnected and network products this is difficult since there are generally several product owners. Financial mathematics provides above all the net present value method as a dynamic investment appraisal method (Ryan & Ryan, 2002). Under this method, payments received and made over the product life-cycle are compared and discounted to their present value. Corporate earnings and innovation risk are controlled using the specified interest rate. Within Gate 5 there should of course be a post implementation review which investigates the causes of the problems in the implemented innovation, not to seek out the culprit in terms of the poor decisions, but so that in future in a similar innovation process can
Economics & Sociology, Vol. 9, No 4, 2016
Ondrej Zizlavsky
ISSN 2071-789X 57 RECENT ISSUES IN ECONOMIC DEVELOPMENT
discover and avoid similar problems. The post-implementation review thus becomes a key element in control feedback, which makes possible the incorporation of the results into further projects, so becoming also the first ex-ante input in future projects. We can therefore see the post-implementation review as a learning process, the results of which translate into the success of further innovation projects and so also into the future prosperity of the business. Conclusion The paper is based on current knowledge in the area of innovation management and management control and on specific conditions in today’s business environment. It summarises the issues of managing and measuring the performance of the innovation process. This work builds on knowledge from significant professional authors, summarises it and tries to develop it further. The paper continues research activities and publications carried out within long-term empirical research carried out in Czech manufacturing industry in 2009-2015. It was necessary to study the individual definitions, processes and means of measuring and managing innovation performance as available in the current state of scientific thinking. This review phase was oriented to the study of especially foreign and Czech professional literature as found in books, articles in journals, information servers and the databases of libraries, universities and other organisations. Based on the theoretical review presented and the empirical findings from primary research, major implications relevant to academics and practitioners stem from this study. The work has implications for the field of business performance measurement. Research has outlined a number of metrics; various methods and performance measurement frameworks for innovation process evaluation that exist in Czech manufacturing companies. On the basis of this literature review and an empirical study in Czech manufacturing industry, a management control system approach to innovation performance measurement suitable for Czech business environment called the Innovation Scorecard was proposed. This paper dealt with evaluation of innovation in five phases of the innovation process based on a modified stage gate model. Moreover, at each gate the Innovation Scorecard framework provides a set of factors and for each factor a set of inspiration metrics to choose from or be inspired by (see Appendix 1). From a managerial viewpoint the Innovation Scorecard may provide useful guidelines for focusing attention and expending resources during the entire innovation process. It is argued that the informed use of evaluation metrics as guideposts for increased managerial attention and the identification of problems may help management to prevent drop-and-goerrors in their innovation efforts. Managers may compare and contrast findings from this study with their own innovation practices and, by doing so, enrich the knowledge pool upon which they draw to make well-informed decisions. In addition, this study has created a basis for further research in the field of innovation performance measurement and management control. An extensive theory about innovation management and performance measurement has been reviewed in this study. Moreover, the literature overview has been completed by primary research in Czech manufacturing industry. Therefore it could serve as guideline for case studies or further research. However the benefits need to be assessed in a purely realistic manner. The proposed methodology is not an all-powerful guide which would lead to the problem-free innovation performance management in all circumstances. It identifies and highlights potentially problematic areas and shows managers all that they should take into account when managing innovation. It is also only one of many possible approaches, given how extensive economics has become and the wide availability of its results.
Economics & Sociology, Vol. 9, No 4, 2016
Ondrej Zizlavsky
ISSN 2071-789X 58 RECENT ISSUES IN ECONOMIC DEVELOPMENT
Acknowledgement This paper was supported by research project no. FP-S-15-2877 The Selected Questions of Financial Management from the Internal Grant Agency at Brno University of Technology. References Acs, Z. J., Anselin, L., Varga, A. (2002), Patents and innovation counts as measures of regional production of new knowledge, Research Policy, Vol. 31, No. 7, pp. 1069-1085. Anderson, N. R., De Dreu, C. K. W., Nijstad, B. A. (2004), The routinization of innovation research: A constructively critical review of the state-of-the-science, Journal of Organizational Behaviour, Vol. 25, No. 2, pp. 147-173. Azzone, G., Masella, C., Bertelè, U. (1991), Design of performance measures for time-based companies, International Journal of Operations & Production Management, Vol. 11, No. 3, pp. 77-85. Baldwin, J., Gellatly, G. (2003), Innovation Strategies and Performance in small firms, Cheltenham, Edward Elgar. Bassani, C., Lazzarotti, V., Manzini, R., Pellegrini, L., Santomauro, S. (2010), Measuring performance in R&NPD: the case of Whitehead Alenia Sistemi Subacquei – a Finmeccanica company, European Journal of Innovation Management, Vol. 13, No. 4, pp. 481-506. Berth, R. (1993), Der kleine Wurf, Manager Magazin, Vol. 23, No. 4, pp. 214-227. Bessant, J., Tidd, J. (2011), Innovation and entrepreneurship, NJ: Wiley. Bititci, U. S., Carrie, A. S., McDevitt, L. (1997), Integrated performance measurement systems: A development guide, International Journal of Operations and Production Management, Vol. 17, No. 5, pp. 522-534. Bonner, J. M., Rueker, R. W., Walker, O. C. (2001), Upper management control of new product development project performance, Journal of Product Innovation Management, Vol. 19, No. 3, pp. 233-245. Bourne, M. C. S., Neely, A. D., Mills, J. F., Platts, K. W. (2003), Implementing performance measurement systems: a literature review, International Journal of Business Performance Management, Vol. 5, No. 1, pp. 1-24. Bremser, W. G., Barsky, N. P. (2004), Utilizing the balanced scorecard for R&D performance measurement, R&D Management, Vol. 34, No. 3, pp. 229-238. Brouwer, E., Kleinknecht, A. (1996), Firm size, small business presence and sales of innovative products: A micro-econometrics analysis, Small Business Economics, Vol. 8, pp. 189-201. Brown, M. G. (1996), Keeping Score: Using the Right Metrics to Drive World Class Performance, New York, NY: Productivity Press. Calabrese, A., Campisi, D., Capece, G., Costa, R., Di Pillo, F. (2013), Competiveness and Innovation in High-tech Companies: an Application to the Italian Biotech and Aerospace Industries, International Journal of Engineering Business Management, Vol. 5, pp. 40-51. Carenzo, P., Turolla, A. (2010), Diffusion of management accounting systems in manufacturing companies, In: M. J. Epstein et al. (eds.) Performance measurement and management control: innovative concepts and practices, Bingley: Emerald Group Publishing Limited, pp. 457-499. Carlsson, B., Keane, P., Martin, J. B. (1976), R&D organizations as learning systems, Sloan Management Review, Vol. 17, No. 3, pp. 1-15.
Economics & Sociology, Vol. 9, No 4, 2016
Ondrej Zizlavsky
ISSN 2071-789X 59 RECENT ISSUES IN ECONOMIC DEVELOPMENT
Charnes, A., Cooper, W. W., Rhodes, E. (1978), Measuring the efficiency of decision making units, European Journal of Operational Research, No. 2, pp. 429-444. Chiesa, V., Frattini, F. (2009), Evaluation and performance measurement of research and development, Cheltenham, Edward Elgar Publishing. Cokins, G. (2009), Performance management: integrating strategy execution, methodologies, risk, and analytics, Hoboken, N.J.: Wiley. Cooper, J. R. (1998), A multidimensional approach to the adoption of innovation, Management Decision, Vol. 36, No. 8, pp. 493-502. Cooper, R. G. (2008), Perspective: The Stage-Gate idea-to-launch process – update, What’s new and NextGenSystems, Journal of Product Innovation Management, Vol. 25, pp. 213-232. Cooper, R. G., Edgett, S., Kleinschmidt, E. (2004), Benchmarking best NPD practices, Research Technology Management, Vol. 47, No. 1, pp. 31-43. Danneels, E., Kleinschmidt, E. (2001), Product innovativeness from the firm’s perspective: Its dimensions and their relation with project selection and performance, Journal of Product Innovation Management, Vol. 18, No. 6, pp. 357-373. Davila, T., Epstein, M. J., Shelton, R. D. (2013), Making innovation work: How to manage it, measure it, and profit from it, Updated ed. Upper Saddle River: FT Press. Davila, A., Foster, G. Li, M. (2009), Reasons for management control systems adoption: Insights from product development systems choice by early-stage entrepreneurial companies, Accounting, Organizations and Society, Vol. 34, No. 3-4, pp. 233-347. Dixon, J. R., Nanni, A. J., Vollmann, T. E. (1990), The New Performance Challenge: Measuring Operations for World-Class Competition, Homewood, IL: Irwin Professional Pub. Donovan, J., Tully, R., Wortman, B. (1998), The Value Enterprise: Strategies for Building a Value-based Organization, Toronto: McGraw-Hill/Ryerson. Doukas, J., Switzer, L. (1992), The stock market’s valuation of R&D spending and market concentration, Journal of Economics and Business, Vol. 44, No. 2, pp. 95-114. Drucker, P. F. (1985), Innovation and entrepreneurship: practice and principles, Harper & Row. Eilat, H., Golany, B., Shtub, A. (2008), R&D project evaluation: an integrated DEA and balanced scorecard approach, Omega, Vol. 36, No. 5, pp. 895-912. European Foundation For Quality Management (1999), EFQM Model for Business Excellence: Company Guidelines, Brussels: EFQM. Gaiser, B., Horváth, P.,Mattern, K., Servatius, H. G. (1989), Wirkungsvolles F+E Controlling stärkt die Innovationskraft, Harvard-Manager, Vol. 11, No. 3, pp. 32-40. Garcia, R., Calantone, R. (2002), A critical look at technological innovation typology and innovativeness terminology: A literature review, Journal of Product Innovation Management, Vol. 19, No. 2, pp. 110-132. García-Valderrama, T., Mulero-Mendigorri, E., Revuelta-Bordoy, D. (2008a), A Balanced Scorecard framework for R&D, European Journal of Innovation Management, Vol. 11, No. 2, pp. 241-281. Garcia-Valderrama, T., Muler-Mendigorri, E., Revuelta-Bordoy, D. (2008b), Relating the perspectives of the balanced scorecard for R&D by means of DEA, European Journal of Operational Research, Vol. 196, No. 3, pp. 1177-1189. Gault, F. (2013), Handbook of innovation indicators and measurement, Cheltenham, Edward Elgar Publishing. Globerson, S. (1985), Issues in developing a performance criteria system for an organisation, International Journal of Production Research, Vol. 23, No. 4, pp. 639-46.
Economics & Sociology, Vol. 9, No 4, 2016
Ondrej Zizlavsky
ISSN 2071-789X 60 RECENT ISSUES IN ECONOMIC DEVELOPMENT
Goold, M., Quinn, J. J. (1990), The paradox of strategic controls, Strategic Management Journal, Vol. 11, pp. 43-57. Greve, H.R. (2003), Behavioral theory of R&D expenditures and innovations: evidence from shipbuilding, Academy of Management Journal, Vol. 46, No. 6, pp. 685-702. Griliches, Z. (1990), Patent statistics as economic indicators, Journal of Economic Literature, No. 28, pp. 1661-1707. Gronum, S., Verreynne, M. L., Kastelle, T. (2012), The Role of Networks in Small and Medium-Sized Enterprise Innovation and Firm Performance, Journal of Small Business Management, Vol. 50, No. 2, pp. 257-282. Guo, R. J., Baruch, L., Zhou, N. (2005), The valuation of biotech IPOs, Journal of Accounting, Auditing & Finance, Vol. 20, No. 4, pp. 423-459. Hart, S., Hultink, E. J., Tzokas, N., Commandeur, H. G. (2003), Industrial companies’ criteria in new product development gates, Journal of Product Innovation Management, No. 20, pp. 22-36. Hauser, J. R., Zettelmeyer, F. (1997), Metrics to evaluate RD&E, Research Technology Management, No. 40, pp 32-38. Hauschildt, J., Salomo, S. (2007), Innovationsmanagement, München, Verlag Vahlen. Hayes, J. (2007), The theory and practice of change management, New York: Palgrave Macmillan. Hendricks, K., Hora, M., Menor, L., Wiedman, Ch. (2012), Adoption of the Balanced Scorecard: A Contingency Variables Analysis, Canadian Journal of Administrative Sciences, Vol. 29, No. 2, pp. 124-138. Horvath & Partners. (2016), Balanced Scorecard umsetzen, Gebunden: Schäffer-Poeschel. Hronec, S. M. (1993), Vital signs: using quality, time, and cost performance measurements to chart your company’s future, New York: Amacom. Ittner, C. D., Larcker, D. F. (1998), Innovations in performance measurement: Trends and research implications, Journal of Management Accounting Research, No. 10, pp. 205238. Johnson, H. T., Kaplan, R. S. (1987), Relevance lost: The rise and fall of management accounting, Boston: Harvard Business School Press. Kaplan, R. S., Norton, P. D. (1992), The balanced scorecard: Measures that drive performance, Harvard Business Review, Vol. 70, No. 1, pp. 71-79. Kaplan, R. S., Norton, P. D. (1993), Putting the balanced scorecard to work, Harvard Business Review, Vol. 71, No. 5, pp. 134-147. Kaplan, R. S., Norton, P. D. (1996), The balanced scorecard: Translating strategy into action, Boston: Harvard Business School Press. Kaplan, R. S., Norton, P. D. (2001), The strategy focused organization, Boston, MA: Harvard Business School Press. Keegan, D. P, Eiler, R. G., Jones, C. R. (1989), Are your performance measures obsolete? Management Accounting, Vol. 70, No. 12, pp. 45-50. Kerssens-van Drongelen, I. C., Cook, A. (1997), Design principles for the development of measurement systems for research and development processes, R&D Management, Vol. 27, No. 4, pp. 345-359. Kerssens-van Drongelen, I. C., Bilderbeek, J. (1999), R&D performance measurement: more than choosing a set of metrics, R&D Management, Vol. 29, No. 1, pp. 35-46. Klomp, L., van Leeuwen, G. (2001), Linking Innovation and Firm Performance: A New Approach, International Journal of the Economics of Business, Vol. 8, No. 3, pp. 343364. Kopcaj, A. (2007), Spirálový management, Prague: Alfa Publishing.
Economics & Sociology, Vol. 9, No 4, 2016
Ondrej Zizlavsky
ISSN 2071-789X 61 RECENT ISSUES IN ECONOMIC DEVELOPMENT
Kozubikova, L., Zoubkova, A. (2016), Entrepreneur´s attitude towards innovativeness and competitive aggressiveness: The case study of Czech micro-enterprises, Journal of International Studies, Vol. 9, No. 1, pp 192-204. Lafley, A., Charan, R. (2008), The game-changer: how you can drive revenue and profit growth with innovation, New York: Crown Business. Lahovnik, M, Breznik, L. (2014), Technological innovation capabilities as a source of competitive advantage: A case study from the home appliance industry, Transformations in Business & Economics, Vol. 13, No. 2, pp. 144-160. Lebas, M. (1994), Managerial accounting in France: Overview of past traditional and current practise, European Accounting Review, Vol. 3, No. 3, pp. 471-487. Li, H., Atuahene-Gima, K. (2001), Product innovation strategy and the performance of new technology ventures in China, Academy of Management Journal, Vol. 44, No. 6, pp. 1123-1134. Li, G., Dalton, D. (2003), Balanced Scorecard for I+D, Pharmaceutical Executive, Vol. 23, No. 3, pp. 84-90, ISSN 0279-6570. Lindegaard, S. (2015), The Execution of Innovation: What You Need to Know, http://i.hypeinnovation.com/execution-white-paper-0 (referred 2016-04-17). Mansury, M. A., Love, J. H. (2008), Innovation, Productivity and Growth in US Business Services: A Firm-Level Analysis, Technovation, No. 28, pp. 52-62. Maskell, B. H. (1991), Performance measurement for world class manufacturing, Cambridge, MA: Productivity Press. McNair, C., Lynch, R. R., Cross, K. L. (1990), Do financial and nonfinancial measures have to agree? Management Accounting, Vol. 5, pp. 26-36. Merschmann, U., Thonemann, U.W. (2011), Supply chain flexibility, uncertainty and firm performance: an empirical analysis of German manufacturing firms, International Journal of Production Economics, Vol. 130, No. 1, pp. 43-53. Moss, K. R. (1989), Swimming in new streams: mastering innovation dilemmas, California Management Review, Vol. 31, No. 4, pp. 45-69. Neely, A., Adams, C. (2001), The performance prism perspective, Journal of Cost Management, Vol. 15, No. 1, pp. 7-15. Neely, A., Mills, J., Platts, K., Gregory, M., Richards, H. (1996), Performance measurement system design: Should process based approach be adopted, International Journal of Production Economics, Vol. 46-47, No. 1, pp. 423-431. Neumann, B., Roberts, M.K., Cauvin, E. (2008), Financial and nonfinancial performance measures, Journal of Cost Management, Vol. 22, No. 6, pp. 5-14. Niven, P. R. (2005), Balanced scorecard diagnostic, Hoboken: Wiley. Niven, P. R. (2014), Balanced scorecard evolution: a dynamic approach to strategy execution, Hoboken: Wiley. OECD (2005), Oslo manual: guidelines for collecting and interpreting innovation data, Paris, OECD. OECD (2009), Innovation in firms, Paris, OECD. Patel, P., Pavitt, K. (1995), Patterns of technological activity: their measurement and interpretation, In: P. Stoneman (ed.), The handbook of the economics of innovation and technological change, Oxford: Wiley-Blackwell, pp. 14-51. Pearson, A. W., Nixon, W., Kerssens-Van Drongelen, I. C. (2000), R&D as a business – what are the implications for performance measurement? R&D Management, Vol. 30, No. 4, pp. 355-364. Pittaway, L., Robertson, M., Munir, K., Nenyer, D., Neely, A. (2004), Networking and Innovation: A Systematic Review of the Evidence, International Journal of Management Reviews, Vol. 5-6, No. 3-4, pp. 137-168.
Economics & Sociology, Vol. 9, No 4, 2016
Ondrej Zizlavsky
ISSN 2071-789X 62 RECENT ISSUES IN ECONOMIC DEVELOPMENT
Porter, M. (1998), Competitive strategy: techniques for analyzing industries and competitors: with a new introduction, New York: Free Press. Porter, M. (1990), The Competitive Advantage of Nations, New York: Free Press. Pritchard, R. D., Harrell, M. M., Diazgranados, D., Guzman, M. J. (2008), The productivity measurement and enhancement system: A meta-analysis, Journal of Applied Psychology, Vol. 93, No. 3, pp. 540-567. Rosenbusch, N., Brinckmann, J., Bausch, A. (2011), Is innovation always beneficial? A metaanalysis of the relationship between innovation and performance in SMEs, Journal of Business Venturing, Vol. 26, No. 4, pp. 441-457. Rothwell, R. (1992), Successful industrial innovation: critical factors for the 1990s, R&D Management, Vol. 22, No. 3, pp. 221-240, ISSN 1467-9310. Ryan, P. A., Ryan, G. P. (2002), Capital budgeting practise of the fortune 1000: How Have Things Changed, Journal of Business and Management, Vol. 8, No. 4, pp. 389-419. Sakurai, M. (1989), Target costing and how to use it, Journal of Cost Management, Vol. 3, pp. 39-50, ISSN 1092-8057. Schumpeter, J. A. (1912), Theorie der wirtschaftlichen Entwicklung, Leipzig: Duncker und Humblot. Skarzynski, P., Gibson, R. (2008), Innovation to the core: a blueprint for transforming the way your company innovates, Boston: Harvard Business Press. Thomas, P., Mcmillan, G. S. (2001), Using science and technology indicators to manage R&D as a business, Engineering Management Journal, Vol. 13, No. 3, pp. 9-14. Thomaschewski, D., Tarlatt, A. (2010), Determinants for failure and success in innovation management, In: A. Gerybadze et al. (eds.), Innovation and international corporate growth, Berlin: Springer, pp 127-149. Tidd, J., Bessant, J. R., Pavitt, K. (2005), Managing innovation: integrating technological, market and organizational change, Chichester: John Wiley. Tipping, J. W., Zeffren, E., Fusteld, A. (1995), Assessing the value of your technology, Research Technology Management, Vol. 38, No. 5, pp. 22-31. Tzokas, N., Hutlink, E. J., Hart, S. (2004), Navigating the new product development process, Industrial Marketing Management, Vol. 33, pp. 619-626. Utunen, P. (2003), Identify, measure, visualize your technology assets, Research Technology Management, Vol. 46, No. 3, pp. 31-39. Vahs, D., Koch, V., Kielkopf, M. (2010), Innovation generating and evaluation: The impact of change management, In: A. Gerybadze et al. (eds.), Innovation and international corporate growth, Berlin: Springer, pp 151-174. Vaivio, J. (1999), Exploring a nonfinancial management accounting change, Management Accounting Research, Vol. 10, No. 4, pp. 409-437. Valenta, F. (1969), Tvůrčí aktivita – inovace – efekty, Prague: Svoboda. Van Wijk, R., Jansen, J. J., Lyles, M. A. (2008), Inter- and Intra- Organizational Knowledge Transfer: A Meta-Analytic Review and Assessment of Its Antecedents and Consequences, Journal of Management Studies, Vol. 45, pp. 830-853. Verbeek, A., Debackere, K., Luwel, M., Zimmermann, E. (2002), Measuring progress and evolution in science and technology I: The multiple uses of bibliometric indicators, International Journal of Management Reviews, Vol. 4, No. 2, pp. 179-211. Vlcek, R. (2002), Hodnota pro zákazníka, Prague: Management Press. Werner, B. M., Souder, W. E. (1997), Measuring R&D performance: state of the art, Research Technology Management, Vol. 40, No. 2, pp. 34-42, ISSN 0895-6308. Wingate, L. M. (2015), Project management for research and development: guiding innovation for positive R&D outcomes, Boca Raton: CRC Press.
Economics & Sociology, Vol. 9, No 4, 2016
Ondrej Zizlavsky
ISSN 2071-789X 63 RECENT ISSUES IN ECONOMIC DEVELOPMENT
Zhou, K. Z. (2006), Innovation, imitation, and new product performance? The case study of China, Industrial Marketing Management, Vol. 35, No. 3, pp. 394-402. Zizlavsky, O. (2013), Past, Present and Future of the Innovation Process, International Journal of Engineering Business Management, Vol. 5, pp. 1-8, ISSN 1847-9790. Zizlavsky, O., Karas, M. (2014), The Relationship Between R&D Expenses and Performance: Evidence from European Manufacturing Enterprises, The 26th European Modeling & Simulation Symposium, Bordeaux, 2014, pp. 72-78.
Economics & Sociology, Vol. 9, No 4, 2016