PHYSICAL REVIEW B 86, 085440 (2012)
Theoretical investigation of structural stability and electronic properties of hydrogenated silicon nanocrystals: Size, shape, and surface reconstruction Hongdo Lu,1 Yu-Jun Zhao,1,2 Xiao-Bao Yang,1,2,* and Hu Xu3,† 1
Department of Physics, South China University of Technology, Guangzhou 510640, People’s Republic of China 2 State Key Laboratory of Luminescent Materials and Devices, South China University of Technology, Guangzhou 510640, People’s Republic of China 3 Nanostructure Institute for Energy and Environmental Research, Division of Physical Sciences, South University of Science and Technology of China, Shenzhen, People’s Republic of China (Received 23 May 2012; published 22 August 2012) By model analysis and the first-principles calculations, we have performed a systematic investigation of hydrogenated silicon nanocrystals (H-SiNCs) with various size, shape, and surface reconstruction. We demonstrated that H-SiNCs with the smallest H/Si ratio are enclosed by (111) facets before reconstruction, and two typical surface reconstructions will dramatically decreases the H/Si ratio, involving dimers and steps on (100) and (111) facets, respectively. With the first-principles calculations, we determined the stable H-SiNCs (up to 200 Si atoms) and found that the surface morphologies vary with the size and hydrogen chemical potential. In addition, we also studied the electronic properties of H-SiNCs focused on the gap variations and charge distributions as a function of size, shape, and surface reconstruction. The dimer and step reconstructions not only bring significant decrement of the gap values and the H/Si ratio, but also modulate the charge distributions and induce the spatial separation of near-gap levels. DOI: 10.1103/PhysRevB.86.085440
PACS number(s): 61.46.Df, 68.65.−k
I. INTRODUCTION
Silicon nanocrystals (SiNCs) have been a greatly attractive subject of many experimental and theoretical studies in recent years.1–11 Theoretically, SiNCs have been considered as the ideal model to demonstrate the quantum-confined effect,1,2 which has been verified by experimental observations on the electronic properties.3–5 With the ease of modifying the properties by tuning sizes and morphologies,6–9 it has also been motivated by tremendous potential applications in photovoltaics and optoelectronics,4 nanoscale sensors,10 and biological labels.11 In general, the properties of Si nanomaterials are dominated by the details of structure, such as the shape and surface morphologies. It has been reported that7 highly curved surfaces of SiNCs would dramatically reduce the optical gaps and modulate excitonic lifetimes. The structural tapering12 and utilizing the partial strain on Si nanowires13 have been predicted to induce the spatial separation of the highest occupied and the lowest unoccupied states, which can be used for designing efficient solar cells. Thus, an accurate determination or prediction of the structures of the Si nanomaterials becomes crucially important. To predict the Si nanostructures theoretically, we should consider numerous possible candidates, perform corresponding calculations of total energies, and determine the stable ones according to the free energies as a function of chemical potential. Thus, the bottleneck in the structural determination is the accurate calculation of the total energy, which requires a great deal of computational resources. Recent developments14,15 involved the energy calculation with classical potential in Hansel-Vogel (HV) formalism, and the magic structure search of Si with genetic algorithms. The energy decomposition approach,16 which decomposes the total energy into the contributions from the bulk, surfaces, and the edges, is also efficient for the stability determinations of silicon 1098-0121/2012/86(8)/085440(6)
nanostructures. Meanwhile, various parameters have been proposed for the scaling of Si nanostructures’ stability, such as the surface-to-volume ratio,17 diameter,18 perimeter,19 and cross-sectional area.20 However, it is difficult to define these quantities exactly and their correlations with total energies are also complicated. In our recent work,21,22 we found that the H/Si ratio is an ideal criterion for the structural stability of Si nanostructures, attributed to two reasons: (i) The H/Si ratio can be determined precisely; (ii) the cohesive energy shows a linear dependence on the H/Si ratio. We also showed that Si nanostructures with smaller H/Si ratios are more stable for the low chemical potential of hydrogen (μH ). In this paper, we have investigated hydrogenated silicon nanocrystals (H-SiNCs) with various sizes, shapes, and surface reconstructions. With the inequality analysis for minimizing the H/Si ratio, we determined the energetically favored outermost facets enclosing H-SiNCs, as well as the corresponding dimer and step reconstructions on (100) and (111) facets. Using the first-principles calculations, we demonstrated the evolution of H-SiNCs as a function of the hydrogen chemical potential, and found spatial separation of near-gap levels of stable H-SiNCs due to dimer and step reconstruction.
II. COMPUTATIONAL METHODS
We perform the calculations of H-SiNCs, using the densityfunctional theory (DFT) method implemented in the Vienna ab initio simulation package23,24 (VASP) with the frozencore projector augmented-wave method. The Perdew-Wang (PW91) generalized gradient approximation (GGA) functional was employed for the exchange-correlation energy. With a mesh of 1 × 1 × 1, all the structures are fully relaxed by the conjugate gradient minimization and the convergence of the ˚ The cutoff energy forces on each atom is less than 0.01 eV/A. ˚ It has been is 350 eV and the vacuum distance is set to be 8 A.
085440-1
©2012 American Physical Society
HONGDO LU, YU-JUN ZHAO, XIAO-BAO YANG, AND HU XU
PHYSICAL REVIEW B 86, 085440 (2012)
shown that higher energy cutoff (400 eV) and larger vacuum ˚ for each system varies the total energies less distance (10 A) than 10 meV. For comparison, we have also performed the calculation with the functional of Becke three-parameter LeeYang-Parr (B3LYP) (Ref. 25) and Heyd-Scuseria-Ernzerhof (HSE06).26–28 In our calculations with DFT-GGA/PW91, the optimized Si-H and Si-Si bond length in Si10 H16 was 1.49 ˚ respectively. With the functional of B3LYP and and 2.34 A, HSE06, the optimized Si-H bond lengths were 1.46 and ˚ and the Si-Si ones were 2.33 and 2.33 A, ˚ respectively. 1.48 A The highest occupied molecular orbital–lowest unoccupied molecular orbital (HOMO-LUMO) gap of SiH4 obtained with the HSE06 functional was 8.8 eV, in good agreement with the experiment results29 and the calculations with high accuracy.2 Subsequently, we investigated the electronic properties of small H-SiNCs, with the functional of HSE06. According to our previous work, the stable structures correspond to the maximum or minimum H/Si ratio, depending on the hydrogen chemical potential. For the H-SiNCs of Sim Hn , the maximum of n is 2m + 2 and the least n can be obtained from the searching which allows Si atoms on the surface to move randomly in the crystal lattice. We have obtained the possible structures with m < 30 and the searching becomes inefficient as the number of Si atoms increases beyond 30. The larger SiNCs were constructed with consideration of specific symmetries and typical surface reconstructions, as well as the variations of the H/Si ratio.
(a)
Si68H56
Si50H32
Si70H36
Si84H64
Si66H40
Si106H48
Si100H72
Si82H48
Si142H60
III. RESULTS AND DISCUSSIONS
We consider the possible H-SiNCs with various symmetries and surface morphologies, as shown in Sec. III A. In Sec. III B, we employ the first-principles calculations to investigate the stability of the H-SiNC candidates, with respect to the variations of the hydrogen chemical potential. The electronic properties of the H-SiNCs, including the gaps and the charge distributions of near-gap levels, are discussed in Sec. III C. A. Structures of H-SiNCs with small H/Si ratio
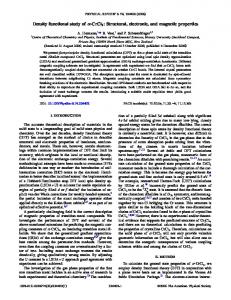
First, we construct the possible H-SiNCs to determine the ones with smaller H/Si ratio. Figure 1 shows the H-SiNCs with various facets and surface reconstructions, including the dimer reconstructions on (100) facets and the step reconstructions on (111) facets. In Fig. 2, we demonstrate the variations of the H/Si ratio as a function of the size, shape, and surface reconstructions. 1. Without reconstruction
The facets of (100), (110), and (111) are three typical surfaces for the H-SiNCs without reconstructions, which are terminated by monohydride (-SiH) and dihydride (-SiH2 ) shown in Fig. 1(a). For the (100) facets, one more Si atom can be added at every neighboring -SiH2 and the number of hydrogen atoms remains the same. Similarly, more Si atoms can be added on the (110) facets without changing the hydrogen number. Thus, the new structure will possess a smaller
(b)
FIG. 1. (Color online) The symmetry and surface morphology of H-SiNCs: (a) Illustration for H-SiNCs without and with reconstructions; (b) typical structure evolutions for the dimer and step reconstructions. Si(H) atoms are represented by blue (white) balls. For the dimer reconstructions, the deleted Si atoms are marked as orange balls. For the step reconstructions, the positions for adding Si atoms are marked as pink balls. The coordinates of the relaxed structures are included in the Supplemental Material (Ref. 30). n H/Si ratio according to a simple inequality that m+dm < mn , where dm is the number of added Si atoms and n (m) is the number of H (Si) atoms in Sim Hn , respectively. By eliminating (100) and (110) facets to reduce the H/Si ratio, we have found a series of H-SiNCs enclosed by (111) facets according to the random searching, such as Si10 H16 , which corresponds to the smallest octahedron. Due to the smaller surface-to-volume ratio, the H/Si ratio of the octahedron H-SiNCs is lower than that of the tetrahedron and hexahedron ones (shown in Fig. 2).
2. Dimer reconstructions on the (100) facet
In our previous study,22 we found that the H/Si ratio can be reduced by the reconstructions. For example, Si25 H20
085440-2
THEORETICAL INVESTIGATION OF STRUCTURAL . . .
H/Si ratio
0.6
1.25
0.5
0.4
1.00
100
200
300
0.75 0.50 50
100
150
200
250
12
10
Ecoh Difference (eV/atom)
1.50
14
Tetra. Hexa. Octa. 0.8 No Rec. Dimer 0.7 Step
Cohesive Energy(eV/Si atom)
1.75
PHYSICAL REVIEW B 86, 085440 (2012) reconstructed unreconstructed Si106H48 Si70H36 Si20H18 Si142H60 Si29H24
0.3
0.2
0.1
0.0 0
40
80
120
N b off Sili Number Silicon atoms
8 no reconstruction dimer reconstruction step reconstruction calculated with HSE06
6
300
0
Number of Silicon atoms
1
2
3
4
H/Si ratio
FIG. 2. (Color online) The H/Si ratio of H-SiNCs as a function of size, shape, and surface reconstructions. Inset shows H-SiNCs with H/Si ratio in the range of 0.4–0.8. Squares, circles, and triangles represent the H-SiNCs with the shape of tetrahedron, hexahedron, and octahedron, respectively. Full, half-filled, and empty symbols represent the H-SiNCs with no reconstructions, dimer, and step reconstructions, respectively. Note that reconstructions will change the shape of NCs. For example, Si84 H64 is an octahedron and the corresponding Si106 H48 with step reconstruction is a tetrahedron.
corresponds to a cuboctahedron, which is enclosed by the (111) and (100) facets with dimer reconstructions. The Si25 H20 can be obtained from Si35 H36 by deleting one or three Si atoms at every corner [marked as the orange balls in Fig. 1(a)] coupled with the corresponding dimer reconstructions. Generally, this kind of reconstruction will reduce the numbers of both Si and H atoms [by one (three) Si atoms and two (four) H atoms for the case of going from Si35 H36 to Si25 H20 , respectively]. The dimer reconstructions on (100) facets remove x H atoms and y Si atoms simultaneously (where x = 1,3,7,13, . . . , while y = 2,4,4,6, . . . , respectively), and the H/Si ratio of H-SiNCs n−x will be reduced if m−y < mn , i.e., xy > mn . As shown in Fig. 1(b), Si68 H56 , Si84 H64 , and Si100 H72 are enclosed by the (111) facets and transformed into Si50 H32 , Si66 H40 , and Si82 H48 with the dimer reconstructions, which reduce the H/Si ratio from 0.82, 0.76, and 0.72 to 0.64, 0.61, and 0.59, respectively. Similarly, we have applied the dimer reconstructions on tetrahedron, hexahedron, and octahedron, in which the H/Si ratios are significantly reduced (shown in Fig. 2). 3. Step reconstructions on the (111) facet
Besides Si25 H20 , the Si20 H18 was found in our random searching, which has the C3v symmetry after surface reconstructions. We found that Si20 H18 can be obtained from the Si10 H16 by adding both Si and H atoms on the (111) facets to introduce step reconstructions. As shown in Fig. 1(a), 10 more Si atoms with nine H atoms can be added at the positions marked as pink atoms (deleting the corresponding seven H atoms) while the number of H atoms is only increased by two in all. Thus, the H/Si ratio is decreased from 1.6 to 0.9. The step reconstructions on (111) facets add x H atoms and y Si n+x atoms, and the H/Si ratio of H-SiNCs decreases if m+y < mn ,
FIG. 3. (Color online) The cohesive energies of H-SiNCs as a function of H/Si ratio. Inset shows the difference of Ecoh between the model predictions and DFT calculations.
i.e., xy < mn . In this case, we have xy = 0.2 and thus the H/Si ratio decreases when the initial H/Si ratio ( mn ) is greater than 0.2. As a result, Si50 H32 , Si66 H40 , and Si82 H48 can be further transformed into Si70 H36 , Si106 H48 , and Si142 H60 (shown in Fig. 1), leading the H/Si ratio from 0.64, 0.61, and 0.59 to 0.51, 0.45, and 0.42, respectively. We have also applied the step reconstructions on H-SiNCs with various shape and size, which further reduce the H/Si ratio (shown in Fig. 2). Note that the reconstruction has a stronger effect than the shape, and H-SiNCs with the local minimum of H/Si ratio can be tetrahedron, hexahedron, and octahedron. To achieve the lower H/Si ratio, the step reconstructions on the (111) facets will be dominant for H-SiNCs with the H/Si ratio greater than 0.2. B. Stability of H-SiNCs
We have constructed the possible H-SiNCs with low H/Si ratio according to the symmetry and typical surface reconstructions (as shown above). In the following, we perform the DFT calculations and determine the stabilities of these H-SiNCs. The cohesive energy Ecoh per Si (of single-atom Si) in nanocrystals Sim Hn is defined as Ecoh = (mESi0 + nEH0 − Etot )/m, where Etot is the total energy of the system, and ESi0 (EH0 ) is the energy of the isolated Si (H) atom. According to our previous studies, the cohesive energies can be calculated as Ecoh = 2ESi-Si − (0.5ESi-Si − ESi-H )α, where α is the ratio of H/Si( mn ), and ESi-Si and ESi-H are the Si-Si and Si-H bond energies, respectively. Figure 3 shows the variations of Ecoh as a function of the H/Si ratio of H-SiNCs with various shape, size, and surface reconstructions. In accordance with the formula, the cohesive energy presents closely to a linear relationship with the H/Si ratio, though there are a few points slightly deviated from the line. As shown in the inset, the differences of Ecoh between the model analysis and DFT calculations are in the range of 0.05 eV for the H-SiNCs without surface reconstructions. The differences increase after the dimer and step reconstructions, since they deviate from the
085440-3
HONGDO LU, YU-JUN ZHAO, XIAO-BAO YANG, AND HU XU
(a) Formation Energy(eV/atom)
-1
=
=
=
=
-2
-3
-4
50
100
150
200
Number of Silicon atoms
(b)
-549
Si68H56
-550 -551
Total Energies(eV)
ideal sp3 hybridizations of the surface Si atoms by changing the Si-Si bond angles. To investigate how the environment affects the stability of H-SiNCs, we define the formation energy as a function of hydrogen chemical potential (μH ), i.e., Ef = (Etot − nμH )/m. Specifically, we have Ef = −2ESi-Si + α(0.5ESi-Si − ESi-H − μH ) in our model. According to our earlier study, the stable NCs have a low H/Si ratio when μH < μ0 = 0.5ESi-Si − ESi-H ≈ −2.3 eV,22 as the cohesive energy has the perfect linear dependence on the H/Si ratio. However, the reconstructed Si-NCs have a lower H/Si ratio and the reconstruction will also affect the cohesive energies and formation energies. Figure 4(a) shows the variations of Ef as a function of μH in the range from −5 to −2.3 eV. It indicates that these NCs possess the lowest formation energies when μH = −2.3 eV, and the highest formation energies when μH = −5 eV. Here the stable H-SiNCs are indicated by the convex hull (marked by solid lines for μH = −2.3,−3.0,−4.0,−5.0 eV). For example, Si25 H20 , Si50 H32 , Si70 H36 , Si106 H48 , and Si142 H60 are stable when μH = −5 eV, while Si106 H48 and Si142 H60 are not stable compared to Si118 H60 at μH = −4 eV, and Si82 H48 is more stable than Si70 H36 at μH = −3 eV. We also present the μH range for stable H-SiNCs in the inset graph of Fig. 4. For Si25 H20 and Si50 H32 , there is a large range of μH in which the formation energies are local minima, i.e., μH is in the range of −5.0 to −2.45 eV and −5.0 to −2.6, respectively. Si70 H36 , Si106 H48 , and Si142 H60 with step reconstructions are stable in the range of lower μH , −5.0 to −3.65 eV, −5.0 to −4.25 eV, and −5.0 to −4.1 eV, respectively. Si118 H60 and Si82 H48 with dimer reconstructions are stable in the higher range of μH , −4.25 to −2.9 eV and −3.65 to −2.6 eV. Note that Si100 H60 with the symmetry of icosahedrons (predicted in Ref. 9) is stable in the narrow μH range of −2.75 to −2.6 eV. As shown in the inset of Fig. 4(a), we could approximately divide the phase diagram into three regions, in which the SiNCs have the surface dominated by no reconstructions, dimer, and step reconstructions, respectively. For SiNCs with a similar number of Si atoms, the surface prefer no reconstructions at high μH , and gradually form dimer and step reconstructions as μH decreases. At a given μH , SiNCs prefer surface reconstructions for small size while the ones with no reconstructions are more stable as the size increases. The formation energies, determining the stability of HSiNCs, depend on both Etot and μH . Without surface reconstructions, Etot can be expressed analytically by the number of Si and H atoms, and thus H-SiNCs with lower H/Si ratio are more stable for low μH . According to the inequalities analysis, surface reconstructions will lower the H/Si ratio significantly. Meanwhile, the Si-Si bonding is weaker for the reconstructed surface than that in bulk Si due to the deviation of ideal sp3 hybridizations, and Etot is higher (from DFT calculations) than that predicted by the model using ESi-Si and ESi-H . When μH is high, the contribution of Etot to Ef is more important and the H-SiNCs without reconstructions are more stable. As μH decreases, corresponding to higher temperatures and lower pressures, the contribution of μH on Ef becomes more important and the H-SiNCs with fewer H atoms will be more stable. Considering μH in the range from −5 to −2.3 eV, there is a general evolution of stable H-SiNCs as μH decreases:
PHYSICAL REVIEW B 86, 085440 (2012)
-552
Si50H32
-369 -370 -371
Si70H36
-481 -482 -483 1000
2000
3000
4000
5000
Steps
FIG. 4. (Color online) (a) The variation of formation energy at different hydrogen chemical potentials in the range from −5.0 to −2.3 eV with an interval of 0.05 eV. The stable H-SiNCs are indicated by the convex hull and the ones for μH = −5.0,−4.0,−3.0,−2.3 eV are shown as examples (marked by solid lines). The inset shows the μH range for stable H-SiNCs as a function of the number of Si atoms. The regions marked by blue, green, and red correspond to the SiNCs with surface dominated by no reconstructions, dimer, and step reconstructions, respectively. (b) The variations of total energies of SiQDs as a function of steps from the first-principles molecular dynamic simulations.
enclosed by (111) facets without reconstructions → (100) dimer reconstructions → (111) step reconstructions. H-SiNCs with (111) step reconstructions possess the lowest H/Si ratio and thus are stable when μH is low enough. As mentioned in Sec. III A, the step reconstructions on the (111) facets will be dominant if the H/Si ratio is larger than 0.2, verified by firstprinciples calculations. The shape of stable H-SiNCs can be varied from a slice, to a tetrahedron, to a hexahedron: Si50 H32 , Si66 H40 , and Si82 H48 are the corresponding ones for (100) dimer reconstructions while Si70 H36 , Si100 H48 , and Si142 H60 are the corresponding ones under (111) step reconstructions. To check for the dynamical stability of SiQDs, we performed the first-principles molecular dynamic simulations with the temperature at 300 K and a time step of 1 fs. We selected Si68 H56 , Si50 H32 , and Si70 H36 , which were the
085440-4
THEORETICAL INVESTIGATION OF STRUCTURAL . . .
PHYSICAL REVIEW B 86, 085440 (2012)
representative structures for the unreconstructed SiQDs and the ones with dimer/step reconstructions. All these structures remained stable without significant deformation after 5 ps at room temperature. The variations of total energies as a function of steps are shown in Fig. 4(b).
In the following, the electronic properties of stable H-SiNCs (see Fig. 5) are investigated. As shown in the inset of Fig. 5(a), the gap values are approximately proportional to the H/Si ratio, for H-SiNCs without surface reconstructions. Thus, the gap values are inversely proportional to the dot size. For example, the gap values of Si68 H56 , Si84 H64 , and Si100 H72 are 2.85, 2.76, and 2.51 eV, respectively. With dimer and step reconstructions, the gap values decrease significantly as well as the H/Si ratio. For example, the gap value of Si84 H64 is 2.76 eV and it is 1.95 eV for Si66 H40 with (100) dimer reconstructions, which is reduced to 1.40 eV for Si106 H48 with (111) step reconstructions. Similarly, the gap values of Si68 H56 and Si100 H72 change from 2.85 and 2.51 eV to 2.09 and 2.31 eV after the dimer reconstructions, leading to a further reduction to 1.34 and 1.29 eV under the step reconstructions, respectively. The surface reconstructions play a more important role in modulating the gap values than the size, in agreement with earlier reports in Ref. 7. In addition, the gaps of small SiQDs were obtained by the calculations with the functional of HSE06. As shown in Fig. 5(a), we linked the results of the same SiQDs from DFT-GGA/PW91 and HSE06 with the dot lines. The variation trends of gaps on the H/Si ratio are similar for the two methods. The ones from HSE06 are of high accuracy, while the ones from DFT-GGA/PW91 are underestimated, with the differences about 0.5–0.8 eV. For example, the calculated gaps of Si84 H64 , Si66 H40 , and Si106 H48 were found to be 3.39, 2.52, and 1.92 eV for HSE06, and 2.77, 1.95, and 1.40 eV for DFT-GGA/PW91, respectively. Figure 5(b) shows the charge distributions of highest-occupied molecular orbitals (HOMOs) and lowest-unoccupied molecular orbitals (LUMOs) for various H-SiNCs. Si68 H56 , Si84 H64 , and Si100 H72 are enclosed by (111) facets without reconstructions, where both HOMOs and LUMOs are localized to the inside of the nanocrystal. After (100) dimer reconstruction, HOMOs of Si50 H32 are distributed on the edge and LUMOs remain inside. However, HOMOs of Si70 H36 are concentrated inside and LUMOs are distributed on the edge after (111) step reconstruction. For the tetrahedron Si66 H40 , both HOMOs and LUMOs are distributed on the surface near the dimer reconstructions while HOMOs of Si106 H48 are concentrated inside and LUMOs are distributed near the step reconstruction region, after (111) step reconstructions. For the hexahedron Si82 H48 and Si142 H60 , HOMOs are localized inside and LUMOs distributed on the surface near the dimer/step reconstructions. The reconstruction not only changes the stability, but also modulates the electronic properties of silicon NCs, such as reducing the gap values and inducing the charge separations of HOMOs and LUMOs. In most cases, LUMOs are distributed on the surface near the reconstructions. It has been reported13 that partial strains on the Si nanorod will shift LUMOs in
5
Tetra. Hexa. Octa. No Rec. 5 Dimer Step 4 calculated with HSE06 3
Gap(e eV)
C. Electronic properties of H-SiNCs
(a) 6
4
2
0.3
0.6
0.9
1.2
1.5
1.8
H/Si ratio
3
2
50
100
150
200
250
300
Number of Silicon atoms
(b)
FIG. 5. (Color online) (a) The gap values’ variation of H-SiNCs as a function of size, shape, and surface reconstructions. Inset shows the dependence of gap values on the H/Si ratio; (b) charge distribution of HOMO and LUMO orbital of H-SiNCs. Charge density isosurfaces [blue (dark gray) and red (gray)] represent 50% peak amplitude.
the area under tension while HOMOs remain in the unstrained area. For a reconstructed surface, the length of Si-Si bonding is larger than that in bulk Si, corresponding to the tension effect.
085440-5
HONGDO LU, YU-JUN ZHAO, XIAO-BAO YANG, AND HU XU
PHYSICAL REVIEW B 86, 085440 (2012)
Thus, modulating the surface morphologies with the control of hydrogen chemical potential can be used for inducing the charge separation, which would enhance the efficiency of the photovoltaics nanodevice.
and step reconstructions can modulate the charge distributions and induce the spatial separation of near-gap levels, which provides a new avenue for designing electronic nanodevices by modulating the surface morphologies with the control of hydrogen chemical potential.
IV. CONCLUSION
We have demonstrated the stability evolution of H-SiNCs with various sizes and morphologies as a function of hydrogen chemical potential, according to the model analysis and firstprinciples calculations. It is found that surface reconstructions have great effect on the stability of H-SiNCs. With high μH , the H-SiNCs enclosed by (111) facets without reconstructions are stable while the H-SiNCs with dimer and step reconstructions are more stable for lower μH . The shape of stable HSiNCs can be varied from a slice, to a tetrahedron, to a hexahedron, enclosed by (100) and (111) facets with dimer and step reconstructions. In addition, we found the dimer
This work was supported by MOST under Project No. 2010CB631302, NSFC (Grant No. 11104080), the Fundamental Research Funds for the Central Universities (Grant No. 2011ZM0090), and Guangdong Natural Science Foundation (S2011040005430). The computing resources of the HPC Lab, Shenzhen Institute of Advanced Technology, Chinese Academy of Sciences (CAS), and of ScGrid of the Supercomputing Center, Computer Network Information Center of CAS, are gratefully acknowledged.
*
15
[email protected] [email protected] 1 ¨ gu¨ t, J. R. Chelikowsky, and S. G. Louie, Phys. Rev. Lett. 79, S. O˘ 1770 (1997). 2 C. S. Garoufalis, A. D. Zdetsis, and S. Grimme, Phys. Rev. Lett. 87, 276402 (2001). 3 T. van Buuren, L. N. Dinh, L. L. Chase, W. J. Siekhaus, and L. J. Terminello, Phys. Rev. Lett. 80, 3803 (1998). 4 L. Pavesi, L. Dal Negro, C. Mazzoleni, G. Franzo, and F. Priolo, Nature 408, 440 (2000). 5 G. Belomoin, J. Therrien, A. Smith, S. Rao, R. Twesten, S. Chaieb, M. H. Nayfeh, L. Wagner, and L. Mitas, Appl. Phys. Lett. 80, 841 (2002). 6 Y. Zhao, Y.-H. Kim, M.-H. Du, and S. B. Zhang, Phys. Rev. Lett. 93, 015502 (2004). 7 A. Puzder, A. J. Williamson, F. A. Reboredo, and G. Galli, Phys. Rev. Lett. 91, 157405 (2003). 8 A. D. Zdetsis, Phys. Rev. B 76, 075402 (2007). 9 S. G. Hao, D. B. Zhang, and T. Dumitric˘a, Phys. Rev. B 76, 081305 (2007). 10 T. Strother, W. Cai, X. S. Zhao, R. J. Hamers, and L. M. Smith, J. Am. Chem. Soc. 122, 1205 (2000). 11 Y. He, Y. Su, X. Yang, Z. Kang, T. Xu, R. Zhang, C. Fan, and S.-T. Lee, J. Am. Chem. Soc. 131, 4434 (2009). 12 Z. Wu, J. B. Neaton, and J. C. Grossman, Phys. Rev. Lett. 100, 246804 (2008). 13 Z. G. Wu, J. B. Neaton, and J. C. Grossman, Nano Lett. 9, 2418 (2009). 14 T. L. Chan, C. V. Ciobanu, F. C. Chuang, N. Lu, C. Z. Wang, and K. M. Ho, Nano Lett. 6, 277 (2006). †
ACKNOWLEDGMENTS
N. Lu, C. V. Ciobanu, T.-L. Chan, F.-C. Chuang, C.-Z. Wang, and K.-M. Ho, J. Phys. Chem. C 111, 7933 (2007). 16 Y. Zhao and B. I. Yakobson, Phys. Rev. Lett. 91, 035501 (2003). 17 A. S. Barnard and P. Zapol, J. Chem. Phys. 121, 4276 (2004). 18 R. Kagimura, R. W. Nunes, and H. Chacham, Phys. Rev. Lett. 95, 115502 (2005). 19 J. F. Justo, R. D. Menezes, and L. V. C. Assali, Phys. Rev. B 75, 045303 (2007). 20 P. B. Sorokin, P. V. Avramov, A. G. Kvashnin, D. G. Kvashnin, S. G. Ovchinnikov, and A. S. Fedorov, Phys. Rev. B 77, 235417 (2008). 21 H. Xu, X. B. Yang, C. S. Guo, and R. Q. Zhang, Appl. Phys. Lett. 95, 253106 (2009). 22 X. B. Yang, Y. J. Zhao, H. Xu, and B. I. Yakobson, Phys. Rev. B 83, 205314 (2011). 23 G. Kresse and J. Furthm¨uller, Phys. Rev. B 54, 11169 (1996). 24 G. Kresse and D. Joubert, Phys. Rev. B 59, 1758 (1999). 25 P. J. Stephens, F. J. Devlin, C. F. Chabalowski, and M. J. Frisch, J. Phys. Chem. 98, 11623 (1994). 26 J. Heyd, G. E. Scuseria, and M. Ernzerhof, J. Chem. Phys. 118, 8207 (2003). 27 J. Paier, M. Marsman, K. Hummer, G. Kresse, I. C. Gerber, and J. G. Angyan, J. Chem. Phys. 125, 249901 (2006). 28 J. Heyd, G. E. Scuseria, and M. Ernzerhof, J. Chem. Phys. 124, 219906 (2006). 29 U. Itoh, Y. Toyoshima, H. Onuki, N. Washida, and T. Ibuki, J. Chem. Phys. 85, 4867 (1986). 30 See Supplemental Material at http://link.aps.org/supplemental/ 10.1103/PhysRevB.86.085440 for coordinates of the relaxed structures.
085440-6