and engine oil (Pennzoil 10W-30). The powders are blended in a blender for one-half an hour and then are placed in an ultrasonic bath for another half an hour ...
JOURNAL OF THERMOPHYSICS AND HEAT TRANSFER Vol. 13, No. 4, October– December 1999
Thermal Conductivity of Nanoparticle– Fluid Mixture Xinwei Wang¤ and Xianfan Xu† Purdue University, West Lafayette, Indiana 47907 and Stephen U. S. Choi‡ Argonne National Laboratory, Argonne, Illinois 60439 Effective thermal conductivity of mixtures of uids and nanometer-size particles is measured by a steady-state parallel-plate method. The tested uids contain two types of nanoparticles, Al2 O3 and CuO, dispersed in water, vacuum pump uid, engine oil, and ethylene glycol. Experimental results show that the thermal conductivities of nanoparticle– uid mixtures are higher than those of the base uids. Using theoretical models of effective thermal conductivity of a mixture, we have demonstrated that the predicted thermal conductivities of nanoparticle– uid mixtures are much lower than our measured data, indicating the de ciency in the existing models when used for nanoparticle– uid mixtures. Possible mechanisms contributing to enhancement of the thermal conductivity of the mixtures are discussed. A more comprehensive theory is needed to fully explain the behavior of nanoparticle– uid mixtures.
Nomenclature cp k L Pe qP r S T U ® ¯ ° ½ Á
= = = = = = = = = = = = = =
high thermal conductivity.2 Because the thermal conductivities of most solid materials are higher than those of liquids, thermal conductivitiesof particle– uid mixtures are expectedto increase.Fluids with higher thermal conductivities would have potentials for many thermal management applications.Because of the very small size of the suspended particles, nanoparticle– uid mixtures could be suitable as heat transfer uids in many existing heat transfer devices, includingthose miniature devices in which sizes of componentsand ow passages are small. Furthermore, because of their small sizes, nanoparticles also act as a lubricating medium when they are in contact with other solid surfaces.3 Heat transfer enhancement in a solid– uid two-phase ow has been investigated for many years. Research on gas– particle ow 4¡7 showed that by adding particles, especially small particles in gas, the convection heat transfer coef cient can be greatly increased. The enhancement of heat transfer, in addition to the possible increase in the effective thermal conductivity, was mainly due to the reduced thickness of the thermal boundary layer. In the processes involving liquid– vapor phase change, particles may also reduce the thickness of the gas layer near the wall. The particles used in the previous studies were on the scale of a micrometer or larger. It is very likely that the motion of nanoparticles in the uid will also enhance heat transfer. Therefore, more studies are needed on heat transfer enhancement in nanoparticle– uid mixtures. Thermal conductivitiesof nanoparticle– uid mixtures have been reported by Masuda et al.,8 Artus,9 and Eastman et al.10 Adding a small volume fraction of metal or metal oxide powders in uids increased the thermal conductivities of the particle– uid mixtures over those of the base uids. Pak and Cho11 studied the heat transfer enhancement in a circular tube, using nanoparticle– uid mixtures as the owing medium. In their study, ° -Al2 O3 and TiO2 were dispersed in water, and the Nusselt number was found to increase with the increasing volume fraction and Reynolds number. In this work, Al2 O3 and CuO particles measuring approximately 20 nm are dispersed in distilled (DI) water, ethylene glycol, engine oil, and vacuum pump uid. Thermal conductivities of the uids are measured by a steady-state parallel-plate technique. Several theoreticalmodels for computing effectivethermal conductivity of composite materials are used to explain the thermal conductivity increase in these uids. Results obtained from the calculations are compared with the measured data to evaluate the validity of the effective thermal conductivity theories for liquids with nanometersize inclusions. Other possible microscopic energy transport mechanisms in nanoparticle– uid mixtures and the potentialapplications of these uids are discussed.
speci c heat thermal conductivity thickness Peclet number input power to heater 1 radius of particle cross-sectional area temperature velocity of particles relative to that of base uids ratio of thermal conductivity of particle to that of base liquid .® ¡ 1/=.® ¡ 2/ shear rate of ow density volume fraction of particles in uids
Subscripts
e f g p r t
I
= = = = = =
effective property base uid property glass spacer particles rotational movement of particles translational movement of particles
I.
Introduction
N recent years, extensive research has been conducted on manufacturing materials whose grain sizes are measured in nanometers. These materials have been found to have uniqueoptical, electrical, and chemical properties.1 Recognizing an opportunity to apply this emerging nanotechnology to established thermal energy engineering, it has been proposed that nanometer-sized particles could be suspended in industrial heat transfer uids such as water, ethylene glycol, or oil to produce a new class of engineered uids with
Received 17 February 1999; revision received 7 June 1999; accepted for c 1999 by the American Institute of publication 8 June 1999. Copyright ° Aeronautics and Astronautics, Inc. All rights reserved. ¤ Graduate Research Assistant, School of Mechanical Engineering. † Assistant Professor, School of Mechanical Engineering. ‡ Mechanical Engineer, Energy Technology Division, 9700 South Cass Avenue. 474
475
WANG, XU, AND CHOI
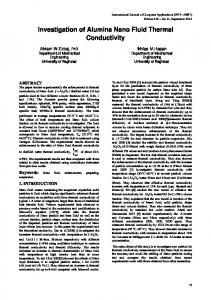
II. Measurement of Thermal Conductivity of Nanoparticle– Fluid Mixtures Two basic techniques are commonly used for measuring thermal conductivitiesof liquids, the transient hot-wire method and the steady-state method. In the present experiments, the one-dimensional, steady-state parallel-plate method is used. This method produces the thermal conductivity data from the measurement in a straightforwardmanner, and it requires only a small amount of liquid sample. Figure 1 shows the experimental apparatus, which follows the design by Challoner and Powell.12 The uid sample is placed in the volume between two parallel round copper (99.9% purity) plates, and the surface of the liquid is slightly higher than the lower surface of the upper copper plate. The surface of the liquid can move freely to accommodate the thermal expansion of the liquid. Any gas bubbles are carefullyavoided when the cell is lled with a liquid sample. The cross-sectionalarea of the top plate is 9.552 cm2 . The two copper plates are separatedby three small glass spacers with a thickness of 0.9652 mm each and a total surface area of 13.76 mm2 . To control the temperature surroundingthe liquid cell, the liquid cell is housed in a larger cell made of aluminum. The top copper plate is centered and separated from the inside wall of the aluminum cell. Holes of 0.89-mm diameter are drilled into the copper plates and the aluminum cell. E-type thermocouples (nickel– chromium/copper– nickel) are inserted into these holes to measure the temperatures. The locations of the thermocouples in the top and lower copper plates are very close to the lower surface of the upper plate and to the upper surface of the lower plate. Because the thermal conductivity of copper is much higher than that of the liquid, these thermocouples provide temperatures at the surfaces of the plates. A total of 14 thermocouples are used. In this work, although the absolute value of thermal conductivity is to be measured,there is no need to obtain the absolutetemperature. It is more important to measure accurately the temperature increase of each thermocoupleand to minimize the difference in temperature readings when the thermocouples are at the same temperature. It was found that the accuracy in measuring the temperature increase is better than 0.02± C. The differences in the thermocouple readings are recorded when the thermocouplesare at the same temperature in a water bath and are used as calibration values in later experiments. During the experiment, heater 1 provides the heat ux from the upper copper plate to the lower copper plate. Heater 4 is used to maintain the uniformity of the temperaturein the lower copper plate. Heaters 2 and 3 are used to raise the temperature of the aluminum cell to that of the upper copperplate to eliminateconvectionand radiation losses from the upper copper plate. Therefore, input powers to all of the heaters need to be carefully adjusted. During all measurements, the temperature difference between the upper copper plate and the inside wall of the aluminum cell is less than 0.05± C, and the temperature uniformity in the top and the bottom copper plates is better than 0.02± C. The temperature difference between the two copper plates varies between 1 and 3± C. All of the heat supplied by heater 1 ows through the liquid between the upper and the lower copper plates. Therefore, the overall thermal conductivity across the two copper plates, including the effect of the glass spacers, can be calculatedfrom the one-dimensional
Fig. 1 Experimental apparatus.
heat conduction equation relating the power qP of heater 1, the temperature difference 1T between the two copper plates, and the geometry of the liquid cell as k D .qP ¢ L g /=.S ¢ 1T /
(1)
where L g (0.9652 mm) is the thickness of the glass spacer between the two copper plates and S (9.552 cm2 ) is the cross-sectional area of the top copper plate. The thermal conductivity of the uid can be calculated as ke D
k ¢ S ¡ k g ¢ Sg S ¡ Sg
(2)
where k g (1.4 W/m ¢ K) and Sg are the thermal conductivity and the total cross-sectionalarea of the glass spacers, respectively. Experimental error is estimated by comparing the measured thermal conductivityof DI water and ethylene glycol with the published data.13 The absolute error for the thermal conductivitiesof both uids is less than §3%. The thermal conductivity of liquid changes with temperature. When a small temperature differencebetween the two copper plates is used, then the effect of the temperature variation is small. Using the thermal conductivity data of water, it is estimated that the maximum measurement uncertaintyin this work caused by the temperature variation across the liquid cell is 0.5%.
III.
Experimental Results
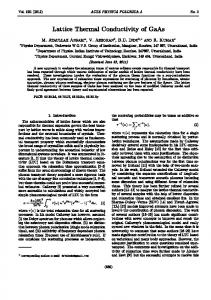
Nanometer-size Al2 O3 and CuO powders are obtained from Nanophase Technology Company (Burr Ridge, Illinois). The average diameter of the Al2 O3 powders (° phase) is 28 nm, and the average diameter of the CuO powders is 23 nm. The as-received powders are sealed and are dry and loosely agglomerated.The powders are dispersed into DI water, vacuum pump uid (TKO-W/7, Kurt J. Lesker Company, Clairton, Pennsylvania), ethylene glycol, and engine oil (Pennzoil 10W-30). The powders are blended in a blender for one-half an hour and then are placed in an ultrasonic bath for another half an hour for breaking agglomerates. A number of other techniques are used to disperse the powders in water and will be described later. The volume fraction of the powder in liquid is calculated from the weight of the dry powder and the total volume of the mixture. Absorption of water vapor could occur when the powders are exposed to air just before placing the powders into uids; however, the exposed surface of the powders is much smaller than the total surface of the powders. The error caused by water absorption in determining the volume fraction is negligible. Samples using water, pump uid, or engineoil as the base uid are stable when the volume fraction is less than 10%. No agglomeration is observed for a number of weeks (at room temperature). When the volume fraction is greater than 10%, the uid becomes occulated in the dispersion process. Samples using ethylene glycol as the base uid are stable up to a volume fraction of 16%. Unless otherwise noted, samples are prepared without adjusting the pH value. Results of the thermal conductivity of Al2 O3 dispersions at the room temperature(297 K) are shown in Fig. 2a. Figure 2b shows the ratios of the thermal conductivity of the mixture ke to the thermal conductivityof the correspondingbase uid k f . For all of the uids, the thermal conductivity of the mixture increases with the volume fraction of the powder. However, for a given volume fraction, the thermal conductivityincreases are different for different uids. The increases in ethylene glycol and engine oil are the highest, whereas that in the pump uid is the lowest, about half of that in ethylene glycol and engine oil. The effectivethermal conductivityof ethylene glycol increases 26% when approximately 5 vol% of Al2 O3 powders are added, and it increases 40% when approximately8 vol% of Al2 O3 powders are added. Figures 3a and 3b show thermal conductivities of CuO dispersionsin water and in ethylene glycol. For both uids, thermal conductivityratio increases with the volume fraction with the same linearity. To examine the effect of different sample preparationtechniques, Al2 O3 powders are dispersed in water using three different techniques. Mechanical blending (method 1), coating particles with
476
WANG, XU, AND CHOI
Fig. 2a Thermal conductivityas a function of volumefraction of Al 2 O3 powders in different uids.
Fig. 2b Thermal conductivity ratio as a function of volume fraction of Al2 O3 powders in different uids.
Fig. 4 Thermal conductivity of Al2 O3 – water mixtures prepared by three different methods.
polymers (method 2), and ltration (method 3) are used. Method 1, used for preparing all of the samples described earlier, employs a blending machine and an ultrasonic bath. The resulting solutions contain both separated individual particles and agglomerations of several particles.Particles with diameters larger than 1 ¹m also exist among the as-received powders and, therefore, also in the solution made by method 1. For method 2, polymer coatings (styrene-maleic anhydride, »5000 mol wt, 2.0% by weight) are added during the blending process to keep the particles separated.The pH value must be kept at 8.5– 9.0 to keep the polymer fully soluble; therefore, ammonium hydroxide is added. In method 3, ltration is used to remove particles with diameters larger than 1 ¹m. The calculation of the volume fraction of the particles has taken into account the reduction of the particle volume due to the removal of large particles. Thermal conductivities of these Al2 O3– water solutions are shown in Fig. 4. As for the sample prepared by method 2, its thermal conductivity is compared with that of the uid with the same volume fraction of polymers and base, which is about 2% lower than that of DI water. The decrease in thermal conductivity due to the addition of polymers is smaller than the measurement uncertainty because the volume concentration of the polymer is small. From Fig. 4, it is seen that the solution made with method 3 has the greatest thermal conductivity increase (12% with 3 vol% particles in water), but that it is still lower than the thermal conductivityincrease when the same volume fraction of Al2 O3 is dispersed in ethylene glycol.
IV.
Fig. 3a Thermal conductivity as a function of volume fraction of CuO powders in ethylene glycol and water.
A.
Fig. 3b Thermal conductivity ratio as a function of volume fraction of CuO powders in ethylene glycol and water.
Discussion
In this section, thermal conductivitiesof nanoparticle– uid mixtures measured in this work are rst compared with experimental data reported in the literature. Effective thermal conductivity theories in the literature are used to compute the thermal conductivityof the mixtures. Results calculated from the effective thermal conductivity theories are compared with the measured data. Other possible transport mechanisms and potential applications of nanoparticle– uid mixtures are discussed. Comparison of Present and Earlier Experimental Data
The results shown in Figs. 2 and 3 differ from the data reported in the literature. For example, Masuda et al.8 reported that Al2 O3 particles at a volume fraction of 3% can increase the thermal conductivity of water by 20%. Lee et al.14 obtained an increase of only 8% at the same volume fraction, whereas the increase in the present work is about 12%. The mean diameter of Al2 O3 particles used in the experiments of Masuda et al.8 was 13 nm, that in the experiments of Lee et al.14 was 38 nm, and that in the present experiments was 28 nm. Therefore, the discrepancy in thermal conductivity might be due to the particle size. It is possible that the effective thermal conductivity of nanoparticle– uid mixtures increases with decreasing particle size, which suggests that nanoparticle size is important in enhancing the thermal conductivity of nanoparticle– uid mixtures. Another reason for the signi cant differences is that Masuda et al.8 used a high-speed shearing dispenser (up to approximately
477
WANG, XU, AND CHOI
20,000 rpm). Lee et al.14 did not use such equipment and, therefore, nanoparticles in their uids were agglomerated and larger than those used by Masuda et al.8 In the present experiments, the techniques used to prepare the mixtures are different from those used by Masuda et al.8 and Lee et al.14 This comparison, together with the data shown in Fig. 4, shows that the effectivethermal conductivityof nanoparticle– uid mixtures depends on the preparation technique, which might change the morphology of the nanoparticles. Also, in the work of Masuda et al.,8 acid (HCl) or base (NaOH) was added to the uids so that electrostatic repulsive forces among the particles kept the powders dispersed.Such additives,althoughlow in volume, may change the thermal conductivity of the mixture. In this work, acid or base are not used in most of the samples (except the one with polymer coatings) because of concerns of corrosions by the acid or base. B. Comparison of Measured Thermal Conductivity of Nanoparticle– Fluid Mixtures with Theoretical Results
Thermal conductivitiesof composite materials have been studied for more than a century. Various theories have been developed to compute the thermal conductivity of two-phase materials based on the thermal conductivityof the solid and the liquid and their relative volume fractions. Here, the discussions are focused mainly on the theories for statistically homogeneous, isotropic composite materials with randomly dispersed spherical particles having uniform particle size. Table 1 summarizes some equations frequently used in the literature.15¡20 Maxwell’s equation,15 shown in Table 1, was the rst theoretical approach used to calculate the effective electrical conductivity of a random suspension of spherical particles. Because of the identical mathematical formulations, computations of electrical conductivity of mixtures are the same as computations of thermal conductivity, dielectric constant, and magnetic permeability. Maxwell’s results are valid for dilute suspensions, that is, the volume fraction Á ¿ 1, or, to the order 0.Á 1 /. A second-order formulation extended from the Maxwell’s result was rst developed by Jeffrey16 and later modi ed by several authors. No higher-order formulations have been reported. Bonnecaze and Brady’s numerical simulation19;20 considered far- and near- eld interactions between multiple particles. They showed that for random dispersions of spheres, their simulation results agreed with Jeffrey’s equation16 up to a volume fraction of 20%, whereas Maxwell’s equation15 gave results within 3% of their calculationfor a conductivityratio ® D 10 and within 13% when ® D 0:01, up to a volume fraction of 40%. For high-volume fractions (Á > 60%), the theoretical equations are generally not applicable because the near- eld interactions among particles that produce a larger k e at high-volume fractions are not considered. The equations in Table 1 have been successfully veri ed by experimental data for mixtures with large particles and low concentraTable 1
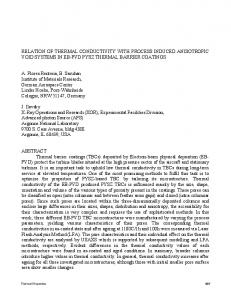
tions. The difference between the measured data and the prediction is less than a few percent when the volume fraction of the dispersed phase is less than 20% (Ref. 20). The experimental data in the comparison included those obtained by Turner21 on the electrical conductivity of 0.15-mm or larger solid particles uidized by aqueous sodium chloride solutions and those obtained by Meredith and Tobias22 on electrical conductivity of emulsions of oil in water or water in oil with droplet sizes between 11 and 206 ¹m. Therefore, these effective thermal conductivities can accurately predict the thermal conductivity of particle– uid mixtures when the particle size is larger than tens of micrometers. The effective thermal conductivity equations shown in Table 1 are used to compute the thermal conductivity of the nanoparticle– uid mixtures made in this work. The computed results of Al2 O3– ethylene glycol are shown in Figs. 5a and 5b, together with the measureddata. From Figs. 5a and 5b, it can be seen that the measured thermal conductivity is greater than the value calculated using the effective thermal conductivity theories.
a)
b) Fig. 5 Measured thermal conductivities of Al2 O3 – ethylene glycol mixtures vs effective thermal conductivities calculated from theories: a) = 10 and b) = 1 .
Summary of theories of effective thermal conductivity of a mixture
Investigator
Expressionsa
Remarks
Maxwell15
ke 3.® ¡ 1/Á D1C kf .® C 2/ ¡ .® ¡ 1/Á
1) Equation derived from electric permeability calculation 2) Accurate to order Á 1 , applicable to Á ¿ 1 or j® ¡ 1j ¿ 1
Jeffrey 16
Davis17
Lu and Lin18
Bonnecaze and Brady19;20 a
ke 3¯ 2 9¯ 3 ® C 2 3¯ 4 D 1 C 3¯Á C Á 2 3¯ 2 C C C 6 C ¢¢¢ kf 4 16 2® C 3 2 ke 3.® ¡ 1/ D1C [Á C f .®/Á 2 C 0.Á 3 /] kf .® C 2/ ¡ .® ¡ 1/Á ke D 1 C a ¢ Á C b ¢ Á2 kf
N/A
1) Accurate to order Á2 ; high-order terms represent pair interactions of randomly dispersed spheres 1) Accurate to order Á2 ; high-order terms represent pair interactions of randomly dispersed spheres 2) f .®/ D 2:5 for ® D 10; f .®/ D 0:50 for ® D 1
1) Near- and far- eld pair interactions are considered, applicable to nonspherical inclusions 2) For spherical particles, a D 2:25, b D 2:27 for ® D 10; a D 3:00, b D 4:51 for ® D 1 1) Numerical simulation, expressions not given 2) Near- and far- eld interactions among two or more particles are considered
Effective thermal conductivity of the mixture ke , thermal conductivity of the uid k f , ratio of thermal conductivity of particle to thermal conductivity of uid ®, and volume fraction of particles in uid Á.
478
WANG, XU, AND CHOI
In the calculation, the thermal conductivity of Al2 O3 nanoparticles is taken as 2.5 W/m ¢ K (® D 10), lower than its bulk value of 36 W/m ¢ K. No thermal conductivity data of the ° -Al2 O3 nanoparticles are available. It is known that in the micro- and nanoscale regime the thermal conductivity is lower than that of the bulk materials. For example, it was found, through solving the Boltzmann transportequationof heat carrier in the host medium, that heat transfer surroundinga nanometer-sizeparticlewhose mean free path is on the order of its physical dimension is reduced and localized heating occurs.23 The mean free path in polycrystalline Al2 O3 is estimated to be around 5 nm. Although the mean free path is smaller than the diameter of the particles, the ° -phase Al2 O3 particles used in this work consist of highly distorted structures. Therefore, it is expected that the mixture’s thermal conductivity is reduced. On the other hand, from Fig. 5b, it can be seen that the measured thermal conductivityof the mixture is greater than the value calculated using the effective thermal conductivity theories even when the thermal conductivity of Al2 O3 is taken as in nity. Therefore, the theoretical models, which compared well with the measurements of dispersions with large size (micrometer or larger) particles, underpredict the thermal conductivity increase in nanoparticle– uid mixtures. This suggests that all of the current models, which only account for the differences between thermal conductivity of particles and uids, are not suf cient to explain the energy transfer processes in nanoparticle– uid mixtures. C. Mechanisms of Thermal Conductivity Increase in Nanoparticle– Fluid Mixtures
In nanoparticle– uid mixtures, other effects such as the microscopic motion of particles,particle structures,and surface properties may cause additional heat transfer in the uids. These effects are discussed as follows. 1. Microscopic Motion
Because of the small size of the particles in the uids, additional energy transport can arise from the motions induced by stochastic (Brownian) and interparticle forces. Motions of particles cause microconvection that enhances heat transfer. In all of the effective conductivity models discussed earlier, the particles are assumed to be stationary when there is no bulk motion of the uids, which is true when the particle is large. In nanoparticle– uid mixtures, microscopic forces can be signi cant. Forces acting on a nanometersize particle include the Van der Waals force, the electrostatic force resulting from the electric double layer at the particle surface, the stochastic force that gives rise to the Brownian motion of particles, and the hydrodynamic force. Motions of the particles and uids are induced and affected by the collective effect of these forces. Notice that the stochastic force and the electrostatic force are signi cant only for small particles, whereas the Van der Waals force is high when the distance between particles is small. Therefore, there exists a relation between the effective thermal conductivity and the particle size, as observed by comparing the data obtained in this work with reported values. However, these forces have not been calculated accurately because they are strongly in uenced by the chemical properties of the particle surface and the hosting uid, the size distribution, and the con guration of the particle system. Little quantitative research has been done on the heat transfer enhancement by the microscopic motion induced by these forces. The heat transfer enhancement due to the Brownian motion can be estimated with the known temperature of the uid and the size of the particles. The increase of thermal conductivity due to the rotational motion of a spherical particle can be estimated as24 1k e;r D k f ¢ Á ¢
1:176.k p ¡ k f /2 .k p C 2k f /2
C 5 £ 0:6 ¡ 0:028
kp ¡ k f k p C 2k f
3
Pe 2f
(3)
where Pe f D .r 2 °½c p f = k f /, r is the radius of particle, ° is the velocity gradient calculated from the mean Brownian motion velocity and the average distance between particles, ½ is the base liquid density, and c p f is the speci c heat of base liquid. The thermal transport caused by the translational movement of particles was given by Gupte et al.25 In their study, the base liquid and particles were assumed to have identical thermal conductivity, density, and heat capacity.Their results are tted with a fourth-orderpolynomial as 1ke;t D 0:0556Pet C 0:1649Pe2t ¡ 0:0391Pe3t C 0:0034Pe4t k f (4) where the modi ed Peclet number is de ned as Pet D .U L½c p f = K f /Á 3=4 , U is the velocity of the particles relative to the base liquid, and L D .r =Á 1=3 / ¢ .4¼ =3/1=3 . The total increase in thermal conductivity by the Brownian motion of particles consists of the increases due to both translational and rotational motions. However, it can be seen from Eqs. (3) and (4) that the increasein thermal conductivityis small because of the small (modi ed) Peclet number, meaning that heat transferred by advection of the nanoparticles is less than that transferred by diffusion. In other words, when the particles move in liquid, the temperature of the particles quickly equilibrate with that of the surrounding uids due to the small size of the particles. Calculations based on Eqs. (3) and (4) show that up to a volume fraction of 10%, the thermal conductivity increase by the Brownian motion is less than 0.5% for the Al2 O3– liquid mixture. Therefore, the Brownian motion does not contribute signi cantly to the energy transport in nanoparticle– uid mixtures. It is dif cult to estimate the microscopic motions of particles caused by other microscopic forces and the effects of these forces on heat transfer. The surfaces of metal oxide particlesare terminated by a monolayer of hydroxyl (OH) when the particles are exposed to water or water vapor. This monolayer will induce an electric double layer,26 the thicknessof which varieswith the uids and the chemical properties of the particle surface. For weak electrolytic solutions, a typical double-layer thickness is between 10 and 100 nm (Ref. 27). Therefore, when the particle size is in the tens of nanometers, the thickness of the double layer is comparable to the size of the particle. On the other hand, for the uids used in this work whose particle volume fraction is a few percents, the average distance between particles is about the same as the particle size, in the tens of nanometers. For example, for 5 vol% Al2 O3 , the average distance between particles is about 33 nm. When the distance between the particles is as small as tens of nanometers, the Van der Waals force is signi cant. The electric double layer and the Van der Waals force could have strong electrokinetic effects on the movement of the nanoparticles and on the heat transport process. 2. Chain Structure
Studies of nanoparticles by transmission electron microscopy (TEM) show that the Al2 O3 particles used in this work are spherical. However, some particlesin the liquids are not separatedcompletely. Using TEM, it is found that some particles adhere together to form a chain structure. According to Hamilton and Crosser,28 heat transfer could be enhanced if the particles form chain structures because more heat is transportedalong those chains oriented along the direction of the heat ux. The effect of the particle size is not considered in their treatment. Assuming that an average chain consists of three particles, the thermal conductivity of particles is 10 times that of the base liquid, and there is 5 vol% particles in liquid, the thermal conductivity will increase 3% according to Hamilton and Crosser’s equation.28 If the thermal conductivity ratio is taken as in nity, the increase of thermal conductivity is about 7%. Therefore, it is possible that the chain structure contributes to a thermal conductivity increase in nanoparticle– uid mixtures. However, the actual particle structures in liquids may not be preserved when the TEM measurements are taken. Therefore, the effects of particle structures are not accurately determined. Currently, there are no techniques available for characterizing the structures of nanoparticles in liquid.
479
WANG, XU, AND CHOI
D. Viscosity of Nanoparticle– Fluid Mixtures and Applications of Nanoparticle– Fluid Mixtures for Heat Transfer Enhancement
Because of the increased thermal conductivity of nanoparticle– uid mixtures over the base liquids, nanoparticle– uid mixtures can be used for heat transfer enhancement. On the other hand, the viscosityof the mixtures should also be taken into accountbecause it is one of the parameters that determine the required pumping power of a heat transfer system. Figure 6 shows the relative viscosity of Al2 O3– water solutions dispersed by different techniques, that is, mechanical blending (method 1), coating particles with polymers (method 2), and ltration (method 3). These viscosity data are obtained with a precalibrated viscometer. It is seen that the solutions dispersed by methods 2 and 3 have lower viscosity, indicating that the particles are better dispersed. (It is a common practice to determine whether particles are well dispersed based on whether or not the viscosity value is minimized.29 ) The Al2 O3– water mixture shows a viscosity increase between 20 and 30% for 3 vol% Al2 O3 solutions compared to that of water alone. On the other hand, the viscosity of Al2 O3– water used by Pak and Cho11 was three times higher than that of water. This large discrepancy could be due to differences in the dispersion techniques and differences in the size of the particles. The viscosity of the Al2 O3– ethylene glycol solution is shown in Fig. 7. Compared with the Al2 O3– water solution, the Al 2 O3– ethylene glycol solution has a similar viscosity increase but a higher thermal conductivity increase. For laminar ow in a circular tube, the convection heat transfer coef cient is proportional to the thermal conductivity of the uid, whereas the pressure drop is proportional to viscosity. For turbulence ow in a circular tube, the pressure drop is proportional to ¹1=5 , whereas the convectionheat transfer coef cient is proportional to .k 2f =3 =¹0:467 / according to the Colburn’s equation (see Ref. 13). Using the measured thermal conductivity and viscosity data, the increase in pressure drop is found to be about the same as the increase in heat transfer for all of the uid– particle mixtures studied in this work. This estimation is based on the assumption that there are no other heat transfer mechanisms in the ow of the uids
with nanoparticles. With this assumption, the desirable heat transfer increase is offset by the undesirable increase in pressure drop. However, when uids with nanoparticles are owing in a channel, motions of particles also enhance heat transfer due to the decreased thermal boundarythickness,enhancementof turbulence,and/or heat conduction between nanoparticles and the wall as was found in the studies of gas– particle ow. Therefore, more studies are needed on convection heat transfer in uids with nanoparticles to justify the use of them as a heat transfer enhancement medium.
V.
Conclusions
The effectivethermal conductivitiesof uids with Al2 O3 and CuO nanoparticlesdispersedin water, vacuum pump uid, engine oil, and ethylene glycol are measured. The experimental results show that the thermal conductivities of nanoparticle– uid mixtures increase relative to those of the base uids. A comparison between the present experimental data and those of other investigatorsshows a possible relation between the thermal conductivity increase and the particle size: The thermal conductivity of nanoparticle– uid mixtures increases with decreasing the particle size. The thermal conductivity increase also depends on the dispersion technique. Using existing models for computing the effective thermal conductivity of a mixture, it is found that thermal conductivities computed by theoretical models are much lower than the measured data, indicating the de ciencies of the existing models in describing heat transfer at the nanometer scale in uids. It appears that the thermal conductivity of nanoparticle uid mixtures is dependent on the microscopicmotion and the particle structure.Any new models of thermal conductivityof liquids suspendedwith nanometer-sizeparticles should include the microscopic motion and structure-dependent behavior that are closely related to the size and surface properties of the particles. To use nanoparticle– uid mixtures as a heat transfer enhancementmedium, more studies on heat transfer in the uid ow are needed.
Acknowledgments Support of this work by the National Science Foundation (CTS9624890) and the U.S. Department of Energy, Of ce of Science, Laboratory Technology Research Program, under Contract W-31109-Eng-38, is acknowledged.
References 1 Gleiter,
Fig. 6 Relative viscosity of Al2 O3 – water mixtures dispersed by three different methods.
Fig. 7
Relative viscosity of Al2 O3– ethylene glycol mixtures.
H., “Nanocrystalline Materials,” Progress in Materials Science, Vol. 33, No. 4, 1989, pp. 223– 315. 2 Choi, U. S., “Enhancing Thermal Conductivity of Fluids with Nanoparticles,” Developments and Applications of Non-Newtonian Flows, edited by D. A. Siginer and H. P. Wang, Fluid Engineering Div.-Vol. 231, American Society of Mechanical Engineers, New York, 1995, pp. 99– 105. 3 Hu, Z. S., and Dong, J. X., “Study on Antiwear and Reducing Friction Additive of Nanometer Titanium Oxide,” Wear, Vol. 216, No. 1, 1998, pp. 92– 96. 4 Kurosaki, Y., and Murasaki, T., “Study on Heat Transfer Mechanism of a Gas– Solid Suspension Impinging Jet (Effect of Particle Sizes and Thermal Properties),” Proceedings of the Eighth International Heat Transfer Conference, Vol. 5, Hemisphere, Washington, DC, 1986, pp. 2587– 2592. 5 Murray, D. B., “Local Enhancement of Heat Transfer in a Particulate Cross Flow—1,” International Journal of Multiphase Flow, Vol. 20, No. 3, 1994, pp. 493– 504. 6 Avila, R., and Cervantes, J., “Analysis of the Heat Transfer Coef cient in a Turbulent Particle Pipe Flow,” International Journal of Heat and Mass Transfer, Vol. 38, No. 11, 1995, pp. 1923– 1932. 7 Ouyang, S., Li, X.-G., Davies, G., and Potter, O. E., “Heat Transfer Between a Vertical Tube Bundle and Fine Particles in a CFB Downcomer with and Without Circulation of Solids,” Chemical Engineering and Processing, Vol. 35, No. 1, 1996, pp. 21– 27. 8 Masuda, H., Ebata, A., Teramae, K., and Hishinuma, N., “Alteration of Thermal Conductivity and Viscosity of Liquid by Dispersing Ultra-Fine Particles (Dispersion of ° -Al2 O3 , SiO2 , and TiO2 Ultra-Fine Particles),” Netsu Bussei (Japan), Vol. 7, No. 4, 1993, pp. 227– 233. 9 Artus, R. G. C., “Measurements of the Novel Thermal Conduction of a Porphoritic Heat Sink Paste,” IEEE Transactions on Components, Packaging, and Manufacturing—Part B, Vol. 19, No. 3, 1996, pp. 601– 604.
480
WANG, XU, AND CHOI
10 Eastman, J. A., Choi, U. S., Li, S., Thompson, L. J., and Lee, S., “Enhanced Thermal Conductivity Through the Development of Nano uids,” Materials Research Society Symposium Proceedings, Vol. 457, Materials Research Society, Pittsburgh, PA, 1997, pp. 3– 11. 11 Pak, B. C., and Cho, Y. I., “Hydrodynamic and Heat Transfer Study of Dispersed Fluids with Submicron Metallic Oxide Particles,” Experimental Heat Transfer, Vol. 11, No. 2, 1998, pp. 151– 170. 12 Challoner, A. R., and Powell, R. W., “Thermal Conductivity of Liquids: New Determinations for Seven Liquids and Appraisal of Existing Values,” Proceedings of the Royal Society of London, Series A, Vol. 238, No. 1212, 1956, pp. 90– 106. 13 Incropera, F. P., and DeWitt, D. P., Fundamentals of Heat and Mass Transfer, 4th ed., Wiley, New York, 1996, pp. 445, 844, 846. 14 Lee, S., Choi, U. S., Li, S., and Eastman, J. A., “Measuring Thermal Conductivity of Fluids Containing Oxide Nanoparticles,” Journal of Heat Transfer (to be published). 15 Maxwell, J. C., Electricity and Magnetism, Part II, 3rd ed., Clarendon, Oxford, 1904, p. 440. 16 Jeffrey, D. J., “Conduction Through a Random Suspension of Spheres,” Proceedings of the Royal Society of London, Series A, Vol. 335, No. 1602, 1973, pp. 355– 367. 17 Davis, R. H., “The Effective Thermal Conductivity of a Composite Material with Spherical Inclusions,” International Journal of Thermophysics, Vol. 7, No. 3, 1986, pp. 609– 620. 18 Lu, S., and Lin, H., “Effective Conductivity of Composites Containing Aligned Spherical Inclusions of Finite Conductivity,” Journal of Applied Physics, Vol. 79, No. 9, 1996, pp. 6761– 6769. 19 Bonnecaze, R. T., and Brady, J. F., “A Method for Determining the
Effective Conductivityof Dispersions of Particles,” Proceedings of the Royal Society of London, Series A, Vol. 430, No. 1879, 1990, pp. 285– 313. 20 Bonnecaze, R. T., and Brady, J. F., “The Effective Conductivity of Random Suspensions of Spherical Particles,” Proceedings of the Royal Society of London, Series A, Vol. 432, No. 1886, 1991, pp. 445– 465. 21 Turner, J. C. R., “Two-Phase Conductivity,”Chemical Engineering Science, Vol. 31, No. 6, 1976, pp. 487– 492. 22 Meredith, R. E., and Tobias, C. W., “Conductivities in Emulsions,” Journal of the Electrochemical Society, Vol. 108, No. 3, 1961, pp. 286– 290. 23 Chen, G., “Nonlocal and NonequilibriumHeat Conduction in the Vicinity of Nanoparticles,” Journal of Heat Transfer, Vol. 118, No. 3, 1996, pp. 539– 545. 24 Leal, L. G., “On the Effective Conductivity of a Dilute Suspension of Spherical Drops in the Limit of Low Particle Peclet Number,” Chemical Engineering Communications, Vol. 1, No. 1, 1973, pp. 21– 31. 25 Gupte, S. K., Advani, S. G., and Huq, P., “Role of Micro-Convection Due to Non-Af ne Motion of Particles in a Mono-Disperse Suspension,” International Journal of Heat and Mass Transfer, Vol. 38, No. 16, 1995, pp. 2945– 2958. 26 Hirtzel, C. S., and Rajagopalan, R., Colloidal Phenomena, Noyes Publications, Park Ridge, NJ, 1985, Chap. 3. 27 Batchelor, G. K., “Developments in Microhydrodynamics,”Theoretical and Applied Mechanics, North-Holland, New York, 1976, pp. 33– 55. 28 Hamilton, R. L., and Crosser, O. K., “Thermal Conductivity of Heterogeneous Two-Component Systems,” Industrial and Engineering Chemistry Fundamentals, Vol. 1, No. 3, 1962, pp. 187– 191. 29 Williams, R. A., “Colloid and Surface Engineering: Applications in the Process Industries,” Butterworth– Heinemann, Oxford, 1992.