Thermoelectricity in ternary rare-earth systems. V.N.Nikiforov a. , V.Yu.Irkhin b. , A.V. Morozkin c a. Department of Physics, Moscow State University, Leninskie ...
Thermoelectricity in ternary rare-earth systems V.N.Nikiforova, V.Yu.Irkhinb, A.V. Morozkinc a
Department of Physics, Moscow State University, Leninskie Gory, Moscow, GSP-2, 119899, Russia b Institute of Metal Physics, Ekaterinburg, Russia c Department of Chemistry, Moscow State University Crystallographic data, Seebeck coefficient, electrical resistance and thermal conductivity are reported for a large number of rare-earth compounds, manifestations of the Kondo effect being discussed. In more detail, thermoelectric properties of Yb3Co4Ge13, Yb3Co4Sn13 compounds and Yb2CeCo4Ge13 and Yb2.3La0.7Co4Ge13 solid solutions are presented. Keywords: Rare earth compounds; Thermoelectric materials
I. Introduction Thermoelectric materials are of great interest due to their ability to use waste heat to generate electricity and act as solid state Peltier coolers. Thermoelectric devices based on thermoelectric materials have numerous advantages, such as being low-noise, high reliability, without any moving partsand long period of operation. Since power units of thermoelectric generation produce electric current from temperature difference, we can convert waste heat energy to electric energy. Therefore, thermoelectric power generation is one of the most promising tools for environmental conservation. However, the conversion efficiency of conventional thermoelectric generation is insufficient in performance. The reason for this low efficiency is in poor thermoelectric properties of most conventional thermoelectric materials. The thermoelectric fitness of a material is estimated by the value of the dimensionless parameter, gure of merit ZT =S2 T/ where S is the Seebeck coefficient, electrical conductivity, and thermal conductivity. The material having higher ZT value possesses better thermoelectric performance. Highperformance thermoelectric materials must have large S, high , and low to retain the heat at the junction and reduce the heat transfer losses. How to increase ZT? The Wiedemann Franz law limits the ratio of the electronic contribution to the thermal conductivity and electrical conductivity of a metal. That ratio should be proportional to the temperature, / = LT. Rosenberg (2004) notes that the Wiedemann Franz law is generally valid for high and low (i.e., a few of Kelvins) temperatures, but can be violated at intermediate temperatures. In degenerate semiconductors, the Lorentz number L has a strong dependence on system parameters: dimensionality, strength of interatomic interactions and Fermi level position. The Lorentz number can be reduced by manipulating electronic density of states, varying doping density and layer thickness in superlattices and composite materials with correlated carriers (Minnich et al 2009, Pichanusakorn and Bandaru 2009). We can use the following strategies: - To reduce thermal conductivity and increase the efficiency by minimizing the thermal losses through the device. - To increase the Seebeck coefficient and the electrical conductivity. Recent advances that achieved ZT ~ 2 are mostly due to the reduction of by nanostructuring, i.e., by using multilayered materials (Kanatzidis 2010) and nanocomposites (Minnich et al 2009) - To introduce resonant states within the Fermi window by doping (Mahan and Sofo 1996)
2
II. Skutterudite systems Skutterudite compounds MX3 with a cubic structure (M = Co, Rh, Ir, Fe, Ru, X = P, As, Sb) are a class of promising high performance thermoelectric material for power generation (Morelli et al1995, 1997; Caillat et al 1996; Nolas et al 1996) and thus have attracted a great deal of interest in recent years. Although binary skutterudite compounds possess good electrical transport properties, their overall gure of merit ZT is not too high because of relatively high thermal conductivity. It is found by Sales et al (1996) and Nolas et al (1996a, 1998) that rare-earth atoms such as La, Ce, etc. may be inserted into the voids of the crystal structure where they rattle around their equilibrium positions. This rattling motion can efficiently scatter the phonons and thus greatly reduce the lattice thermal conductivity without deteriorating the electrical transport properties. The ZT value of the rare-earth lled skutterudite is more than unity between 773 and 973 K (Sales et al 1996). Ternary skutterudites RyM4X12; with R being rare earth, M transition metal and X pnictogen; are a novel class of materials exhibiting extraordinary large thermoelectric potential, Kondo- and heavyfermion properties (Nolas et al 1999, Bauer et al 2003). The interest in skutterudite-related systems is connected with search of new thermoelectric materials (Rowe 2006). Unfilled skutterudites of the type M(P,Sb,As)3 (M is a transition metal) contain voids into which low-coordination ions, in particular rare earth elements, can be inserted. This increases phonon scattering and decreases lattice thermal conductivity without increasing electrical resistitivity (Nolas et al 1996a). Thus the figure of merit can become rather large. The electronic properties of the Ir4LaGe3Sb9, Ir4NdGe3Sb9, and Ir4SmGe3Sb9 systems were investigated by Nolas et al (1996a). Another class of skutterudite-related systems are R3M4X13 compounds (where R is a rare earth element, X = Ge or Sn) which attract attention due to the interesting electron properties, interplay of superconductivity and magnetic order (Mudryk et al 2001). In particular, the Yb-based systems demonstrate the intermediate valence nature of the Yb ions and slightly enhanced value of the linear electronic specific heat coefficient. III. Theoretical sketch for thermoelectric power in rare-earth and Kondo systems The Seebeck coefficient can become very large due to the reduction of free carriers; then there is a crossover from positive to negative thermopower as soon as electron transport dominates over hole transport. The Kondo skutterudites may exhibit large S values due to an appropriate reduction of free charge carriers caused by rare earth elements like Ce or Yb (Bauer et al 2003). Strong electron correlations, as obvious in Pr0.73Fe4Sb12; can enhance significantly thermopower values above those found in skutterudites containing valence-stable rare earth elements (Nolas et al 1999). Based on the s-d interaction model for dilute magnetic alloys Kondo (1969) has calculated the scattering probability of the conduction electrons to the second Born approximation. Thus the effect gives rise to a singular term in the resistivity which involves a factor of cJ3lnT, where c is the concentration of impurity atoms, J the s-d exchange integral. When combined with the lattice resistivity, this gives rise to a resistance minimum, provided J is negative, and large temperature-independent Seebeck coefficient (Kondo 1965, 1969). Here we discuss briefly the Seebeck coefficient S(T) in Kondo lattices following to Irkhin and Katsnelson (1989), Irkhin and Irkhin (2007). We can distinguish two cases: (i) Perturbation theory regime. The Kondo correction in the electron self-energy (E) (or conduction-electron T-matrix) is proportional to J 3ln(E). Large Kondo contributions to S(T) correspond to the anomalous odd contribution to the relaxation rate 1(E) (Kondo 1969). The latter should arise, by analytical properties of (E), from the logarithmic singularity in Re (E) (Irkhin and Katsnelson 1989). Although such a singularity is absent in the usual Kondo problem, it occurs in the presence of the potential scattering V which leads to emergence of complex factors 1 + V k(E tk + i0) 1 which mix Im and Re in the incoherent regime.
3
In the presence of interaction between magnetic moments (Kondo lattices), spin dynamics leads to the replacements ln|E| (1/2) ln(E2 + 2), signE (2/ ) tan 1(E/ ) in Im and Re , respectively ( is a characteristic spin-fluctuation frequency). Then the anomalous contribution reads S(T) e (T) T/max{T, }. Thus the quantity plays the role of a characteristic uctuating magnetic field which is introduced by Kondo (1969) to describe thermoelectric power of diluted Kondo systems. In real concentrated systems Kondo systems, at moderately high (as compared to TK) temperatures S(T) is usually large and has an extremum (a maximum at S < 0, a minimum at S < 0). (ii) The low-temperature regime. Besides the Kondo temperature, one introduces the second energy scale - the coherence temperature Tcoh, which corresponds to onset of coherent Kondo scattering by di erent lattice sites. This is usually small in comparison with TK. The picture of the coherent state formation enables one to treat experimental data on low-temperature anomalies of thermoelectric power in heavy-fermion systems. With decreasing T below the above-discussed high-temperature extremum, S(T) often changes its sign, has an extremum again and vanishes linearly at T 0. Such a behaviour may be attributed to occurrence of a pseudogap with reversing the sign of the quantity dN(E)/dE (N(E) is the electron density of states) at the Fermi level, which determines the S(T) sign in the Mott diffusion mechanism. Generally, the systems having low characteristic temperature scales exhibit enhanced S values. In particular, heavy-fermion systems, which exhibit sharp features in density of states due to the hybridization between conduction electrons and f or d-electrons, have been considered as candidates for low-temperature thermoelectric cooling applications (Zlatic et al 2009, Mahan 1998, Grenzebach 2006). Large thermopower values have been predicted and observed in Kondo insulators like Ce Pt Sb at low 3
3
4
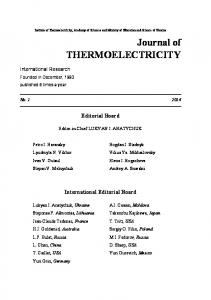
temperatures (Mahan et al 1997, Takabatake et al 2003). In nanowire structures, electron transport is hardly affected by the boundary scattering due to their small intrinsic mean free paths while phonons are strongly scattered due to classical size effect. These results suggest that the nanostructures of Kondo insulators can be designed for high performance thermoelectric cooling devices at low temperatures. IV. Experimental results We have synthesized and investigated a large number of binary and ternary rare-earth compounds and alloys, including new ones (Tables 1-4). Here we pay attention to Ce-based Kondo compounds. Maximum ZT values for the presented systems (which are shown bold) are about 7%. One can see that Kondo-lattice systems like CeSi2, Ce1-xYxNiSb indeed have largest Seebeck coefficient values. Moreover, such systems demonstrate strong temperature dependences of resistivity and Seebeck coefficient (Fig.1). We report also in more details the results on thermoelectric properties of the scutterudites Yb3Co4Sn13 and Yb3Co4Ge13 compounds and Yb3-xRxCo4Ge13 (R = Ce, La) solid solutions (Nikiforov et al 2013). Analysis of the powder X-ray diffractograms shows that the R3T4X13 compounds (R = rare earth, T = Ru, Rh, Os, X = Ge, Sn) adopt the Pr3Rh4Sn13-type cage-like structure. This favours small lattice thermal conductivity. The electrical resistance along the long axis of the sample was measured with a standard fourterminal geometry using a dc current of 0.8 mA The Seebeck coefficient (the thermoelectric voltage under zero electric current) has been measured with disconnection of the sample from the current source. The heat flux in the sample was generated with electric heater. The thermovoltage E was measured over the same potential contacts used in the resistance measurements. The Seebeck coefficient was calculated as the ratio E/dT. The uncertainty of S was estimated to be less than 10%. The thermal conductivity was measured by a longitudinal steady state method. All these compounds demonstrate a metallic-type conductivity. Probably, the Yb3Co4Ge13 has higher electric resistance due to presence of Ge semiconductor in the alloy: the resistance of the Yb2CeCo4Ge13 and Yb2.3La0.7Co4Ge13 alloys is less than of Yb3Co4Ge13 alloy which demonstrates absence of the Ge admixture phase.
4
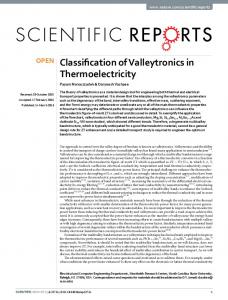
The Seebeck coefficients, electrical resistance and thermal conductivity have monotonic behavior with increasing temperature from 240 to 380 K (Fig. 2). One can see that the lattice thermal conductivity lattice of Ge-containing Pr3Rh4Sn13-type compounds is higher than for Sn-containing compound (thermal coductivity is the sum of lattice and electronic conductivity, = lat + el) due to that the mass of Sn is higher than the mass of Ge. Also, due to this, the Wiedemann-Frantz parameter WF = / WFT has higher values for Ge-containing compounds (Nikiforov et al 2013). The Seebeck coefficient is S = 14 ? 27 µV//K for Yb3Co4Sn13, and S = -21 ? -12 µV/K for Yb3Co4Ge13. Among the scutterudite systems under consideration, the parameter ZT is maximal for Yb3Co4Sn13 compounds and acquires the value of 0.017 at 380 K. Although its thermal conductivity is not maximal, this compound demonstrates lowest resistivity at high temperatures. Thus a good metallic electrical resistivity and high Seebeck coefficient (rather than small heat conductivity) turn out to be decisive for large ZT values in this case. Provided that the dependences of electric resistance, thermal conductivity and Seebeck coefficient vs. temperature retain for Yb3Co4Sn13 compound up to 1000 K, this compound may have the ZT value about 0.3 at 1000 K. Substitution of Yb for Ce or La, as well as substitution of Ge for Sn shifts the Seebeck coefficient to positive values observed in the Yb3Co4Ge13 compound. The Seebeck coefficient of Yb2.3La0.7Co4Ge13 demonstrates non-monotonous temperature dependence. This sign change may be connected with a nontrivial electronic structure near the Fermi level, characteristic for Kondo-like and intermediate-valence systems. The parameter ZT = TS2/( ) is maximal for Yb3Co4Sn13 compounds and acquires the value of 0.017 at 380 K (Fig. 2). Although its is not maximal, this compound demonstrates lowest resistivity at high temperatures. Thus a good metallic electrical resistivity and high Seebeck coefficient (rather than small heat conductivity) turn out to be decisive for large ZT values. We can conclude as follows: (i) The Pr3Rh4Sn13-type Ge-containing compounds have lattice thermal conductivity higher than Sn-containing compounds due to relatively low Ge atom mass as compared to Sn, which is important for thermoelectric characteristics. (ii) The systems investigated demonstrate a non-trivial behavior vs. alloy composition. Substitution of Yb for cerium or La shifts the Seebeck coefficient to positive values. A more systematic treatment is of interest. Probably, some Yb3-xRxCo4Sn13 compounds will have the Seebeck coefficient and ZT parameter value higher than Yb3Co4Sn13 compound. Although ZT values obtained in the rare-earth compounds are still not too large, they are promising materials. There exist some ways to improve their characteristics. Further experimental investigations in this directions and comparison with other ternary rare-earth systems would be useful. Acknowledgments This work was supported by Asahi Kasei Corporation (Japan) in the ISTC project N 2382p and by the Programs of fundamental research of RAS Physical Division Strongly correlated electrons in solids and structures , project No. 12-T-2-1001 (Ural Branch) and of RAS Presidium Quantum mesoscopic and disordered structures , project No. 12-P-2-1041.
5
Caption to figures Fig.1. Resistivity and Seebeck coefficient vs. temperature for CeSi2 (a) and Ce0.5Y0.5CoSi3 (b) alloys Fig.2. Seebeck coefficient S, electric resistance , thermal conductivity and ZT parameter vs. temperature for Yb3Co4Ge13, Yb2CeCo4Ge13, Yb2.3La0.7Co4Ge13 and Yb3Co4Sn13 compounds. References Bauer E. et al.: 2003. Physica B, 328, 49. Caillat T., Fleurial J.-P. and Borshchevsky A.: 1996. J. Cryst. Growth, 166, 722. Grenzebach C. et al.: 2006. Phys. Rev. B, 74, 195119. Irkhin V.Yu.and Katsnelson M.I.: 1989. Z.Phys., B75, 67. Irkhin V.Yu. and Irkhin Yu.P.: 2007. Electronic structure, correlation effects and properties of d- and fmetals and their compounds. Cambridge International Science Publishing. Kanatzidis M. G.:2010. Chem. Mater., 22, 648. Kondo J.: 1965. Progr. Theor. Phys., 34, 372. Kondo J.: 1969. Solid State Physics, ed. Seitz F. and Turnbull D., New York, Academic Press, 23, 183. Mahan G.D.: 1998. Solid State Phys., 51, 81. Mahan G.D., Sales B. C. and Sharp J.W.: 1997. Phys. Today, 50 (3), 42. Mahan G.D. and Sofo J.O.: 1996. Proc. Natl. Acad. Sci. USA, 93, 7436. Minnich A.J. et al.: 2009. Energy & Environmental Science, 2, 466. Morelli D.T., Meisner G.P.: 1997. Phys. Rev. B , 56, 7376. Morelli D.T. et al.: 1995. Phys. Rev. B, 51, 9622. Morozkin A.V., Irkhin V.Yu. and Nikiforov V.N.: 2013. Journal of Alloys and Compounds , 549, 121. Mudryk Ya. et al.: 2001. J. Phys.:Cond. Matter, 13, 7391. Nolas G.S., et al.: 1996. J. Appl. Phys., 79, 2622. Nolas G.S., et al.: 1996a. J. Appl. Phys., 79, 4002. Nolas G.S., Cohn J.L. and Slack G.A.: 1998. Phys. Rev. B , 58, 164. Nolas G.S., et al.: 1999. Annu. Rev. Mater. Sci., 29, 89. Pichanusakorn P., Bandaru P.: 2010. Materials Science and Engineering: Reports, 67, 19. Rosenberg H.: 2004. The Solid State. Oxford University Press. Rowe D.M.: 2006. Thermoelectrics handbook : macro to nano. Boca Raton: CRC/Taylor & Francis. Sales B.C., Mandrus D. and Williams R.K.: 1996. Science, 22, 1325. Sales B.C. et al.: 1997. Phys. Rev. B, 56, 15081. Takabatake T. et al.: 2003. Physica B, 328, 53. Zlatic V. and Hewson A.C., Eds.: 2009. Properties and Applications of Thermoelectric Materials, Springer, New York.
6
Table 1 Composition, cell parameters a, b and c (nm) of silicides and their solid solutions. Physical properties: electrical resistivity
Ohm m), Seebeck coefficient S ( V/K), thermal conductivity
parameter at 300 K. The Wiedemann-Franz parameter is WF =
/
WF
300,
WF
(W/m K) and ZT
= ( 2/3) (kB/e)2 (kB is
the Boltzmann constant and e is the electronic charge) Alloys (sample) CeCoSi3
CeCo0.8Ni0.2Si3
CeCo0.8Cu0.2Si3
CeCoSi3
CeCoSi1.5Ge1.5
Ce0.5Y0.5CoSi3
Ce0.5Y0.5CoSi3HP
CeSiGe CeSi1.6Ge0.4 CeSiGa CeSi2 HP Ce0.5Y0.5Si2 HP SC HP
Mass fraction
Phase
0.80 Ce20Co19Si60 0.07 Co33Si66 0.13 Ce25Co19Si56 0.73 Ce21Co16Ni4Si59 0.08 Co29Ni4Si67 0.19 Ce25Co15Ni5Si54 0.90 0.03 0.05
Structure BaNiSn3 CaF2 CeNiSi2 BaNiSn3 CaF2 CeNiSi2
Ce22Co15Cu3Si59 BaNiSn3 Ce33Co2Cu9Si56 CeNiSi2 Si97 C Ce21Co3Cu33Si43 CeGa2Al2
a
b
0.41218(6) 0.5348(9) 0.4122(3) 1.6391(9) 0.41391(5) 0.5355(6) 0.4149(2) 1.6465(1) 0.41307(4) 0.4145(4) 1.6337(13) 0.5416(8)
c
S
WF
ZT
0.9534(2) -34.6 2.1
9.1
2.61 0.018
0.4139(3) 0.9531(1) -37.5 1.5
16.6
3.4
0.017
0.4070(1) 0.9545(1) -36.9 0.91 18.8 2.33 0.024 0.4175(4)
0.9545(2) -35.2 2.27 20.2 6.26 8.1 10-3 0.73 CeCoSi3 BaNiSn3 0.4130(1) 0.10 CoSi2 CaF2 0.5355(5) 0.17 CeCoSi2 CeNiSi2 0.4121(3) 1.6480(9) 0.4119(4) 0.9686(1) 25.74 1.11 10.9 1.65 0.0164 0.98 CeCoSi1.5Ge1.5 BaNiSn3 0.4220(1) 0.4258(4) 1.402(1) 0.02 CeSi2-xGe2 ThSi2 0.78 Y10Ce10Co20Si60 BaNiSn3 0.40947(4) 0.9538(1) -30.8 3.8 15.5 8.04 4.8 10-3 0.05 Co33Si66 CaF2 0.5358(7) 0.14 Y13Ce12Co20Si55 CeNiSi2 0.4065(2) 1.6402(6) 0.4030(1) 0.03 Si95 0.5424(9) C 0.94 Ce10Y12Co18Si60 BaNiSn3 0.40897(3) 0.95189(8) -37.6 0.04 Co32Si68 CaF2 0.5348(6) Si95 C 1.00 Ce41Si27Ge32 ThSi2 0.4243(1) 1.3897(3) -3.4 S70Ge30 C 1.00 ThSi2 0.4218(1) 1.3865(2) -20.0 CeSi1.6Ge0.4 Si C 0.92 Ce37Si28Ga35 ThSi2 0.4229(1) 1.4353(2) -11.4 0.08 Ce55Si39Ga7 FeB 0.8277(5) 0.3984(2) 0.5972(4) Ce34Si67 ThSi2 0.41711(5) 1.3964(2) -55.0 0.95 0.05
Ce18Y16Si66 Si99
Semiconductor-type conductivity
High-purity sample
ThSi2 C
0.41219(4)
0.45 16.4 1.01 0.057
5.9SM 8.0
6.44 7.4 10-5
2.0SC 14.0
3.8 4.3 10-3
1.02 14.4 2.00 2.6 10-3 0.98 13.8 1.85 0.067
1.3554(1) -20.0 2.5
13.0 4.43 3.7 10-3
7
Table 2 Composition, cell parameters and physical properties of NaZn13-type solid solutions Mass Alloys Structure a c S WF ZT Phase fraction (sample) Ce0.2La0.8Co12Si 0.89 Ce1La8Co84Si8 NaZn13 1.1285(2) 15.0 0.64 21.3 1.86 4.95 10-3 (3Q/N93 LCCI13) 0.11 Ce2Co17 Th2Zn17 0.8350(9) 1.221(1) LaCo10Ni2Si 15.0 0.16SC* 16.2 0.35 0.026 0.91 La7Co72Ni13Si9 NaZn13 1.1292(2) (5Q/N26 LCNI13) 0.05 La15Co42Ni36Si8 CaCu5 0.5028(4) 0.3987(3) 0.2507 0.4070 Co87Ni10 0.04 Mg
LaCo10Ni2Si 0.91 La7Co72Ni13Si9 (5Q/N26 LCNI13) 0.05 La15Co42Ni36Si8
Co87Ni10 0.04 LaCo10Fe2Si 0.97 La8Co76Fe13Si9 (6Q/N48 LCFI13) 0.02 Co68Fe32 La25Co44Fe5Si26 LaCo10Cu2Si 0.65 La7Co76Cu5Si11 (6Q/N58 LCPI13) 0.26 Co94 0.09 La16Co20Cu64 Ce0.05La0.95Co10Ni2Si (6Q/N55 CLCNI13D)
Y0.05La0.95Co10Ni2Si
0.91 0.05 0.04 0.93
(6Q/N53 YLCMI13) Mg0.05La0.95Co10Mn2Si (6Q/N54 MLCMI13)
CeCu6MnAl6 (6Q/N99 CPMA13)
18.8 1.72 4.8 10-3
1.1350(1) 0.2835(4)
0.69
18.9 1.78 4.5 10-3
Mg0.2La7Co71Ni13Si8 Mg0.2La14Co46Ni33Si7 Co Ce0.2La7Co71Fe13Si8 Y0.1La7Co71Fe14Si8 Y3La5Co71Fe15Si6
NaZn13 CaCu5 Mg NaZn13 W NaZn13 W
1.1300(2) 0.5014(6) 0.2507(9) 1.1323(2) 0.2835(5) 1.1323(2) 0.2835(5)
Mg0.2La7Co71Fe14Si8 x
NaZn13 Mg
1.1331(2) 0.2649(2)
Ce0.2La7Co71Mn14Si8 La7Co69Mn22 Co74Mn24 Y0.1La7Co71Mn14Si8 Y3La6Co65Mn20Si7 Y3La6Co68Mn22 0.96 Mg0.2La8Co73Mn10Si8 0.02 Co76Mn22 0.02 x
NaZn13 ThMn12 W NaZn13 ThMn12 CaCu5 NaZn13 W ThMn12
1.1369(2) 0.8447(5) 0.2806(9) 1.1379(2) 0.4735(7)
0.93 0.06 0.02 0.94 0.02
1.00 Ce7Cu48Mn2Al43 Ce7Cu45Mn5Al43
14.0
1.1290(6) 14.0 0.602 19.6 1.61 5.0 10-3 0.2500(3) 0.4066(6) 1.1290(2) 0.4966(5) 0.2507(9) 1.1301(2)
Ce0.05La0.95Co10Fe2Si (6Q/N49 CLCFI13) Y0.05La0.95Co10Fe2Si (6Q/N50 YLCFI13) Mg0.05La0.95Co10Fe2Si 0.90 (6Q/N51 MLCFI13) 0.10
Y0.05La0.95Co10Mn2Si
0.67
NaZn13 CaCu5 Mg NaZn13 x
0.07 0.94 0.06 0.98 0.02
Ce0.05La0.95Co10Mn2Si
1.1292(2) 14.2 0.5028(4) 0.3987(3) 0.2507 0.4070
Ce0.2La7Co71Ni14Si8 Ce3La9Co59Ni23Si8 Co99 Y0.2La7Co71Ni14Si8 Y5La7Co59Ni23Si7
(6Q/N56 YLCNI13) Mg0.05La0.95Co10Ni2Si 0.89 (6Q/N57 MLCNI13) 0.04
(6Q/N52 CLCMI13)
NaZn13 CaCu5 Mg NaZn13 W x NaZn13 Mg CaCu5
1.1360(2) 0.2896(8) 0.8459(9)
NaZn13 1.1815(2)
0.4006(4) 0.4069(10)
0.4000(5) 0.4070(9)
14.2 0.725 17.6 1.74 4.7 10-3 12.8
0.72
17.2 1.69 4.0 10-3
14.1
0.66
18.0 1.62 5.0 10-3
13.8 0.742 15.8 12.7 0.4097(2) 0.4252(3)
0.4216(5)
0.74
1.6
4.9 10-3
16.0 1.62 4.1 10-3
14.6 0.642 18.0 1.58 5.5 10-3 1.8
4.1 10-3
4.25
1.14
11.6
4.35
1.16
11.1 1.76 4.4 10-4
4.62
1.13
12.2 1.88 4.6 10-4
11.0 2.2SC
10.1 3.03 1.6 10-3
0.4290(5)
8
Table 3 Composition, cell parameters and physical properties of RxR'1-xTyNi1-ySbzX1-z solid solutions (R, R' = Y, Ce, Yb; T = Transition metal) Alloy (sample)
Mass fraction
Ce0.75Y0.25NiSb (5Q/N6 CYNSb1C)
0.90 0.10
Ce0.5Y0.5NiSb (3Q/N97 CYNSb1)
0.93 0.07 ~0.70
Ce0.5Y0.5NiSb HP (8Q/142 40T)
Ce0.5Y0.5NiSb 0.60 (5Q/N5 CYNSb1B') 0.27 0.13 0.98 Ce0.5Y0.5NiSb HP (6Q/N60 CYNSb1X 0.02 - 23A) Ce0.25Y0.75NiSb 0.70 (4Q/N147 0.30 CYNSb1B) Ce0.1Y0.9NiSb (6Q/N64 CYNSb4) Yb0.25Y0.75NiSb 0.69 (4Q/N148 YbNSb2) 0.31 Yb0.5Y0.5NiSb 0.64 (4Q/N149 0.35 YbYNSb1) YbCu2Sb2 0.77 (4Q/N132 0.14 YbPSb122A) 0.09 Ce0.5Y0.5Ni0.99Cu0.01 0.71 Sb 0.29 (6Q/N63 CYNPSb4) Ce0.5Y0.5Ni0.95Cu0.05 Sb (5Q/N8 YCNPSb1) Ce0.5La0.5NiSb (5Q/N7 LCNSb1) Ce0.5Y0.5NiSb0.5Sn0.5 (5Q/N15 CYNSbSn1)
0.89 0.11
Phase
Structure
a
c
S
CeNiSb Ce26Y10Ni32Sb32 Ce29Y14Ni19Sb39 Ce17Y11Ni35Sb37 Ce18Y17Ni32Sb33 Ce33Y17Sb50 Ce25Y22Ni21Sb28 Ce25Y22Ni13Sb41 Ce2Y22Ni77 Ce34Y13Ni10Sb43 Ce17Y17Ni33Sb33 Ce18Y22Ni22Sb38 Ce5Y14Ni80 Ce18Y18Ni32Sb32 Ce14Y27Ni20Sb39
InNi2 InNi2 MgAgAs CaBe2Ge2 InNi2 NaCl MgAgAs MgAgAs CaCu5 Th3P4 InNi2 MgAgAs CaCu5 InNi2 MgAgAs
0.4395 0.4384(1) 0.6402(2)
0.8258 0.8039(1)
10.0
5.4
0.4374(1) 0.6375(3) 0.6343(2)
0.7792(1)
-53.2
0.4380(1) 0.6368(2) 0.5189(6) 0.4372(2) 0.6335(7)
Ce10Y26Ni32Sb32 Ce12Y13Ni42Sb35
InNi2 MgAgAs CaBe2Ge2 MgAgAs x MgAgAs CaBe2Ge2 MgAgAs CaBe2Ge2
0.4358(2) 0.6328(2)
AlB2 NiAs Cu InNi2 MgAgAs x
0.4450(1) 0.4000(2) 0.3611(2) 0.4377(1) 0.6371(2)
InNi2 MgAgAs ZrCuSi2
Ce5Y31Ni30Sb35 Ce4Y21Ni48Sb28 Yb6Y31Ni29Sb34 Yb7Y17Ni41Sb51 Yb12Y28Ni24Sb37 Yb11Y12Ni41Sb37 Yb26Cu38Sb38 Cu67Sb33 Cu Ce16Y18Ni33Cu1Sb32 x Ce14Y7Ni48Cu2Sb30 Ce17Y18Ni32Cu2Ni32Sb33
Ce17Y21Ni26Sb36 Ce15Y8Ni20Cu4Sb33 0.84 InNi2 La17Ce17Ni32Sb35 0.06 La23Ce22Ni10Sb36 MgAgAs 0.10 La9Ce12Ni43Sb36 ZrCuSi2 InNi2 Ce16Y18Ni33Sb13Sn20 MgAgAs Ce19Y20Ni24Sb34Sn2 x Ce10Y6Ni65Sn19 0.62 Ce20Y21Ni19Sb22Bi18 MgAgAs 0.38 Ce6Y15Ni74Sb5Bi2 CaCu5
Ce0.5Y0.5NiSb0.5Bi0.5 (5Q/N4 CYNSbBi1A) Ce0.5Y0.5NiSb0.8Bi0.2 0.77 0.23 (6Q/62 CYNSbBi4)
Ce18Y18Ni31Si32Bi3 Ce26Y26Sb46Bi4 Ce15Y8Ni44Sb30Bi3
InNi2 NaCl x
WF
ZT
6.2
4.57
9.0 10-4
1.66
11.0
2.49
0.0465
4.02
3.07
6.81
2.84
2.3 10-4
0.7789(2)
-10.5
6.72
6.3
5.78
7.8 10-4
0.3788(3) 0.7821(2)
-22.8
48.25
2.45
16.1
1.3 10-3
0.7626(2)
-52.6
9.99 SC
5.7
7.77
0.015
0.6307(1)
-19.0
7.9SC
6.25
6.74
2.2 10-3
0.6276(1)
-26.0
3.36
8.7
3.99
6.9 10-3
-5.0
1.88
9.5
2.44
4.2 10-4
0.3989(1) 0.5153(2)
-1.6
1.4
13.0
2.48
4.2 10-5
0.7816(2)
-24.7
4.7
6.5
4.17
6.0 10-3
0.4370(1) 0.6364(3)
0.7814(2)
-18.1
5.17
0.42
0.30
0.045
0.4394(1) 0.6480(2) 0.4334(2) 0.4428(2) 0.6371(2)
0.8307(2)
-3.85
7.1
4.48
4.34
1.4 10-4
1.0113(7) 0.7389(4)
-6.6
3.0
7.5
3.07
5.8 10-4
6.9
1.67
10.8
2.46
7.9 10-4
-36.8
2.42
7.7
2.54
0.022
0.6255(1) 0.4215(1)
0.6401(2) 0.4896(3) 0.4377(2) 0.6320(2)
0.9682(3)
0.3975(2) 0.7831(2)
9
Table 4 Composition, cell parameters and physical properties of alloys of the Mg-Ce-Ni and Mg-Sm-Ni systems Alloys (sample) Ce2MgNi2 HP (7Q/112 7T) CeYMgNi2 HP (8Q/132 37T)
Mass fraction 1.00 ~0.80
Sm2MgNi2 HP (8Q/133 34T)
~0.90
SmYMgNi2 HP (8Q/135 38T)
~0.70
Ce1.5Mg1.5Ni9 (4Q/N160 CMgN1A)
0.56 0.07 0.37 0.42 0.05 0.50
Ce2.5Mg0.5Ni9 (3Q/N91 MgN3) Ce19Mg12Ni69 (4Q/N161 CMgN1B) Ce0.5Mg0.5Ni2 HP (6Q/N73 17E) Ce0.5Mg0.5Ni2 (6Q/N70 CMgN22) Ce0.5Mg0.5Ni2 HP (6Q/N71 CMgN22 25A) Ce0.5Mg0.5Ni2 HP (6Q/N75 18H - 13B)
Ce0.5Y0.5MgNi4 (8Q/N138 43T)
~0.80
Ce0.5Mg0.5CoNi (7Q/108 3T)
~1.0
CeMg2Ni9 HP (6Q/N78 15E)
0.70 0.20 0.10
CeMg2Ni9 HP (6Q/N79 19H-11B)
0.38 0.52 0.10
Phase
Structure
a
c
S
Ce41Mg20Ni39
Mo2FeB2
0.7579(3)
0.3760(1)
-22.5
0.46
Ce15Y25Mg20Ni40
Mo2FeB2 AuBe5 CrB x Mo2FeB2 x x Mo2FeB2 AuBe5 x x AuBe5 Ce2Ni7 CaCu5 AuBe5 Ce2Ni7 CaCu5 AuBe5 x AuBe5 CaCu5
0.7490(3)
0.3700(2)
-16.85
0.7470(4)
0.3758(3)
0.7436(5)
0.3741(3)
Ce13Y6Mg15Ni66 Ce25Y23Mg3Ni49 Ce19Y3Mg53Ni25 Sm40Mg21Ni39 Sm46Mg10Ni44 Sm17Mg64Ni19 Sm31Y9Mg21Ni38
Sm29Y6Mg2Ni64 Y80Ni20 Sm13Y2Mg63Ni23 Ce19Mg13Ni68 Ce19Ni80 Ce19Ni80 Ce19Mg12Ni68 Ce20Ni80 Ce20Ni80 Ce19Mg13Ni67 Ce15Mg10Ni75 Ce18Mg15Ni69 Ce17Ni83 Ce18Mg13Ni69 Ce18Mg6Ni76 Ce17Ni80 Ce18Mg11Ni70 Ce20Mg4Ni76 Ce19Mg2Ni79 Ce26Mg19Ni55 Ce21Mg12Ni67 Ce48Mg50 Mg33Ni67 Ce17Ni82 Ce8Y8Mg18Ni66 Ce2Y2Mg29Ni68 Ce6Y7Mg13Ni74 Ce19Mg16Ni47Co19 Co99 Ce36Co63 Ce10Mg74Ni14 Ce9Mg16Ni76 Ce15Mg2Ni84 Ni99 Ce7Mg28Ni65 Mg24Ni75 Ce17Ni83 Ni99
AuBe5 PuNi3 CaCu5 AuBe5 PuNi3 x AuBe5 CsCl MgNi2 CaCu5 AuBe5 MgNi2 CeNi3 AuBe5 Mg MgCu2 mf PuNi3 CaCu5 Cu x MgNi2 CaCu5 Cu
WF
ZT
8.6
0.54
0.038
0.91
13.3
1.65
0.007
2.37
0.80
18.9
2.06
1.1 10-4
-0.42
0.76
16.1
1.66
4.2 10-6
-24.0
0.51
16
1.1
0.021
-18.0
0.65
33.0
2.9
4.5 10-3
27.2
2.63
12.5
4.5
6.8 10-3
0.70075(6)
-29.4
0.88
14.0
1.68
0.021
0.70085(9)
-33.6
1.00
12.3
1.68
0.028
0.69961(9)
-35.6
1.07
11.7
1.71
0.030
0.7032(2)
-4.5
1.44
10.0
1.96
4.2 10-4
0.7010(2)
-10.2
1.12
10.95
1.66
2.6 10-3
0.7050(1)
4.45
0.76
16.0
1.66
4.9 10-4
0.7005(2) 0.4891(3) 0.4892(15) 0.6992(2) 0.4950(8) 0.4887(3) 0.7064(5)
2.391(1) 0.4002(8) 2.423(3) 0.3998(2)
0.4861(1) 0.4872(2) 0.3534(3)
2.3845(4) 0.4019(1)
3.68
0.62
17.4
1.47
3.8 10-4
0.4824(2) 0.4886(1) 0.3536(3)
1.5829(8) 0.4002(1)
6.3
0.54
21.5
1.58
1.0 10-3
10
(a)
(b) Fig.1. Resistivity and Seebeck coefficient vs. temperature for CeSi2 (a) and Ce0.5Y0.5CoSi3 (b) alloys
40
11
S ( V/K)
30
Yb3Co4Ge13
20 10
Yb2CeCo4Ge13
0
Yb2.3La0.7Co4Ge13
-10
Yb3Co4Sn13
-20 -30 220
240
260
280
300
320
340
360
380
400
(a)
T (K) m)
2
(
2.5
1.5 1 0.5
(b)
0 220
240
260
280
300
320
340
360
380
400
T (K) 20
(W/m K)
18 16 14 12 10 8 6 220
(c) 240
260
280
300
320
T (K)
340
360
380
400
ZT
12
0.018 0.016 0.014 0.012 0.010 0.008 0.006 0.004 0.002 (d) 0 220 240 260 280 300 320 340 360 380 400
T (K) Fig. 2. Seebeck coefficient S, electric resistance , thermal conductivity
and ZT parameter vs.
temperature for Yb3Co4Ge13, Yb2CeCo4Ge13, Yb2.3La0.7Co4Ge13 and Yb3Co4Sn13 compounds