Sep 15, 2011 - Winder, G. Matt, J. C. Hummelen, R. A. J. Janssen, N. S. Sariciftci, and ... S. Tristram-Nagle, D. M. Smilgies, D. N. Lambeth, R. D. McCullough,.
JOURNAL OF APPLIED PHYSICS 110, 054515 (2011)
Variability of physical characteristics of electro-sprayed poly(3-hexylthiophene) thin films M. Ali,1 M. Abbas,2 S. K. Shah,1 E. Bontempi,3 P. Colombi,4 A. Di Cicco,1 and R. Gunnella1 1
Sez. Fisica UdR CNISM, Scuola di Scienze e Tecnologie, Universita` di Camerino, via Madonna delle Carceri, I-62032 Camerino (MC), Italy 2 Linz Institute for Organic Solar Cells, No. 69, Altenberger Strase, 4040 Linz, Austria 3 Chemistry for Technologies Laboratory, University of Brescia, via Branze 38, 25123 Brescia, Italy 4 Centro Coating C.S.M.T. Gestione S.c.a.r.l. Via Branze, 45 I-25123 Brescia, Italy
(Received 20 June 2011; accepted 5 August 2011; published online 15 September 2011) Structural and electronic properties of homogeneous poly(3-hexylthiophene) (P3HT) films obtained from the electro-spray method were presented by means of grazing incidence x-ray diffraction, atomic force microscopy, optical absorption, photoelectron spectroscopy, and (photo)electrical conductivity. Starting from different solution concentrations and flow rate conditions, differently assembled thin films were obtained whose physical properties were peculiarly different from those ones obtained by other deposition methods. If properly refined, the method could in principle broaden the spectrum of the existing nano and microscale structures of the P3HT thin C 2011 American Institute of Physics. [doi:10.1063/1.3633519] films. V
I. INTRODUCTION
Very recently, bulk heterojunction organic solar cells1 using conjugated polymers blended with other inorganic nanostructured materials have achieved a particularly refined level of process versatility, cost effectiveness, and high efficiency.2,3 Furthermore, this applications field has given the intriguing perception of a wide room available for further progresses. Poly(3-hexylthiophene) (P3HT) is an important photoconductive polymer for photovoltaic applications. The reason is mainly because of its high drift mobility. Furthermore, flexible side alkyl chains improve greatly the solubility, promoting solution processibility and preserving p electronic structure.4,5 For this reason, many efforts to maximize the efficiency of organic solar devices started from this polymer and aimed, on one side, to lower the semiconductor polymer bandgap,6,7 on the other side, to improve crystallinity by thermal8 or solvent annealing treatments.9 It is well known that crystallization was able to considerably increase the photons harvesting and hole mobility in the polymer as demonstrated in standard drop cast or spin coated films. More recently, attempts to optimally match the nanometer-scale morphology resulting from novel growth techniques and the basic microscopic processes in the device10 have been proposed. Advances in growth techniques of thin active films is a key issue to this progress for a twofold reason. On one side, looking forward to future applications, mainly to flexible substrates and in general for large scale implementations, novel deposition procedures have been proposed like inkjet11 or doctor blading,12 which are easily scalable to roll-to-roll production. In particular, the spray coating13–17 is broadly employed to reduce the fluid waste to minimal amounts, while the combination of shadow masking and the control in the growth allows easy patterning and composite multilayered films fabrication to further improve efficiency. On the 0021-8979/2011/110(5)/054515/9/$30.00
other side, the search for valid alternatives to the few active materials in use today, like the polythiophene-fullerene blends, suggests to try different paths in the device fabrication and to implements new processes. The present study was focused on the electro-spray deposition (ESD) technique18–22 in order to explore its potentiality in the growth of thin films with properties possibly at variance from those of the P3HT obtained from other well assessed techniques like spin-coating. In particular, recent implementations of the electrospray technique to the fabrication of photovoltaic bulk heterojunction devices were successfully shown.22–24 Intrinsic drawbacks of the ESD technique, like roughness and the thickness profile, should be carefully considered and discussed to comply with a successful device implementation. As recently discussed by Wong and coworkers,25 spray methods giving rise to highly rough films with lower charge carrier mobility can be safely cured after growth by post-solvent vapor annealing. In the past, the ESD technique was variously applied to several kinds of solutions of biomacromolecules and/or synthetic polymers under strong electric fields giving rise to nano-sized particles and fibers, which accumulated and adhered on a substrate in ambient conditions, 18 as well as in ultra high vacuum.19 This transformation was brought about by the application of a high voltage to the capillary through which the liquid flowed. An important advantage of the technique,22 was the control that can be achieved on the particle size, ranging from the micron to the nano scales keeping an almost monodispersed distribution, affecting differently the final device properties. Furthermore, the resulting particles isolated from the solvent were supposed to experience different aggregation mechanisms from those observed in presence of solvent; such mechanisms could possibly be exploited to improve the
110, 054515-1
C 2011 American Institute of Physics V
Downloaded 16 Sep 2011 to 147.210.63.234. Redistribution subject to AIP license or copyright; see http://jap.aip.org/about/rights_and_permissions
054515-2
Ali et al.
efficiency of devices, and more importantly, to widen the choice of possible blend components. For this reason, in this study we presented results from a low temperature boiling point solvent like chloroform, that will enhance the electro-spray peculiarity of reducing at the best the interaction of solvent and deposited films. Another possible advantage of the present technique will be the contribution of the ESD technique to fabricate devices with complex heterostuctures by using different materials and/or solvents, or differently aggregated phase of the same active material. Typical examples are the optimized device architectures of a solar cell or of a field effect transistor, taking advantage of the anisotropy in mobility resulting from a different p-p stacking arrangement. In general, sensors and other devices would receive a sizable impulse from a supramolecular organization of the characteristic twodimensional p states system of conjugated polymers.26 In brief, the present study will regard the peculiar physical properties of as-grown thin films obtained from the ESD methods applied to P3HT-chloroform solution at various electric fields, solution concentrations and deposition rates, while postgrowth treatments or solvent choice effects will be the subject of future studies. Microscopic investigations were performed by atomic force microscopy (AFM) and grazing incidence x-ray diffraction (GIXRD), respectively, for the morphology and the structure of the crystalline part of the polymer structure. The optical and electronic properties were investigated by means of optical absorption in the visible range and ultraviolet photoelectron spectroscopy (UPS). Finally, we observed the resulting conductivity obtained for such films by I-V curves at room temperature (RT), including illumination conditions and its wavelength dependence by photoconductivity (PC). II. EXPERIMENTAL SECTION
Thin P3HT films with thickness ranging between 100 and 200 nm, as measured by AFM after scratching the samples, were obtained from chloroform solution of commercial electronic grade regioregular (>95%) powders (Sigma), average molecular weight in excess to 50 kD without further purification.
J. Appl. Phys. 110, 054515 (2011)
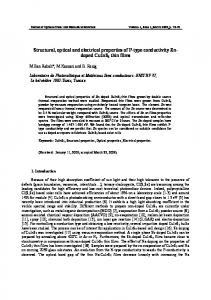
The homemade ESD apparatus is described in Fig. 1. Stainless steel tip (inner diameter 0.1 mm) was modified before each use through electrochemical etching in the H2SO4: H2O, 1:1 solution to obtain a homogeneous electric field spatial distribution. The tip was centered to the pin-hole in the grounded skimmer with high accuracy. Distance between tip and skimmer was 2–3 mm. When finely tuned N2 gas over-pressurized the solution container, a controlled flow of solution could reach the spray tip, and electro-ionization occurred (so called Taylor cone). Extracted from the grounded skimmer, the molecules were driven to the substrate using a differentially pumped system (the first stage at 1 Torr and the second stage at 10-3 Torr) by a couple of few millimeters diameter pin-holes acting as skimmers in front of the sample holder. The sample holder allows heating during the growth or during post-growth annealing. The solution flow rate was measured by the time required to move a fixed amount of solution volume in the tube. It was found that the optimally applied positive voltage to the tip was in the range of 1–3 kV, depending on the present design of the reaction chamber (distance of tip from the grounded skimmer and the pumping system). Below such a range, the solvent was not removed efficiently from the solution and the flux inside the tip tended to be blocked. Furthermore, concentrated solution at low rate led to discontinuous flow with dark spots observed on the samples indicating polymer agglomeration. In the present study this effect was observed at 2 kV voltage and 1.3 ll/s rate in the case of 0.5 mg/ml solution. On the other hand, above a voltage of 3 kV, carbonization effects in the films looking dark and dusty were identified by the help of photoemission. The films were deposited on several substrates, namely, corning glass, indium tin oxide (ITO) and on PEDOT:PSS/ ITO substrates at two different solution concentrations of 0.1 mg/ml and 0.5 mg/ml, hereafter referred as type I and type II samples, respectively. After the preparation, thin films obtained from a fresh solution resulted to be stable if properly preserved in dark and controlled ambient temperature. The morphology of the P3HT films was analyzed by AFM both in contact and non-contact mode. AFM quantitative morphological analysis was performed using Gwyddion
FIG. 1. Electro-spray system employed for the deposition of the P3HT films.
Downloaded 16 Sep 2011 to 147.210.63.234. Redistribution subject to AIP license or copyright; see http://jap.aip.org/about/rights_and_permissions
054515-3
Ali et al.
software. Absorption spectra were obtained by using a lockin amplifier and an optical chopper. The working frequency chosen was 30 Hz. Absorption measurements were carried out by measuring the normalized transmitted light intensity using a Silicon PIN detector. GIXRD was collected by means of a D8 Advance Bruker diffractometer keeping fixed the incidence angle at 0.2� during the detector scanning in the plane of incidence. UPS spectra were acquired at pressure of �10-9 Torr using a He discharge lamp providing HeI (21.2 eV) and HeII (40.8 eV) lines impinging at 45� with respect to the detection direction of a hemispherical electron analyzer VG-CLAM4 or by rotating the polar angle of a three axes sample manipulator. HeII line allowed to collect spectra with reduced influence of the secondary electron emission. The photoconductive signal was measured over the load resistance of 20 MX under an electric field of 5.3 � 103 V/cm. The incoming light power was derived from the standard photo response of the silicon detector to normalize the photo response spectra of the samples. Finally, the electrical characterization was carried out in dark and illumination conditions (ambient light) by a Keithley 617 electrometer, in the V/I mode, using aluminum stripes evaporated onto 7059 Corning glass substrates after film deposition. Alternatively for sandwiched structures, ITO covered glass was spin coated by PEDOT:PSS and used as substrate. Thin gold wires were put in contact with the metal stripes by using silver paint, dried in dark. The sample thickness was 100 nm while electrode cross section was 2 mm with separation gap of 150 lm. III. RESULTS A. Microscopy
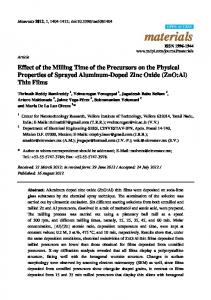
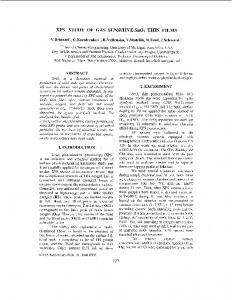
AFM images of type I samples obtained from a constant amount of solution (3 ml) at the flow rate of 1.3 and 4.0 ll/s and for type II at the rate of 2.0 (the minimum achievable with good quality at this density) and 4.0 ll/s, were reported in Figs. 2(a) and 2(b) and in Figs. 2(c) and 2(d), respectively. Though of dissimilar thicknesses, the type I and type II films of Fig. 2 showed peculiar differences and a continuous evolution at the increase of flow rate and concentration from a high corrugation and anisotropic morphology [Fig. 2(a)] to a more isotropic growth [Fig. 2(d)]. Such an observation was not related to thickness difference of the samples as it was demonstrated by the pictures reported in Fig. 3 for flow rate of 2.0ll/s where the combined effects of solution concentration and sample thickness of films grown were displayed. In fact, while type II samples showed a rough isotropic morphology, in type I samples a sizable roughness was rather due to a less compact and anisotropic arrangement of islands. B. X-ray diffraction
For the structural determination of the P3HT films we employed GIXRD, an extremely suitable tool to determine the surface structure in those systems whose physical proper-
J. Appl. Phys. 110, 054515 (2011)
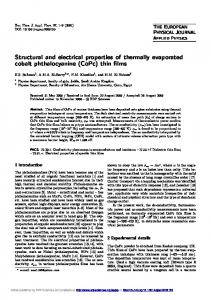
ties of interest were confined at the interface region or where modifications took place. To this aim, a Cu K-a source and incidence angle of about 0.2� were used, while the detector was scanned in the plane of incidence (see inset in Fig. 4). Below an angle of 1� of incidence a drastic reduction of the substrate contribution was found in the patterns. In fact, as for an incidence angle of about 0.12� , the x-ray penetrates theoretically only 10 nm in the film, and at 0.18� about 60–70 nm, we suppose that, with the limitations of sizable roughness observed, at the present incidence conditions we reasonably increased the sensitivity to the film whose thickness was ranging between 150 and 200 nm. In the symmetric h/2h configuration, the scattering vector is always parallel to the surface normal, and XRD is sensitive to crystallographic planes parallel to the sample surface. In the present grazing incidence configuration, neither scattering vector was parallel to the surface normal, nor its orientation remained constant during measurement, then contribution was made by lattice planes that made a non-zero angle with the substrate. In this manner, applying a very low angle of incidence the technique was more sensitive to crystallites with scattering vector whose angle was lower than 90� (direction of the surface normal). GIXRD measurements were shown in Fig. 4. Within the unit cell model proposed by Prosa and coworkers,27 P3HT crystallizes in a monoclinic unit cell, forming lamellae or planes of backbones� perpendicular to thiophene rings and to the a-axis (a ¼ 16.8 A, the interdistance of two� lamellae or layers). Other lattice parameters are b ¼ 7.6 A (twice the � stacking distance between two thiophene rings), c ¼ 7.8 A (the distance between two thiophene rings in the backbone) and c ¼ 90� . The thiophene ring plane is often denoted having either a “flat-on” orientation when the main portion of the crystalline component of the film has the (020) reflection oriented parallel to the sample normal or (h00) at 90� to the sample normal. Alternatively, an “edge-on” orientation of the crystalline portion of the film is invoked when the (020) reflection is at 90� to the sample normal. In the latter case, the alkyl chains are sticking out of the sample surface. The main diffraction features recorded in our case, performing GIXRD at 0.2� of incidence, were the (h00)-reflection peaks at about 2h ¼ 5� and 10� , corresponding to the � interlayer alkyl chains in the lamellar structure (a ¼ 16.8A, � q ¼ 0.37 A-1). A second feature was labeled �(020) at -1 � with 2h ¼ 23.4 � , corresponding to 2q ¼ 4p/b ¼ 1.65 A b ¼ 7.6 A, due to intralamella distance of the p -p stacking.14 In order to increase the portion of the reciprocal space investigated we performed conventional XRD measurements with an area detector. XRD patterns (not shown) reported only the peak at 5� , while that one at 23� was missing maybe because of the sizable roughness on the surface. Another possibility would be the reduced sample thickness. In any case the results pointed unequivocally toward the presence of an oriented crystal structure. In Fig. 4, from bottom to top after suitable vertical shift of the plots, GIXRD patterns of type I samples at increasing flow speed of 1.3, 2.0, and 4.0 ll/s, respectively [Figs. 4(a) to 4(c)] and of type II samples at 2.0 and 4.0 ll/s flow speed [Figs. 4(d) and 4(e)] were reported. A clear diffraction
Downloaded 16 Sep 2011 to 147.210.63.234. Redistribution subject to AIP license or copyright; see http://jap.aip.org/about/rights_and_permissions
054515-4
Ali et al.
J. Appl. Phys. 110, 054515 (2011)
FIG. 2. (Color online) AFM images of electro-spray (2 kV) deposited P3HT films, from 3 ml solution at different flow rates are reported. For a concentration of 0.1 mg/ml from (a) to (b) the solution flow speed is 1.3 and 4.0 ll/s, respectively. For 0.5 mg/ml solution pictures (c) and (d) are from samples grown with flow rates of 2.0 and 4.0 ll/s, respectively.
intensity (the (020) peak) was observed at 23� during low solution concentration/low speed growth. The (h00) peak was missing because the scattering vector of the (100) reflection was perpendicular to the substrate. Using a more concentrated solution, a clear indication of a planar thiophene ring was obtained. In this latter case, the diffraction of (h00) orders was observed due to parallel arrangement of molecular layers spaced by alkyl chains, but the peak at about 23� was also observed at higher flow rate [Fig. 4(e)], maybe due to the increase in misorientation. C. Optical absorption
A vast literature is available on the optical absorption spectra of P3HT. Absorption of solid state films shows remarkable redshift with respect to that of the polymer in solution.28 When the solid film is formed from high molecular weight regioregular polymer, molecular chains tend to develop from the coil-like structure in solution29 into more planar, rigid rod-like morphology. Such a morphological change, together with the extended conjugation length in the polymer backbone, induces an extra delocalization of the p states, and consequent decrease of the excitonic energy. Another effect is the number of rotations (tilts) of backbone planes which stabilize the crystal structure.30 The main effects of this rotation were to decrease the bandwidth along the stacking direction by 25% and a slight increase of the bandgap (0.1–0.5 eV).30 The absorption spectra collected on the present ESD films showed three main features: a) a first shoulder structure at about 596 nm (2.08 eV); b) a second one at about 549 nm (2.26 eV); c) a broad feature centered around 515 nm (2.41 eV), which was the maximum of the spectrum used for the normalization. In particular, the latter two structures were due to the p to p* intra-chain transitions of the p conjugated polymer backbone. On the contrary, the low energy state at 2.08 eV (a) has a mixed contribution from inter-chain p to
p* (Ref. 31) transitions and from strong p-conjugation due to planarized sections32 along the main chain. As it can be observed in Fig. 5(a), very similar absorption spectra were obtained regardless the growth speed for type I samples. In the panel 5(a) was reported also the typical absorption spectra obtained for a spin-coated film,33 showing a comparable absorption spectrum. At variance with these characteristics were the spectra from type II samples. In these cases spectra were reported in Fig. 5(b). In particular, the vibronic structure at 596 nm, and the feature due to conjugation length at 549 nm were enhanced with respect to type I samples. This observation suggested a stronger planarization and better p-p interaction when a fast aggregation was occurring (4.0 ll/s) from a more concentrated solution. The spectral width of Fig. 5(b) increased indicating a sizable amount of torsion and inhomogeneous conjugation in larger solution concentration and flow rate samples.34 In the work of Park et al.35 the ordering transition (with substantially the same effects seen here in the GIXRD and optical absorption) was associated with thermal annealing above the melting point of the film. We exclude that those effects could derive from temperature annealing experienced during the spray mainly because higher flow rates means a less exposure to the high electric field, and because recent experiments of annealed P3HT above the glass transition temperature, reported only an increment in the absorption with a preserved shape of the absorption spectrum.36 D. Photoelectron spectroscopy
Photoelectron data were collected on films grown on conductive ITO substrates, in order to avoid charging and smearing effects in the spectra. In general, an oxidation free P3HT film37 shows well resolved photoemission peaks33 between 0.5 and 1.0 eV in binding energy (BE) attributed to the delocalized all C2pz-p
Downloaded 16 Sep 2011 to 147.210.63.234. Redistribution subject to AIP license or copyright; see http://jap.aip.org/about/rights_and_permissions
054515-5
Ali et al.
J. Appl. Phys. 110, 054515 (2011)
FIG. 3. (Color online) AFM pictures showing the morphology dependence at different conditions of films grown with a rate of 2.0ll/s at solution concentration of 0.1 (left images) and 0.5 mg/ml (right images) and sample thickness of about 70 (lower images) and 200 nm (upper images).
states, while features localized between 1.0 and 2.5 eV BE have major contribution from C2pz and from S3pz atomic orbitals. In addition, the peak located around 3.8 eV includes localized p states with S3pz and weak contributions from atomic C2pz orbitals.38 When looking at deeper energy levels, they are dominated by the alkyl chain r states (not affected by the polymer backbone structural changes) between 6 and 10 eV BE. In particular, the contributions from the aromatic backbone r states are localized at the lower energy side and the localized p states in the higher energy region. Finally, at 13 eV BE mainly electronic states with C2s character39,40 are observed.
FIG. 4. (Color online) Grazing incidence XRD from P3HT films: from (a) to (c) the diffraction patterns of 0.1 mg/ml solution at the speed of 1.3, 2.0, and 4.0 ll/s, respectively. Curves (d)–(e) represent the patterns of 0.5 mg/ml solution samples grown at 2.0 and 4.0 ll/s flow speed, respectively. In the inset is reported the sketch of the grazing geometry.
Furthermore, photoelectron spectra might give interesting hints about the conformation of the film and the orientation of the molecular orbitals when related to a variation in spectral intensity in the region of localized states.33 We reported in Fig. 6(a) well resolved HeII UPS spectra taken at 45� of polar angle, showing a higher intensity of r states at 9 eV BE (peak labeled “d”) for type I samples (plotted by circles), while p states at 3.8 eV (peak “b”) were enhanced in the case of type II samples (plotted by squares). Following a recent study by Tao and coworkers,41 such a behavior might be proof that in type I samples, alkyl chains shielded the photoemission from the thiophene rings by protruding toward the vacuum, indicating an edge-on geometry of the P3HT backbone. On the other side, unshielded photoemission from the flat and exposed p system occurred in the case of type II samples. A second more quantitative evidence came from the angular study of the localized p states at 3.8 eV BE as a function of the grazing angle of incidence (b) of the He II photons, as reported in Fig. 6(b). The geometry of the experiment was sketched in the inset of panel Fig. 6(b) showing, respectively, the photon incidence angle b and the declination a of the thiophene rings with respect to the horizontal plane. By the angular dependence in UPS spectra, different behavior in the case of the two sets of samples was found. Features from 0.5 to 3.75 eV which are due to delocalized and localized Cpz and Spz states perpendicular to the polymer backbone were fitted with Voigt functions after the subtraction of the linear background and properly normalized to avoid thickness effects. The intensities of the areas at different incidence angle b were plotted against (sinb).2 A linear trend was observed in case of type II ESD films. The linear fit was used to extrapolate intensities at 0 and 90� incidence, which were then used to calculate the figure-of-merit
Downloaded 16 Sep 2011 to 147.210.63.234. Redistribution subject to AIP license or copyright; see http://jap.aip.org/about/rights_and_permissions
054515-6
Ali et al.
FIG. 5. Absorption spectra of samples grown at different concentrations of the solution: Panel (a): less concentrated solution (0.1 mg/ml) and speed of 1.3, 2.0, and 4.0 ll/s. Typical spectrum of a spin coated sample is also reported. Panel (b): from the 0.5 mg/ml solution samples grown at 1.3, 2.0, and 4.0 ll/s.
R ¼ [I(90) - I(0)]/[I(90) þ I(0)] yielding a value of -0.15. This indicated that high concentration ESD film had a tendency to form a major face-on configuration, while a purely face-on structure gave a value of -1.42 However, the linear trend was not observed in case of low concentration ESD films, with a minimum at 55� , an indication that the film structure was showing a mixed configuration without either face-on or edge-on dominant phases but quite far from having an isotropic configuration that would have led to a constant contribution. Similar mixed population was found by xray absorption in a recent work by DeLongchamp and coworkers43 and put in relation to the presence of tilted section of polymer chains.30 E. Transport studies and photoconductivity
The transport properties were studied by planar and sandwiched geometries. The results for the latter case for samples grown by the two different solution concentrations were reported in Figs. 7(a) and 7(b), respectively. As it can be seen a clear diode-like behavior in the type II samples [Fig. 7(b)] was found, while a less rectifying
J. Appl. Phys. 110, 054515 (2011)
FIG. 6. (a) Normal photoemission (HeII) data of the sample grown at low concentration/low speed (type I samples depicted by circles) and high concentration/high speed conditions (type II, squares) at 2 kV voltage. The angle between the light and the detection direction (normal emission) is 45� . (b) Normalized intensity behavior of the localized p states at 3.8 eV BE, as a function of the grazing angle b of photon incidence for the type I (open symbols) and type II samples (full symbols). In the inset is shown the pictorial sketch of the photoemission experiment during b scans.
behavior was observed in Fig. 7(a), for the type I samples. Probably the reason for the latter one was the lower shunt resistance44 because of the peculiar morphology and/or because of the high series resistance. A complementary information came from the planar conductivity in a different structure with in-plane electrodes. At high electric fields of the order of 105 V/cm, the traps can be filled up completely and the space charge limited regime is dominant.45 In the charge limited current approximation, the mobility can be described by the formula l ¼ (8Jd3)/(9e0erV2) in terms of the dielectric constant (er ¼ 6.5) for the sample grown at low concentration and at high concentration (flow speed 2 ll/s). By this analysis, the higher concentration samples (Fig. 8) showed a mobility three times larger than that obtained from type I samples. Though such mobilities are still about two orders of magnitude below those ones reported in literature from spin coated P3HT films,46 a particular behavior of these samples by changing illumination conditions was observed. In fact, type I samples reported in Fig. 8(a) showed a strong photoeffect with increase in carriers under illumination close to 50%.
Downloaded 16 Sep 2011 to 147.210.63.234. Redistribution subject to AIP license or copyright; see http://jap.aip.org/about/rights_and_permissions
054515-7
Ali et al.
FIG. 7. I-V curves of 100 nm P3HT film sandwiched between ITO/PEDOTPSS and Al electrodes by lower (a) and higher concentration solution (b), respectively, in dark and ambient illumination conditions.
Such a sizable response is more important than in type II samples. The spectral photoconductivity normalized to the incident power confirmed a strong absorption in the 600 nm region (see Fig. 9) in type II samples.
J. Appl. Phys. 110, 054515 (2011)
FIG. 8. I-V curves of planar structure of 100 nm P3HT film grown between Al electrodes with 150 lm gap separation by lower and higher concentration solution, respectively, in dark and ambient illumination conditions.
grown by casting or in some cases by spin coating. Actually, if the regioregularity was reduced and/or the molecular weight increased, a flat-on growth was obtained with reduced crystallinity. Nevertheless a general loss of crystallinity is
IV. DISCUSSION AND CONCLUSIONS
The structure of a P3HT films consists of a crystalline packaging of main conjugated polymer chains well oriented along the p stacking direction. In such systems the formation of tilted or rotated structures has been found to reduce the total energy of about 0.4 eV/monomer,30 at the expense of the crystalline mobility by increasing the effective electron mass. In fact, high in-plane mobility in P3HT films was reached in “edge-on” conformations of the polymer chains with thiophene rings perpendicular with respect to the substrate.5 Such a conductivity was found about three orders of magnitude larger than the conductivity in films with “flaton” oriented chains. The difference was given by the hopping through p orbitals along the stacking direction oriented toward the conduction channel. This was the condition obtained in the case of low molecular weight polymer films
FIG. 9. Spectral photoresponse after normalization to incident power for the higher and lower concentration solution samples grown on corning glass. Al metallic contacts have 150 lm separation gap.
Downloaded 16 Sep 2011 to 147.210.63.234. Redistribution subject to AIP license or copyright; see http://jap.aip.org/about/rights_and_permissions
054515-8
Ali et al.
not always detrimental to the overall conductivity. In fact, a better connectivity is obtained by means of enhanced conjugation length and the complexity of the structure overcomes the limitation posed by the grain boundaries47 responsible for the poor overall conductivity in low molecular weight P3HT fibrils. In the present work, we found that the electro-spray growth is regulated by both the solution concentration and the flow rate indicating that the electric field applied to each molecule is an important parameter for the growth, able to tune the final characteristics of the film. By the present study, we found that the samples grown by a lower concentration solution and lower rates showed clear indications of different conformation from samples obtained by more concentrated solutions and larger flow rates. These two cases represent the two extremes of the highest and lowest electric field perturbation that can be applied to the solute, within the range of operation of the present tool, depending largely on the mechanical design and the pumping system. While at lower concentration solution we evidenced a non-planar orientation or edge-on ring conformation, at higher concentration the self-assembly of the molecules was pointing to a more planar orientation with a more isotropic continuous growth mode character. In fact, when the solution was less concentrated, selfassembly could be initiated by a stronger electric field experienced by the polymer with possible effects on the polymers alignment and conjugation length. On the contrary, when the flow speed was increased and the solution more concentrated the effect of the ionization induced by the field was reduced accordingly, and molecules interacted giving rise more rapidly to packaged films with planar molecular orientation. Several observations supporting this view were presented in all the reported experimental characterizations like the morphology dependence seen by AFM or the orientation of the crystalline planes observed by GIXRD. In particular, though AFM alone could be misleading in relating the morphological and the transport properties48 recent AFM studies49 evidenced that annealing effects can induce large crystalline domains and anisotropic growth. Here similar effects were observed in the case of low concentrated solution samples but because of the sizable roughness intrinsic to the present deposition method, a close microscopic comparison with Ref. 49 was not possible. Similarly, the peculiar behavior of the optical absorption with enhanced vibronic features,34 in the case of high concentration solutions and high flow rate samples, or the angular anisotropy of the localized valence band p states are supporting this view. In the conductivity measured in “sandwich” configuration, perpendicular transport through the p stacking orientation was observed with a Schottky barrier characteristics in high concentration and flow rate solution samples. In planar structures, conductivity measurements showed again the predominance of the higher solution concentration samples in spite of the unfavored packaging direction of the p stacking, probably because of the longer conjugation
J. Appl. Phys. 110, 054515 (2011)
length and of the reduced crystalline grain boundaries of a more isotropic and continuous film. Nevertheless, a more intense photoconductivity effect was observed for low concentration solution films, indicating that of a more efficient photoabsorption was occurring because of the mutual orientation of the molecular orbitals and the incident electric field. In conclusion, we showed a way to vary efficiently the properties of self-assembling of a conductive polymer by finely tuning the speed of the growth and the solution concentration during electro-spray deposition. In fact, we observed a rapid transition from a prevalent edge-on building block of the polymer to a flat-on configuration. This fact could in some way remind the well known behavior of low/ high regio-regular assembling of spin coated or drop casting samples reported by Sirringhaus and coworkers,5 but in this case such a trend was obtained from the same organic material. Theoretical study of the atomistic process is now necessary to understand how the details of the self-assembling are influenced by the various parameters. 1
N. S. Sariciftci, L. Smilowitz, A. Heeger, and F. Wudl, Science 258, 1474 (1992). 2 S. E. Shaheen, C. J. Brabec, S. Sariciftci, F. Padinger, T. Fromherz, and J. C. Hummelen, Appl. Phys. Lett. 78, 841 (2001). 3 M. Reyes-Reyes, K. Kim, and D. L. Carroll, App. Phys. Lett. 87, 083506 (2005). 4 Z. Bao, A. Dodabalapur, and A. J. Lovinger, Appl. Phys. Lett. 69, 4108 (1996). 5 H. Sirringhaus, N. Tessler, and R. H. Friend, Science 280, 1741(1998). 6 C. Winder and N. S. Sariciftci, J. Mater. Chem. 14, 1077 (2004). 7 H. Hoppe, D. A. M. Egbe, D. Mu¨hlacher, and N. S. Sariciftci, J. Mater. Chem. 14, 3461 (2004). 8 S.-S. Sun and N. S. Saricifitci, editors, Organic Photovoltaics (Taylor & Francis, London, 2005). 9 J. Jo, S. Na, S. Kim, T. Lee, Y. Chung, S. Kang, D. Vak, and D. Kim, Adv. Funct. Mater. 19 2398(2009). 10 W. Ma, C. Yang, and A. J. Heeger, Adv. Mater 19, 1387 (2007). 11 C. N. Hoth, S. A. Choulis, P. Schilinsky, C. J. Brabec, Adv. Mater 19, 3973(2007). 12 P. Schilinsky, C. Waldauf, and C. J. Brabec, Adv. Funct. Mater. 16, 1669 (2006). 13 C. N. Hoth, R Steim, P. Schilinsky, S. A. Choulis, S. F. Tedde, O Hayden, and C. J. Brabec, Org. Electron. 10, 587 (2009). 14 G. Susanna, L. Salamandra, T. M. Brown, A. Di Carlo, F. Brunetti, and A. Reale, Sol. Energy, Mater. Sol. Cells, 95, 1775 (2010). 15 R. Green, A. Morfa, A. J. Ferguson, N. Kopidakis, G. Rumbles, and S. E. Shaheen, Appl. Phys. Lett. 92, 033301 (2008). 16 T. Ishikawa, M. Nakamura, K. Fujita, and T. Tsutsui, Appl. Phys. Lett. 84, 2424 (2004). 17 D. J. Vak, S. S. Kim, J. Jo, S. H. Oh, S. I. Na, J. W. Kim, and D. Y. Kim, Appl. Phys. Lett. 91, 081102 (2007). 18 A. J. Jaworek, Mater. Sci. 42, 266 (2007). 19 J. C. Swarbrick, J. B. Taylor, and J. N. O’Shea, Appl. Surf. Sci. 252, 5622 (2006). 20 N. Dam, M. M. Beerbom, J. C. Braunagel, and R. Schlaf, Appl. Phys. 97, 24909 (2005). 21 A. J. Cascio, J. E. Lyon, M. M. Beerbom, R. Schlaf, Y. Zhu, and S. A. Janecke, Appl. Phys. Lett. 88, 062104 (2006). 22 K. Q. Tang and A. Gomez, J. Colloid Interface Sci. 184, 500 (1996). 23 S. E. Park, J. Y. Hwang, K. Kim, B. Jung, W. Kim, and J. Hwang, Solar. Ener. Mater. Sol. Cells, 95, 352 (2011). 24 J. S. Kim, W. S. Chung, K. Kim, D. Y. Kim, K. J. Paeng, S. M. Jo, and S. Y. Jang, Adv. Funct. Mater. 20, 3538 (2010). 25 L. Y. Wong, R. Q. Png, F. B. Shanjeera, L. L. Chua, D. V. MAheswar Repaka, S. Chen, X. Y. Gao, L. Ke, S. J. Chua, A. T. S. Wee, and P. K. H. Ho, Langmuir 26, 15494 (2010). 26 D. H. Kim, J. T. Han, Y. D. Park, Y. Jang, J. H. Cho, M. Hwang, and K. Cho, Adv. Mater. 18, 719 (2006).
Downloaded 16 Sep 2011 to 147.210.63.234. Redistribution subject to AIP license or copyright; see http://jap.aip.org/about/rights_and_permissions
054515-9 27
Ali et al.
T. J. Prosa, M. J. Winokur, J. Moulton, P. Smith, and A. J. Heeger, Macromolecules 24, 4364 (2002). 28 A. O. Patil, A. J. Heeger, and F. Wudl, Chem. Rev. 88, 183 (1988). 29 D. Neher, Adv. Mater. 7, 69 (1995). 30 J. E. Northrup, Phys. Rev. B 76, 245202 (2007). 31 P. J. Brown, D. S. Thomas, A. Kohler, J. S. Wilson, J. Kim, C. M. Ramsdale, H. Sirringhaus, and R. H. Friend, Phy. Rev. B 67, 064203 (2003). 32 R. D. McCullough, R. D. Lowe, M. Jayaram, and D. L. Andersson, J. Org. Chem. 58, 904 (1993). 33 M. Abbas, F. D’Amico, M. Ali, I. Mencarelli, L. Setti, E. Bontempi, and R. Gunnella, J. Phys. D: Appl. Phys. 43, 035103 (2010). 34 M. Kobashi and H. Takeuchi, Macromolecules 31, 7273 (1998). 35 Y. D. Park, J. H. Cho, D. H. Kim, Y. J. Hwa, S. Lee, K. Ihm, T.-H. Kang, and K. Cho, Electr. Solid-State Lett. 9, G317 (2006). 36 Y. C. Huang, Y. C. Liao, S. S. Li, M. C. Wu, C. W. Chen, and W. F. Su, Solar Ener. Mater, Solar Cell 93, 888 (2009). 37 M. Shimomura, Y. Ikejima, K. Yajima, T. Yagi, T. Goto, R. Gunnella, T. Abukawa, Y. Fukuda, and S. Kono, Appl. Surf. Sci. 237, 75 (2004). 38 X. T. Hao, T. Hosokai, N. Mitsuo, S. Kera, K. K. Okudaira, K. Mase, and N. Ueno, J. Phys. Chem. B 111, 10365 (2007). 39 W. R. Salaneck, O. Inganas, B. Themans, J. O. Nilsson, B. Sjogren, J. E. Osterholm, J. L. Bredas, and S. Svensson, J. Chem. Phys. 89, 4613 (1998).
J. Appl. Phys. 110, 054515 (2011) 40
L. L. Chua, M. Dipankar, S. Sivaramakrishnan, X. Gao, D. Qi, A. T. S. Wee, and P. K. H. Ho, Langmuir 22, 8587 (2006). 41 X. T. Tao, T. Hosokai, N. Mitsuo, S. Kera, K. K. Okudaira, K. Mase, and N. Ueno, J. Phys. Chem. B 111, 10365 (2007). 42 M. C. Gurau, D. M. Delongchamp, B. M. Vogel, E. K. Lin, D. A. Fisher, A. Sambavisan, and L. J. Richter, Langmuir 23, 834 (2007). 43 D. M. Delongchamp, B. M. Vogel, Y. Jung, M. Gurau, C. A. Richter, O. A. Kirilov, J. Obrzut, D. A. Fisher, S. Sambavisan, L. J. Richter, and E. K. Lin, Chem. Mater. 17, 5610 (2005). 44 G. Winder, G. Matt, J. C. Hummelen, R. A. J. Janssen, N. S. Sariciftci, and C. J. Brabec, Thin Solid Films 403, 373 (2002). 45 C. Goh, R. J. Kline, M. D. McGehee, E. N. Kadnikova, and J. M. J. Frechet, Appl. Phys Lett. 86, 122110 (2005). 46 M. Giulianini, E. R. Waklawick, J. M. Bell, and N. Motta, Appl. Phys. Lett. 94, 083302 (2009). 47 R. J. Kline, M. D. McGehee, E. N. Kadnikova, J. Liu, and J. M. Frechet, J. Adv. Mater. 15, 1519 (2003). 48 A. Salleo, R. J. Kline, D. M. Delongchamp, and M. L. Chabinyc, Adv. Mater. 22, 3812 (2010). 49 R. Zhang, B. Li, M. C. Iovu, M. Jeffries-El, G. Sauve, J. Cooper, S. Jia, S. Tristram-Nagle, D. M. Smilgies, D. N. Lambeth, R. D. McCullough, and T. Kowalewski, J. Am. Chem. Soc. 128, 3480 (2006).
Downloaded 16 Sep 2011 to 147.210.63.234. Redistribution subject to AIP license or copyright; see http://jap.aip.org/about/rights_and_permissions