HIGHWAY SPACE INVENTORY CONTROL SYSTEM: BASIC ... potential passengers to take into account different factors (ticket prices, departure times, number ...
This is the final version (unedited) of the paper published in Transportation Research Part C Edara, P., and Teodorovic, D. Model of an advance‐booking system for highway trips in: Transportation Research C – Emerging Technologies, Vol. 16. Issue 1, pp. 36‐53, 2008.
MODEL OF AN ADVANCE-BOOKING SYSTEM FOR HIGHWAY TRIPS Praveen Edara1 and Dušan Teodorović 2 1
System Operations and Traffic Engineering, Virginia Transportation Research Council, 530 Edgemont Rd, Charlottesville, Virginia, 22903, U.S.A.
2
Faculty of Transport and Traffic Engineering, University of Belgrade, Vojvode Stepe 305, 11000 Belgrade, Serbia ABSTRACT
In the 16th International symposium on transportation and traffic theory, we had presented a novel demand management concept known as the Highway Space Inventory Control System (HSICS). The basic idea of HSICS is that all road users have to make reservations in advance to enter the highway. The system allows highway operators to make real-time decisions whether to accept or reject travellers' requests to use the highway system in order to achieve certain system-wide objectives. The proposed HSICS model consists of two modules – Highway Allocation System (HAS) and the Highway Reservation System (HRS). The HAS is an off-line module that determines the maximum number of trips from each user class (categorized based on time of departure, vehicle type, vehicle occupancy, and trip distance) to be accepted given a pre-defined demand. It develops the optimal highway allocations for different traffic scenarios. The “traffic scenarios-optimal allocations” data obtained in this way enables the development of HRS. The HRS module operates in the on-line mode, where there is uncertainty in the travel demand, to determine whether a request to make a trip between certain origin-destination pair during a certain time interval is accepted or rejected. A shortcoming of the proposed HAS formulation (in Teodorovic and Edara, 2005) was the assumption of constant speed which would lead to less accurate position updates. In this paper, we replaced this constant average speed with link-specific space mean speed that is estimated using the Greenshields speed-density relationship. This led to a HAS formulation that is complex but more accurate than the previous one. The proposed model was illustrated using a numerical example of a highway section. Due to the non-linearity of the formulation, search for optimal solution was abandoned and a good solution was obtained using Genetic Algorithms together with penalty functions. INTRODUCTION In urban areas around the world, the number of trips made by single-occupant vehicles has significantly increased in recent decades. Expanding road network capacities to cater to this demand is becoming increasing infeasible and extremely costly. Transportation planners, traffic engineers, and economists have introduced various demand management methods in an attempt to at least partially alleviate this fast growing traffic congestion. Strategies such as park-and-ride, high occupancy vehicle lanes (HOV) (Giuliano et al., 1990; Yang and Huang, 1999; Dahlgren, 2002), high occupancy toll lanes (HOT) (Abdelghany et al., 2000; Murray et al., 2001), congestion pricing (Vickrey, 1963, 1969, 1994, de Palma and Lindsey, 2002; Verhoef, 2002; Yang and Huang, 1999; Yang and Zhang, 2003; Zhang and Yang, 2004; Phang and Toh, 2004)) have been implemented in many cities across the world. Successfully implemented demand management strategies can result in significant toll revenues, decrease
in total number of vehicle trips, decrease in total number of vehicle trips during peak periods, increase in number of vehicle trips during off-peak periods, increase in ridesharing, rise in public transit ridership, and in some cases increased telework. In this paper, a relatively new demand management concept, Highway Space Inventory Control System (HSICS), is presented. This concept was first discussed in Teodorovic and Edara (2005). The basic idea of HSICS is that all road users have to make reservations in advance to enter the highway. The system allows highway operators to make real-time decisions whether to accept or reject travellers' requests to use the highway system in order to achieve certain system-wide objectives. The proposed HSICS model consists of two modules – Highway Allocation System (HAS) and the Highway Reservation System (HRS). The HAS is an off-line module and determines the maximum number of trips from each user class (categorized based on time of departure, vehicle type, vehicle occupancy, and trip distance) to be accepted by the system given a pre-defined demand. It develops the optimal highway allocations for different traffic scenarios. The “traffic scenarios-optimal allocations” data obtained in this way enables the development of HRS. The HRS module operates in the online mode, where there is uncertainty in the travel demand, to determine whether a request to make a trip between certain origin-destination pair during a certain time interval is accepted or rejected. The Highway Allocation System is modelled in the form of an integer program with the objective to maximize total travelled passenger miles. A neural network approach is used to model the HRS. A shortcoming of the HAS formulation proposed in Teodorovic and Edara (2005) was the assumption of constant speed which would lead to less accurate position updates of vehicles on the highway. In this paper, we replace this constant average speed with link-specific space mean speed that is estimated using the Greenshields speed-density relationship. This results in a HAS formulation that is complex but more accurate than the previous one. The proposed model is illustrated using a numerical example of a highway section. The remaining part of the paper is organized in the following way. Section 2 will cover the literature review on highway booking, section 3 will explain in detail the basic characteristics of the proposed HSICS, section 4 discusses the possible impacts of the proposed system, section 5 will present the improved HSICS model, section 6 describes the numerical example, solution approach, and results, and sections 7 and 8 discuss future research issues and conclusions. LITERATURE REVIEW The concept of highway booking is not a well explored topic in the area of travel demand management. Akahane and Kuwahara (1996) have studied the benefits of trip reservation systems that manage highway traffic demand on holidays based on a stated-preference survey. Wong (1997) proposed a qualitative approach for the highway booking problem. In the paper, he developed a conceptual framework of a highway booking system and discussed the advantages of such a system. Koolstra (1999) studied the potential benefits of slot reservation on highways by analyzing the difference between user equilibrium departure times and system optimal departure times. de Feijter et al. (2004) have proposed trip booking as a method for improving the travel time reliability and increasing the effective usage of road capacity. The proposed system aims at open dedicated infrastructure, such as bus lanes and
dedicated freight lanes. Using simulation experiments they further prove the advantages of such a booking system. While all these papers have discussed the advantages and issues related to trip reservation systems, none of them have developed a comprehensive model of highway booking system that will optimally allocate the highway space to potential users during different time intervals together with a reservation system that will accept/reject user travel requests. In this paper, we propose a methodology to build such a comprehensive model. The proposed methodology has two steps - offline optimization module and online reservation module. HIGHWAY SPACE INVENTORY CONTROL SYSTEM: BASIC CHARACTERISTICS The basic idea of the highway-booking concept is that all road users have to book in advance. Airline industry, hotels, car rental, rail, and many other industries are utilizing reservation systems and revenue management concepts when selling their products (Littlewood, 1972; Belobaba (1987, 1989); Brumelle and McGill, 1993; Cross, 1997; and Teodorovic et al., 2002). Successful development and implementation of various revenue management strategies would not be possible without the development of Global Distribution Systems (GDS). GDS provided airlines with full and accurate information about the reservations made/cancelled, tickets sold, seat availability and helped airlines to fully control their seat inventories. Internet provides information on ticket prices to millions of users, and together with e-commerce, it has opened a new stage in the revenue management concepts and practice. Internet airline ticket sales have risen quickly. New forms of airline ticket sales like on-line travel agents, air carriers’ web sites, and various forms of auctions and “last minute sales” appeared on the market in the late 1990’s. Using web sites of online travel agents, passengers explore various travel options. Majority of web sites are user friendly and allow potential passengers to take into account different factors (ticket prices, departure times, number of connections, etc) when making travel decision. Some airlines already sell significant percentage of their tickets through their own web sites. The era of dynamic airline ticket pricing has already begun, opening a lot of complex problems to practitioners and air transportation researchers. The roots of revenue management lie in the airline industry. Revenue management could be described as a group of different scientific techniques of managing the company revenue when trying to deliver the right product to the right client at the right price at the right time. Last two decades showed that both airlines and passengers benefit from using the revenue management concept. Airlines increased their revenues, while great number of passengers paid reduced airline ticket prices for their travel. The basic characteristics of the industries to which different revenue management concepts were successfully applied are: (a) variable demand over time; (b) variable asset utilization; (c) perishable assets; (d) limited resources; (e) market segmentation; (f) adding new capacity is expensive, difficult or impossible; (g) direct cost per client is negligible part of the total cost of making service available; (h) selling products in advance. Revenue management concepts that have been developed in various industries could be used in the development of highway flow management concepts. We define highway traffic flow management as a group of different scientific techniques of
managing the highway flows when trying to enable highway usage to the right vehicle at the right price at the right place at the right time. By monitoring the number of vehicles on different routes during a day, week and month, certain patterns are noted that characterize the demand for highways usage. It is well known that transportation flows change over time (variable demand). Changes are noticed by month, by week, by day in a week, and finally by hour in a day. Transportation flow changes over time can be determined by collecting appropriate statistical data, as well as by conducting passengers’/drivers’ surveys. It is common in many industries (airlines, hotels) to use the term inventory to denote aircraft seats, hotel rooms, etc. These inventories are specific, in a sense that they are perishable. Airline or hotel inventories cannot be stored like inventories in some other industries. Every empty seat at the departure is definitely lost for the airline. In a similar way, the highway inventories are also perishable. Highway spaces not utilized during some time interval are lost. Highways also have limited resources. The available highway capacity is limited and cannot be expanded in a short time period. There is also market segmentation associated with the highway usage. The following are some of the possible categories of potential highway users: • • • • • •
Single-occupant cars Transit vehicles Carpools Trucks Low emission vehicles (LEV) Vehicles equipped with electronic toll collection
As mentioned earlier, the highway operator could offer to potential users during the same time interval a large number of different tariffs (or assign different priorities) based on a set of defined criteria. This is due to the highway operator’s potential desire to achieve the greatest possible number of passenger-miles along the highway, to spread peak over time and space, to accept the greatest possible number of low emission vehicles (LEV) and/or vehicles equipped with electronic toll collection units, to achieve the highest possible total revenue, etc. Tariffs paid by (or priorities assigned to) a specific user should reflect the user’s category as well as the date and time of making reservation (last minute requests should be charged higher or assigned least priority). Highway operators should offer various options to the highway users, for example, users willing to pay only low tariffs should be allowed to reserve the highway space well in advance. Highway users paying higher tariff should receive certain benefits like open date and/or time for come back, various cancellation opportunities, or possibility for planned trip change. On the other hand, users paying lower tariff should accept, for example, to make advanced booking, to pay penalty in the case of cancellation, etc. In this way, the highway operator would be able to minimize the unused highway space.
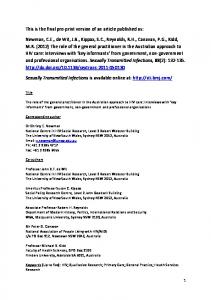
It is clear that the highway operator’s total number of passenger-miles generated, total number of accepted low emission vehicles (LEV) and/or vehicles equipped for electronic toll collection, and total revenue generated depend both on the tariffs (or priorities) that are offered and on the manner in which highway space is allocated to different user types. Like in some other industries (airlines, hotels), the simplest allocation system should be the "distinct highway space inventories", (Figure 1a) indicating separate highway space inventories for each class of highway users. In case of "nested highway space inventories", the high priority request will not be rejected as long as any highway space is available in lower priority classes. For example, if we have four highway priority classes, then there is no booking limit for class 1, but there are booking limits (BLi, i = 2,3,4) for each of the remaining three classes (Figure 1b). As we can see from Figure 1b, all highway spaces are always available to class 1. There are always a certain number of highway spaces protected for class 1, certain number of highway spaces protected for classes 1 and 2 and certain number of highway spaces protected for classes 1, 2 and 3. If we make a request-by-request revision of booking limits, there is no longer a difference between distinct and nested inventory system. There could be many other possible allocation procedures (some combination of distinct and nested is also possible) that can be applied to allocate the highway spaces. As in other industries, the highway operators should also sell their products (highway spaces) in advance. Highway tariffs could be fixed or they could vary with time (on an hourly basis). Highway operator would practically face the following dilemma all the time: Will I accept an early reservation from the user making low number of passengers-miles, and/or paying low tariff; or will I wait for a user who will make high number of passenger-miles and/or who is ready to pay higher highway tariff? Practically, highway operators would deal on a daily basis with both elastic and inelastic demand. (Figure 1 goes here) “Inelastic demand” is related primarily to business driven users who will travel certain route along a highway at certain time irrespective of the highway tariff. “Elastic demand” is related to potential highway users who can be attracted by appropriate tariff (or priority). Highway operators would try to divide fixed capacities (fixed highway space) on a daily basis between inelastic and elastic demand in such a way to maximize defined objective functions. In years to come, as the traffic congestion keeps growing, and with the progress made by Intelligent Transportation Systems (ITS), we believe that the highway space inventory control systems will be developed and implemented to manage the highway traffic flows effectively. Reservation requests can be made via telephones or electronically. Driver should specify entry time (within time interval whose width could be 5-10 minutes) on ramp, trip, and off ramp and inform the highway operator (by telephone or electronically). Requests would be usually made several days, hours, or minutes (last-minute request) before the planned trip. In this way, highway operator would know planned driver itineraries, as well as planned departure times. HSICS would explore, in real- time, the possibility of accepting driver’s request. In such a system, drivers making reservations in advance would be protected from unexpected
high traffic volumes that often result in significantly increasing the travel time. The assumption is that the highway operator would always accept limited number of driver requests, and in this way keep traffic flows within prescribed limits. In Table 1, the basic information that could be contained in a HSICS is shown. First column shows the request number, next six columns have the information given by the user to the operator, and the last column contains the operator’s decision whether to accept or to reject the user requests. (Table 1 goes here) When a driver’s request is accepted, it means that a space on the highway, during a certain time interval is reserved for the driver. We should expect that a certain number of drivers would cancel their reservations. Also, a certain number of drivers with valid reservations do not enter the highway as planned. These are the “no-show” drivers. The reasons for no-show drivers might be subjective (a last-minute change of plans) or objective (congestion on the paths leading to the entering ramp). In most cases, drivers with valid reservations would appear as planned. HSICS could operate with or without making overbooking. Overbooking could be a problem in situations when all the drivers who made reservations show up. Also, operating without overbooking would increase drivers’ confidence in the reliability of the new system and hence increase the number of drivers willing to use it. HSICS MODEL The proposed HSICS model consists of two modules – Highway Allocation System (HAS) and the Highway Reservation System (HRS). HAS is an offline module that allocates the highway sections (different Origin-Destination pairs) to various vehicle types (single occupant cars, car pools, public transit, trucks) during different time periods with the goal of optimizing the objective function(s) value(s) subject to the existing supply and demand constraints. It develops the optimal highway allocations for different traffic scenarios. The “traffic scenarios – optimal allocations” data obtained in this way enables the development of HRS. HRS is the on-line system that makes on-line decisions regarding the possibility to accept driver requests. The developed HRS is able to generalize, adapt, and learn based on new knowledge and new information. Proposed HRS is based on neural network training. The neural network learns from the optimal solutions of the analyzed past traffic scenarios. For every vehicle class a separate neural network is trained for making decisions about accepting/rejecting driver requests. The algorithm to model the proposed HSICS consists of the following steps: Step 1: Generate various traffic scenarios. (Collect cumulatives that are based on a large number of drivers’ requests on the highway in question). Step 2: Highway Allocation System: Formulate a corresponding integer programming problem and find the optimal allocation for each traffic scenario. Step 3: Highway Reservation System: Based on the statistical data resulting from Steps 1 and 2 train neural networks that will be capable of accepting/rejecting driver’s requests in real time.
In the following section, the HAS module is explained in detail. Highway Allocation System (HAS) The Highway Allocation System can be formulated as an integer program. One possible objective of the proposed HAS could be ‘maximization of the total passenger miles over a defined time period, for a defined length of the highway’. It is possible to prioritize vehicle types based on some criteria. For every trip, it is possible to calculate the passenger miles travelled during that trip, by knowing the vehicle occupancy and distance covered in the trip. When summed over all the O-D pairs and all time intervals, the total passenger miles travelled on the highway can be calculated. (Figure 2 goes here) Different sections of a highway have different utilization percentages, some sections can be heavily congested while some others could have free flow conditions. It is vital for any allocation procedure to check for the time-varying remaining capacity (vehicles/time) of different highway sections while allocating traffic. To carry out such an allocation procedure, the time period is divided into smaller time intervals, and the highway network is divided into a series of links (Figure 2), the road capacity remains same through out the link though it could vary with time. Also a ‘trip’ is defined as any combination of O-D pair, and Vehicle class. Each possible combination of these two attributes is a unique trip. In the HAS formulation, the objective function is to maximize the weighted (prioritized) total number of passenger miles over a defined time period and a defined length of the highway (Relation (1)). In this model, priorities can be assigned based on trip type (O-D pair and vehicle type). In a more general case, the users can be classified based on time of reservation requests and priorities assigned accordingly. However, in this model we do not consider that aspect. The allocation should be done in such a way that the total number of vehicles using a link during any time interval should not exceed the link capacity (Relation (2)). During any time interval, the traffic on a link consists of vehicles belonging to trip allocations in the current interval and vehicles belonging to trip allocations during earlier intervals that will be travelling on the link during the current interval. We define reserve capacity for every link in order to account for, a) providing access for emergency vehicles that cannot make reservations in advance, and b) uncertainty related to incidents or bad weather conditions. Also, the allocations for any trip should not exceed the corresponding demand value during that interval (Relation (5)). Based on these assumptions the HAS can be formulated as an integer program as shown below. T
I
Maximize F = ∑∑ pril ⋅ pmi ⋅ xil l =1 i =1
subject to
(1)
t
I
∑∑ θ
ilat
⋅ xil ≤ Ca - Ra , ∀a ∈ A, ∀t ∈ T
(2)
l =1 i =1
xil ≤ Dil , ∀i ∈ I , ∀l ∈ T xil ≥ 0, ∀i ∈ I , ∀l ∈ T
(3) (4)
xil are integer ∀i ∈ I , ∀l ∈ T
(5)
where: A ‘trip’ is defined as any combination of O-D pair and Vehicle class. Each possible combination of these two attributes is a unique trip. i - Trip index value I - Set of all trips l - Time interval at which vehicles enter the highway t - Current time interval
δ t - Size of time interval T - Set of all time intervals
pril - Priority of i th trip type during time interval ' l ' pmi - Passenger miles traveled in the i th trip xil - Number of vehicles of the i th trip type that can be accepted to enter the highway during time interval ' l '
Dil - Demand for i th trip to enter the highway during time interval ' l ' A - Set of all defined links Ca - Maximum capacity of link ' a ' Ra - Reserve capacity of link ' a ' Posilt - Current position (beginning of time interval ' t ') of vehicles belonging to i th trip that entered the highway during time interval ' l '
Posi 0 - Entry position of vehicles belonging to i th trip
j - index for an arbitrary time interval, j ≥ l ∀j , l ∈ T (introduced mainly for usage in position calculations) vilj - j th time interval speed of vehicles belonging to i th trip that entered the highway during time interval ' l ' uaj - Space mean speed of link ' a ' during time interval ' j '
u fa - Free flow speed of link ' a ' La - Length of link ' a ' K aj - Density of link ' a ' during time interval ' j '
K a ( jam ) - Jam density of link ' a ' 1, if Posilt ∈ a 0, if Posilt ∉ a
θilat =
(6)
t −1
Posilt = Posi 0 +
∑v
ilj
⋅δ t
(7)
j =l
vilj can be expressed in terms of link density and free flow speed using the Greenshields model, to obtain I j ∑∑ θilaj ⋅ xim t −1 A Posilt = Posi 0 + ∑∑ u fa ⋅ 1 − i =1 l =1 La ⋅ K a ( jam ) j = l a =1
⋅θ ⋅δ t ilaj
(8)
Speed estimation using density-speed relationship (similar to Greenshields model shown in relation (10)) has been used in the past by Mahmassani and Peeta (1993), and Jayakrishnan et al. (1995), while developing framework for dynamic traffic assignment. Mahmassani and Peeta (1993) have developed a discrete macroparticle traffic simulation model as a part of their dynamic assignment framework. In the simulation model, they assume that all vehicles on a link move at the same speed during a given time interval. Density and speed on each link are updated every time interval, as vehicles enter and leave a link. A similar approach is used by Jayakrishnan et al. (1995) in an optimization framework. They present additional insights into the usage of density-speed relationship rather than flow-speed relationship, including the fulfillment of first-in-first-out requirement and others. The formulated integer program is solved, and the allocations for all trips for all time intervals are obtained. Before we proceed to the next step of modeling the HRS, let us introduce the following notations (Figure 3) which will help for easier understanding of the HRS:
Te – Time at which the user wants to enter the highway To – Time at which the advance booking opens (e.g.: 5 days before the scheduled trip departure) Tr – Time at which an user requests a reservation to enter the highway at time Te Tc – Time at which the advance booking closes and no more requests for that trip-departure time combination can be accepted by the reservation system (the time at which all the HAS allocations for that trip-departure time combination have been reserved). – Advance booking interval is divided into smaller intervals of size each T = Tc - Tr, the amount of time after which the reservation system will be closed and no more travel requests from users of this trip type will be accepted. Positive value of T means that the request can be accepted, and negative T means that the request cannot be accepted. Dr – Cumulative number of requests by Tr Dc – Cumulative number of requests by Tc. It is the total number of HAS allocations for this trip-departure time combination (obtained from the integer program’s optimal solution) Dt – total number of requests from users willing to depart by Te The above defined variables can be better understood graphically. In Figure 3, the cumulative user requests over time are plotted for the demand related to one trip-departure time combination. The maximum number of allocations that can be done for this trip-departure time combination, Dc, is obtained from the HAS. From the plot, Tc can be obtained (the time corresponding to Dc), which is the time after which no more reservation requests for this tripdeparture time combination can be accepted. Users continue to make requests even after Tc until the trip’s departure time Te, though they will be rejected. (Figure 3 goes here)
Brief Description of Artificial Neural Networks Artificial neural networks are inspired by biology i.e., they are composed of elements that function similarly to a biological neuron. Neural networks are able to learn from experience, to apply to new cases generalizations derived from previous instances, and to abstract essential characteristics of input data that often contain irrelevant information (Teodorovic and Vukadinovic, 1998). The model of an artificial neuron copied the properties of a biological neuron. The input signals y1, y2, ..., yn, representing the output signals of other neurons, are multiplied by
associated connection strengths, w1, w2, ..., wn. Each connection strength (weight) corresponds to the strength of a biological synaptic connection. The output signal (NET) is equal to the weighted sum of input signals. The range of the weighted sum of input signals, NET, is compressed by an “S” curve such that the value of the output signal, OUT, never exceeds a relatively low level regardless of the value of NET. The strength of a neural network is obtained as a result of the connectivity and collective behaviour of the neurons. Neural networks store the strength of synaptic connections (weights of the network’s branches) by which the required data are reproduced. Learning refers to estimating the appropriate weights in order to reproduce certain decisions under particular conditions. In other words, neural networks can be trained by adjusting the connection strengths in order to abstract the relations between the presented input/output data. Training algorithms are very simple mechanisms for adapting the weights of a network’s branches.
Brief Description of Genetic Algorithms Genetic algorithms (GA) are heuristic search algorithms that search the feasible region using a population of solutions. They were first developed by John Holland at the University of Michigan. GAs are based on Darwin’s theory of Natural Selection (Goldberg, 1989). They are structured yet random searches in which the survival of fittest criteria is used to proceed from one generation of solutions to the next generation. Typical GA procedure is shown below: Step 1: Encode the parameter set for the problem, binary or real number representation Step 2: Randomly generate the initial population of n solutions (strings) and evaluate the fitness value (objective function value) for each of these solutions. Step 3: Select two strings from the current generation that will participate in reproduction, the selection probability being proportional to the fitness value. Step 4: Perform Crossover: Parents selected in the earlier step reproduce two offsprings by exchanging genetic material using the crossover operator. Step 5: Perform Mutation: With a very low probability, mutation operator is applied to the newly born offspring. Purpose of doing this is to introduce extra variability into the population of solutions. Step 6: Repeat steps 3, 4, and 5 until n offsprings are generated. These offsprings constitute the new generation of solutions. Step 7: Replace the old population of solutions with the new generation solutions and repeat steps 3 through 7 until the pre-specified number of generations or until there is no further improvement in the fitness value. Final solution is the best solution ever discovered during the search. GAs have the ability to arrive at the approximate solutions (close to optimal) for complex combinatorial optimization problems. GAs are probabilistic algorithms that perform a multidirectional search by maintaining a population of potential solutions, unlike the traditional search algorithms that process a single point of the search space at a time (Michalewicz, 1995). The new generation of solutions (on an average) is expected to perform better than the parent population because only the ‘good’ solutions of parent population were made to participate in mating.
Highway Reservation System (HRS) The Highway Allocation System (HAS) allocates the highway space, off-line, to vehicles belonging to all trip-departure time combinations. This is the supply that is allocated. Users who wish to travel on the highway during any time interval should make reservations in advance. The reservation center could be opened several days before the trip’s scheduled departure time, and the users can make requests for reservations either by calling or via internet. When the user makes a request, he/she has to furnish trip details including the preferred departure time, vehicle class used for the trip (single occupant car, carpool, transit, etc.), and the desired origin and destination for the trip (highway entry/exit locations). Using this trip information and the time at which the user is making the request, the operator has to make a decision whether to accept or reject the user request. This task of decision making is trivial in the event that the demand for travel during some time in the future is deterministic. However, it is difficult to predict the future demand patterns in an accurate manner. The operator has to make real-time decisions based on the cumulative requests at that instant, as he is unaware of the future requests. When a user makes a request at time Tr, the cumulative plot is known only until time Tr, so time Tc and time T can not be calculated. To calculate these values we propose a Highway Reservation System (HRS) that uses data related to past demand patterns in training a group of artificial neural networks (ANNs) that will be used for real-time decision making. We propose one neural network for each vehicle class (see Figure 4). Let us illustrate using an example the procedure of defining the inputs/outputs of the neural network for any one vehicle class (say vehicle class 1). Using vehicle class 1, many trip-departure time combinations are possible. For each such trip-departure time combination there exists a cumulative requests plot as shown in Figure 3, that can be obtained from past data (there is no uncertainty in past data, the operator knows it). Using the HAS module, the maximum number of allocations, Dc, that can be done during any time interval can be obtained. From the cumulative requests plot, the closing time Tc corresponding to demand Dc is obtained. Also, the ‘advance booking interval’ is divided into ‘n’ smaller time intervals of size ‘ ’ each. Assuming that the requests are made at the end of each small time interval (of size ‘ ’), for each of these requests, the T value and the corresponding cumulative requests value Dr can be read from the cumulative plots (Figure 3). The inputs for the neural network are the cumulative requests Dr, and the corresponding outputs are the T values (Figure 3). The number of inputs is equal to the number of trip-departure time combinations for this vehicle class (see Figure 3). Also, the number of outputs is equal to the number of inputs. The same procedure is repeated for several “traffic scenarios” and corresponding cumulatives are generated, this statistical data enables neural network training. Once the trained network is obtained, it can be used for real-time decision making. When the user makes a request at time Tr, then the Dr value is obtained from its cumulative plot (user specific trip-departure time combination plot), and the Dr values for other trip-departure time combinations (but same vehicle class) are also obtained from their respective cumulative plots. Now this data is entered into the trained neural network and the output T values are obtained. If the output T value is positive then the operator will accept the user request, else rejects it. In this way, past data can be used for training the neural networks and solve the problem of uncertainty in future demand, and real-time decisions can be made. Same procedure is followed for
developing neural networks for the remaining vehicle classes. Since the proposed HRS currently does not exist, the data related to reservation request rates has to be assumed for now, and later on once the system is in place and users start making requests for daily travel, the data can be collected and used in the future. (Figure 4 goes here)
NUMERICAL EXAMPLE Assumptions and Data The proposed HSICS is illustrated on the following numerical example. We consider a three lane highway section consisting of five entry ramps and four exits as shown in Figure 5. These entry-exit ramp configurations result in ten origin - destination pairs - (entry1, exit1), (entry1, exit2), (entry1, exit3), (entry1, exit4), (entry2, exit2), (entry2, exit3) (entry2, exit4) and (entry3, exit3), (entry3, exit4), (entry4, exit4). Let us consider four vehicle classes – Single Occupant Vehicles, Car Pools (vehicle occupancy>1), Transit Vehicles, and Trucks. (Figure 5 goes here) The time period for which allocations are done is 7:00 am to 8:00 am. This one hour period is further divided into 20 smaller time intervals of 3 min size. The following other assumptions are also made Maximum capacity ( Ca ) = 2050 vphpl, Reserve capacity ( Ra ) = 400 vphpl, Maximum speed limit = 55 mph, Jam density = 150 vpmpl, Reserve density = 30 vpmpl, Length of highway links = [5mi, 6mi, 5mi, 7mi], Total time period = 60 min, Interval size = 3 min, Priority based on vehicle type {single occ car, car pool, transit, truck} = [0.8,1.2,1.5,0.8], Vehicle occupancy {single occ car, car pool, transit, truck} = [1,2,15,1], Mileage for all o-d pairs = [5,11,16,23,6,11,18,5,12,7], Priority based on trip mileage = [5/23,11/23,16/23,23/23,6/23,11/23,18/23,5/23,12/23,7/23],
HAS solution using Genetic Algorithms In this section, we first define a real-value encoding for the individual solutions (chromosomes) as follows (Figure 6): (Figure 6 goes here) Each solution consists of values for 800 variables (= 10 O-D pairs × 4 Vehicle classes × 20 Time intervals). Fitness value for every solution is evaluated by substituting the values of variables in the objective function. Solutions that violate constraints (infeasible solutions) are penalized and the penalty is subtracted from the fitness value. For an excellent summary on
different techniques to deal with the constraint violation problems in genetic algorithms, the reader is referred to the work of Coello Coello (1999b). In this study we use non-stationary penalties, proposed by Houck et al. (1995), to penalize the infeasible solutions as shown below: fitness ( X ) = f ( X ) − (C × k )α × S ( β , X ) gi ( X ) ≤ 0, i = 1,..., m
0 Di ( X ) = g i ( X )
(9) (10)
gi ( X ) ≤ 0 otherwise
(11)
m
S ( β , X ) = ∑ Diβ ( X ), β = 1, 2,...
(12)
i =1
C , α , β = User Defined Constants
(13)
k = Generation #
(14)
Since the HSICS problem is a maximization one, in relation (9) the penalty (C × k )α × S ( β , X ) ) is subtracted from the original fitness value ( f ( X ) ) to obtain the penalized fitness value ( fitness ( X ) ). Obviously, penalty is a function of the amount of constraint violation by the solution ( S ( β , X ) ) as expressed in relations (11) and (12). Relation (10) includes relations (2), (3) and (4) shown earlier in the HSICS. In our example, we use C = 1, α = 1, β = 1 to start with, and later on change them to check the sensitivity of the best solution with respect to these parameters (not shown in this paper). As it can be seen, the amount of penalty increases as the generations increase (function of generation number, k). At the beginning of search, the algorithm allows for a wider search space and as the generations increase it forces the GA to improve on the existing solutions and less chance to explore, hence converging. After generating the first generation solutions (100 nos.) randomly and penalizing the infeasible solutions, parents are selected for reproduction based on simple roulette wheel procedure, and then the crossover and mutation operators are applied to the selected parents. Single point crossover, as shown below, is used to generate the offsprings. In Figure 7, parent 1 is the blue string and parent 2 is the red string of values. Crossover occurs (say) at the beginning of 12th time interval, and the genetic material is exchanged, offspring 1 has the genes of parent 1 until the 12th interval and the remaining part of parent 2. Offspring 2 is the exact opposite, first part consists of genes from parent 2 and the second part comes form parent 1. (Figure 7 goes here)
Mutation operator was applied (see Figure 8) with a probability of 0.05, by changing the value of a variable to a randomly chosen value from its range (minimum, maximum). (Figure 8 goes here) The generated offsprings constitute the next generation population. The same procedure (reproduction, crossover, mutation) was repeated for 500 generations in MATLAB® and the results obtained are shown in Figures 9 and 10. (Figure 9 goes here) In Figure 9, X axis shows the generation number and the Y axis corresponds to the Fitness value. In every generation two values are plotted – the best solution (feasible or infeasible) and the best feasible solution. Figure 10 shows the penalty (for violating constraints) corresponding to the best solution in every generation. It can be seen that if the best solution in a generation is also feasible, then the corresponding penalty is equal to zero (for example, see generations greater than 300).
HRS results The solution approach used for the online reservation system is same as the one discussed in Teodorovic and Edara (2005). Since this paper is only new in terms of the improved formulation of the HAS and its solution approach, we have not developed a new set of neural networks for this numerical example. Figure 11 is a reproduction of the performance of the neural network based HRS as reported in Teodorovic and Edara (2005). HRS makes decisions whether to accept or reject the user requests based on the calculated T value. T as defined earlier is the difference in ‘closing time of the reservation system (Tc)’ and the ‘time at which user makes travel request (Tr)’. User request is accepted if T is positive, else it is rejected. Tc is determined from HAS and the cumulative request plots discussed in section 6. From the figure, one can see that there are only few incorrect predictions (the points lying in the 2nd and the 4th quadrants) made by the neural network. (Figure 10 goes here) (Figure 11 goes here)
IMPLEMENTATION ISSUES To implement the proposed advance booking system (the HSICS) many implementation issues need to be addressed. Some of them are listed below -
•
Early/Late arrivals - what to do when a driver with reservation to enter at 9:00 am arrives at 8:40 am at the entrance ramp, even prior to some drivers who made reservations to enter at 8:45 am? Will he/she be asked to wait, if so where? Similarly, how to handle the late arrivals? What factors determine whether there will be late arrivals or early arrivals at an entrance ramp – traffic on connecting arterials near-by, origin zones of trips, human factors, etc? These factors would also drive the size of time frame that should be given to the drivers to enter – within 10 minutes of their reserved entry time, within 15 minutes, etc?
•
Ramp lengths - In what way is the ramp length relevant, operationally, to such a system – is storage of vehicles necessary, if so how much? Can the arriving drivers just enter the freeway immediately without any control on the entrance ramp (reservation tags can be read at high speeds)? Or to install some traffic control devices similar to ramp metering operations where the vehicles stop at the stop lights, and when the light turns green they accelerate to freeway speeds and merge with the mainline traffic.
•
Enforcement - Motorists could be asked to provide their license plate numbers to make reservations. These numbers can be read at highway speeds (up to 90 mph) and processed in milliseconds. If the number does not match the system accepted number for that time interval then a violation ticket would be issued. To detect the number of occupants inside the vehicle, technology such as infrared and laser can be used (e.g. Forth road bridge in Scotland is testing such equipment for use in a variable pricing project in 2007. The system gives discounts to car pools based on the number of occupants.)
PUBLIC ACCEPTANCE ISSUES The success of the proposed TDM strategy depends on the reaction from various interest groups. Highway users are not a homogeneous group. They have different socio-economic characteristics and different reasons to enter the highway at a specific location at a specific time point. Income level, age, educational level, trip purpose, daily commuting, geographical location, and existence of transportation alternatives are the dominant factors leading to the heterogeneity. Entities of this heterogeneous group, depending on their interests, will try to commend or condemn the proposed strategy, debating on concepts of justice, fairness, ethics, traditional societal norms, and tradition. On one hand, the effectiveness of the proposed system can be measured exactly by measuring certain system performance measures – passenger miles of travel, total delay, etc. On the other hand, there is always an effectiveness that is perceived by the public. As any other TDM, positive perceived effectiveness is one of the crucial factors for the successful implementation of the HSICS. Perceived effectiveness, among other things, is influenced by the issues of fairness and equity. One should expect that fairness issues could be the most preferred media’s topic as well. It is up to the HSICS protagonists to use the medium to convince public that the primary motive of advancebooking systems is to mitigate traffic congestion, and not to collect additional taxes or revenues. As was the case with other well-known demand management strategies – HOV, congestion pricing, etc, one can expect that the public approval should improve with time as they experience delay savings on a regular basis.
FUTURE RESEARCH Some questions that need to be addressed in the future research include: • Treatment of emergency trips, identification of all market segments, • Issues of privacy, • Consequence of rejections on the backgrounds of equity, responses of rejected travellers such as re-requests, and definition of fair pricing/priority mechanisms for various countries and various rural and urban geographical areas.
• Treatment of daily commuters, who go to work every weekday, might want to reserve the highway space for the entire year in one day. Such trips may be given more priority as they are helping in decreasing the uncertainty in the travel demand for a year. • Studying large networks. It might be appropriate to use microscopic traffic simulation for solving the HAS. For example, VISSIM simulation program with the capability of parallel processing could be used to study complex highway networks. Some of these questions will be addressed during the course of a recently initiated National Science Foundation project (award number - 0527252) over the next three years. A survey of the highway users will also be conducted to have an idea of the user reaction to the advancebooking system.
CONCLUSIONS In this paper, we have presented an improved formulation and a solution approach to the demand management concept - Highway Space Inventory Control System. This concept was presented for the first time at the 16th International symposium on transportation and traffic theory. The proposed HSICS model consists of two modules – Highway Allocation System (HAS) and the Highway Reservation System (HRS). HAS is an offline module that allocates the highway sections to various vehicle types during different time periods with the goal of optimizing the objective function(s) value(s) subject to the existing supply and demand constraints. It develops the optimal highway allocations for different traffic "scenarios". The “traffic scenarios – optimal allocations” data obtained in this way enables the development of HRS. HRS is the on-line system that makes on-line decisions regarding the possibility to accept driver requests. A shortcoming of the proposed HAS formulation (in Teodorovic and Edara, 2005) was the assumption of constant speed which would lead to less accurate position updates. In this paper, we replaced the constant average speeds with link-specific space mean speeds that are estimated using the Greenshields speed-density relationship. This led to a HAS formulation that is complex but more accurate than the previous one. The proposed model was illustrated using a numerical example of a highway section. Due to the non-linearity of the formulation, search for optimal solution was abandoned and a good solution was obtained using Genetic Algorithms together with penalty functions.
REFERENCES Abdelghany, A. F., Abdelghany, K. F., Mahmassani, H. S., Murray P. M., 2000. Dynamic traffic assignment in design and evaluation of High-Occupancy Toll lanes. Transportation Research Records, 1733, 39-48. Akahane, H., Kuwahara, M., 1996. A basic study on trip reservation systems for recreational trips on motorways. In: Proceedings of the 3rd World Congress on Intelligent Transportation Systems, pp. 1–7, ITS America, Washington D.C.
Belobaba, P. P., 1987. Airline Yield Management: An overview of seat inventory control. Transportation Science, 21, 66-73. Brumelle, S. L., McGill, J. I., 1993. Airline seat allocation with multiple nested fare classes. Operations Research, 41, 127-137. Coello Coello, C. A., 1999b. A survey of constraint handling techniques used with evolutionary algorithms. Technical Report Lania-RI-99-04, Laboratorio Nacional de Informatica Avanzada, Mexico. Cross, R. G., 1997. Revenue Management. Broadway Books, New York. Dahlgren, J. (2002). High-occupancy/toll lanes: where should they be implemented. Transportation Research A, 36, 239-255. de Feijter, R., Evers, J. M., Lodewijks, G., 2004. Improving travel-time reliability by the use of trip booking. IEEE Transactions on Intelligent Transportation Systems, 5, 288-292. de Palma, A., Lindsey, R., 2002. Private roads, competition, and incentives to adopt timebased congestion tolling. Journal of Urban Economics, 52, 217-241. Giuliano, G., Levine, D. W., Teal, R.F., 1990. Impact of High Occupancy Vehicle lanes on carpooling behavior. Transportation, 17, 159-177. Goldberg, D.E., 1989. Genetic algorithms in search, optimization, and machine learning. Addison-Wesley, Reading, Massachusetts. Houck, C.R., Joines, J.A., Kay, M.G., 1995. A Genetic Algorithm for Function Optimization: A Matlab Implementation. NCSU-IE TR 95-09. Jayakrishnan R., Tsai, W.K., Chen, A., 1995. A dynamic traffic assignment model with traffic-flow relation ships, Transportation Research C., 3, 51-72. Koolstra, K., 1999. Slot allocation on congested motorways: An alternative to congestion pricing. In: Proceedings of Seminar D at the AET European Transport Conference, pp. 343353, Cambridge, U.K. Littlewood, K., 1972. Forecasting and control of passengers bookings. In: AGIFORS Symposium Proceedings, Vol 12, pp. 95-117. Mahmassani, H. S., Peeta, S., 1993. Network performance under system optimal and user equilibrium dynamic assignments: Implications for ATIS. Transportation Research Records, 1408, 83-93. Michalewicz, Z., 1995 Genetic Algorithms + Data Structures = Evolution Programs. Springer-Verlag. Murray P. M., Mahmassani, H. S., Abdelghany, K.F., 2001. Methodology for assessing HOT lane usage and network performance. Transportation Research Records, 1765, 8-15. Phang S. Y., Toh, R.S., 2004. Road congestion pricing in Singapore: 1975 to 2003. Transportation, 43, 16-25.
Teodorovic, D., Edara, P., 2005. Highway Space Inventory Control System. In: Proceedings of ISTTT 16: Transportation and Traffic Theory: Flow, Dynamics and Human Interaction', Elsevier Publishers, pp. 43-62, Maryland, USA. Teodorovic, D., Vukadinovic, K., 1998. Traffic Control and Transport Planning: A Fuzzy Sets and Neural Networks Approach. Kluwer Academic Publishers, Boston. Teodorovic, D., Popovic, J., Pavkovic, G., Kikuchi, S., 2002. Intelligent airline seat inventory control system. Transport Planning and Technology, 25, 155-173. Verhoef, E. T., 2002. Second-best congestion pricing in general networks: Algorithms for finding second-best optimal toll levels and toll points. Transportation Research B, 36, 707729. Vickrey, W., 1963. Pricing in urban and suburban transport. American Economic Review, 53, 452-465. Vickrey, W., 1969. Congestion theory and transport investment. American Economic Review, 59, 251–261. Vickrey, W., 1994. Statement to the joint committee on Washington, DC, Metropolitan Problems. Journal of Urban Economics, 36, 42-65. Wong, J. T., 1997. Basic concepts for a system for advance booking for highway use. Transport Policy, 4, 109-114. Yang, H., Huang, H.J., 1999. Carpooling and congestion pricing in a multilane highway with high-occupancy-vehicle lanes. Transportation Research A., 33A, 139-155. Yang, H., Zhang, X.N., 2003. Optimal toll design in second-best link-based congestion pricing. Transportation Research Records, 1857, 85-92. Zhang, X. N., Yang, H., 2004. The optimal cordon-based network congestion pricing problem. Transportation Research A, 38B, 517-537.
BL1 BL2
BL3
BL4
Distinct inventories
Nested inventories
Figure 1 - (a) Distinct highway space inventories; (b) Nested highway space inventories
L in k E n tra n c e
N odes
E x it
Figure 2: A typical highway section
Dt
Cumulative Requests
Dc
Dr
∆T
x To
τ
Tr
Tc
Advance Booking Interval
Figure 3: Cumulative number of travel requests over time
x Te Time
Input Layer
Output Layer
Hidden Layer
Dr (1st trip departure time combination)
T(1st trip departure time combination)
Dr (2nd trip departure time combination)
T(2nd trip departure time combination)
Dr (3rd trip departure time combination)
T(3rd trip departure time combination)
Dr ((p-1)th trip departure time combination)
T((p-1)th trip departure time combination)
Dr (pth trip departure time combination)
T(pth trip departure time combination)
Figure 4: Neural network for one Vehicle Class
Link 1 Z1
Link 2 Z2
Z3
5 mi
E ntry 1
E ntry 2
Link 3
6 mi
E ntry 3
E xit 1
Link 4 Z4
5 mi
E ntry 4
Z5 7 mi
E xit 2
E ntry 5
E xit 3
Figure 5. Highway section for the numerical example.
E xit 4
1st Time interval 50 25 15 20
20th Time interval
12th Time interval
12 27
35 30 25
1st Time interval
40 34
55 42 20
60 26
800 Variables
50 25 15 20 35 20 22 17
23 17 20 45 10 12 27
OD pair 1 OD pair 2
OD pair 10 40 Variables
Figure 6. Solution representation in GAs.
1st Time interval 50 35 22 20
30 25
12th Time interval 35 30 25
40 34
20th Time interval 55 42 20
60 26
PARENT 1 Random Single Point Crossover 1st Time interval 45 24 32 17
25 35
12th Time interval 20 35 30
45 19
Exchange of Genetic Material 20th Time interval 37 26 19
42 31
PARENT 2 1st Time interval 50 35 22 20
30 25
12th Time interval 20 35 30
45 19
20th Time interval 37 26 19
42 31
OFF SPRING 1 1st Time interval 45 24 32 17
25 35
12th Time interval 35 30 25
40 34
OFF SPRING 2 Figure 7. Crossover.
20th Time interval 55 42 20
60 26
1st Time interval 45 24 32 17
25 35
1st Time interval 45 24 32 17
25 35
20th Time interval
12th Time interval 35 30 25
12th Time interval 35 30 25
55 42 20
40 34
Mutation
40 34
FITNESS VALUE
BEST SOLUTION BEST FEASIBLE SOLUTION
GENERATION # Figure 9. Genetic Algorithms Results.
20th Time interval
55 30 20
Figure 8. Mutation.
60 26
60 26
TOTAL CONSTRAINT VIOLATION
GENERATION #
Figure 10. Constraint violation of the best solution in every generation.
Single Occupant Cars
40
30
20
Model Output
10
0 -40
-30
-20
-10
0
10
20
30
40
-10
-20
-30
-40 Desired Output
Figure 11. Neural network model output vs optimal desired output – Single occupant cars (Teodorovic and Edara, 2005)
Table 1 - The basic information that could be contained in the HSICS Request number
1 2 … i … …
Date and Requested Requested time of date entry time making reservation 06/21 06/25 8:05 06/24 … 06/27 … …
06/25 06/28
8:05 … 10:20 … …
On Ramp
Off Ramp
Vehicle type
Operator Decision
#2
#17
Reject
#3 … #8 … …
#12 … #13 … …
Private car Bus … Truck … …
Accept Accept