RESEARCH
Regrowth Dynamics of ‘Tifton 85’ Bermudagrass as Affected by Nitrogen Fertilization P. D. Alderman,* K. J. Boote, and L. E. Sollenberger
ABSTRACT ‘Tifton 85’ bermudagrass (Cynodon spp.) has been widely adopted as a forage and hay crop and is being considered as a cellulosic ethanol feedstock. The objective of this study was to evaluate the effects of N fertilization rate on Tifton 85 regrowth dynamics. A field study was conducted near Gainesville, FL, on established Tifton 85 in 2006 and 2007. The treatments were N rates of 0, 45, 90, and 135 kg N ha–1 regrowth period –1. Tissue mass, leaf:stem ratio, and tiller number and mass were measured weekly during 28-d regrowth periods. Leaf mass followed logistic time trends with the upper asymptote varying between 50 and 225 g m –2 depending on N rate and season (summer and autumn). Stem mass lagged behind leaf mass for 7 to 14 d, subsequently following linear or quadratic time trends to reach between 75 and 300 g m –2 by 28 d. Increasing N rate from 0 to 135 kg ha –1 period –1 increased tiller mass at 28 d from 1.5 to 3 g tiller–1 in summer and 1 to 1.5 g tiller–1 in autumn. Leaf:stem ratio increased to 1.0 within 14 to 21 d, followed by a subsequent decrease. Rhizome and root mass were not affected by N fertilization. Increasing N rate primarily affected mass and proportion of above-ground plant parts, with little effect on mass of below-ground parts. Nitrogen nutrition index values were similar whether calculated from samples taken to a 10-cm stubble height or from samples taken to the soil surface. Regrowth was not enhanced by N rate beyond 90 kg N ha –1 regrowth period –1.
Dep. of Agronomy, Univ. of Florida, P.O. Box 110500, Gainesville, FL 32611-0500. This research was supported in part by the USDA, Tropical Subtropical Agricultural Research Program. Received 10 Sept. 2010. *Corresponding author (
[email protected]). Abbreviations: CP, crude protein; IVDOM, in vitro digestible organic matter; NNI, nitrogen nutrition index.
S
ince its release in 1992, ‘Tifton 85’ bermudagrass (Cynodon spp.) has become a major crop for forage and hay production (Muir et al., 2010). As a high-yielding, highly digestible cultivar, it has been adopted throughout the southern United States, central and South America, and South Africa (Mandebvu et al., 1999). Though primarily used as a forage and hay crop, it is now being considered for its potential as a cellulosic ethanol feedstock (Anderson et al., 2007; Muir et al., 2010). Nitrogen is the nutrient required in greatest quantity and most frequently deficient in forage production systems (Snyder and Leep, 2007). In addition, replenishment of N removed by harvest or grazing is essential for maintaining pasture productivity (Mathews et al., 2004). Appropriate N fertilizer management is also important for human and environmental health (Crews and Peoples, 2004; Peoples et al., 2004). Further, because N fertilizer comprises a large energy expenditure in crop production systems, it is important to consider N input requirements when assessing cropping systems for bioenergy production (Boehmel et al., 2008; Schmer et al., 2008). Thus, evaluating the linkage between N fertilization levels and Tifton 85 bermudagrass regrowth dynamics is relevant for both forage and bioenergy feedstock production. Tifton 85 bermudagrass herbage yields have ranged from 12,000 to 31,600 kg dry matter ha–1 yr–1 for N fertilization rates Published in Crop Sci. 51:1716–1726 (2011). doi: 10.2135/cropsci2010.09.0515 Published online 10 May 2011. © Crop Science Society of America | 5585 Guilford Rd., Madison, WI 53711 USA All rights reserved. No part of this periodical may be reproduced or transmitted in any form or by any means, electronic or mechanical, including photocopying, recording, or any information storage and retrieval system, without permission in writing from the publisher. Permission for printing and for reprinting the material contained herein has been obtained by the publisher.
1716
WWW.CROPS.ORG
CROP SCIENCE, VOL. 51, JULY– AUGUST 2011
between 325 and 616 kg N ha–1 yr–1 (Evers and Parsons, 2002; Brink et al., 2004; Evers et al., 2004; Mislevy and Martin, 2006). This N response is consistent with other studies involving bermudagrass (Prine and Burton, 1956; Beaty et al., 1975; Overman et al.,1993; Silveira et al., 2007). Johnson et al. (2001) showed that crude protein (CP) concentrations increased from 98 to 181 g kg–1 and in vitro digestible organic matter (IVDOM) from 580 to 600 g kg–1 as N rate increased from 0 to 785 kg ha–1 yr–1. Similarly, Tifton 85 IVDOM increased from 476 to 512 g kg–1, with N fertilization increasing from 0 to 80 kg ha–1 per 4-wk regrowth period (Vendramini et al., 2008). In comparison to yield and nutritive value, data describing regrowth dynamics of bermudagrass are underrepresented in the literature. In general, bermudagrass responses to N fertilization include increased shoot growth and N concentration (Beaty et al., 1975; Barton et al., 2006; Guertal and Hicks, 2009). Prine and Burton (1956) noted that increasing N fertilization increased stem length, leaf length, internode length, and internode number while it decreased leaf percentage and seed head frequency. Effects of N fertilization on root and rhizome tissue growth are less consistent, with reports of increased root and rhizome growth (Beaty et al., 1975; Trenholm et al., 1998; Barton et al., 2006), decreased root and rhizome growth (Guertal and Hicks, 2009), and nonaffected growth across a range of N rates (Holt and Lancaster, 1968). Tifton 85 fertilized at 125 kg N ha–1 yr–1 and grazed to a set of steady state sward heights had herbage mass ranging between 2000 and 8400 kg ha–1, depending on sward height and month of sampling (Sbrissa et al., 2003). In a greenhouse study, tiller number and tiller weight of Tifton 85 increased as N application increased from 0 to 240 mg N kg–1 soil (Premazzi et al., 2003). Bermudagrass response to N fertilization may also vary between summer and autumn seasons because of differences in photoperiod, temperature, and light intensity (Goatley et al., 1994; Sinclair et al., 2003, 2004). However, none of these studies evaluated bermudagrass responses during regrowth periods between harvests. Overall, the physiological responses of Tifton 85 to N fertilization during regrowth are insufficiently described. The objective of this study was to more clearly quantify and explain the effects of N fertilization on regrowth dynamics of Tifton 85. On the basis of the literature, increasing N fertilization was hypothesized to increase stem, leaf, rhizome, and root mass; stem and leaf growth rate; leaf:stem ratio; herbage yield; and nutritive value.
MATERIALS AND METHODS The experiment was conducted at the University of Florida Beef Research Unit near Gainesville, FL (29°44´ N, 82°16´ W), in 2006 and 2007 on a Pomona Sand (sandy, siliceous, hyperthermic Ultic Alaquods). Melich-1 extractable soil P, K, Mg, and Ca concentrations were 24, 47, 8, and 10 mg kg–1 before onset of the experiment in 2006. A 39- × 39-m area of Tifton 85 bermudagrass pasture was established in 2005. The area was CROP SCIENCE, VOL. 51, JULY– AUGUST 2011
separated into four blocks (randomized complete block design), each containing four 6- × 6-m plots with 1-m alleys. Each year, 50 kg N, 20 kg P, and 85 kg K ha–1 were applied to all plots in May. The whole area was then staged by cutting to a 10-cm stubble height on 22 June 2006 and 20 June 2007. Plots were subsequently harvested to a 10-cm stubble every 28 d for four regrowth periods, ending in mid-October. At the beginning of each regrowth period, treatments of 0, 45, 90, and 135 kg N ha–1 were applied as ammonium nitrate, resulting in annual application levels of 50, 230, 410, and 590 kg N ha–1 yr–1. Plant regrowth was sampled weekly during two of the four regrowth periods. The experiment was rainfed except for a 38-mm irrigation application in late April 2007 just before fertilization and another 13 mm of irrigation following application of Cimarron (metsulfuron methyl; DuPont, Wilmington, DE) at a rate of 35 g ha–1 in early May 2007 to control bahiagrass (Paspalum notatum Flügge) that had invaded several plots. Total daily rainfall was measured onsite, and daily minimum and maximum air temperatures were taken from the Florida Automated Weather Network database.
Regrowth Analysis Soil-sod core samples of 20 cm × 20 cm were taken by hand to a depth of 20 cm from each plot weekly during the second ( July–August) and fourth (September–October) regrowth periods, which will be referred to hereafter as summer and autumn. Two flat shovels and a metal corer were used to cut the sod and remove the soil core. Tiller number in the entire core was counted (starting Day 7 of regrowth), and above-ground material was cut from each core at the soil level and placed in a sealed plastic bag for transport to the laboratory. Soil was removed from below-ground plant material by rinsing the core with water over a fi ne screen. The rinsed below-ground material was placed in a sealed plastic bag and kept cool for transport to the laboratory. Because of the amount of time and labor required for rinsing and collecting root material, the complete rootsampling activity was limited to the beginning (Day 0) and end (Day 28) of the two periods. This amounted to four root measurements at 28-d intervals throughout the season. When root samples were not taken, cores were rinsed so that roots could be cut and discarded and the rhizome and stolon material separated, rinsed further, and placed in a bag. Once transported to the laboratory, remaining root material was separated (and discarded) from rhizomes and stolons. All plant samples were kept refrigerated until they could be further processed (within 24 h). The processing involved separating leaf, stem, stolon, rhizome, and root tissues. Leaf tissue was defined as emerged leaf blade and was separated at the ligule. Stem tissue included the leaf sheath and any immature, unemerged leaves. Stolons were combined with rhizomes and both were classified as rhizome tissue. When root samples were taken, root tissue was categorized separately from rhizome tissue. All fractions were then dried in a forced-air drying oven at 60°C for 48 h. Tiller mass was determined by dividing the sum of leaf and stem mass by the tiller number.
Herbage Yield and Nutritive Value From areas of the plot that were not used for core samples, herbage was harvested every 28 d by cutting a 1- × 4-m strip to 10-cm stubble using a sickle-bar mower and collecting the cut forage. The fresh mass of the entire harvest sample was
WWW.CROPS.ORG
1717
determined on site. An approximately 600-g fresh subsample was taken and weighed, and the remaining harvest sample discarded. Subsamples were placed in a forced-air drying oven at 60°C for 48 h to determine dry matter concentration. Each subsample was then ground through a 1-mm screen in a Wiley mill and the ground samples were analyzed for IVDOM using a modification of the two-stage technique as described in Moore and Mott (1974). Nitrogen concentration was measured using the aluminum block digestion procedure of Gallaher et al. (1975) and semiautomated colorimetry (Hambleton, 1977). Crude protein concentration was calculated as N multiplied by 6.25.
Nitrogen Nutrition Index Nitrogen nutrition index (NNI) values were computed using the following equation:
NNI =
Na Nc
[1]
where Na is the actual N concentration and Nc is the critical N concentration. Na is measured in the laboratory and Nc is calculated based on shoot dry matter using the N dilution curve given as:
N c = aW −b
[2] –1
where W is total shoot dry matter in Mg ha and a and b are species-dependent parameters. The values of a and b used in this study were 0.36 and 0.34, taken from those reported by Lemaire et al. (2008) for C4 perennial grasses. Values for NNI were calculated two ways: (i) based on shoot dry matter and N concentration data of plant material sampled to the soil surface on Day 28 of regrowth as reported in a companion study (Alderman et al., 2011) and (ii) based on dry matter (W ) and N concentrations of the herbage sampled to a 10-cm stubble height. Essentially, NNI values lower than 1 indicate N deficiency; values higher than 1 indicate luxury N uptake; and values at or near 1 indicate that N uptake corresponds to the amount of N required for growth. Further discussion of the NNI and the N dilution curve concept is given in Lemaire et al. (2008).
Statistical Methods Statistical analyses were performed with a linear mixed effects model using the lme function in R (R Development Core Team, 2009). Herbage yield, IVDOM, CP concentration, and root mass data were analyzed with a model including main effects of year, sampling month, and N fertilization rate. For regrowth analysis data (other than root), main effects were year, season (summer and autumn), day of regrowth, and N fertilization rate. All models included first-order interaction terms of main effects. Additional interaction terms were added based on Aikake’s Information Criterion and log-Likelihood values. Second-order interactions were included for leaf and tiller mass, and third-order (all possible) interactions were included for leaf:stem ratio, IVDOM, and CP concentrations. Plot within block was added as a random effect. Because data collection involved repeated measurements on the same plots, an autoregressive variance structure was used. Where Aikake’s Information Criterion and log-Likelihood values indicated, an autoregressive heterogeneous variance structure was used. Quantile-quantile plots were used to check normality of model residuals, and in the case of nonnormal distributions, data transformations were used. Square root transformation 1718
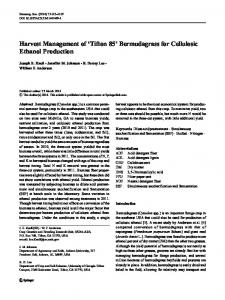
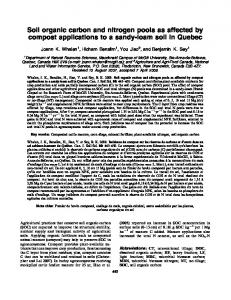
Figure 1. Monthly rainfall at the University of Florida Beef Research Unit for 2006, 2007, and the long-term average.
was used for tiller number, herbage yield, and leaf, stem, and root mass. Log transformation was used for rhizome mass and leaf:stem ratio. No transformation was necessary for IVDOM and CP data. Orthogonal polynomial contrasts (linear, quadratic, cubic) were used to test the type of response to N fertilization within each combination of year, season, and day of regrowth for regrowth analysis data (except root) and within each combination of year and month for root, herbage yield, and nutritive value. The nls function in R (R Development Core Team, 2009) was used to fit an asymptotic exponential curve to NNI data from July and August of both years for determining the optimal N fertilization rate for summer regrowth.
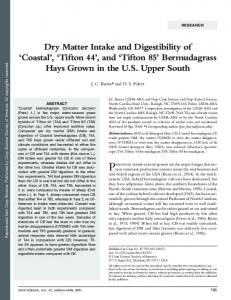
RESULTS AND DISCUSSION In general, weather conditions were drier in 2006 than in 2007 (Fig. 1). Rainfall was below normal in May and August of 2006, while above normal in August and October of 2007. Temperatures were at or below normal for 2006, while in 2007 temperatures were below normal until July and above normal for August and October (Fig. 2).
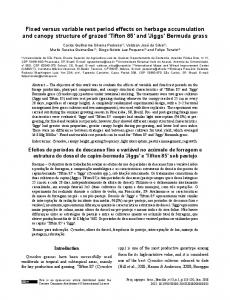
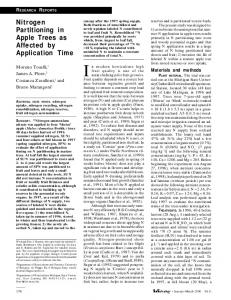
Regrowth Analysis Leaf and Stem Mass Leaf growth appeared to be favored over stem growth initially during summer of both years as leaf mass increased within 1 wk after cutting (Figs. 3 and 4). Initial high partitioning to leaf is expected after a severe defoliation event as the plant refoliates the canopy to support adequate photosynthesis for regrowth (Chapman and Lemaire, 1993). Leaf growth followed a logistic time trend throughout most regrowth periods, and leaf growth rate at the inflection point increased as N rate increased (Fig. 3). Stem growth was also higher under higher N rates (Fig. 4). Consistent with these observations, NNI values were near or above 1 for the 90 and 135 kg N ha–1 treatments, while values were below 1 for the 0 and 45 kg N ha–1 treatments in both years (Fig. 5A). These values confirm that N was deficient and support the assertion that N supply restricted leaf and stem growth in the lower N treatments.
WWW.CROPS.ORG
CROP SCIENCE, VOL. 51, JULY– AUGUST 2011
did not increase during the first week of regrowth in either season of either year and even appeared to decrease initially for summer and autumn of 2006 and summer of 2007 (Fig. 4). The increase in leaf:stem ratio until the second or third week of the regrowth period also mirrored this phenomenon (Fig. 6). The lag corresponds with increased initial leaf growth and may reflect partitioning to leaf taking priority over stem early during regrowth for more rapid canopy foliar recovery. However, there is also an alternate interpretation. Following harvest, part of the residual stem mass was stem internode tissue that had been cut by the mower but had not yet senesced. During the initial phase of regrowth, it is likely that stems lacking an active meristem would have senesced, with partial remobilization of resources to new, actively growing shoots. The observed lag would then represent the period of time over which growth of new stem tissue was being offset by senescence of old stem tissue. This is also consistent with visual observations of senesced stem internode tissue as the regrowth period progressed.
Figure 2. Monthly average maximum (Tmax) and minimum (Tmin) temperatures at the University of Florida Beef Research Unit for 2006, 2007, and the long-term average.
Increasing N rate caused lower post-clipping (residual) leaf mass for both years (Fig. 3), an effect reflected in the leaf:stem ratio of post-clipping stubble (Fig. 6). This observation is likely a result of a closed canopy and taller shoot growth in the 90 and 135 kg N ha–1 treatments. As full canopy closure occurred, leaves lower in the canopy senesced due to self-shading. This coupled with taller shoot growth resulted in most of the leaf tissue being distributed higher in the canopy. By the end of the regrowth period, the majority of the leaf tissue for high N rates was above the cutting height of 10 cm. In contrast, shoot growth for lower N rates was restricted by N supply, and more leaf tissue remained below the cutting height, resulting in more leaf tissue remaining after cutting at lower N rates as compared with higher N rates. Despite the initial disadvantage, higher growth rates for the high N treatments (day × N rate effect was significant at P < 0.01) allowed a rapid recovery of the leaf canopy, and during the second week of regrowth, leaf:stem ratio of higher N treatments met or surpassed that of lower N treatments (Fig. 6). Stem growth appeared to lag behind leaf growth for 1 to 2 wk following defoliation (Figs. 3 and 4). Stem mass CROP SCIENCE, VOL. 51, JULY– AUGUST 2011
Tiller Density and Mass The N fertilization rate main effect on tiller density was positive and highly significant (P < 0.01), although the interactions of N rate × day of regrowth and N rate × season were also significant (P < 0.001) and negative. Higher N rates tended to increase tiller density initially and decrease density later in the regrowth period (Fig. 7). High N fertilization stimulated the growth of many tillers immediately after defoliation, but during later regrowth self-shading inhibited further tiller development and resulted in thinning of the stand tiller density. For the lower two N rates, tiller density remained constant or increased through most regrowth periods because N supply restricted tiller growth thereby preventing self-shading from affecting tiller density. By the end of each regrowth period tiller density was within the range of 3000 to 6000 tillers m–2 regardless of N rate. This range is substantially lower than that observed by Sbrissa et al. (2003). The difference is likely because they maintained swards at heights between 5 and 20 cm using continuous stocking, thus increasing light penetration to the base of the sward, while in the present study regrowth was undisturbed for 28 d. Both the N rate main effect and day of regrowth × N rate interaction were significant for tiller mass (P < 0.01). On Day 7 of regrowth, the 0 kg N ha–1 treatment had larger tillers than other treatments (Fig. 8), because the count included many old tillers that avoided being cut because of lower plant height caused by limited N supply. However, by Day 21 a reversal of this trend was evident, and by Day 28 the 90 and 135 kg N ha–1 treatments had the largest tillers, followed by 45 and then 0 kg N ha–1. These data fit with visual observations of greater stem diameter of tillers in higher compared to lower N rate plots and are similar to observations of Premazzi et al. (2003).
WWW.CROPS.ORG
1719
Figure 3. Leaf mass of ‘Tifton 85’ bermudagrass (Cynodon spp.) grown at Gainesville, FL, during summer (July–August) and autumn (September–October) regrowth periods of 2006 and 2007 for 0, 45, 90, and 135 kg N ha–1 period –1 treatments. Letters represent significant (P < 0.05) polynomial contrasts of N fertilization rates within day of regrowth: L = linear, Q = quadratic.
Figure 4. Stem mass of ‘Tifton 85’ bermudagrass (Cynodon spp.) grown at Gainesville, FL, during summer (July–August) and autumn (September–October) regrowth periods of 2006 and 2007 for 0, 45, 90, and 135 kg N ha–1 period –1 treatments. Letters represent significant (P < 0.05) polynomial contrasts of N fertilization rates within day of regrowth: L = linear, Q = quadratic.
Tiller size and/or density compensation dynamics similar to those observed in the present study have been widely 1720
documented for other perennial grasses (Matthew et al., 1995) and correspond to those observed by Premazzi et al.
WWW.CROPS.ORG
CROP SCIENCE, VOL. 51, JULY– AUGUST 2011
Figure 5. Nitrogen Nutrition Index values of ‘Tifton 85’ bermudagrass (Cynodon spp.) grown at Gainesville, FL, during 2006 and 2007 for 0, 45, 90, and 135 kg N ha–1 period –1 treatments. Values were calculated on the basis of dry matter and N concentration of plant material sampled after 28 d of regrowth (A) to the soil surface and (B) to a 10-cm stubble height.
Figure 6. Leaf:stem ratio of ‘Tifton 85’ bermudagrass (Cynodon spp.) grown at Gainesville, FL, during summer (July–August) and autumn (September–October) regrowth periods of 2006 and 2007 for 0, 45, 90, and 135 kg N ha–1 period –1 treatments. Letters represent significant (P < 0.05) polynomial contrasts of N fertilization rates within day of regrowth: L = linear, Q = quadratic.
(2003) and Sbrissa et al. (2003). The initially higher tiller density in high N treatments is a result of a larger number of active meristems stimulated by N availability, while N stress prevented low N treatments from maintaining the same number of active meristems. As regrowth progressed, some of the tillers in the higher N treatments achieved apical dominance and continued to grow, while nondominant tillers senesced, thereby reducing the tiller density later in the regrowth period. These larger, dominant tillers would account for the increase in tiller mass throughout regrowth (Fig. 8). Addition and growth of new tillers was restricted by N availability in lower N treatments (Fig. 5A; NNI CROP SCIENCE, VOL. 51, JULY– AUGUST 2011
values < 1), thereby slowing the process of tiller addition. This would explain the continued increases in tiller density for the 0 kg N ha–1 regrowth period–1 treatment until Day 21 of autumn 2006 and summer 2007 and until Day 28 of summer 2006 (Fig. 7). Once tiller growth progressed to a point at which apical dominance could be established, the explanation of dominant versus nondominant tillers would apply equally to the lower N treatments. Rhizome and Root Mass Rhizome mass did not respond to N fertilization rate. These results agree with Holt and Lancaster (1968) and contradict
WWW.CROPS.ORG
1721
Figure 7. Tiller density of ‘Tifton 85’ bermudagrass (Cynodon spp.) grown at Gainesville, FL, during summer (July–August) and autumn (September–October) regrowth periods of 2006 and 2007 for 0, 45, 90, and 135 kg N ha–1 period –1 treatments. Data for Day 7 of summer 2006 were unavailable. Letters represent significant (P < 0.05) polynomial contrasts of N fertilization rates within day of regrowth: L = linear, Q = quadratic, C = cubic.
Figure 8. Tiller mass of ‘Tifton 85’ bermudagrass (Cynodon spp.) grown at Gainesville, FL, during summer (July–August) and autumn (September–October) regrowth periods of 2006 and 2007 for 0, 45, 90, and 135 kg N ha–1 period –1 treatments. Data for Day 7 of summer 2006 were unavailable. Letters represent significant (P < 0.05) polynomial contrasts of N fertilization rates within day of regrowth: L = linear, Q = quadratic.
1722
WWW.CROPS.ORG
CROP SCIENCE, VOL. 51, JULY– AUGUST 2011
Figure 9. Rhizome mass of ‘Tifton 85’ bermudagrass (Cynodon spp.) grown at Gainesville, FL, during summer (July–August) and autumn (September–October) regrowth periods of 2006 and 2007 for 0, 45, 90, and 135 kg N ha–1 period–1 treatments. Letters represent significant (P < 0.05) polynomial contrasts of N fertilization rates within day of regrowth: L = linear, Q = quadratic, C = cubic.
other studies showing significant N responses (Beaty et al., 1975; Trenholm et al., 1998; Barton et al., 2006; Guertal and Hicks, 2009). However, year and day of regrowth effects were significant (P < 0.01). In 2006 rhizome mass
appeared to increase during both early and late regrowth periods (Fig. 9). In 2007, however, it remained fairly constant. An increase in rhizome mass during 2006 could be a result of the pasture having been established the previous year. In such a case, the pasture may have still been in the process of developing and increasing to a steady state rhizome mass through the 2006 growing season. By 2007 the rhizome mass had become sufficiently established at mean values of 610, 635, 660, and 657 g m–2 for 0, 45, 90, and 135 kg N ha–1 period–1 treatments, respectively, and, thus, no further increase was observed. Root mass did not respond to N fertilization and was lower than rhizome mass. In 2006 root mass of three treatments increased from July to September, with a subsequent decrease to October (Fig. 10). The 90 kg ha–1 treatment did not change much through the season. However, in 2007 the highest root mass for all treatments was in July, with decrease of root mass occurring between the July and August sampling dates. This may be due to dry conditions early in 2007 that stimulated more root growth, but when adequate rainfall occurred later in the season, some root tissue may have senesced.
Herbage Yield and Nutritive Value Figure 10. Root mass of ‘Tifton 85’ bermudagrass (Cynodon spp.) grown at Gainesville, FL, at the end of four regrowth periods in 2006 and 2007 for 0, 45, 90, and 135 kg N ha–1 period –1 treatments. Letters represent significant (P < 0.05) polynomial contrasts of N fertilization rates within sampling month: L = linear. CROP SCIENCE, VOL. 51, JULY– AUGUST 2011
Herbage Yield There were linear and quadratic effects of N application on yield at each harvest in both years except for July 2007, when only the linear effect was significant (Table 1). The
WWW.CROPS.ORG
1723
Table 1. Interaction effects of N rate, harvest month, and year on harvested herbage of ‘Tifton 85’ bermudagrass (Cynodon spp.) during 2006 and 2007. Nitrogen (kg ha –1 period –1) Harvest date
0 45 90 135 ———————kg ha –1 ———————
20 July 1130a† 17 Aug. 1040a 14 Sept. 980a 12 Oct. 220b Season 3370 2007 18 July 1130a 15 Aug. 1390b 12 Sept. 770c 10 Oct. 620c Season 3910 2006
2940a 2530ab 1770b 600c 7840 2430a 3120b 1620c 1360c 8530
3640a 4430a 3280b 3140b c 2800 3010b d 990 970c 10,710 11,550 2920a 3720a a 3450 3710a b 2080 2040b 1200c 1060c 9650 10,530
Polynomial contrast‡
SE
kg ha L**,Q**,C§ 80 L**,Q** 60 L**,Q** 50 L**,Q**,C§ 20 L**,Q** 20 L** 70 L**,Q**,C** 60 L**,Q** 40 L**,Q**,C* 20 L**,Q**,C* 20
–1
*P ≤ 0.05. **P ≤ 0.01. † Comparison of N means among months within year within N rate. Means followed by the same letter are not different (P > 0.05).
Table 2. Interaction effects of N rate, harvest month, and year on crude protein concentrations of harvested herbage of ‘Tifton 85’ bermudagrass (Cynodon spp.) during 2006 and 2007. Harvest date 2006 20 July 17 Aug. 14 Sept. 12 Oct. 2007 18 July 15 Aug. 12 Sept. 10 Oct.
Nitrogen (kg ha –1 period –1) 0 45 90 135 ————————g kg –1 ———————— 98a† 88a 113b 100ab 97a 94a 116b 121b
105a 110a 132b 162c 107a 105a 144b 144b
128a 137a 175b 216c 133a 139a 188b 184b
140a 164b 188c 221d 146a 149a 200b 189b
Polynomial contrast‡
SE
L** L** L**,Q* L**,Q**,C* L**,C§ L**,C§ L**,Q*,C** L**,Q*,C**
g kg –1 1 2 2 3 1 2 2 2
*P ≤ 0.05. **P ≤ 0.01. † Comparison of N means among months within year within N rate. Means followed by the same letter are not different (P > 0.05).
quadratic response occurred because there was generally no yield response as N rate increased from 90 to 135 kg ha–1 period–1. In several harvests, the cubic effect was significant, generally because the rate of increase in yield began to slow between 45 and 90 kg N ha–1 and then slowed further between 90 and 135 kg N ha–1. These results are consistent with earlier findings for Tifton 85 bermudagrass ( Johnson et al., 2001; Brink et al., 2004; Silveira et al., 2007). All main effects and fi rst-order interactions were highly significant (P < 0.001). In 2006 the highest yields for all treatments were obtained in July, while yields in 2007 tended to be greater in August than in July. This was likely the result of greater rainfall during the period of regrowth leading up to the August 2007 harvest (Fig. 1). Nutritive Value Nutritive value increased with increasing N fertilization. Crude protein concentrations showed a significant linear response to increasing N rate at all harvest dates (Table 2). Greater increases in CP concentrations occurred from 1724
Table 3. Interaction effects of N rate, harvest month, and year on in vitro digestible organic matter concentrations of harvested herbage of ‘Tifton 85’ bermudagrass (Cynodon spp.) during 2006 and 2007. Harvest date 2006 20 July 17 Aug. 14 Sept. 12 Oct. 2007 18 July 15 Aug. 12 Sept. 10 Oct.
Nitrogen (kg ha –1 period –1) 0 45 90 135 ————————g kg –1 ———————— 532a† 467b 486b 492b 500a 512a 512a 499a
567a 504b 520b 574a 533a 534a 555a 549a
571ac 523b 549ab 594c 555a 551a 557a 540a
579ac 540b 556ab 604c 576a 545a 583a 549a
Polynomial contrast‡
SE
L** L** L** L**,Q** L** L* L* L§
g kg –1 2 2 2 3 2 2 2 2
*P ≤ 0.05. **P ≤ 0.01. † Comparison of N means among months within year within N rate. Means followed by the same letter are not different (P > 0.05).
increasing the N rate from 0 to 45 kg N ha–1 period–1 than from 90 and 135 kg N ha–1. This is consistent with other research findings (Johnson et al., 2001; Brink et al., 2004; Silveira et al., 2007). Because CP is determined directly from tissue N concentration, it follows that increasing N fertilization should increase CP concentration until plant demand and luxury uptake levels have been reached. Seasonal effects were also observed, with a progressive increase in CP concentrations in both years, except in July and August. The effect of month of harvest on IVDOM concentrations was significant (P < 0.001). However, differences between early and late harvests were only observed in 2006 (Table 3), resulting in month × year interactions (P < 0.001). In 2006 IVDOM concentrations were higher for later harvests (except for 0 kg N ha–1), which is consistent with numerous studies on Tifton 85 (Hill et al., 1993; Mandebvu et al., 1999; Johnson et al., 2001). Mislevy and Martin (2006) explained similar seasonal trends for both CP and IVDOM as primarily owing to more rainfall and higher temperatures in the middle of the growing season than early and late in the season. These conditions increased the rate of growth and development, causing a more rapid increase in plant maturity and a decline in nutritive value. Nitrogen fertilization rate effects on IVDOM were highly significant (P < 0.001). Increasing N rate increased IVDOM linearly for each harvest in both years (Table 3). These results are consistent with results published by Johnson et al. (2001) and Vendramini et al. (2008) but contradict other studies finding no effect of N on digestibility on other grasses (McCormick, 1974; Harvey et al., 1996). Increase in degradable protein likely contributed to enhanced digestibility. This explanation is supported by results reported by Johnson et al. (2001) and Vendramini et al. (2008). Nitrogen Nutrition Index Nitrogen nutrition index values were below 1 for all dates for 0 and 45 kg N ha–1 treatments, indicating that N was
WWW.CROPS.ORG
CROP SCIENCE, VOL. 51, JULY– AUGUST 2011
deficient and was limiting herbage production in the lower N treatments (Fig. 5B). In contrast, NNI values for the 90 kg N ha–1 treatment were near 1, indicating adequate N nutrition. The NNI values for the 135 kg N ha–1 treatment were mostly greater than 1 and only marginally higher than the 90 kg N ha–1, both of which support the claim that, in general, increasing N fertilization beyond 90 kg N ha–1 did not improve the N nutrition status of the crop. However, NNI values for 90 kg N ha–1 in July and August were below 1 for both years, possibly suggesting an optimal N rate slightly above 90 kg N ha–1 during summer months. Asymptotic exponential regression of July and August values indicated an optimal N rate (NNI = 1) of 122 kg N ha–1. Despite the theoretical benefit of increasing the N rate from 90 to 122 kg N ha–1 for summer months, the associated increase in herbage yield may not be sufficient to warrant the higher rate depending on cost of inputs and economic value of herbage. Also of note, calculating NNI on the basis of herbage samples harvested to a 10-cm stubble yielded similar results to calculations on samples taken to soil level (Figs. 5A and B). Though not conclusive, this observation suggests that NNI can be accurately calculated on the basis of normal forage harvest samples without requiring special sampling of the post-clipping stubble and thereby improves the applicability of the NNI approach for use by forage producers. Nevertheless, caution should be exercised in interpreting NNI values on the basis of samples taken early in regrowth, particularly if the samples are taken to the soil surface. While the NNI approach worked for samples taken on Day 28, it did not work well for samples taken at 0 and 7 d of regrowth, when NNI values indicated substantial N deficiency even for the highest N treatments (data not shown). We suspect this phenomenon to be due to a greater proportion of post-clipping stubble within the samples, which increased the dry weight (W) and resulted in the critical N (Nc) being calculated higher than if only new growth were included.
SUMMARY AND CONCLUSIONS Increasing N fertilization increased leaf and stem mass and increased growth rate during regrowth. Increasing N fertilization also decreased post-clipping leaf:stem ratio, while increasing leaf:stem ratio during regrowth. There were no consistent effects of N fertilization on rhizome or root mass. Thus, N fertilization effects on Tifton 85 regrowth dynamics occur primarily in terms of mass and proportion of above-ground plant parts, with little to no effect on mass of below-ground parts. Herbage yield, CP, and IVDOM were increased by N fertilization, but with greatly diminished effect for high N rates. Overall, increasing N rate beyond 90 kg N ha–1 period–1 did not enhance plant regrowth.
CROP SCIENCE, VOL. 51, JULY– AUGUST 2011
References Alderman, P.D., K.J. Boote, L.E. Sollenberger, and S.W. Coleman. 2011. Carbohydrate and nitrogen reserves relative to regrowth dynamics of Tifton 85 bermudagrass as affected by nitrogen fertilization. Crop Sci., this issue. Anderson, W.F., B.S. Dien, S.K. Brandon, and J.D. Peterson. 2007. Assessment of bermudagrass and bunch grasses as feedstock for conversion to ethanol. Appl. Biochem. Biotechnol. 145:13–21. doi:10.1007/s12010-007-8041-y Barton, L., G.G.Y. Wan, and T.D. Colmer. 2006. Turfgrass (Cynodon dactylon L.) sod production on sandy soils: I. Effects of irrigation and fertiliser regimes on growth and quality. Plant Soil 284:129– 145. doi:10.1007/s11104-006-0037-9 Beaty, E.R., K.H. Tan, R.A. McCreery, and J.B. Jones. 1975. Rootherbage production and nutrient uptake and retention by bermudagrass and bahiagrass. J. Range Manage. 28:385–389. doi:10.2307/3897500 Boehmel, C., I. Lewandowski, and W. Claupein. 2008. Comparing annual and perennial energy cropping systems with different management intensities. Agric. Syst. 96:224–236. doi:10.1016/j. agsy.2007.08.004 Brink, G.E., K.R. Sistani, and D.E. Rowe. 2004. Nutrient uptake of hybrid and common bermudagrass fertilized with broiler litter. Agron. J. 96:1509–1515. doi:10.2134/agronj2004.1509 Chapman, D.F., and G. Lemaire. 1993. Morphogenetic and structural determinants of plant regrowth after defoliation. p. 95–104. In Proc. Int. Grassl. Congr., 17th, Palmerston North, New Zealand. 8–21 Feb. 1993. Palmerston North, New Zealand. Crews, T.E., and M.B. Peoples. 2004. Legume versus fertilizer sources of nitrogen: Ecological tradeoffs and human needs. Agric. Ecosyst. Environ. 102:279–297. doi:10.1016/j.agee.2003.09.018 Evers, G.W., and M.J. Parsons. 2002. Comparison of seeded and vegetatively planted bermudagrasses. p. 41–42. Research center technical report No. 2002–1. Texas A&M Univ., Overton, TX. Evers, G.W., L.A. Redmon, and T.L. Provin. 2004. Comparison of bermudagrass, bahiagrass, and kikuyugrass as a standing hay crop. Crop Sci. 44:1370–1378. doi:10.2135/cropsci2004.1370 Gallaher, R.N., C.O. Weldon, and J.G. Futral. 1975. An aluminum block digester for plant and soil analysis. Soil Sci. Soc. Am. Proc. 39:803–806. doi:10.2136/sssaj1975.03615995003900040052x Goatley, J.M., V. Maddox, D.J. Lang, and K.K. Crouse. 1994. ‘Tifgreen’ bermudagrass response to late-season application of nitrogen and potassium. Agron. J. 86:7–10. doi:10.2134/agronj1994.0 0021962008600010002x Guertal, E.A., and C.A. Hicks. 2009. Nitrogen source and rate effects on the establishment of ‘TifSport’ and ‘Tifway’ hybrid bermudagrass. Crop Sci. 49:690–695. doi:10.2135/cropsci2008.07.0436 Hambleton, L.G. 1977. Semiautomated method for simultaneous determination of phosphorus, calcium and crude protein in animal feeds. J. Assoc. Off. Anal. Chem. 60:845–852. Harvey, R.W., J.P. Mueller, J.A. Barker, M.H. Poore, and J.P. Zublena. 1996. Forage characteristics, steer performance, and water quality from bermudagrass pastures fertilized with two levels of nitrogen from swine lagoon effluent. J. Anim. Sci. 74:457–464. Hill, G.M., R.N. Gates, and G.W. Burton. 1993. Forage quality and grazing steer performance from Tifton 85 and Tifton 78 bermudagrass pastures. J. Anim. Sci. 71:3219–3225. Holt, E.C., and J.A. Lancaster. 1968. Yield and survival of ‘Coastal’ bermudagrass as influenced by management practices. Agron. J. 60:7–11. doi:10.2134/agronj1968.00021962006000010003x Johnson, C.R., B.A. Reiling, P. Mislevy, and M.B. Hall. 2001.
WWW.CROPS.ORG
1725
Effects of nitrogen fertilization and harvest date on yield, digestibility, fiber, and protein fractions of tropical grasses. J. Anim. Sci. 79:2439–2448. Lemaire, G., M.H. Jeuffroy, and F. Gastal. 2008. Diagnosis tool for plant and crop N status in vegetative stage. Theory and practices for crop N management. Eur. J. Agron. 28:614–624. doi:10.1016/j.eja.2008.01.005 Mandebvu, P., J.W. West, G.M. Hill, R.N. Gates, R.D. Hatfield, B.G. Mullinix, A.H. Parks, and A.B. Caudle. 1999. Comparison of Tifton 85 and Coastal bermudagrasses for yield, nutrient traits, intake, and digestion by growing beef steers. J. Anim. Sci. 77:1572–1586. Mathews, B.W., S.C. Miyasaka, and J.P. Tritschler. 2004. Mineral nutrition of C4 forage grasses. p. 217–266. In L.E. Moser et al. (ed.) Warm season (C4) grasses. ASA, CSSA, SSSA, Madison, WI. Matthew, C., G. Lemaire, N.R. Sackville Hamilton, and A. Hernandez-Garay. 1995. A modified self-thinning equation to describe size/density relationships for defoliated swards. Ann. Bot. (Lond.) 76:579–587. doi:10.1006/anbo.1995.1135 McCormick, M.E. 1974. Effects of forage variety, fertilizer, and cutting on nutritive value and yield of various forages. M.S. thesis. Louisiana State Univ., Baton Rouge. Mislevy, P., and F.G. Martin. 2006. Biomass yield and forage nutritive value of Cynodon grasses harvested monthly. Proc. Soil Crop Sci. Soc. Fla. 65:9–14. Moore, J.E., and G.O. Mott. 1974. Recovery of residual organic matter from in vitro digestion of forages. J. Dairy Sci. 57:1258–1259. doi:10.3168/jds.S0022-0302(74)85048-4 Muir, J.P., B.D. Lambert, A. Greenwood, A. Lee, and A. Rojas. 2010. Comparing repeated forage bermudagrass harvest data to single, accumulated bioenergy feedstock harvests. Bioresour. Technol. 101:200–206. doi:10.1016/j.biortech.2009.07.078 Overman, A.R., M.A. Sanderson, and R.M. Jones. 1993. Logistic response of bermudagrass and bunchgrass cultivars to applied nitrogen. Agron. J. 85:541–545. doi:10.2134/agronj1993.000219 62008500030004x Peoples, M.B., E.W. Boyer, K.W.T. Goulding, P. Heffer, V.A. Ochwoh, B. Vanlauwe, S. Wood, K. Yagi, and O. Van Cleemput. 2004. Pathways of nitrogen loss and their impacts on human health and the environment. p. 53–69. In A.R. Mosier et al. (ed.) Agriculture and the nitrogen cycle. The Scientific Committee on Problems of the Environment (SCOPE). Island Press, Covelo, CA. Premazzi, L.M., F.A. Monteiro, and J.E. Corrente. 2003. Tillering of Tifton 85 bermudagrass in response to nitrogen rates and time
1726
of application after cutting. Sci. Agric. 60:565–571. doi:10.1590/ S0103-90162003000300023 Prine, G.M., and G.W. Burton. 1956. [Cynodon dactylon (L.) Pers.] The effect of nitrogen rate and clipping frequency upon the yield, protein content and certain morphological characteristics of Coastal bermudagrass. Agron. J. 48:296–301. doi:10.2134/agro nj1956.00021962004800070005x R Development Core Team. 2009. R: A language and environment for statistical computing [Online]. Available at http://www.Rproject.org (verified 18 Mar. 2011). R Foundation for Statistical Computing, Vienna, Austria. Sbrissa, A.F., S.C. da Silva, C. Matthew, C.A.B. de Carvalho, R.A. Carnevalli, L.F. de M. Pinto, J.L. Fagundes, and C.G.S. Pedreira. 2003. Tiller size/density compensation in grazed Tifton 85 bermudagrass swards. Pesqi. Agropecu. Bras. 38:1459–1468. Schmer, M.R., K.P. Vogel, R.B. Mitchell, and R.K. Perrin. 2008. Net energy of cellulosic ethanol from switchgrass. Proc. Natl. Acad. Sci. USA 105:464–469. doi:10.1073/pnas.0704767105 Silveira, M.L., V.A. Haby, and A.T. Leonard. 2007. Response of Coastal bermudagrass yield and nutrient uptake efficiency to nitrogen sources. Agron. J. 99:707–714. doi:10.2134/agronj2006.0200 Sinclair, T.R., J.D. Ray, P. Mislevy, and L.M. Premazzi. 2003. Growth of subtropical forage grasses under extended photoperiod during short-daylength months. Crop Sci. 43:618–623. doi:10.2135/cropsci2003.0618 Sinclair, T.R., J.D. Ray, L.M. Premazzi, and P. Mislevy. 2004. Photosynthetic photon flux density influences grass responses to extended photoperiod. Environ. Exp. Bot. 51:69–74. doi:10.1016/ S0098-8472(03)00061-3 Snyder, C.S., and R.H. Leep. 2007. Fertilization. p. 355–377. In R.F. Barnes et al. (ed.) Forages, the science of grassland agriculture. Volume 2. 6th ed. Wiley-Blackwell, Ames, IA. Trenholm, L.E., A.E. Dudeck, J.B. Sartain, and J.L. Cisar. 1998. Bermudagrass growth, total nonstructural carbohydrate concentration, and quality as influenced by nitrogen and potassium. Crop Sci. 38:168–174. doi:10.2135/cropsci1998.001118 3X003800010028x Vendramini, J.M.B., L.E. Sollenberger, A.T. Adesogan, J.C.B. Dubeux, Jr., S.M. Interrante, R.L. Stewart, Jr., and J.D. Arthington. 2008. Protein fractions of Tifton 85 and rye-ryegrass due to sward management practices. Agron. J. 100:463–469. doi:10.2134/agrojnl2007.0143
WWW.CROPS.ORG
CROP SCIENCE, VOL. 51, JULY– AUGUST 2011