Jun 12, 2000 - West Palm Beach (Florida), ISSN 0749-0208. Landsat Thematic ... consolidated shore and bare land classes; and especially in 1993, between water and floating vegetation classes. Combining ..... The iterative clustering tech-.
Journal of Coastal Research
53-71
West Palm Beach, Florida
Winter 2001
Coastal Change Analysis Program Implemented in Louisiana Elijah W. Ramsey III, Gene A. Nelson, and Sijan K. Sapkota] U.S. Geological Survey National Wetlands Research Center tJohnson Controls World Services Inc. 700 Cajundome Blvd., Lafayette, LA 70506, U.S.A.
ABSTRACT
.tllllllll,.
susss ~ ~~e
% ;-JW
.
RAMSEY, E.W., III; NELSON, G.A., and SAPKOTA, S.K., 2001. Coastal Change Analysis Program Implemented in Louisiana. Journal of Coastal Research, 17(1),53-71. West Palm Beach (Florida), ISSN 0749-0208. Landsat Thematic Mapper images from 1990 to 1996 and collateral data sources were used to classify the land cover of the Mermentau River Basin (MRB) within the Chenier Plain of coastal Louisiana. Landcover classes followed the definition of the National Oceanic and Atmospheric Administration's Coastal Change Analysis Program; however, classification methods had to be developed as part of this study for attainment of these national classification standards. Classification method developments were especially important when classes were spectrally inseparable, when classes were part of spatial and spectral continuums, when the spatial resolution of the sensor included more than one landcover type, and when human activities caused abnormal transitions in the landscape. Most classification problems were overcome by using one or a combination of techniques, such as separating the MRB into subregions of commonality, applying masks to specific land mixtures, and highlighting class transitions between years that were highly unlikely. Overall, 1990, 1993, and 1996 classification accuracy percentages (associated kappa statistics) were 80% (0.79),78% (0.76), and 860/0 (0.84), respectively. Most classification errors were associated with confusion between managed (cultivated land) and unmanaged grassland classes; scrub shrub, grasslands and forest classes; water, unconsolidated shore and bare land classes; and especially in 1993, between water and floating vegetation classes. Combining cultivated land and grassland classes and water and floating vegetation classes into single classes accuracies for 1990, 1993, and 1996 increased to 82%, 83%, and 90%, respectively. To improve the interpretation of landcover change, three indicators of landcover class stability were formulated. Location stability was defined as the percentage of a landcover class that remained as the same class in the same location at the beginning and the end of the monitoring period. Residence stability was defined as the percent change in each class within the entire MRB during the monitoring period. Turnover was defined as the addition of other landcover classes to the target landcover class during the defined monitoring period. These indicators allowed quick assessment of the dynamic nature of landcover classes, both in reference to a spatial location and to retaining their presence throughout the MRB. Examining the landcover changes between 1990 to 1993 and 1993 to 1996, led us to five principal findings: (1) Landcover turnover is maintaining a near stable logging cycle, although the locations of grassland, scrub shrub, and forest areas involved in the cycle appeared to change. (2) Planting of seedlings is critical to maintaining cycle stability. (3) Logging activities tend to replace woody land mixed forests with woody land evergreen forests. (4) Wetland estuarine marshes are expanding slightly. (5) Wetland palustrine marshes and mature forested wetlands in the MRB are relatively stable.
Landsat Thematic Mapper, land cover, classification, change detection, Mermentau River Basin, location stability, residence stability, turnover, accuracy assessment.
ADDITIONAL INDEX WORDS:
INTRODUCTION Dramatic losses of wetlands within the coastal zone of Louisiana have been documented since 1956 (NATIONAL RESEARCH COUNCIL, 1987). Methods are needed to quantify these wetland changes, mitigate the losses where feasible, and manage the remaining resources in a sustainable fashion. To manage the wetland resource, a regional assessment is necessary for the present land cover, recent landcover change, and the association between wetland condition and human-induced (e.g., hydrologic modification, agricultural pollution, oil exploration) and natural (e.g., sea-level rise, storms, subsidence) alterations. Further, resource managers 99037 received 20 April 1999; accepted in revision 12 June 2000.
must be provided with an early warning system that is able to quickly and efficiently assess large areas in order to identify wetland stress in time to mitigate wetland loss. The U.S. Geological Survey's (USGS) National Wetlands Research Center (NWRC) in participation with the National Oceanic and Atmospheric Administration's (NOAA) Coastal Change Analysis Program (C-CAP) developed and built a comprehensive and standardized geographic information system to detect and assess changes in land cover in and immediately surrounding the Mermentau River Basin (MRB) within the Chenier Plain of coastal Louisiana (Figure 1). Programs such as C-CAP use the Landsat Thematic Mapper (TM) sensor to provide a timely and cost effective national system of classified coastal landcover maps (KLEMAS et al., 1993). Regionally, however, the development of new and the
Ramsey, et al.
54
classification based on only one TM image. Collateral data (e.g., photography, National Wetlands Inventory [NWI]) are helpful (WILEN and FRAYER, 1990), but indications are that higher classification accuracy is possible by using multidate TM images (RAMSEY et al., 1994; RAMSEY and LAINE, 1997; LUNETTA and BALOSH, 1999). This study drew upon results of the previous remote sensing studies conducted at NWRC. It extends our region of study from areas directly influenced by the Mississippi River to the Chenier Plain by producing a regional assessment of the land cover in the MRB and surrounding areas. Our objectives in this study were to create maps documenting the land cover and areas of change in the MRB from 1990 to 1996 and develop regional methods, as outlined in DOBSON et al. (1995), specifically for coastal Louisiana and for the Gulf of Mexico coastal region in general. An added component of these objectives was to design indicator variables that would allow quick assessment of the stability of a land cover at a particular location, throughout the area of study, and as influenced by changes in another land cover.
LOUISIANA Alexandria
•
Baton Rouge
•
40
0
40
80 Kilometers
[:-=~:::::=--F::::::~
~N
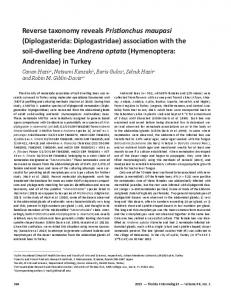
Figure 1. The Mermentau River Basin (MRB) study area includes 1,938,552 ha of coastal zone, prairie region, and forest. The hydraulic confines of the MRB encompass 964,771 ha.
modification of current methods based on national standards are desirable. The C-CAP national standard classification definitions would not change, but the methods to obtain these standard classifications may need change or revision. The development of base line landcover information also benefits the implementation of the Nonpoint Source (NPS) Management Program for the MRB mandated by the Coastal Zone Management Act Reauthorization Amendments of 1990. The primary objective of the NPS Management Program is to implement the best management practices (BMP) that reduce the level of non point source pollution in surface and ground waters and adjacent coastal waters (Louisiana Department of Environmental Quality (LDEQ) Office of Water Resources, 1990, 1992). In Louisiana, about 35% of wetlands are impacted by agricultural nonpoint source (LDEQ Office of Water Resources n.d.), Identification of these nonpoint sources not only would provide a base map for implementation of the Louisiana NPS program, but it would also provide a method to monitor results from BMP implementations. Currently, NWRC is exploring the use of remote sensing techniques to identify and monitor wetland type and wetland health in the U.S. Gulf of Mexico coast (RAMSEY et al., 1992; RAMSEY et al., 1993; RAMSEY and LAINE, 1997). Results from these studies indicated that human and animal activities (e.g., marsh burning, animal herbivory) and changing vegetation conditions (e.g., transient aquatic vegetation, forest leaf-off and leaf-on) complicate accurate assessment of coastal resources (RAMSEY et al., 1993; RAMSEY and LAINE, 1997). Added to the highly irregular and heterogeneous nature of the Louisiana coastal wetland, these problems can confound
STUDY AREA The study area included coastal wetlands and uplands in the MRB and areas surrounding the basin covered by the Landsat Thematic Mapper (TM) imagery. The entire MRB study area (TM coverage, Figure 1) encompassed 1,938,552 hectares of coastal zone, prairie region, and forest, including 964,771 hectares (LDEQ Office of Water Resources n.d.) defining the hydraulic confines of the Mermentau River Basin (Figure 1). Stretching along the Gulf shore lies a nearly continuous band of highly permeable sand and shell (cheniers) protecting extensive backbarrier marshes that extend inland 6 km to 24 km, commonly at less than 1.5 m above mean sea level with slopes of less than 0.2 m per km. Progressing farther inland, the landscape transforms to large expanses of prairie (an area of extensive rice cultivation and aquaculture), and finally, to forest. Generally, marshland is considered coastal area and forest and prairie are considered uplands (CHABRECK, 1970). The lower MRB contains numerous management areas for fish and wildlife resources. For example, within the MRB, the Amoco Marsh (about 40,000 ha) has wintering habitat for more than 250,000 waterfowl. The MRB also contributes extensive sport and commercial fisheries (e.g., fish, shrimp, crab). The U.S. Fish and Wildlife Service's Lacassine and Cameron Prairie National Wildlife Refuges (about 18,000 ha), the State of Louisiana's Rockefeller Refuge (about 34,800 ha), and several landowners are involved in the planning and implementation of marsh conservation projects. Alteration of the water quality and hydrology has impacted the MRB coastal habitat. Fish kills have been commonly reported throughout the basin, possibly due to a combination of water pollution and hydrologic modification. Point discharges and agriculture runoff from the wide expanses of rice cultivation in the upper MRB is suspected to be responsible for the kills. The construction of control structures has led to increased inundation of the coastal marsh. Controversy exists
Journal of Coastal Research, Vol. 17, No.1, 2001
55
C-CAP Implemented in Louisiana
Table 1. Data Sources for the Merentau River Basin. Color Infrared Photography
Digital Line Graph
Habitat Data
December 8, 1985 (1:65,000)* December 8, 1990 (1:65,000)**
1988 USGS (1:24,000)
1988/90 NWI
Landsat Imagery 1990
October 10, 1990 November 11, 1990 1993 November 29, 1992 February 1, 1993 February 8, 1993
November 6, 1992 (1:65,000)**
1996 November 22, 1995 January 25, 1996 February 17, 1996
January 8, 1995 (1:32,500) January 28, 1995 (1:32,500)
* Coverage for upper region of the MRB. ** Coverage for coastal region of the MRB. over whether the higher inundation duration is aggravating marsh loss or enhancing marsh stabilization.
METHODS Cloud-free TM images were acquired of the MRB between the fall and winter months (October to February) for the years between 1990 and 1996 (for a description see Table 1). Two scenes were required to cover the MRB in 1990 and three scenes in 1993 and 1996. One of the three winter scenes used in the 1993 classification was from 1992, and similarly, a 1995 winter scene was used in the 1996 classification (Table 1). As in the use of the 1990 fall scenes, the earlier winter collections were used due to the unavailability of cloud free images. The scenes were goeregistered to a georeferenced base image and subsequently mosaiced to a UTM coordinate system by using a nearest neighbor resampling method and a spatial resolution of 25 m by 25 m. Visual inspection and the reported root-mean-square error indicated :±:0.5 pixel registration accuracy among all images. All data were entered into a common database for subsequent analysis. Collateral data sources included color infrared (CIR) photography, 1988/ 90 NWI habitat maps, and USGS vector data (Table 1). Because of the availability of in-house CIR photography for 1990, USGS NAPP photography was not used. The in-house photography, however, covered only the lower half of the MRB.
Classification TM image classifications were based on methods outlined in DOBSON et al. (1995). The late fall 1990 TM image was considered as the base image and the winter 1993 and 1996 TM images as the later images. Final classification included sixteen classes (Table 2). Field data and collateral resources were used to refine classifications and perform accuracy assessments. Early attempts to classify the MRB indicated additional steps had to be taken to produce satisfactory classification accuracies. The technique that was most useful in improving classification accuracies was the division of the MRB into subregions by the use of masks. The use of masks at the regional level helped to exclude spectrally inseparable classes
by defining regions of commonality. As an example, flooded rice fields were impossible to tell apart from water and emergent marsh located in the wetland areas of the MRB. Separating the MRB into regions dominated by agricultural and by coastal wetlands allowed the majority of rice fields to be correctly classified. Regional implementation of the masking technique in the classification process consisted of separating the MRB classification area into regions of similar landcover types (Figure 2). The coastal (mostly wetlands) and inland (primarily agriculture) areas were each separated into three subregions and the forested image area in the northwest consisted of a single subregion. These categorizations resulted in seven subregions for each date (1990, 1993, and 1996). An iterative clustering approach was then used to classify each subregion (e.g., RAMSEY and LAINE, 1997). Each subregion was first separated into the major categories of water, upland, and wetland using an unsupervised K-means clustering algorithm (PCI Geomatics, 1998). The major categories were then masked individually per subregion and the iterative clustering process was performed on each category. After several clustering iterations of the masked data, classification labels were assigned to the spectral clusters following the C-CAP landcover classification scheme (Table 2). Collateral data also were used to produce masks to assist in the separation of classes that tended to be inseparable, (e.g., wetland estuarine and palustrine and bare land and urban areas). For the marsh areas, 1988/1990 NWI habitat data were used to create masks for wetland estuarine and palustrine classes. NWI data coverage was similar to the coverages shown for the emergent wetland regions in Figure 2. Clustering iterations were then performed under the masks in order to update and refine the NWI data. To alleviate the problem of bare land mixing with urban areas, an urban mask was produced. This was accomplished by converting a digital line graph (USGS vector data) coverage of roads located within the MRB to a raster form. With the road coverage converted to raster form, an average filter of 15 pixels by 15 pixels was applied to the raster road image, The resulting file was an image with urban areas that contained roads in close spatial proximity. The iterative clustering technique was applied under the urban mask. In some difficult cases, human pattern recognition was
Journal of Coastal Research, Vol. 17, No.1, 2001
Ramsey, et al.
56
Table 2. Value
C-Cap Landcover Classification. Description
Class Name Developed High Intensity
2
Developed Low Intensity
3 4
Cultivated Land Grassland
5 6
Woody Land Deciduous Woody Land Evergreen
7 8 9
Woody Land Mixed Woody Land Scrub Shrub Bare Land
10
Wetland Estuarine
11
Wetland Palustrine
12
Woody Wetland Deciduous
13 14
Woody Wetland Scrub Shrub Unconsolidated Shore
15 16
Water Floating Vegetation
Heavily built up urban centers and large constructed surfaces in suburban and rural areas. Areas tend to contain significant land area covered by concrete and asphalt. Areas with a mixture of constructed materials and vegetation or other cover. These areas commonly included single-family housings, especially in suburban neighborhoods, but may include scattered surfaces associated with all types of landuse. Areas that have been planted, tilled, or harvested. Lands covered by natural and managed herbaceous cover: included are lawns and other managed grassy areas such as parks, cemeteries, gulf courses, road right-of-ways, and other herbaceous covered, landscaped areas. Areas having a predominance of trees that lose their leaves or needles at the end of the frost-free season. Areas having a predominance of trees that do not lose their leaves or needles at the end of the frost free season. Areas where both evergreen and deciduous trees are growing and neither predominate. Areas that contain shrub vegetation that is