induction heating, is imaged by measuring the transient temperature profiles on the ..... Wesley Cable J., Induction and Dielectric heating, Reinhold Publishing ...
TONE BURST EDDY-CURRENT THERMOGRAPHY (TBET) Ch. N. Kiran Kumar, C.V. Krishnamurthy, Bruce W. Maxfield and Krishnan Balasubramaniam Centre for Non-Destructive Evaluation and Department of Mechanical Engineering, Indian Institute of Technology Madras, Chennai-600036, India
ABSTRACT: This paper reports on a Tone Burst Eddycurrent Thermography (TBET) technique that uses short-time bursts of eddy-currents induced in conducting media to generate local heating inside the material. The transient diffusion of the heat inside the material, induced by pulsed/short-time induction heating, is imaged by measuring the transient temperature profiles on the surface of the material. The presence and characteristics of the defects inside the materials changes the surface temperature transients and thus can be used for the nondestructive evaluation (NDE) of conducting materials. Axisymmetric numerical models of the conventional transient thermography technique are used to benchmark the TBET technique. From the temperature profile data, temperature contrast information is obtained for the different defect depths. Temperature contrast data obtained for TBET, in this process, was compared with that obtained from conventional transient thermography data. It was found that the frequency of the eddy-current and, consequently, the skin-depth of the induced field play an important role in the effective utilization of this technique. Simulation details and the experimental results are presented in the paper. Possible advantages of TBET over conventional flash thermography are also discussed and supported by experimental data. Keywords: Eddy-Current Heating, Induction Heating, Skin Depth, Thermography, Tone Burst PACS: 81.70.Ex, 72.15.Jf
INTRODUCTION Induction/Eddy-current heating relies on the currents generated within the material to produce heat. Many induction heating applications are found in manufacturing, as it provides fast and consistent heating, and is also cost effective [1, 2]. Several analytical/numerical models are reported on the induction heating process [3-5]. Pulsed thermographic NDT is based on the rapid heating of the surface of an object using either a laser or a flash lamp and transient mapping of the surface temperature, either on the same side or on the opposite side, using a high-speed, highsensitivity, infrared (IR) camera. Heat diffusion into the material, when perturbed by the presence of a subsurface defect, causes a local temperature contrast (between the defective and the non-defective regions) on the measuring surface. This temperature contrast is detected by the thermal imaging equipment. Recorded images over several time frames are processed for extracting the internal flaw information [6-10]. The
CP975, Review of Quantitative Nondestructive Evaluation Vol. 27, ed. by D. O. Thompson and D. E. Chimenti © 2008 American Institute of Pliysics 978-0-7354-0494-6/08/$23.00
544
transient thermography NDE technique requires monitoring of subtle changes in the surface temperature of the test object for a rise of a few degrees. Surface temperature monitoring demands using thermal detectors having very high resolution, frame-rate capability and accuracy. An alternative method using induction based (eddy-currents) heating for thermography is being explored for surface and subsurface crack detection[ll-17], and for applications in the lock-in thermography mode [18]. An attempt was made to understand the underlying principles of Eddy-current heating and to standardize the procedure [19]. This was also applied for powder metallurgy compacts[20]. Induction heating is accomplished using an electromagnetic coil through which alternating current at a specific frequency is applied. This AC induces eddy-currents in any conducting material that is placed near the coil. The currents, in turn, produce heat near the surface. In most of the earlier reported work, continuous AC was employed at a single frequency. However, the use of tone bursts (a fixed number of cycles) and the effect of the frequency of the AC are both explored in great detail in this paper. This technique, henceforth called Tone Burst Eddy-current Thermography (TBET) uses tone burst AC pulses to locally heat a conducting material and uses a thermal imaging IR camera to map the surface temperatures. The eddy-currents produced due to the induction coil placed near the sample causes a rise in the near surface temperature of the sample due to Joule heating. The heating pattern on the sample surface, as a function of time of observance, will depend on the type of defect and its position. Thus, the heated surface of the sample is monitored. A rise of few degrees is expected when a defect is present. This method can be used for both nondestructive testing applications for defect detection as well as materials characterization for the measurement of thermal diffusivity and electrical conductivity of conducting materials and components. In the current paper, the TBET technique has been compared with the conventional thermography technique using simulation of thermal images obtained on samples with flat bottomed defects using finite element based numerical models. In all of the simulations, the heat pulse is given to the sample from one side and the temperature is monitored on the same side of the sample (reflection mode thermography). SIMULATION MODEL DESCRIPTION OF TBET The TBET technique requires a multi-physics electro-thermal approach involving, (a) an electro-magnetic model for the eddy-current generation, (b) an electro-thermal model for the conversion of eddy-currents into heat, and (c) the thermal conductivity model for the heat conduction from the heating surface into the material. A Finite Element Modeling (FEM) approach has been selected so that the model can be later extended to more complex and arbitrary configurations. All models were developed using the COMSOL® package version 3.2.
545
ELECTROMAGNETIC PROBLEM: EDDY-CURRENT GENERATION The following equation provides the eddy-current profiles in the sample body which are further used for processing heat generation data. V X —(V X i ) + (cr + j«£)VF + {jam -sa^)A=J^+
G{V^ X (V X i ) )
(1)
Where, ^-Magnetic Vector Potential, J-Eddy-current density, a-Electrical conductivity, o-Frequency of voltage, F-Electric potential, ^-Electrical permeability, /jrMagnetic permeability, v^-Velocity of the sample. The boundary conditions to solve the above equation are. For all the interior boundaries, h.{H^ -H^)=0
(2)
For the end boundary A = 0
(3)
ELECTRO - THERMAL PROBLEM: EDDY-CURRENT HEATING The eddy-currents generated by induction due to Joule heating increase the average temperature of the body. For the case shown in Fig. 1, the Joule losses are given by Q-
JxJ* 2cr
(4)
Where, J is the eddy-current in the sample, J* is the complex conjugate of J and a is the electrical conductivity of the sample.
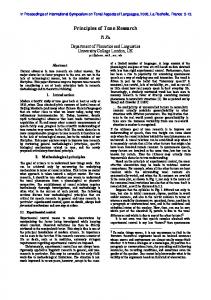
Axis of Symmetry od
I Liftoff
FIGURE 1 Simulation model of TBET (NOTE: OD = 22 mm).
546
Lift off = 2 mm id = 2 mm od = 22 m r = 10 mm w = 60 mm In = 20 mm t = 1 mm
HEAT DIFFUSION AND RADIATION The non-stationary temperature distribution in the sample is described by the equation,
pC^+y-{-kyT)
=Q
(5)
ot
Where T is the temperature, p is the mass density, C is the heat capacity, k is the thermal conductivity and Q is the heat source or heat sink. For the TBET simulations, the heat generated by Joule losses was incorporated into the above equation with appropriate boundary conditions to solve for the thermal profile at any arbitrary point in the solution domain as a function of time. Boundary conditions of convection and radiation are applied on both the sample and the coil through the following equation, dT -k— = h(T-TJ on
+ sa(T'-T\)+Q^
(6)
Where T^, = Ambient temperature, T is the temperature of the body, h is the convection coefficient, s is the emissivity of the body, a is the Stefan's constant for radiation, Qs is the surface source/sink of heat. The final boundary is at such a position that it has the boundary condition of constant temperature applied to it. T=To
(7)
Boundary conditions of convection and radiation were applied with the system initial temperature of 300 K. Initial surface temperature due to flash heating was taken as 335 K. The temperature at the heated surface was then monitored for two seconds. Temperature-time profiles at two points of the model were observed (a) on the heating surface where the axis of the flat bottom circular defect intersects the surface and (b) on the heating surface at a distance of 4 times the radius of the flat bottom circular defect. The voltage input to the coil is given by Eq. (8). For simulations, the parameters are chosen in a trial and error method in such a way that there is the desired rise of temperature (a few degrees) on the surface of the specimen. The tone burst input voltage function to the heating coil is of the form fit)
= j3e-"''-^Uosi27Tf^it-T)
+ ^)
(8)
Where, |3 = Amplitude (2 V), a = Bandwidth factor(5000), x = Arrival time (0.05 s), f^ = Central Frequency(3500 Hz), ^ = Phase difference(O), t = Time ( 0 - 2 s).
547
[^lurdLi; of iiLtere^l vi^imlizMl by fdiritT'd
\
Axis ofsyininclry of the coil
ctMi Qeueralnr
]•
\^
Coilnithtobbm
Liface of mleresl visualized !)>• camera Axis of BjTTinicliy of the troil
• ^
I Ccmronter I
|
]-
* Coil with botbiji
SilJTiple
FIGURE 2. The experimental apparatus in schematic format on the left and the two modes of data collection i.e. transmission and reflection on the right hand side.
EXPERIMENTAL APPARATUS The experimental setup primarily involves (a) a means for the generation of electromagnetic induction into the conducting material, and (b) a means for the measurement of temperatures at the boundaries of the material. A typical apparatus is illustrated in Fig. 2. Major parts of experimental setup includes, (a) Power Amplifier PA 52A, (b) DC power supply, (c) Function Generator - FG, (d) Induction Coil and Bobbin, (e) Digital Storage Oscilloscope - DSO, and (f) IR Camera and Computer. The power amplifier can give an output of 80 A with an output voltage boost up to 230 V peak to peak. Maximum internal dissipation of the power amplifier is 400 W. RESULTS AND DISCUSSION (NUMERICAL SIMULATIONS) The temperature profile of the surface point where the axis of the flat bottom circular defect intersects the surface is observed for two seconds for the case study illustrated in Fig. 1. Temperature profiles are obtained for the same point for varying defect depths. By looking at the temperature profiles for varying defect depths, it can be observed that the defect depths fall into two categories; (a) Set a - Peak temperature increases with decrease in defect depth, and (b) Set b - Peak temperature remains constant with increase in defect depth The defect depth that differentiates Set a and Set b defect depths is called "Cut off depth". For the current simulation set, for the defect depths < 3 mm there is a rise in peak temperature with decreasing defect depths, while for defect depths > 3 mm the peak temperature is constant for varying defect depth. Thus 3 mm defect depth is the "Cut off depth". The maximum temperature reached by the Set b defect depths is called the saturation temperature. Center frequency of the input voltage is 3500 ITz and skin depth for the corresponding frequency for aluminum is 1.385 mm. We can also divide the defect depths based on skin depth, higher and lower than skin depth.
548
Set a Defect Depth temperJitiue profiles
Set Ij Defect Deptli Teinperatiue profiles 3iiiiti 3.5 mm "
Slllltl
1 TiifL^.'Seconds
FIGURE 3 Temperature Profiles for (a) Set a and (b) Set b.
Teinepratiu'e conti'ast (lata for pulsed eililytlieim for defects> Delta
Teiif|)fiTitiii¥ coiitiTi« for skin depth. It can be easily observed that for defect depths < skin depth, the thermal contrast rises with a decrease in the defect depth with no change in the time of occurrence. In the case of defect depths > skin depth, the thermal contrast falls with increase in the defect depth while the peak contrast shows a shift towards the right of the time axis similar to the case of pulsed thermography. RESULTS AND DISCUSSIONS (EXPERIMENTS) Typical experimental results are shown in Fig. 5. The experimental results were conducted using the transmission mode. The bobbin coil was used to image defects located between an aluminum plate and a bonded rubber layer. The different defect sizes were imaged successfully.
549
FIGURE 5 A typical experimental result using the bobbin coil showing delamination defects between an aluminum plate and a rubber substrate.
ADVANTAGES OF TBET VS. CONVENTIONAL PULSED THERMOGRAPHY 1. Low power is utilized compared to conventional thermography as the temperature rise to contrast ratio is higher for TBET 2. Parameter optimization is possible to easily identify defects at different locations, i.e. possibility of tuning the defect depth accuracy 3. Thermal excitation miniaturization helps in local testing of the sample. 4. No flooding of sample with energy 5. The whole setup can be made more portable 6. No necessity to paint the samples when dealing with highly reflecting surfaces as is required in flash thermography applications. 7. Frequency tuning to identify flaws at different levels SUMMARY Transient Tone Burst Eddy current Thermography technique uses a transient electromagnetic method whereby eddy-currents are induced in a conducting media in order to produce local heating inside materials/structures and to measure the effect of the heat generated, including heat diffusion in the material, through measurement of temperature at the outer boundaries of the material/structure. The temperature is measured as a function of time. This provides information about the material state. Transient diffusion of the heat inside the material is imaged by measuring the transient temperature profiles at the surface using devices such as an IR camera. The presence of anomalies, and the characteristics of the materials, change the surface temperature transients and thus can be used for the nondestructive evaluation (NDE) of conducting and non-conducting materials. The material state that may be measured includes, but is not limited to: (a) electrical conductivity, (b) thermal diffusivity, (c) flaws and anomalies, (d) thickness of layers and materials, (e) material non-uniformity, (f) depth profiles of material properties, (h) stress and stress profiles, (i) material degradation including plastic deformation, hydride embrittlement, creep, fatigue, etc., (k) magnetic properties, (1) process parameters, and (m) surface properties such as roughness, treatments, hardness.
550
REFERENCES 1. Wesley Cable J., Induction and Dielectric heating, Reinhold Publishing Corporation, London, 1954. 2. Davies E. J., Conduction and induction heating, P. Peregrinus Etd., London, 1990. 3. Clain S., Rappaz J., Swierkosz M., Touzani R., "Numerical modeling of induction heating for two-dimensional geometries". Math. Models and Meth. in Appl. Sci.; 3(6):805-822, 1993. 4. Rappaz, Swierkosz M., "Mathematical modelling and numerical simulation of induction heating processes", Appl. Math, and Comp. Sci.; 6(2):207-221, 1996. 5. Solin P., Dolezel I., Haskovec J., Ulrych B., "On a fieldless method for the computation of induction-generated heat in 3D non-ferromagnetic metal bodies Source", Mathematics and Computers in Simulation 61(3-6), 239 - 247, 2003. 6. Xavier P.V. Maldague, Theory and Practice of Infrared Technology for Nondestructive Testing, Chapter 10, 369-370, (Ed. Kai Chang), Wiley-Interscience, USA., 2001. 7. Parker, W. J., Jenkms, R. J., Butler, C. P., and Abbott, G. L., 1961, "Flash Method of Determining Thermal Diffusivity, Heat Capacity, and Thermal Conductivity," J. Appl. Phys., 32, 1679-1684. 8. Ringermacher, H. I., Archacki, Jr., R. J., and Veronesi, W. A., 1998, "Nondestructive Testing: Transient Depth Thermography," U.S. Patent No. 5,711,603. 9. Maldague X. , 2001, "Infrared and thermal testing " Nondestructive testing Handbook, 3, ASNT Publications, Columbus, OH, USA. 10. Shepard, S. M., Lhota, J. R., Rubadeux, B. A., Wang, D., and Ahmed, T., 2003, "Reconstruction and Enhancement of Active Thermographic Image Sequences," Opt. Eng, 42, 1337-1342. 11. Lehtiniemi, R. and J. Hartikainen, 1994 "An Application of Induction Heating for Fast Thermal Nondestructive Evaluation," Rev. ofSc. Instr, 65(6), 2099-2101. 12. Bamberg J., Erbeck G., Zenzinger G., 1999 "EddyTherm: Ein Verfahren zur bildgebenden Riflprilfung metallischer Bauteile", ZfP-Zeitung 68, 60 - 62. 13. B. Oswald-Tranta, "Thermo-inductive Investigations of Magnetic Materials for Surface Cracks", QIRT Journal, 1, 33-46, 2004. 14. Zenzinger G., Bamberg J., Dumm M., "EddyTherm - ein Rissprilfverfahren vor der Senenreife", ZfPZeitung 91, 39-42, 2004. 15. B. Oswald-Tranta, G. Wally, "Thermo-Inductive Surface Crack Detection in Metallic Materials", Proc. ECNDT, We.3.8.3, 2006. 16. G. Walle and U. Netzelmann, "Thermographic Crack Detection in Ferritic Steel Components Using Inductive Heating", Proc ECNDT, Tu.4.8.5, 2006. 17. Tsopelas N., Siakavellas N.J., "Electromagnetic-thermal NDT in thin conducting plates", NDT & E International, 39(5), 391-399, 2006. 18. Riegert G., Gleiter A., Busse G., "Eddy-current lock-in-thermography: Method and Its potential", J. Phys. IVFrance 125, 587-591, 2005. 19. Ch. N. Kiran Kumar, C.V. Krishnamurthy, K. Balasubramaniam, B.W. Maxfield, E. Kannan, "Eddycurrent Transient Thermography Technique", Proc. NDE - 2006, T P 79, December 2006. 20. S. Benzerrouk, and R. Ludwig, Infrared Detection of Defects in Powder-Metallic Compacts Journal of Nondestructive Evaluation 26(1). 1-9. 2007
551