Apr 14, 2009 - univERsity oF copEnhAGEn. Too little, too late: Reduced visual span and speed characterize pure alexia. Starrfelt, Randi; Habekost, Thomas; ...
Cerebral Cortex December 2009;19:2880--2890 doi:10.1093/cercor/bhp059 Advance Access publication April 14, 2009
Too Little, Too Late: Reduced Visual Span and Speed Characterize Pure Alexia
Whether normal word reading includes a stage of visual processing selectively dedicated to word or letter recognition is highly debated. Characterizing pure alexia, a seemingly selective disorder of reading, has been central to this debate. Two main theories claim either that 1) Pure alexia is caused by damage to a reading specific brain region in the left fusiform gyrus or 2) Pure alexia results from a general visual impairment that may particularly affect simultaneous processing of multiple items. We tested these competing theories in 4 patients with pure alexia using sensitive psychophysical measures and mathematical modeling. Recognition of single letters and digits in the central visual field was impaired in all patients. Visual apprehension span was also reduced for both letters and digits in all patients. The only cortical region lesioned across all 4 patients was the left fusiform gyrus, indicating that this region subserves a function broader than letter or word identification. We suggest that a seemingly pure disorder of reading can arise due to a general reduction of visual speed and span, and explain why this has a disproportionate impact on word reading while recognition of other visual stimuli are less obviously affected. Keywords: fusiform gyrus, number reading, reading, theory of visual attention, visual word form area
Pure alexia is an acquired reading disorder that leaves writing unaffected. Pure alexic reading is usually slow with single-word reading characterized by a pronounced word length effect; reaction times (RTs) in reading increase linearly with word length, often with hundreds of milliseconds per letter (Behrmann, Plaut, and Nelson 1998). Theories of pure alexia can be roughly divided into 2 groups: 1) Domain-specific accounts, suggesting that pure alexia arises due to damage to a cognitive system or cerebral area specialized for recognizing visual word forms (Warrington and Shallice 1980; Warrington and Langdon 1994; Cohen et al. 2003; Cohen and Dehaene 2004); 2) General visual accounts, claiming that pure alexia reflects a general deficit in visual perception (Farah and Wallace 1991; Behrmann, Nelson, and Sekuler 1998), often conceptualized as a primary impairment in simultaneous perception or parallel processing (Farah, 2004). The question of the relative selectivity of pure alexia is of great theoretical interest, as it bears on the issue of whether specialized perceptual brain areas can develop through learning, and whether normal reading includes a stage of processing selectively dedicated to visual letter recognition. This question has received a lot of attention in the neuroimaging literature, where the role of the putative visual word form area (VWFA) in normal reading is highly debated. Some argue that the VWFA, which is located the left mid-fusiform gyrus, is specialized for processing of letters and words (Cohen and Dehaene 2004),
Randi Starrfelt1, Thomas Habekost1 and Alexander P. Leff2 1
Department of Psychology, Center for Visual Cognition, Copenhagen University, DK-1361 Copenhagen, Denmark and 2 Wellcome Trust Centre for Neuroimaging, Institute of Neurology, University College London, WC1N 3BG London, UK
whereas others argue that this area is also involved in visual processing of other stimulus categories (Devlin et al. 2006; Joseph et al. 2006; Starrfelt and Gerlach 2007), and may even be involved in nonvisual tasks (Price and Devlin 2003). Lesions of the VWFA are thought to be important in causing pure alexia (Cohen et al. 2003; Cohen and Dehaene 2004; Leff et al. 2006, although see Hillis et al. 2005). The 2 accounts of pure alexia predict different performance in tasks with 1) alphabetical versus nonalphabetical material; and 2) visual displays of single versus multiple items. Although a pure alphabetical deficit should affect letter and word processing only, a general visual deficit should affect visual recognition of other visual stimuli as well. A deficit in simultaneous perception should affect perception of multiple visual items regardless of stimulus category, whereas perception of single stimuli may be left intact. These predictions can be formally tested within the framework of a Theory of Visual Attention (TVA) (Bundesen 1990; Bundesen et al. 2005). This framework has proven effective for characterizing visual deficits after different types of brain damage (Duncan et al. 1999; Peers et al. 2005; Finke et al. 2006). TVA-based studies have been shown to be highly sensitive, as they can reveal subclinical visual deficits not evident on standard clinical tests (Habekost and Rostrup 2006), and highly specific, in that specific components of visual perception and attention can be singled out in TVA-based analyses (Duncan et al. 2003; Habekost and Rostrup 2007). Two measures of visual capacity, ‘‘processing speed’’ (the number of items processed per second) and the ‘‘visual apprehension span’’ (the maximum number of items that can be recognized in one view), can be modeled within this framework, and these 2 parameters can be assessed for different stimulus types. To test competing theories of pure alexia, we chose to investigate the visual capacity and stimulus specificity in 4 patients with this disorder using TVA-based assessment. Our first aim is to characterize the possible stimulus selectivity of pure alexia, whether only letter identification is affected, or if digit recognition is compromised also. Although letters and digits are visually similar and may be grouped as ‘‘alphanumeric symbols,’’ reading of either letters or digits can be selectively affected following damage to more central (i.e., nonperceptual) reading processes (Anderson et al. 1990; Cipolotti 1995; Starrfelt 2007). There is also behavioral evidence that letters and numbers are processed differently (Hamilton et al. 2006). A line of studies by Polk and Farah (1995, 1998) and Polk et al. (2002) has suggested that a dissociation between reading of letters and digits might also arise in the visual domain, but this suggestion has so far not been tested with patients. In addition, word-specific accounts (Gaillard et al. 2006) imply that pure alexia is specific to
� 2009 The Authors This is an Open Access article distributed under the terms of the Creative Commons Attribution Non-Commercial License (http://creativecommons.org/licenses/by-nc/2.0/uk/) which permits unrestricted non-commercial use, distribution, and reproduction in any medium, provided the original work is properly cited.
alphabetical material (words and/or letters), and comparing performance with letters and digits seems to be a stringent test of this hypothesis. Our second aim is to investigate whether pure alexia can be attributed to an impairment in simultaneous perception, that is, whether our patients’ performance depends on the number of stimuli (one vs. many) in a display. Left posterior lesions may lead to deficits in simultaneous perception (Warrington and Rabin 1971), and the ventral type of simultanagnosia has been suggested as the cause of pure alexia (Farah 1990). However, not all patients with left posterior lesions have pure alexia (Binder and Mohr 1992; Leff et al. 2006), or deficits in simultaneous processing (Habekost and Starrfelt 2006) and the question of the relation between reading and simultaneous perception remains largely unresolved.
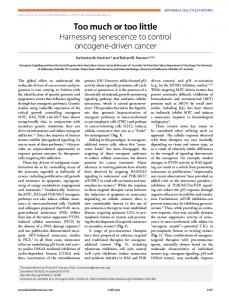
Visual Field Tests Three of the patients had static fields measured using the automated Humphrey field analyzer II (Carl Zeiss Group, CA) analysis of the central 10 degrees of vision (central 10-2 threshold test), as part of a previous experiment. We used a brief computerized binocular perimetry test to check the status of the patients’ visual fields at the time of the current experimental investigation, using a program developed by Kasten et al. (1998). This confirmed that patient TJ had normal light sensitivity in the entire visual field (he correctly responded to 125/125 stimuli). The other 3 patients’ perimetry remained unchanged so the more sensitive 10 degree fields are reported and are shown in Figure 1. JH has an incongruous, horizontal, homonymous sectoranopia with 2 degrees of sparing in the lower field of the better (right) eye. JT has a homonymous, predominantly upper, hemianopia with 8 degrees of sparing in the lower field. BA has a complete macular splitting homonymous hemianopia. NT (hemianopic control patient) has a homonymous, upper, quadrantopia that encroaches into parafoveal but not foveal vision.
Methods
Magnetic Resonance Imaging Brain Scans A single T1 weighted magnetic resonance imaging (MRI) brain scan was obtained for each subject. 1.5-T scanners were used at 2 different locations, both protocols collected data in 1-mm3 isotropic voxels. In order to produce a lesion overlap map, the images were spatially normalized using SPM5 software (http://fil.ion.ucl.ac.uk/spm). The unified segmentation algorithm was chosen as this has the best performance for lesioned brains (Crinion et al. 2007). After spatial normalization, the resultant images were imported into another software package, MRIcro (http://www.psychology.nottingham.ac.uk/staff/cr1/ mricro.html), for lesion identification. Lesions were outlined by eye by
Subjects Four patients with pure alexia participated in this investigation; all had English as their first language. Demographic and basic neuropsychological measures are presented in Table 1. None of the patients had any history of dyslexia, visual problems, psychiatric or neurological disease prior to their stroke/intracerebral hemorrhage, and all had normal or corrected to normal central visual acuity at the time of the investigation. In the background tests of reading, picture recognition, and auditory span, 6 control subjects were tested (3 female). Their mean age was 61 years (standard deviation, SD = 14). All had English as their first language. In the experimental tasks, 10 control subjects were tested (5 female), of whom 5 were British and 5 Danish. For this experimental control group, the mean age was 55 (SD = 11). None of the controls had any history of dyslexia, visual problems, psychiatric or neurological disease, and all had normal or corrected to normal vision. All control subjects were fully right handed, as assessed with the Edinburgh Handedness Inventory (mean LQ = + 100, Oldfield, 1971). To control for the nonspecific effects of a left posterior stroke on the experimental variables, we also include previously published data from a patient (NT) with a ventral left posterior stroke but who did not have pure alexia. Instead, he suffered from a mild form of hemianopic alexia. Background data as well as NT’s pattern of performance on tests of reading and visual perception and attention are described in detail in an earlier publication (Habekost and Starrfelt 2006). NT’s scores, as compared with a group of normal controls matched to him for age and education, will be presented for comparison where the relevant data are available. Each subject gave informed consent to participate in the study that was approved by an NHS local research ethics committee (Royal Free Hospital). The Danish controls tested in the experimental investigation provided written informed consent according to the Helsinki Declaration to participate in the study and approval was given by ethical committees in Copenhagen (project no. KF 01-258988).
Table 1 Background data for patients TJ
JT
BA
JH
Age 66 52 52 32 Education 3 0 6 8 Handedness þ100 þ100 þ100 �60 WASI-2 IQ 123 96 95 117 1.5 years 5.5 years 7.3 years 3.3 years Time since injury Etiology Infarct Infarct Intrahemispheric hematoma Intracerebral hemorrhage caused by head Injury caused by AVM Note: Education refers to years of schooling after primary education. Handedness was assessed with Edinburgh Handedness Inventory (Oldfield 1971). Note that patient JH is left handed. WASI IQ is based on the 2-subtest form (Wechsler 1999).
Figure 1. Ten degree static perimetry is shown for the 3 patients with visual field defects. JT top, BA middle, and JH bottom. Left eye fields on the left.
Cerebral Cortex December 2009, V 19 N 12 2881
one of us (APL), transformed into binary images and then overlaid on the single-subject canonical brain image available in SPM5. The resultant image was displayed at the mean coordinates for the VWFA as estimated by a meta-analysis of 27 functional imaging data sets (Jobard et al. 2003); see Figure 2. The only lesioned voxels common to all 4 patients are at the junction between the mid and posterior portion of the left fusiform gyrus, corresponding to the putative VWFA. NT’s images have been published (see Habekost and Starrfelt 2006). He suffered a primary intracerebral hemorrhage that damaged the inferior and lateral part of the occipital lobe, with some extension into the posterior part of the temporal lobe. The lesion centers on the inferior and fourth occipital gyri (O3, O4), with the lingual gyrus (O5) and striate cortex (V1) spared. More anteriorly, the medial part of the posterior portion of the fusiform gyrus is just affected. The voxel at the center of the lesion overlap in the 4 pure alexic patients (–44 –58 –15, see Figure 2) is spared in NT; indeed, working posteriorly from this coordinate, the lesion does not appear until y = –78 (2 cm posterior to this point). Statistical Analysis To statistically compare patient performance in the behavioral and experimental tests with the control groups, we used 2 strategies. First, we compared the group of patients with the group of controls using independent samples t-tests as implemented in the SPSS software package (version 15.0). Second, to analyze individual patients’ scores compared with the control group, we used a test devised by Crawford and Garthwaite (2002) and the accompanying software. Crawford and Garthwaite’s test is based on the t-distribution rather than the standard normal distribution, which makes the test more appropriate for evaluating single-case results against control groups of limited size. The test has proven to be more statistically robust than the standard comparison to z-scores (see, e.g., Crawford and Garthwaite 2002) and has been used widely in neuropsychological single-case research. All reported P values are 1-tailed, unless otherwise specified. Background Behavioral Measures Reading and Writing We first established the patients’ reading deficit with a computerized word reading test, using a voice key attached to serial response box to
measure RTs. Words were 3, 5, and 7 letters in length (25 examples of each), matched for frequency. Mean frequencies (SD in parentheses) from Kucera and Francis (1967) for 3, 5, and 7 letters words were 99 (85), 101 (95), and 100 (54), respectively. All words were selected from Osswald et al. (2002, Appendix A). Words were presented centrally on a computer screen in 36 point Times New Roman (white letters on a black background), one at a time. Errors were recorded by the experimenter. The interval between response and presentation of the next stimulus was 2 s. Subjects were instructed to read the words as quickly and accurately as possible, and the initiation of a verbal response terminated the presentation of the words and triggered the voice key. A practice version with 10 trials was administered first. Writing ability was assessed with subtests 24--26 from the Comprehensive Aphasia Test (Swinburn et al. 2004). Object Naming and Object Decision Object recognition was tested with a computerized naming task and an object decision task. For naming, 40 black and white line drawings from the set of Snodgrass and Vanderwart (1980) were presented centrally on a computer screen. The pictures subtended 3--5� of visual angle and remained on screen until the subject made a response. Subjects were asked to name the pictures as quickly and accurately as possible. RTs from picture onset were measured with a voice key. The interval between response and presentation of the next stimulus was 2 s. A practice version with 6 pictures was administered before the actual task. For object decision, 40 black and white line drawings taken from the set of Snodgrass and Vanderwart (1980), and 40 nonobjects taken from the set of Lloyd Jones and Humphreys (1997) were presented centrally on a computer screen. Subjects were asked to decide if the stimulus represented a real object or a nonsense object. The nonobjects were chimeric line drawings of closed figures, constructed by exchanging single parts belonging to objects from the same category, which makes the discrimination between real objects and nonobjects quite demanding (see Gerlach et al. 2004). The pictures subtended 3--5� of visual angle and were presented until a response was made on a serial response box (index finger for real object, middle finger for nonobject). Subjects were instructed to respond as fast and as accurately as possible. A practice version with 16 stimuli was performed before the main task.
Figure 2. Lesion maps from all 4 pure alexic patients have been overlaid and superimposed on a canonical single-subject MRI brain scan in MNI space. The colored scale refers to the number of voxels in common across the patients, with yellow voxels being common to all 4. All axial slices containing yellow voxels are shown (total volume of 100% overlap 5 32 voxels or 256 mm3). The red crosshairs converge on the peak voxel identified in a meta-analysis as being at the center of the VWFA (�44 �58 �15). L 5 left.
2882 Visual Speed and Span in Pure Alexia
d
Starrfelt et al.
Auditory Digit and Letter Span As Experiment 2 involved testing the limits of subjects’ visual short-term memory, we wanted to test whether a general reduction of shortterm memory was present. We therefore tested the subjects’ short-term memory in a separate modality, audition, using both letters and digits (in separate blocks). All subjects received the digit version first. Stimuli were the same as in the following experiments; digits 0--9 and letters A--J. Sequences of 3--7 items (4 sequences in each condition) were read out, and the subject was asked to repeat the presented sequence. The items were presented approximately 1 per second, and the same item never appeared twice in the same sequence. Maximum total score in this test is 20 (4 sequences by 5 conditions). The maximum number of items repeated (maximum span = 7) was also scored. Measurement of Visual Processing Speed and Apprehension Span Mathematical modeling based on the TVA (Bundesen, 1990) enables performance on simple psychophysical tasks (single stimulus report, whole report, and partial report) to be analyzed into different functional components. The method is theoretically well founded, and the different parameters are clearly defined (Bundesen 1990; Bundesen et al. 2005). Two parameters are of special interest in the present investigation, the speed of visual processing C and the visual apprehension span K. In addition, the perceptual threshold t0 is measured, but this parameter is of less theoretical relevance here. In single stimulus report experiments, the speed of visual processing C and the perceptual threshold t0 can be measured. At each trial, a single stimulus (e.g., a letter) is presented and then backward masked, and this is repeated for many trials at varying exposure durations. Subjects are instructed to report what they see, responses are unspeeded. Thus, the main test results are based on accuracy of performance at different exposure durations rather than measurement of reaction times, and therefore naming latency does not affect test scores. Exposure times (x-axis) are plotted against mean identification scores (y-axis), that is, how many times, on average, the subject is able to correctly identify the stimulus. A maximum likelihood curve is fitted to the data and the 2 TVA parameters (t0 and C) are calculated from this. The t0 is an extrapolated value of where this curve crosses the xaxis; it is an estimation of the period of exposure time (usually 10--20 ms in normal subjects), at or below which the subject is unable to report any items. C—processing speed—is taken as the slope of the curve at this point, its units are in s–1 and it is best conceived of as a measure of efficiency of visual recognition (the rate at which, as exposure time increases, the subject is able to report the stimulus better). Whole report paradigms, where subjects have to report elements from a display of multiple, unrelated stimuli (usually 5) also allow for the estimation of K—the visual apprehension span. K is calculated from the estimated asymptote of the subject’s response data and corresponds to the maximum ability to perceive multiple items in one view. Only exposure durations below 200 ms are commonly used in whole report experiments, to prevent eye movements and serial encoding of items. If the stimulus display is not followed by a mask, the effective exposure duration is prolonged for several hundred ms (due to the visual afterimage), which is convenient for testing participants with relatively slow encoding rates. The prolongation of the effective exposure time can be modeled by TVA analysis (parameter l). For a graphical example of how the main parameters are calculated, see Figures 5 and 6. Note that in Figure 6, exposure durations up to 500 ms are shown. These represent an unmasked exposure duration of 200 ms + l. We used 2 experimental types in our investigation: single stimulus report with central presentation (Experiment 1) and whole report with peripheral presentation (Experiment 2), both with 2 types of stimuli: letters and digits. In order to make the stimulus sets as similar as possible, we chose to use only 10 letters as there are only 10 digits. To make the letters as easy to remember as possible, the first 10 letters of the alphabet were chosen. The stimuli were computer generated and did not conform to a canonical typefont. An efficient mask was generated by superimposing all letters and digits, as well as 2 mirror images (1 ‘‘flipped’’ across the horizontal axis, 1 across the vertical). The stimulus sets and the mask are shown in Figure 3. In both experiments, a printed version of the relevant stimulus set (letters or digits) was
Figure 3. Stimuli and mask used in Experiments 1 and 2. placed in front of the subjects. Before each session, they were encouraged to name the printed stimuli one by one, and the patients could name the letters and digits without making errors. Both experiments were conducted in a semidarkened room, and subjects were seated approximately 100 cm from a 19’’ CRT monitor capable of 150 refreshes/s (6.7-ms resolution). Experiment 1: Single Stimulus Report of Letters and Digits This experiment was designed to measure visual processing speed, C, and perceptual threshold, t0, for single letters or digits presented at the center of the visual field. Testing of letters and digits was performed in separate blocks. All subjects received 3 sessions with 2 blocks (letters and digits), in an ABBAAB design (digits first), interleaved with the other tests. To obtain highly reliable estimates of each TVA parameter, patients performed 288 repetitions for both the letter and digit version of the experiment, divided into 3 testing sessions (576 trials in total; in addition, 10 practice trials were included at the start of each session). For TJ, the number of trials in Experiment 1 was reduced to 264 3 2, because he also completed a second run of Experiment 2 in his right visual field. Controls performed either 288 or 360 repetitions per stimulus set. The first session included the same exposure durations for all subjects. In the second and third sessions, between 6 and 9 individual exposure durations were set to obtain the best TVA estimates, and these individually calibrated exposure durations ranged from 7 to 200 ms. Thus, subjects received a varying number of trials per exposure duration, and exposure durations varied between subjects but, importantly, this does not bias the TVA analysis. Within each testing block different exposure durations were chosen randomly from the individually set values, aiming to characterize the full performance span from floor to ceiling scores. In each trial, a single white letter or digit was chosen randomly from the set of 10 stimuli and flashed on a black background at the center of fixation. The stimulus was immediately followed by a white pattern mask, which remained on for 500 ms. Stimuli and mask subtended 1 3 1.5 degrees of visual angle. Participants were instructed to report the identity of the letter or digit only if ‘‘fairly certain.’’ Reports were unspeeded. To ensure central fixation before each trial, participants were required to focus on a centrally placed cross and indicate verbally when they were ready. Eye movements were monitored by the experimenter online. None of the subjects had any problems maintaining central fixation. The best-fitting TVA parameter values to the observed data of each participant were estimated by a maximum likelihood algorithm. The model fitting procedure was the same as in previous TVA-based patient studies (see Duncan et al. 1999; Kyllingsbaek 2006 for mathematical details), but improved by a new fitting algorithm that corrects the TVA estimates for the influence of guessing. Using this modeling procedure, the TVA parameters Ccentral and t0 were estimated (separately for letters and digits). For comparison, TVA estimates based on data from a single letter report task for patient NT and a group of age and education matched controls are also presented. These were based on a similar experiment using a slightly different stimulus set and modeling procedure (see Habekost and Starrfelt 2006 for details). Experiment 2: Whole Report of Letters and Digits This experiment was designed to measure the patients’ ability to perceive multiple independent stimuli at the same time. This corresponds to the TVA parameter K, the visual apprehension span. The K parameter is best estimated by whole report experiments in which multiple, typically 5, unrelated stimuli are shown for variable exposure durations (which also allows for estimation of the visual processing speed, C). In order to display many items without crowding effects, the stimuli were placed in the peripheral visual field (thus the C
Cerebral Cortex December 2009, V 19 N 12 2883
measure in this experiment is termed Cperipheral). Because of the visual field deficits evidenced by 3 of the patients, presentations were limited to the left side for these subjects. Central fixation was controlled in the same way as in Experiment 1; again there was no indication that any of the subjects had difficulties maintaining central fixation. Note that the exposure durations were too brief for eye movements to be conducted between stimulus onset and offset. TJ and 4 controls (mean age 65, range 59--69) also performed a version of this task with stimuli presented in the right visual field, after the other experiments were completed. In alternating test blocks either 5 letters or 5 digits were chosen from the stimulus sets used in Experiment 1, and presented on the screen for 30--200 ms followed by either a blank screen (so that the effective exposure duration was prolonged by a visual afterimage) or by 5 bright pattern masks presented for 500 ms. Stimulus selection was random without replacement, so that the same letter/digit would never appear twice in the same display. Stimuli were shown at 5 locations at the circumference of an imaginary circle with a radius of 5 degrees centered on fixation. Similar to Experiment 1, the instruction was to report, unspeeded, the items the subject was fairly certain of having seen. For each of the 5 exposure durations (30, 80, 200, 30 ms + afterimage, 200 ms + afterimage; randomly intermixed) 24 repetitions were performed (i.e., 120 trials for each of the 2 stimulus sets), divided into 2 testing blocks (60 trials in each). Five controls performed an additional 105 trials per stimulus set. Blocks were presented in an ABBA design (letters first). The data analysis was performed using the same TVA model fitting software as in Experiment 1. For each stimulus type 2 main parameters were estimated: visual apprehension span, K, and visual processing speed, Cperipheral (defined as the sum of the processing speeds at each of the 5 stimulus locations). The K parameter was estimated using noninteger values to improve the data fits. For example, a K value of 3.3 represents a probability mixture of visual short-term memory capacity at 3 and 4 elements, occurring with 70% and 30% probability, respectively. NT and a group of age and education matched controls were tested using a slightly different whole report paradigm (they were tested in both visual fields within the same testing block, the stimulus set was larger, and guessing was controlled for by instruction rather than analytically; see Habekost and Starrfelt 2006 for details), which means that the model parameters are not directly comparable between experiments. However, as NT’s scores were compared with a control group who performed the same experiment as him, the normality of his scores can be evaluated; the estimates of his K and Cperipheral for letters are therefore included.
Results Background Behavioral Measures Errors and mean RTs for patients and controls are presented in Table 2. Reading and Writing RTs to correctly named words, as well as reading errors, were analyzed. Three trials were excluded from analysis for JH, due to voice key error. Scores for individual patients and the control group are presented in Table 2, and an illustration of the RTs and word length effects is presented in Figure 3. The patient group mean RT of 1303 ms (SD = 277) was significantly different from the control group mean RT of 438 (SD = 43), t3.1 = –6.2, P = 0.004, and this difference was significant for all individual patients (see Table 2). On average, the patients error scores (mean = 6.3, SD = 5.7) did not differ significantly from controls (mean errors = 1.2, SD = 1.2, t3.2 = –1.8, n.s.). However, when compared individually, 2 patients made significantly more reading errors than controls (JT [14 errors] and TJ [7 errors], P < 0.01, Crawford and Garthwaite’s test). These errors were mainly omitting or misreading of ends of words. Especially for JT, there was a clear relationship between word 2884 Visual Speed and Span in Pure Alexia
d
Starrfelt et al.
Table 2 Results from the reading test, naming task, and object decision task, as well as the test of auditory letter and digit span for patients and controls (N 5 6)
Reading mean RT Reading errors Naming RT Naming errors Object decision RT Object decision errors Digit span—max Digit span—total Letter span—max Letter span—total
TJ
JT
BA
JH
Control mean (SD)
1388** 7** 1189** 1 1985** 8 6 16 5 10
912** 14** 1331** 3 1001 6* 5* 10 5 10
1351** 2 1732** 4 1226* 9 6 15 5 9
1562** 2 1168** 0 907 12 7 20 6 12
438 1.2 753 1.7 818 10.8 6.7 17.8 6.5 13.5
(43) (1.2) (91) (1.2) (176) (1.5) (0.82) (2.9) (0.84) (3.45)
Note: RTs reported in milliseconds. *P \ 0.05; **P \ 0.01, Crawford and Garthwaite’s test.
length and errors. He made no errors on 3-letter words, 5 errors on 5-letter words, and 9 errors on 7-letter words. The mean RTs (range 912--1562 ms) as well as the word length effects, suggest that all patients have fairly mild alexia, but perform within the range commonly reported in pure alexia (e.g., Behrmann, Plaut, and Nelson 1998). For comparison, patient NT had a mean RT on words 3--7 letters in length of 699 ms, significantly higher than his matched controls’ mean RT of 487 ms (SD = 39), P = 0.004, Crawford and Garthwaite’s test (Note that these data differ from the original publication, as words up to 12 letters were included in the original analysis. This also applies to his estimated word length effect (WLE) presented in the legend of Figure 4). All 4 patients had a significant word length effect (Figure 4); control patient NT also had a word length effect, but this was only 36 ms per letter, 4 times lower than the fastest of the pure alexic patients and well within the range of that reported for hemianopic alexia (Leff et al. 2001). In terms of their writing ability, all patients performed within the normal range. Raw scores (and T-scores in parentheses) were JH: 75 (65); TJ: 75 (65); BA 74 (64); and JT: 71 (60). This confirms that all 4 patients have alexia ‘‘without’’ agraphia, to use conventional neurological terminology, that is, pure alexia. Object Naming and Object Decision Errors and mean RTs on the object naming task for patients and controls are presented in Table 2. All 4r patients’ accuracy in the naming task was within the normal range, whereas their RTs were significantly elevated compared with the control group, both on a group level (patient mean RT = 1355 ms, SD = 262, control mean RT = 753, SD = 91, t8 = – 5.3, P < 0.001), and when compared individually (Table 2). For object decision, the overall error rate, as well as RTs to correctly categorized real objects, was analyzed (Table 2). On a group level, patients did not differ from controls with regards to accuracy (patient mean = 8.8, SD = 2.5; control mean = 10.8, SD = 1.5, t8 = 1.7, n.s.). Regarding RTs, the patient group mean of 1209 (SD = 355) differed significantly from the control mean RT of 818 (SD = 176, t8 = –2.3, P = 0.024). On an individual level, 1 patient (JT) made significantly ‘‘fewer’’ errors than controls in this task (2-tailed P = 0.016, Crawford and Garthwaite), whereas the other patients did not differ from controls with regards to accuracy. Two patients (TJ and BA) had mean RTs
Table 3 Results from Experiment 1
Single Single Single Single
letter Ccentral letter t0 central digit Ccentral digit t0 central
TJ
JT
BA
JH
Control mean (SD)
31** 25** 44** 25**
27** 31** 47** 26**
25** 17 29** 20*
22** 10 79* 15
117 13.0 119 11.9
(23) (3.1) (16) (2.8)
Note: Processing speed (Ccentral given in s�1) and perception threshold (t0, given in milliseconds) for single letters and digits presented at fixation for individual patients, and control group (N 5 9) mean results (SD in brackets). *P \ 0.05; **P \ 0.01 by Crawford and Garthwaite’s test.
Figure 4. Single-word reading speeds and word length effect for all 4 pure alexic patients and controls. The patients’ word length effects, as estimated by linear regression, were TJ: 212 ms per letter (r2 5 0.198, F(1, 66) 5 16.3, P \ 0.001); JT: 176 ms/letter (r2 5 0.356, F(1, 59) 5 32.5, P \ 0.001); BA: 201 ms/letter (r2 5 0.449, F(1, 71) 5 57.9, P \ 0.001); JH 146 ms/letter (r2 5 0.269, F(1, 68) 5 25.0, P \ 0.001). For comparison, NT’s word length effect was 36 ms/letter for words of 3--7 letters in length (r2 5 0.062, F(1,64) 5 4.25, P 5 0.043).
significantly slower than the control mean, whereas JT and JH had RTs within the normal range. Auditory Digit and Letter Span For digits, patients’ mean total score was 15.3 (SD = 4.1), not significantly different from the control group mean of 17.8 (SD = 2.9, t8 = 1.2, n.s.). The patients’ average maximum span was 6.0 (SD = 0.82), again not significantly different from the control mean of 6.7 (SD = 0.82, t8 = 1.3, n.s.). See Table 2 for individual scores. For letters, the patients’ average total score was 10.3 (SD = 1.26), not different from the control group mean of 13.5 (SD = 3.45, t8 = 1.8, n.s.). The patients’ average maximum span was 5.25 (SD = 0.50), which was reduced compared with the control mean of 6.5 (SD = 0.84, t8 = 2.7, P = 0.015). On an individual level, none of the patients’ scores differed significantly from the control group. Measurement of Visual Processing Speed and Apprehension Span Experiment 1: Single Stimulus Report of Letters and Digits Individual parameter estimates for patients, as well as control group mean scores, are presented in Table 3. The model fits were close, correlating on average 98.1% with the observed data. See Figure 5 for a graphical comparison of a representative patient (TJ) and a control subject. One control subject was excluded from this analysis, based on Chauvenet’s criterion (Barnett and Lewis 1994) because his Ccentral scores for letters and numbers were significantly superior to the rest of the controls. His scores deviated from the control group mean (including his own data) by 2.35 SDs for letters, and 2.61 SDs for digits. For single letters, the patient group’s mean processing speed (Ccentral = 26, SD = 4) was significantly reduced compared to control performance (Ccentral = 117, SD = 23, t11 = 7.5, P