Feb 21, 2013 - Over the past two decades, the concept of sustainable diets has evolved .... energy through use of fossil fuels (coal, oil, gas) to power cars, factories, and ..... Today, in the U.S. more than half of the calcium and vitamin D that Americans get ..... Boyle J, Thompson T, Gregg E, Barker L and Williamson D (2010) ...
CONFIDENTIAL 1 2 3 4 5 6 7 8 9 10 11 12 13 14 15 16 17 18 19 20 21 22 23 24
INTERNAL USE ONLY
2-21-13
Towards a Sustainable Dairy Sector: Leadership in Sustainable Nutrition Gregory D. Miller and Nancy Auestad Dairy Research Institute, Rosemont, IL 60018
Running Headline: Dairy and sustainability
Accepted for Publication in International Journal of Dairy Technology Confidential Copy Internal Use Only
1
CONFIDENTIAL 25 26
INTERNAL USE ONLY
2-21-13
ABSTRACT
27
As the global population continues to expand, access to sustainable diets that are
28
nutritionally adequate and healthy, affordable, and respectful of biodiversity and
29
ecosystems will be critical for the health of future generations. Nutrient-rich dairy products
30
as part of a healthy diet play an important role in helping meet nutrient recommendations
31
not easily met with other foods and can help lower risk of certain chronic diseases. The
32
dairy industry worldwide is working across public and private sectors to continue to
33
provide nutritious, affordable, culturally appealing dairy products while optimizing natural
34
resource use and reducing environmental impacts.
35 36
Key Words: dairy, sustainability, sustainable diet, nutrition, population growth,
37
nutrient rich
38
2
CONFIDENTIAL 39 40
INTERNAL USE ONLY
2-21-13
INTRODUCTION Global population growth, projected to reach over 9 billion by 2050, will continue
41
to drive demand for healthy, affordable food to sustain the health of future generations
42
(Agricultural Development Economics Division of Economic and Social Development
43
Department 2011). Advancements in agricultural and food systems in the face of limited
44
natural resources, environmental and economic challenges and widely varying social
45
systems globally are needed to meet future demands for food (Committee on Twenty-First
46
Century Systems Agriculture and National Research Council 2010). Nutritionally adequate
47
diets are essential for normal growth and development and for mitigating risk of both
48
communicable and non-communicable (chronic) diseases (US Department of Agriculture
49
and US Department of Health and Human Services 2010). The prevailing obesity epidemic
50
and issues of hunger and malnutrition across the globe make it critical that future
51
agriculture and food systems not only deliver more food, but more foods of sufficient
52
nutritional quality to sustain a healthy population globally.
53
Over the past two decades, the concept of sustainable diets has evolved
54
(Burlingame and Dernini 2012). While there is no universally accepted definition of a
55
sustainable diet, the Food and Agriculture Organization (FAO) of the United Nations and
56
Biodiversity International proposed a definition of sustainable diets as, “… those diets with
57
low environmental impacts which contribute to food and nutrition security and to healthy
58
life for present and future generations (Burlingame and Dernini 2012). Sustainable diets
59
are protective and respectful of biodiversity and ecosystems, culturally acceptable,
60
accessible, economically fair and affordable; nutritionally adequate, safe, and healthy;
61
while optimizing natural and human resources” (Burlingame and Dernini 2012). This
3
CONFIDENTIAL
INTERNAL USE ONLY
62
definition encompasses a multi-dimensional framework that recognizes that human health
63
and ecosystems are not independent of one another.
2-21-13
64
Across the dairy industry globally, dairy farmers, dairy processors, retailers and
65
others are working together so they can continue to provide products that are nutritious,
66
economically viable and produced responsibly (The Global Dairy Agenda for Action
67
2012). For the dairy industry, sustainability means providing consumers with the nutritious
68
dairy products they want, in a way that is economically viable, environmentally sound, and
69
socially responsible - now and for future generations.
70
This paper reviews the dairy industry’s initiatives in the global challenges of
71
population growth and climate change, the vital role of dairy foods as part of a healthy,
72
sustainable diet and limitations of current research on environmental impacts of foods and
73
diets in relation to developing dietary guidance for sustainable diets.
74 75 76
GLOBAL CHALLENGES Global population growth and climate change will continue to be at the forefront of
77
concerns about future human health and the sustainability of the planet. The global
78
population is projected to increase from 7 billion today to more than 9 billion by 2050 with
79
considerable growth in urban development expected (Agricultural Development
80
Economics Division of Economic and Social Development Department 2011). The FAO
81
estimates that to keep pace with projected population growth, a 70% increase in food
82
production will be needed by 2050 (FAO 2009). Not only will more food be needed, but
83
sufficient amounts of high quality, nutrient-rich foods will be essential for a healthy
84
population.
4
CONFIDENTIAL
INTERNAL USE ONLY
2-21-13
85
Nutrition and health issues from hunger and malnutrition and the rising prevalence
86
of chronic diseases across the globe are significant. Over the past several decades, the rise
87
in the coexistence of hunger, malnutrition and chronic disease is especially concerning in
88
light of expected population growth. The 2004 World Health Organization report, “Global
89
Strategy on Diet, Physical Activity and Health,” stated that unhealthy diets and physical
90
inactivity are among the leading causes of the major non-communicable, chronic diseases,
91
including cardiovascular disease, type 2 diabetes and certain types of cancer, contributing
92
substantially to the global burden of disease, death and disability (World Health
93
Organization 2004). Six of every ten deaths globally are due to non-communicable
94
diseases, three are due to communicable, reproductive and nutritional conditions largely in
95
poorer populations and one to injuries (World Health Organization 2008). Leading causes
96
of death by 2030 are projected to be heart disease, cerebrovascular disease (stroke),
97
chronic obstructive pulmonary disease and lower respiratory infections, mainly pneumonia
98
(World Health Organization 2008).
99
Social and economic development worldwide has led to an increased demand for
100
energy (e.g., for housing, transportation, etc.), which has resulted in growing concerns
101
about climate change, in particular greenhouse gas (GHG) emissions. The demand for
102
energy through use of fossil fuels (coal, oil, gas) to power cars, factories, and power plants
103
and provide heat and electricity to homes and other places of business has increased
104
substantially over the past 150 years (Intergovernmental Panel on Climate Change 2011).
105
GHG emissions also are formed in agricultural production and released from waste in
106
landfills. Options for meeting future demand for global energy, while lowering GHG
107
emissions from reliance on fossil fuels, include energy conservation measures, renewable
5
CONFIDENTIAL
INTERNAL USE ONLY
2-21-13
108
energy and carbon capture and storage. Multinational programs to reduce GHG emissions
109
are in progress across all sectors, including the dairy value chain.
110 111 112
DAIRY INNOVATION The dairy industry has had an impressive record of increasing productivity that has
113
led to relatively affordable food for the population and increases in agricultural exports
114
(Committee on Twenty-First Century Systems Agriculture and National Research Council
115
2010). Farmers worldwide face the challenge of producing more food for the expanding
116
population while also addressing climate change, increasing production costs, limited
117
natural resources and impacts on environmental and ecosystems. Future agricultural
118
systems will evolve from an expanding knowledge base and the availability of affordable
119
technologies to improve food production, enhance natural resource management and
120
support the health of the population while minimizing environmental impacts (US
121
Department of Agriculture 2012).
122
Innovation to reduce the environmental impact of agricultural production while
123
optimizing use of natural resources will need to continue beyond the successes already
124
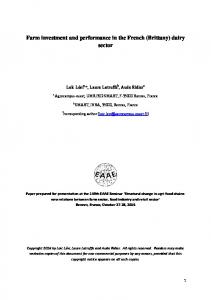
achieved (FAO 2012). In the US, for example, over the past 60 years dairy farmers
125
significantly enhanced agricultural productivity while concurrently reducing environmental
126
impacts and reliance on natural resources. Milk yield per cow increased more than 4-fold
127
between 1944 and 2007, while using 90% less land, 65% less water, producing 75% less
128
manure and leaving a 63% smaller carbon footprint per gallon of milk (Capper et al. 2009).
129
In addition, over this period, milk production per cow increased 280 pounds per year, more
6
CONFIDENTIAL
INTERNAL USE ONLY
130
than a ten-fold greater rate of increase in productivity than the world’s average per cow of
131
21 pounds per year (Figure 1).
132
Global Dairy Agenda for Action
133
2-21-13
Recognizing the need for new technologies to produce more from fewer resources,
134
the global dairy industry continues to evolve science and technology in ways to advance
135
environmentally sustainable and socially responsible dairy production. The Global Dairy
136
Agenda for Action, which was developed with input from across the global dairy supply
137
chain and from a wide range of dairy producing countries, was signed in 2009 at the World
138
Dairy Summit in Berlin (The Global Dairy Agenda for Action 2012). The participants
139
recognized the need to raise awareness on the role of dairy production in climate change,
140
as well as the contribution of dairy farming and dairy products to global nutritional, social
141
and economic well-being. A wide range of dairy farming and industry organizations,
142
national and regional dairy associations, and companies from throughout the dairy supply
143
chain are actively working to improve the environmental performance of the dairy sector.
144
Progress continues as the dairy supply chain works with other stakeholders on key
145
objectives. Initiatives to address climate change concerns have been launched around the
146
world, and the Green Paper catalogues initiatives and progress through a multitude of case
147
studies globally (The Global Dairy Agenda for Action 2012). The Green Paper has over
148
400 initiatives under six primary areas: emission reductions, energy efficiency, transport
149
efficiency, reduction in loss of milk and milk products, resource efficiency and life cycle
150
analysis and management. For example, the United Kingdom/Dairy Supply Chain Forum
151
has developed a dairy road map and agricultural greenhouse gas action plan targeting a 20-
152
30% voluntary, reduction in GHG from dairy farms by 2030; other national and corporate
7
CONFIDENTIAL
INTERNAL USE ONLY
153
GHG sustainability strategies include similar voluntary GHG reduction targets. Other
154
examples include initiatives for soil management improvement in Australia, manure
155
management in the US and Great Britain, and energy efficiency both on-farm and in
156
processing in Mexico, Japan and the US.
157
Dairy sustainability measurement and reporting
158
2-21-13
In the US progress against a voluntary, industry-wide goal to reduce GHG emissions
159
for fluid milk by 25 percent by 2020 against a 2007/2008 baseline continues to be made.
160
Life Cycle Assessment (LCA) methodology, the most recognized and widely used approach
161
to analyze a product’s environmental impacts through the entire life cycle of the product,
162
was used to determine GHG emissions as well as other environmental impacts across the
163
dairy value chain (Finkbeiner et al. 2006). Primary data was collected from 536 farms, 50
164
processing plants and 210,000 round trips transporting milk from farm to processor
165
(Innovation Center for US Dairy 2011). Benchmarks of GHG emissions, water and other
166
environmental impacts from the farm to the consumer are the baseline from which
167
mitigation targets and measured improvements are made.
168
The US dairy industry accounts for approximately two percent of GHG emissions in
169
the US and 90% of the US dairy industry GHG footprint is explained by about 20 variables
170
(Innovation Center for U.S. Dairy, 2011). On farm management practices are more
171
significant than factors such as farm size, region or type of business, and opportunities for
172
improvement exist across the entire dairy supply chain. Impacts from fuel and electricity,
173
for example, span across all stages of the supply chain.
174 175
The Sustainability Measurement and Reporting Framework, developed by the Innovation Center for U.S. Dairy, supports industry-wide initiatives to assess, measure,
8
CONFIDENTIAL
INTERNAL USE ONLY
2-21-13
176
mitigate and communicate progress against commitments to reduce dairy’s environmental
177
impacts (Innovation Center for U.S. Dairy, 2011). Resources are being developed and
178
becoming available to help farmers and businesses across the supply chain in the private
179
sector to improve and communicate about the sustainability of dairy products (Innovation
180
Center for US Dairy 2012). These resources also provide retailers, consumers, scientists and
181
policy makers with consistent and credible information.
182
Roadmap to mitigate GHG emissions
183
From milk production on the farm through consumption by consumers, the dairy
184
industry is working to both optimize use of natural resources and reduce environmental
185
impacts. Opportunities to reduce dairy’s carbon footprint identified in the GHG Life Cycle
186
Assessment for fluid milk in the US include nutrient management practices, modifying
187
feeding rations, manure management, energy efficiency, improved packaging formats, new
188
processing technologies and fuel efficiency. Case studies and best practices can be found
189
on USDairy.com/sustainability (Innovation Center for US Dairy) as well as the Green
190
Paper at the Global Dairy Agenda for Action website (The Global Dairy Agenda for
191
Action 2012). Programs already in place in the US are exemplified as follows:
192
Energy Management Best Practices
193
The Farm Energy Efficiency™ program promotes the adoption of existing best
194
practices with a focus on reducing on-farm energy use and costs. GHG emissions could be
195
reduced by as much as 700 metric tons with the added benefit of energy cost savings to
196
farms. Partnerships and multi-stakeholder collaborations foster a combination of energy
197
education and outreach, on-farm energy audits and energy-efficient farm operations. The
198
Dairy Plant Smart™ program is designed to increase energy management at fluid milk
9
CONFIDENTIAL
INTERNAL USE ONLY
2-21-13
199
processing plants and identify and adopt reduced-temperature cleaning technologies. A
200
carbon calculator for milk processing plants is available at www.USDairy.com/PlantSmart.
201
Users can benchmark their footprint against national averages, set goals, and implement
202
best practices.
203
Energy Management Next Practices
204
The Next Generation Cleaning™ initiative is designed to identify and adopt
205
reduced-temperature cleaning technologies. In addition, many low-cost improvements can
206
be made to existing equipment in processing plants and the fleets that transport milk.
207
Energy management updates can improve system reliability, avoid maintenance and
208
shutdown costs, increase productivity and add new revenue streams. In addition to energy
209
efficiency, best practices to reduce GHG emissions include cogeneration and alternative
210
energy sources, such as solar and wind.
211
Dairy Distribution Best Practice
212
The Dairy Fleet Smart™ program is designed to accelerate adoption of
213
management practices that reduce fuel consumption, costs and GHG emissions in the
214
transport and distribution of milk. A Dairy Fleet Smart tool to calculate a fleet’s carbon
215
footprint, set continuous improvement goals and realize transportation efficiencies is
216
available at http://www.USDairy.com/Fleetsmart.
217
Enteric and Manure Management Next Practices
218
The Dairy Power™/Biogas Capture and Transport™ initiative fosters development
219
of new business models to remove barriers for adoption of new practices. Dairy cows are
220
one of the most dependable sources of renewable energy, and with anaerobic manure
221
digester technology farms can recover methane gas for use as renewable energy and transit
10
CONFIDENTIAL
INTERNAL USE ONLY
2-21-13
222
fuel. The methane produced by cow manure is converted into biogas for use both on and
223
off the farm. Manure digester systems can help reduce on farm energy costs and can also
224
provide communities with a renewable energy source, with opportunities for farmers to sell
225
the energy for additional revenue. The Cow of the Future™ project is designed to identify
226
ways to reduce enteric methane emissions from dairy cattle by improving breeding,
227
nutrition, and cow health. The project portfolio includes research for future innovations
228
and improvements to produce even more milk with less impact on the environment.
229 230 231
MISPERCEPTIONS ABOUT EFFICIENCY OF THE DAIRY COW Dairy cows are extremely efficient at converting human-inedible plant material into
232
high-quality milk and are net contributors to the human food supply (Oltjen and Beckett
233
1996). However, misperceptions that dairy farming is an inefficient use of natural
234
resources are pervasive. Dairy cows can digest cell-wall-rich plant material, including
235
grass, straw, and by-products. The nutrients in by-products that otherwise are a waste
236
disposal problem are used to produce milk and milk products as part of the human food
237
supply. In addition, land that is too poor or too erodible for crops can be productive with
238
grazing ruminants.
239
Dairy cows eat mainly roughage (grass, hay, silage, and by-products of the food
240
and biofuel industries) and to varying extents concentrates, which help to maximize milk
241
production. Concentrates are composed of varying amounts of both human-edible (e.g.
242
corn grain, wheat, or barley) and inedible ingredients (e.g. almond hulls, citrus pulp, corn,
243
gluten meal). Humans typically consume only the seed (e.g. corn kernel) where dairy cows
244
can consume and extract nutrients from the entire plant (e.g. corn silage). Even with the
11
CONFIDENTIAL
INTERNAL USE ONLY
245
many different types of dairy farming systems, by-products from human food production
246
are fed to dairy cattle in all parts of the world regardless of farm size (Oltjen and Beckett
247
1996).
248
2-21-13
The efficiency of animal production in converting human-inedible plant material
249
into human consumable energy and protein is informative for comparisons (Wilkinson
250
2011). When efficiencies of nutrient conversion (e.g. energy and protein) are calculated on
251
a human-edible basis, dairy clearly adds to the total human food supply primarily as a
252
result of the conversion of human-inedible inputs into human-edible milk (Wilkinson
253
2011; Gill et al. 2010; Council for Agricultural Science and Technology (CAST) 1999).
254
Conservative estimates for the maximum return on the human-edible fraction in cow’s
255
feed, based on 1996 estimates in the US, are 128% for energy and 276% for protein for
256
human consumption. Other benefits of including livestock on farms include nutrient
257
recycling through soil application of manure, improved living standards on family farms
258
and employment opportunities in rural areas.
259 260 261
DAIRY, A VITAL PART OF A HEALTHY, AFFORDABLE, SUSTAINABLE DIET The future health of the population worldwide will depend on nutritious, healthy,
262
affordable diets that not only serve to achieve nutrient adequacy and are safe, but also are
263
culturally and socially appealing across the many diverse populations worldwide.
264
Population health is an important prerequisite for building and maintaining healthy,
265
sustainable communities.
266
Dairy consumption falls short of recommendations in many countries.
12
CONFIDENTIAL 267
INTERNAL USE ONLY
2-21-13
While current dairy consumption and dietary recommendations vary greatly across
268
countries globally, many populations today fall short of recommended intakes. The 2009
269
European Health and Nutrition Report, which covers sixteen European Union countries
270
over the years from 1993 to 2006, reported average dairy consumption at 266 g per day
271
(European Nutrition and Health Report (2009)). Dairy intakes were highest in the Nordic
272
countries of Denmark, Finland, Norway and Sweden and lowest in Austria. In Ireland, only
273
19% of adults consume the recommended 3 daily servings of milk, cheese and yogurt
274
(Morgan et al. 2008). In Switzerland, only 10% of the population consumes the
275
recommended 3 portions of milk and milk products (Eichholzer et al. 2010).
276
In Canada, about one-third of children 4 to 9 years old do not consume the
277
recommended servings of dairy, and this gap increases as children reach adulthood
278
(Statistics Canada 2006). For children 10-16 years old, 61% of boys and 83% of girls do
279
not consume the recommended 3-4 daily servings, and for adults 31 years and older, 65-
280
84% do not consume 3 daily servings of dairy foods. In the US, only 4% of men and 12%
281
of women consume the recommended 3 daily servings (Krebs-Smith et al. 2010). With the
282
exception of 9-13 year old girls, 90-95% of all females and 75-90% of adult men fall short
283
of the recommended 3 daily servings of milk and milk products. In the U.S., the average
284
1.7 dairy servings per day for everyone 2 years and older is only about half of the
285
recommended 3 servings per day (Dairy Research Institute® 2009).
286
In China, milk consumption among children and adolescents has increased from
287
about 3% in 1991 to 14% (Du et al. 2010). While average milk consumption has increased
288
from 3.9 g per day in 1991 to 26 g per day in 2006, this is much lower than the Chinese
289
dietary guidance of 300 g per day of dairy.
13
CONFIDENTIAL 290 291
INTERNAL USE ONLY
Diets fall short of nutrient recommendations Similarly, many populations worldwide fall short of recommended nutrient intakes.
292
Calcium, potassium, magnesium, vitamin D (where dairy products are fortified), vitamin
293
B12, iodine and protein are nutrients that are often under-consumed around the globe.
294
2-21-13
In the US, for example, current intakes of calcium, vitamin D, potassium and fiber
295
are low enough to be designated nutrients of public health concern, meaning current
296
intakes are inadequate and linked to indicators of nutrient inadequacy or disease prevalence
297
(Dietary Guidelines Advisory Committee 2010). Dietary intakes of calcium, vitamin D,
298
potassium and fiber are at 75%, 28%, 56% and 40%, respectively, of recommended intakes
299
(US Department of Agriculture and US Department of Health and Human Services 2010).
300
The dairy group is an important food source of three of these nutrients – calcium, vitamin
301
D and potassium in the diet of Americans.
302
Dairy is a key source of nutrients and can fill nutrient gaps
303
Today, in the U.S. more than half of the calcium and vitamin D that Americans get
304
from all of the foods they eat is from consumption of dairy foods – even at current average
305
intakes of 1.7 dairy servings for people 2 years and older . In fact, milk is the number one
306
food source of calcium, vitamin D and potassium in the American diet. Additionally, about
307
one-fourth of the vitamin A, vitamin B12, phosphorus and riboflavin come from dairy
308
(Figure 2).
309
Adding one more cup of milk or yogurt each day could not only help achieve the
310
recommended 3 dairy servings per day, but can help close nutrient gaps especially for the
311
three nutrients of public health concern (Fulgoni et al. 2011). By adding a cup of milk or
14
CONFIDENTIAL
INTERNAL USE ONLY
312
vitamin D fortified yogurt, calcium recommendations could be met and vitamin D and
313
potassium intakes could be increased by at least 44 and 11 percent, respectively.
314
Nutrient gaps can widen without dairy
315
2-21-13
Removing dairy foods from the diet will result in even further drops in the intake of
316
essential nutrients, such as calcium, vitamin D, potassium, vitamin A and choline (Fulgoni
317
et al. 2011). It’s not easy to replace dairy’s nutrients with other foods.
318
Foods typically recommended as dairy substitutes, based on their calcium content,
319
include fortified soy-based beverages, calcium-fortified juices, bony fish, and dark leafy
320
greens such as collard greens, kale, turnip greens and spinach (Dietary Guidelines
321
Advisory Committee 2010). A diet modeling study based on national diet survey data in
322
the US showed that if dairy was replaced with a dairy composite of these milk alternatives,
323
calcium intakes could be matched, but intakes of the other essential nutrients in milk would
324
be lower (Fulgoni et al. 2011). These dairy alternatives are not widely consumed, and
325
significant dietary changes would be needed to meet nutrient recommendations without
326
dairy. It is challenging for people, even those with nutritional knowledge, to develop eating
327
plans that replace the nutrients from dairy foods when dairy foods are not consumed.
328
In addition, according to the U.S. 2010 Dietary Guidelines Advisory Committee,
329
“… the amount of many potential alternatives to provide sufficient calcium would provide
330
too many calories and/or be a large amount to consume daily. In addition, the question of
331
bioavailability of the calcium in vegetable products has not been addressed and could pose
332
a concern” (Dietary Guidelines Advisory Committee 2010). The cost of these substitute
333
foods relative to dairy foods should also be considered.
15
CONFIDENTIAL 334
INTERNAL USE ONLY
2-21-13
The bioavailability of nutrients can be impacted by other components of foods that
335
inhibit absorption, and the body’s ability to absorb calcium is lower for some plant-based
336
sources (Hunt 2003; Michaelsen et al. 2009). Phytates, which are compounds that are
337
found in plant foods, can negatively impact the bioavailability of certain micronutrients
338
including calcium. In populations with primarily plant-based diets, common in low-income
339
countries, these compounds can have a negative impact on nutrient adequacy (Gibson et al.
340
2010). Animal foods, including dairy products, not only are excellent sources of many
341
micronutrients but contain few components that inhibit the bioavailability of the nutrients
342
they provide.
343
Higher dairy intakes linked to lower risk of non-communicable, chronic disease
344
A 2003 World Health Organization (WHO) report entitled, Diet, Nutrition and
345
Prevention of Chronic Disease, stated, “Nutrition is coming to the fore as a major
346
modifiable determinant of chronic disease”(World Health Organization 2003). A
347
subsequent 2004 WHO report further noted that unhealthy diets and physical inactivity are
348
among the leading causes of the major chronic diseases and contribute substantially to the
349
global burden of disease, death and disability (World Health Organization 2004). In the US
350
alone, if current trends are not reversed the prevalence of total diabetes, including
351
undiagnosed cases, could increase from the current 10% to between 20% and 33% of the
352
population by 2050 (Boyle et al. 2010). A healthy dietary pattern based on nutrient-rich
353
foods, including low-fat and fat-free dairy products, fruits, vegetables, whole grains and
354
lean proteins consumed in recommended amounts is important for reducing the risk of
355
chronic disease.
16
CONFIDENTIAL 356
INTERNAL USE ONLY
2-21-13
Evidence continues to mount that higher consumption of dairy products is
357
associated with lower risk for developing chronic diseases including cardiovascular
358
disease, type 2 diabetes and hypertension. The 2010 Dietary Guidelines for Americans
359
recognizes that dairy intake is linked to improved bone health, especially in children and
360
adolescents, and “is associated with a reduced risk of cardiovascular disease and type 2
361
diabetes and with lower blood pressure in adults” (US Department of Agriculture and US
362
Department of Health and Human Services 2010). Since these guidelines were issued,
363
more than seventeen observational studies and/or meta-analyses that further reinforce the
364
role of dairy consumption on reducing risk for cardiovascular disease, elevated blood
365
pressure, metabolic syndrome, or type 2 diabetes have been published (Bonthuis et al.
366
2010; Dalmeijer et al. 2012; de Oliveira Otto et al. 2012; Fumeron et al. 2011; Grantham
367
et al. 2012; Larsson et al. 2012; Malik et al. 2011; Margolis et al. 2011; Ralston et al.
368
2012; Sluijs et al. 2012; Soedamah-Muthu et al. 2011; Soedamah-Muthu et al. 2012;
369
Sonestedt et al. 2011; Struijk et al. 2012; Tong et al. 2011; van Meijl and Mensink 2011;
370
Warensjo et al. 2010)
371
Higher dairy intake linked to health care cost savings
372
Health benefits of higher dairy consumption translate into health care cost savings,
373
which then can lead to a lower economic burden on health care systems. A review of
374
nearly one hundred studies in 2004 concluded that increasing dairy consumption in the US
375
to 3 to 4 servings per day could lower risk of chronic diseases, including cardiovascular
376
disease, type 2 diabetes and hypertension (McCarron and Heaney 2004). When translated
377
to potential health care cost savings, this study found that 3 to 4 servings of dairy could
378
result in savings of more than 200 billion dollars over a five year timeframe. The
17
CONFIDENTIAL
INTERNAL USE ONLY
379
magnitude of potential health care cost savings today could be significantly greater when
380
considering inflation over the past decade. A more recent study from Australia estimated
381
direct health care expenditures and the burden of disease attributable to low consumption
382
of dairy products, and similarly concluded that increasing consumption of dairy foods to
383
recommended amounts could lead to substantial improvements in health and lower costs
384
for health care services (Doidge et al. 2012).
385
Dairy is affordable nutrition
386
2-21-13
Dairy products are an affordable way to help meet daily nutrient recommendations
387
(Figure 3). In the US, at about $0.26 per serving, milk and milk products cost less per
388
serving than meat, poultry and fish, fruit, vegetables; similar to dry beans, legumes, nuts;
389
and scarcely more than eggs, grains, and sugars, sweets, and other beverages (Drewnowski
390
2010). Cost analyses also have shown that milk and milk products are by far the lowest-
391
cost source of dietary calcium and among the lowest-cost sources of riboflavin and vitamin
392
B12 in the diet (Drewnowski 2010).
393 394 395
ENVIRONMENTAL IMPACTS OF FOODS AND DIET PATTERNS Research on the environmental impact of foods and diets is beginning to emerge,
396
but is still scant and inconclusive. The limited number of studies together with
397
inconsistencies in the methodologies used to measure environmental impacts, the absence
398
of a standardized environmental impact database for foods and differences in study
399
designs, which limit comparisons across studies, are among the shortcomings of the
400
existing research.
18
CONFIDENTIAL 401
INTERNAL USE ONLY
2-21-13
Five of the published studies examined the impact of individual food items on
402
GHG emissions, including one study from Sweden that assessed an index of the nutrient
403
richness of beverages to their climate (GHG emissions) impact (Smedman et al. 2010;
404
González et al. 2011; Carlsson-Kanyama and Gonzalez 2009; Weber and Matthews 2008;
405
Cederberg et al. 2012). Seven other studies examined the impact of various diet patterns on
406
GHG emissions (Aston et al. 2012; Risku-Norja et al. 2009; Berners-Lee et al. 2012;
407
Macdiarmid et al. 2011; Macdiarmid et al. 2012; Scarborough et al. 2012; Vieux et al.
408
2012) and four others on a broader range of environmental impacts that included food
409
costs, nutrient intakes, fertilizer and pesticide use, production efficiencies, land
410
requirements and scenarios on economics and dairy exports (Baroni et al. 2007; Wolf et
411
al. 2011; Fazeni and Steinmüller 2011; Marlow et al. 2009). One study modeled the impact
412
of fat and protein content in nutritionally complete diets on land carrying capacity for
413
feeding a segment of the population (Peters et al. 2007).
414
Different approaches to assess the impact of dietary patterns have been taken. Some
415
studies compared current diets with country-specific or global dietary recommendations
416
(Wolf et al. 2011; Fazeni and Steinmüller 2011; Macdiarmid et al. 2011; Macdiarmid et al.
417
2012; Peters et al. 2007; Risku-Norja et al. 2009), others compared omnivorous with
418
vegetarian and/or vegan diets (Baroni et al. 2007; Berners-Lee et al. 2012; Marlow et al.
419
2009), and a few employed models of diet scenarios that examined impacts of changes in
420
the amounts of foods, food groups and/or calories within eating patterns (Scarborough et
421
al. 2012; Vieux et al. 2012; Aston et al. 2012).
422 423
These studies form the start of an information base of research on the environmental, economic and social impacts of foods and dietary patterns. Methodological
19
CONFIDENTIAL
INTERNAL USE ONLY
2-21-13
424
issues and other gaps will need to be addressed to build a solid information base. While
425
most studies used the well-recognized LCA method to assess GHG emissions, some used
426
an input/output method or a hybrid of the two methodologies. In addition, there was wide
427
variability in boundaries for GHG emissions data – from assessment of GHG emissions
428
primarily for agricultural commodities to using GHG emissions data only up to specific
429
points in the life cycle (e.g., farm-gate; distribution centers; retail). Some studies were
430
interpreted as evidence for consumer education programs or policy to encourage
431
consumers to change their eating patterns, while others pointed out a clear need for more
432
research. Several studies emphasized that assessing environmental impacts of foods or
433
diets should not be restricted only to GHG emissions and that a pragmatic, realistic view
434
that allows for differences in societal, cultural and religion and individual dietary
435
preferences must be taken into account. A recent review examining challenges in defining
436
a healthy diet with low environmental impact illustrates how food choices can impact
437
health and GHG emissions, the most common assessment of environmental impacts in the
438
published literature - and not always as may be expected (Macdiarmid 2012). The authors
439
cautioned against making general assumptions and highlighted the comprehensive
440
definition of sustainable diets put forth by the FAO definition noting the importance of
441
considering nutritional implications, the whole diet rather than single foods, nutrition and
442
environmental impacts of substitute foods, consumer acceptability and cost (Macdiarmid
443
2012). Currently, there are not enough high quality studies with a broad enough scope
444
(i.e., examining environment, economic and social factors together) available to determine
445
dietary patterns that represent sustainable eating patterns.
446
20
CONFIDENTIAL 447 448
INTERNAL USE ONLY
2-21-13
CONCLUSION It is critical for the health of future generations that the nutritional and health value
449
of foods, including dairy products, be recognized when evaluating the sustainability of
450
agricultural and food systems. The definition of sustainable diets put forth by the FAO of
451
the United Nations and Biodiversity International is comprehensive with nutrition and
452
health, biodiversity, economics and ecosystems as central components of sustainable
453
development. Consistent and credible science that brings together agriculture, food
454
systems, nutrition, public health, environment, economics, culture and trade is needed. The
455
science currently available, however, is nascent and incomplete. Public health nutritionists
456
and policy makers will need complete and solid evidence before dietary recommendations
457
for sustainable diets can be developed.
458
Dairy foods are nutrient-rich, affordable, accessible and consumed across the globe.
459
Although dairy consumption falls short of recommendations in many countries, even at
460
current intakes dairy foods make substantial contributions to the intake of many essential
461
nutrients. Higher dairy intakes are associated with lower risk of major chronic diseases and
462
their associated health care costs.
463
The dairy industry worldwide is working together to provide nutritious, healthy
464
products to support global population health in a way that optimizes natural and human
465
resources and reduces environmental impacts. Initiatives are underway globally through
466
the Global Dairy Agenda for Action, and best practices from across the globe on the Green
467
Paper website demonstrate progress at all levels. For example, in Great Britain procedures
468
have been developed to improve manure management and reduce nutrient run-off.; a
469
thermal storage system that produces both energy and cost savings was adopted in Japan;
21
CONFIDENTIAL
INTERNAL USE ONLY
2-21-13
470
and a Swedish dairy cut production waste in half by changing batch size and using fewer
471
machines and lines. In the US, measurement and reporting tools are becoming available to
472
further enhance industry-wide efforts to reduce GHG emissions for fluid milk. The global
473
dairy industry continues to lead the way to deliver nutritious dairy products that are
474
responsibly produced, economically viable and environmentally sound.
475 476
Acknowledgements
477
The helpful assistance from Lisa Vislocky in preparation of this manuscript is gratefully
478
acknowledged. We also thank Juan Tricarico, Jill Nicholls, Mickey Rubin and Ying Wang
479
for their valuable comments in developing the manuscript.
480 481
Figure legends
482 483
Figure 1. Data are from (FAO 2012)
484 485
Figure 2.
486
Nutrients to encourage and nutrients to limit are based on the 2010 Dietary Guidelines for
487
Americans (US Department of Agriculture and US Department of Health and Human
488
Services 2010). Nutrient and calorie intakes are from (Dairy Research Institute® 2009).
489 490
Figure 3.
491
Adapted from (Drewnowski 2010). Costs shown are U.S. dollars.
22
CONFIDENTIAL 492
INTERNAL USE ONLY
2-21-13
Figure 1. Changes in milk production from 1960 to 2010
493 25,000
Milk yield (lbs. per cow x year) 20,000
U.S. average growth rate: 280 lbs. per year
15,000
10,000
World average growth rate: 21 lbs. per year
5,000
-
494
1960
1970
1980
1990
2000
2010
495
23
CONFIDENTIAL
INTERNAL USE ONLY
2-21-13
496 497 498
Figure 2. Contribution of current 1.7 servings of dairy products (milk, cheese and yogurt) to calorie and nutrient intakes in the US
499
500 501
24
CONFIDENTIAL
INTERNAL USE ONLY
2-21-13
502 503
Figure 3. Average cost of food products by serving in the US
Fats, oils, salad dressing
$0.09
Sugars, sweets, beverages
$0.23
Grains
$0.23
Eggs
$0.24
Milk, milk products
$0.26
Dry beans, legumes, nuts
$0.26
Vegetables
Fruit Meat, poultry, fish
$0.29 $0.40 $0.63
504 505 506 507
25
CONFIDENTIAL 508 509 510 511 512 513 514 515 516 517 518 519 520 521 522 523 524 525 526 527 528 529 530 531 532 533 534 535 536 537 538 539 540 541 542 543 544 545 546 547 548 549 550 551 552 553 554 555
INTERNAL USE ONLY
2-21-13
REFERENCES Agricultural Development Economics Division of Economic and Social Development Department (2011) Looking ahead in world food and agriculture: Perspectives to 2050. Conforti, P ed. Rome: Food and Agriculture Organization of the United Nations. Aston L, Smith J, and Powles J (2012) Impact of a reduced red and processed meat dietary pattern on disease risks and greenhouse gas emissions in the UK: a modelling study. British Medical Journal Open 2 e001072 doi:10.1136/bmjopen-2012-001072. Baroni L, Cenci L, Tettamanti M and Berati M (2007) Evaluating the environmental impact of various dietary patterns combined with different food production systems. European Journal of Clinical Nutrition 61 279-286. Berners-Lee M, Hoolohan C, Cammack H and Hewitt C (2012) The relative greenhouse gas impacts of realistic dietary choices. Energy Policy 43 184-190. Bonthuis M, Hughes M, Ibiebele T, Green A and Van Der Pols J (2010) Dairy consumption and patterns of mortality of Australian adults. European Journal of Clinical Nutrition 64 569-577. Boyle J, Thompson T, Gregg E, Barker L and Williamson D (2010) Projection of the year 2050 burden of diabetes in the US adult population: dynamic modeling of incidence, mortality, and prediabetes prevalence. Population Halth Mtrics 8 29. Burlingame B and Dernini S (2012) Sustainabile Diets and Biodiversity: Directions and Solutions for Policy, Research and Action In: Proceedings of the International Scientific Symposium, Biodiversity and Sustainable Diets United Against Hunger, 3–5 November 2010, FAO Headquarters, Rome, Italy. Capper J, Cady A and Bauman D (2009) The environmental impact of dairy production: 1944 compared with 2007. Journal of Animal Science 87 2160-2167. Carlsson-Kanyama A and Gonzalez A (2009) Potential contributions of food consumption patterns to climate change. American Journal of Clinical Nutrition 89 1704S-1709S. Cederberg C, Hedenus F, Wirsenius S and Sonesson U (2012) Trends in greenhouse gas emissions from consumption and production of animal food products - implications for long-term climate targets. Animal 7 1-11. Committee on Twenty-First Century Systems Agriculture and National Research Council (2010) Toward Sustainable Agricultural Systems in the 21st Century, pp. 1-598. Council for Agricultural Science and Technology (Cast) (1999) Animal agriculture and global food supply. Task Force Report no. 135. Ames, IA. Dairy Research Institute® (2009) Data Source: Centers for Disease Control and Prevention, National Center for Health Statistics, National Health and Nutrition Examination Survey Data (NHANES 2003-2004; 2005-2006) 26
CONFIDENTIAL 556 557 558 559 560 561 562 563 564 565 566 567 568 569 570 571 572 573 574 575 576 577 578 579 580 581 582 583 584 585 586 587 588 589 590 591 592 593 594 595 596 597 598 599 600 601 602 603
INTERNAL USE ONLY
2-21-13
Dalmeijer G, Struijk E, Van Der Schouw Y, Soedamah-Muthu SS, Verschuren WM, Boer JM, Geleijnse JM and Beulens JW (2012) Dairy intake and coronary heart disease or stroke-a population-based cohort study. International Journal of Cardiology [Epub ahead of print]. de Oliveira Otto M, Mozaffarian D, Kromhout D, Bertoni AG, Sibley CT, Jacobs DR Jr and Nettleton JA (2012) Dietary intake of saturated fat by food source and incident cardiovascular disease: the Multi-Ethnic Study of Atherosclerosis. American Journal of Clinical Nutrition 96 397-404. Dietary Guidelines Advisory Committee (2010) Report of the Dietary Guidelines Advisory Committee on the Dietary Guidelines for Americans, 2010, to the Secretary of Agriculture and the Secretary of Health and Human Services Washington, DC. Doidge J, Segal L and Gospodarevskaya E (2012) Attributable risk analysis reveals potential healthcare savings from increased consumption of dairy products. Journal of Nutrition 142 17721780. Drewnowski A (2010) The cost of US foods as related to their nutritive value. American Journal of Clinical Nutrition 92 1181-1188. Du W, Wang H, Wang Z, Zhai F and Zhang B (2010) Trend of milk consumption among Chinese children and adolescents aged 7 to 17 years old in 9 provinces from 1991 to 2006. Zhonghua Liu Xing Bing Xue Za Zhi 31 1349-1352. Eichholzer M, Bovey F, Jordan P, Probst-Hensch N and Stoffel-Kurt N (2010) Data on overweight and nutrition in the 2007 Swiss Health Survey. Praxis 99 17-25. European Nutrition and Health Report (2009) Forum Nutrition, pp. 60-67. Basel Switzerland: Karger, AG. FAO (2009) FAO's Director-General on How to Feed the World in 2050. Population and Development Review 35 837-839. FAO (2012) Livestock Primary. Production. FAOSTAT. URL http://faostat.fao.org/site/569/default.aspx#ancor. Accessed August 18th, 2011. Fazeni K and Steinmüller H (2011) Impact of changes in diet on the availability of land, energy demand, and greenhouse gas emissions of agriculture. Energy, Sustainability and Society 1 6. Finkbeiner M, Inaba A, Tan R, Christiansen K and Kluppel H (2006) The new international standards for life cycle assessment: ISO 14040 and ISO 14044. The International Journal of Life Cycle Assessment 11 80-85. Fulgoni V 3rd, Keast D, Auestad N and Quann E (2011) Nutrients from dairy foods are difficult to replace in diets of Americans: food pattern modeling and an analyses of the National Health and Nutrition Examination Survey 2003-2006. Nutrition Research 31 759-765. Fumeron F, Lamri A, Abi Khalil C, Jaziri R, Prochay-Balderelli I, Lantieri O, Vol S, Balkau B, and Marre M. (2011) Dairy consumption and the incidence of hyperglycemia and the metabolic 27
CONFIDENTIAL 604 605 606 607 608 609 610 611 612 613 614 615 616 617 618 619 620 621 622 623 624 625 626 627 628 629 630 631 632 633 634 635 636 637 638 639 640 641 642 643 644 645 646 647 648 649
INTERNAL USE ONLY
2-21-13
syndrome: results from a French prospective study, Data from the Epidemiological Study on the Insulin Resistance Syndrome (DESIR). Diabetes Care 34 813-817. Gibson R, Bailey K, Gibb, M and Ferguson E (2010) A review of phytate, iron, zinc, and calcium concentrations in plant-based complementary foods used in low-income countries and implications for bioavailability. Food and Nutrition Bulletin 31 S134-S146. Gill M, Smith P and Wilkinson J (2010) Mitigating climate change: the role of domestic livestock. Animal 4 323-333. González A, Frostell B and Carlsson-Kanyama A (2011) Protein efficiency per unit energy and per unit greenhouse gas emissions: potential contribution of diet choices to climate change mitigation. Food Policy 36 562-570. Grantham N, Magliano D, Hodge A, Jowett J, Meikle P and Shaw J (2012) The association between dairy food intake and the incidence of diabetes in Australia: the Australian Diabetes Obesity and Lifestyle Study (AusDiab). Public Health Nutrition 7 1-7. Hunt J (2003) Bioavailability of iron, zinc, and other trace minerals from vegetarian diets. American Journal of Clinical Nutrition 78 633S-639S. Innovation Center for US Dairy (2011) US Dairy Sustainability Report URL http://www.usdairy.com/Public%20Communication%20Tools/2011USDairySustainabilityReport.p df. Accessed November 27, 2012. Innovation Center for US Dairy (2012) Sustainability URL http://www.usdairy.com/Sustainability/Pages/Home.aspx. Accessed November 27, 2012. Intergovernmental Panel on Climate Change (2011) IPCC Special Report on Renewable Energy Sources and Climate Change Mitigation. pp. 1075. Prepared by Working Group III of the Intergovernmental Panel on Climate Change. Edenhofer O, Pichs-Madruga R, Sokona Y, Seyboth K, Matschoss P, Kadner S, Zwickel T, Eickenmeier P, Hansen G, Schlomer S and Von Stechow C eds. Cambridge United Kingdom and New York NY. Krebs-Smith S, Guenther P, Subar A, Kirkpatrick S and Dodd K (2010) Americans do not meet federal dietary recommendations. Journal of Nutrition 140 1832-1838. Larsson S, Virtamo J and Wolk A (2012) Dairy consumption and risk of stroke in Swedish women and men. Stroke 43 1775-1780. Macdiarmid J (2012) Is a healthy diet an environmentally sustainable diet? Proceedings of the Nutrition Society 1-8. Macdiarmid J, Kyle J, Horgan G, Loe J, Fyfe C, Johnstone A and McNeill G (2011) Livewell: a balance of healthy and sustainable food choices URL http://assets.wwf.org.uk/downloads/livewell_report_jan11.pdf. Accessed November 27, 2012.
28
CONFIDENTIAL 650 651 652 653 654 655 656 657 658 659 660 661 662 663 664 665 666 667 668 669 670 671 672 673 674 675 676 677 678 679 680 681 682 683 684 685 686 687 688 689 690 691 692 693 694 695 696 697
INTERNAL USE ONLY
2-21-13
Macdiarmid J, Kyle J, Horgan G, Loe J, Fyfe C, Johnstone A and McNeill G (2012) Sustainable diets for the future: can we contribute to reducing greenhouse gas emissions by eating a healthy diet? American Journal of Clinical Nutrition 96 632-639. Malik V, Sun Q, Van Dam R, Rimm E, Willett W, Rosner B and Hu F (2011) Adolescent dairy product consumption and risk of type 2 diabetes in middle-aged women. American Journal of Clinical Nutrition 94 854-861. Margolis K, Wei F, de Boer I, Howard BV, Liu S, Manson J, Mossavar-Rahmani Y, Phillips L, Shikany J and Tinker L (2011) A diet high in low-fat dairy products lowers diabetes risk in postmenopausal women. Journal of Nutrition 141 1969-1974. Marlow H, Hayes W, Soret S, Carter R, Schwab E and Sabate J (2009) Diet and the environment: does what you eat matter? American Journal of Clinical Nutrition 89 1699S-1703S. McCarron D and Heaney R (2004) Estimated healthcare savings associated with adequate dairy food intake. American Journal of Hypertension 17 88-97. Michaelsen K, Hoppe C and Roos N (2009) Choice of foods and ingredients for moderately malnourished children 6 months to 5 years of age. Food and Nutrition Bulletin 30 S343-404. Morgan K, McGee H, Watson D, Perry I, Barry M, Shelley E, Harrington J, Molcho M, Layte R, Tully N, van Lente E, Ward M, Lutomski J, Conroy R and Brugha R (2008) SLAN 2007: Survey of Lifestyle, Attitudes & Nutrition in Ireland. In: Main Report. Dublin, Department of Health and Children. Oltjen J and Beckett J (1996) Role of ruminant livestock in sustainable agricultural systems. Journal of Animal Science 74 1406-1409. Peters C, Wilkins J and Fick G (2007) Testing a complete-diet model for estimating the land resource requirements of food consumption and agricultural carrying capacity: the New York State example. Renewable Agriculture and Food Systems 22 145-153. Ralston R, Lee J, Truby H, Palermo C and Walker K (2012) A systematic review and meta-analysis of elevated blood pressure and consumption of dairy foods. Journal of Human Hypertension 26 313. Risku-Norja H, Kurppa S and Helenius J (2009) Dietary choices and greenhouse gas emissions – assessment of impact of vegetarian and organic options at national scale. Progress in Industrial Ecology – An International Journal, 6 340-354. Scarborough P, Allender S, Clarke D, Wickramasinghe K and Rayner M (2012) Modelling the health impact of environmentally sustainable dietary scenarios in the UK. European Journal of Clinical Nutrition 66 710-715. Sluijs I, Forouhi N, Beulens J, van der Schouw Y, Agnoli C, Arriola L, Balkau B, Barricarte A, Boeing H, Bueno-de-Mesquita H, Clavel-Chaelon F, Crowe F, de Lauzon-Guillain B, Drogan D, Franks P, Gavrila D, Gonzalez C, Halkjaer J, Kaaks R, Moskal A, Nilsson P, Overvad K, Palli D, Panico S, Quiros J, Ricceri F, Rinaldi S, Rolandsson O, sacerdote C, Sanchez M, Slimani N, Spijkerman A, Teucher B, 29
CONFIDENTIAL 698 699 700 701 702 703 704 705 706 707 708 709 710 711 712 713 714 715 716 717 718 719 720 721 722 723 724 725 726 727 728 729 730 731 732 733 734 735 736 737 738 739 740 741 742 743 744 745
INTERNAL USE ONLY
2-21-13
Tjonneland A, Tormo M, Tumino R, van der A, Sharp S, Langenberg C, Feskens E, Riboli E and Wareham N (2012) The amount and type of dairy product intake and incident type 2 diabetes: results from the EPIC-InterAct Study. American Journal of Clinical Nutrition 96 382-390. Smedman A, Lindmark-Mansson H, Drewnowski A and Edman A (2010) Nutrient density of beverages in relation to climate impact. Food and Nutrition Research 54 doi 10.3402/fnr.v54i0.5170. Soedamah-Muthu S, Ding E, Al-Delaimy W, Hu F, Engberink M, Willett W and Geleijnse J (2011) Milk and dairy consumption and incidence of cardiovascular diseases and all-cause mortality: dose-response meta-analysis of prospective cohort studies. American Journal of Clinical Nutrition 93 158-171. Soedamah-Muthu S, Verberne L, Ding E, Engberink M and Geleijnse J (2012) Dairy consumption and incidence of hypertension : A dose-response meta-analysis of prospective cohort studies. Hypertension. Hypertension 60 1131-1137. Sonestedt E, Wirfait E, Wallstrom P, Gullberg B, Orho-Melander M and Hedblad B (2011) Dairy products and its association with incidence of cardiovascular disease: the Malmö diet and cancer cohort. European Journal of Epidemiology 26 609-618. Statistics Canada (2006) Nutrition: Findings from the Canadian Community Health Survey 2004. Overview of Canadians' Eating Habits. pp. 47. Ottawa, Canada: Health Statistics Division. Struijk E, Heraclides A, Witte D, Soedamah-Muthu S, Geleijnse J, Toft U and Lau C (2012) Dairy product intake in relation to glucose regulation indices and risk of type 2 diabetes. Nutrition, Metabaolism & Cardiovascular Diseases [Epub ahead of print]. The Global Dairy Agenda for Action (2012) Dairy Agenda for Action URL http://www.dairysustainability-initiative.org/Public/Menu.php?ID=36. Accessed November 11, 2012. Tong X, Dong J, Wu Z, Li W and Qin L (2011) Dairy consumption and risk of type 2 diabetes mellitus: a meta-analysis of cohort studies. European Journal of Clinical Nutrition 65 1027-1031. US Department of Agriculture (2012) Research, Education, and Economics Action Plan URL http://www.ree.usda.gov/ree/news/USDA_REE_Action_Plan_02-2012_2.pdf. Accessed February 16, 2013. US Department of Agriculture and US Department of Health and Human Services (2010) Dietary Guidelines for Americans, 2010. Washington, DC: U.S. Government Printing Office. Van Meijl L and Mensink R (2011) Low-fat dairy consumption reduces systolic blood pressure, but does not improve other metabolic risk parameters in overweight and obese subjects. Nutrition, Metabaolism & Cardiovascular Diseases 21 355-361. Vieux F, Darmon N, Touazi D and Soler L (2012) Greenhouse gas emissions of self-selected individual diets in France: changing the diet structure or consuming less? Ecological Economics 75 91-101. 30
CONFIDENTIAL 746 747 748 749 750 751 752 753 754 755 756 757 758 759 760 761 762 763 764 765 766 767 768
INTERNAL USE ONLY
2-21-13
Warensjo E, Jansson J, Cederholm T, Boman K, Eliasson M, Hallmans G, Johansson I and Sjogren P (2010) Biomarkers of milk fat and the risk of myocardial infarction in men and women: a prospective, matched case-control study. American Journal of Clinical Nutrition 92 194-202. Weber C and Matthews H (2008) Food-miles and the relative climate impacts of food choices in the United States. Environmental Science & Technology 42 3508-3513. Wilkinson J (2011) Redefining efficiency of feed use by livestock. Animal 5 1014-1022. Wolf O, Pérez-Domínguez I, Rueda-Cantuche J, Tukker A, Kleijn R, de Koning A, Bausch-Goldbohm S and Verheijden M (2011) Do healthy diets in Europe matter to the environment? A quantitative analysis. Journal of Policy Making 33 8-28. World Health Organization (2003) Diet, Nutrition and the Prevention of Chronic Diseases: Report of a Joint WHO/FAO Expert Consultation. Geneva, Switzerland. World Health Organization (2004) Global Strategy on Diet, Physical Activity and Health. Geneva, Switzerland. World Health Organization (2008) The Global Burden of Disease: 2004 update. Geneva, Switzerland.
31