The 18th IEEE International Symposium on Robot and Human Interactive Communication Toyama, Japan, Sept. 27-Oct. 2, 2009
WeC3.4
Towards an EEG-based Emotion Recognizer for Humanoid Robots Kristina Schaaff and Tanja Schultz University of Karlsruhe (TH), Karlsruhe, Germany
[email protected],
[email protected]
Abstract— In the field of interaction between humans and robots emotions have been disregarded for a long time. During the last few years interest in emotion research in this area has been constantly increasing as giving a robot the ability to react to the emotional state of the user can help to make the interaction more human-like and enhance the acceptance of the robots. In this paper we investigate a method to facilitate emotion recognition from electroencephalographic signals. For this purpose we developed a headband to measure electroencephalographic signals on the forehead. Using this headband we collected data from five subjects. To induce emotions we used 90 pictures from the International Affective Picture System (IAPS) belonging to the three categories pleasant, neutral, and unpleasant. For emotion recognition we developed a system based on support vector machines (SVMs). With this system an average recognition rate of 47.11% could be achieved on subject dependent recognition.
I. INTRODUCTION A. Motivation Research in the field of humanoid robots has been an issue for many years now. One topic that is becoming more and more important in this context is to give the robot the ability to behave socially while interacting with humans or other robots. This does not only include acting emotionally but also reacting to a person’s emotional state. This work was conducted as a part of the Collaborative Research Center “Humanoid Robots - Learning and Cooperating Multimodal Robots”. Goal of this project is the development of concepts and methods for a humanoid robot to assist human partners in everyday life. In order to be accepted by humans and to cooperate with them in an efficient way it is not only advantageous to have a humanoid shape but also to act socially. Acting socially implies the ability of the robot to recognize a person’s emotional state and to react accordingly. The need for the empathic behavior of the robot is also underpinned by the Media Equation developed by Reeves and Nass [1], which states that humancomputer interaction follows the same rules as human-human interaction. The capability to react to a person’s emotional state implicates that the robot has to be able to gather information about the current state of this person. In contrast to information about the current activity or the situation of a person, it is often not possible to gather this information from visual and auditory signals as emotion refers to an internal state of a person. However, computers are able to consider a much larger range of signals than humans. Especially physiological signals are usually not accessible
978-1-4244-5081-7/09/$26.00 ©2009 IEEE
for humans. Using bioelectrical signals may help to enable a computer to precisely distinguish between the emotional states of a person and react accordingly. Another advantage of bioelectrical signals compared to visual and auditory signals is that they are independent of lighting conditions and are emitted continuously. In our current, study we focus on giving a robot the ability to recognize human emotions. For this purpose, we investigate the feasibility of electroencephalographic (EEG) signals for emotion recognition, which have already shown to be suitable for user state and workload detection [2], [3]. In contrast to other physiological sensors, EEG sensors are applied directly to the head, which allows one to build a hands-free system that does not restrict the choice of clothes. Moreover, the EEG signal always reflects the true emotional state of a person, while speech and facial appearance might be influenced by a person intentionally. In the future, the emotion recognition system could be extended to a multimodal scenario, which does not only use EEG signals but also other physiological signals or cameras and microphones to make the system more robust. B. Related Work There have been several studies dealing with emotion recognition using a large variety of physiological signals. However, building an automatic system for emotion recognition is a difficult task as [4] has shown that even humans are only able to distinguish among six emotions from speech signals with an accuracy of 60%. These results indicate that it is not always possible to attribute a reaction to only one certain emotional state. Picard et al. built a system that was able to differ between eight emotion categories with an accuracy of 81% using electromyographic data, blood volume pressure, skin conductance, and respiration information. Data was recorded from one person during some weeks [5]. To deal with daily variations, they developed a special feature set. Recognition was performed by Fisher Projection with the results of Sequential Floating Forward Search. Kim et al. conducted a user-independent study using skin temperature, skin conductance, and heart rate. On the four categories sadness, anger, stress, and surprise a recognition rate of 61.76% could be achieved by using support vector machines. [6] Using a combination of features extracted from electrocardiographic and electromyographic signals, blood volume pressure, skin conductance, respiration, and temperature,
792
Haag et al. were able to achieve a differentiation of 96.58% on arousal ratings (high - low). Valence ratings (high - low) were classified correctly with 89.93%. For classification they used a neural network classifier. [7] In [8] features were extracted from skin conductance, heart rate and electroencephalographic signals. Classification was performed user independent by using support vector machines. On the five emotional states joy, anger, sadness, fear, and relax a recognition rate of 41.7% could be achieved. By distinguishing only between the three states joy, anger, and sadness, recognition rate could be increased to 66.7%. While quite a number of studies investigated various physiological signals for emotion classification, only very few examined the usefulness of the EEG signal. In a study about cerebral asymmetry, Davidson et al. found that disgust caused less alpha power in right frontal region than happiness while happiness caused less alpha power in the left frontal region [9]. Moreover, Kostyunina and Kulikov [10] found that alpha peak frequency differs among emotions as for joy and anger an increase could be observed while sorrow and fear caused a decrease compared to the baseline condition. Aftanas et al. found significant changes in EEG synchronization and desynchronization for certain frequency bands in connection with different emotional states [11]. In [12] the authors describe a system developed for arousal classification based on frequency bands characteristics. On three different arousal categories classification rates around 45% could be achieved. II. DATA COLLECTION For our current study, EEG-data related to different emotional states had to be collected. We recorded data from five male subjects, who were all students or employees of University of Karlsruhe (TH). The subjects had a mean age of 26.8 ranging from 23 to 31. All of them had perfect or near perfect vision and none of them had taken any medication that could have affected the EEG signal. Moreover, all of them stated to feel healthy on the day of the experiment. A. Hard- and Software Setup
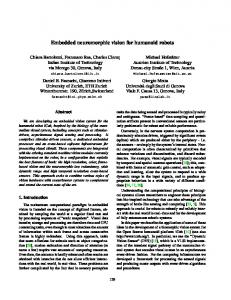
Fig. 1.
Subject wearing EEG-headband and recording devices
For our recordings we used a headband, which was developed at University of Karlsruhe (TH). The headband includes four built-in electrodes at the positions Fp1, Fp2, F7, and F8 according to the international 10-20-system [13]. A disposable electrode was placed at the back of the neck as ground electrode. The EEG-signals were conducted unipolar against two reference electrodes at the left and right mastoids, which were averaged before amplification. The headband we used in our study has some major advantages over standard EEG-caps, which are usually used for clinical recordings. First of all, it is more comfortable to wear and easy to attach, which makes it suitable for everyday life usage. Moreover, all electrodes are located at the forehead, such that no conductive gel gets in contact with the hair. To amplify and digitalize the signals we used the VarioPortTM system [14], which was connected to the USBport of a computer with an RS-232 to USB adapter. The sampling rate for all recordings was set to 300 Hz. Figure 1 shows a subject wearing the headband and the recording devices. All recordings were done with a modified version of the UKA {EEG|EMG}-Studio [15], which was extended by the functionality to present the pictures used as emotional stimuli and to synchronize the recording with the picture presentation. Data processing as described in section III was done with MATLABTM . Data was recorded using a modified version of the UKA {EEG|EMG}-Studio [15], which had originally been designed for recognition of silent speech from EEG and electromyographic signals [16], [17]. The software was extended by the functionality to present the pictures used for emotion induction and synchronize the recording with the picture presentation. Data processing and classification was done with MATLABTM . For classification with support vector machines (SVMs), libSVM [18] was integrated into MATLAB. B. Stimulus Material Collecting physiological data that corresponds to a particular emotional state is a challenging problem. First of all, it is hard to record spontaneous emotions as it is nearly impossible to apply the sensors necessary for signal recordings without disturbing a subject. Besides that, there is usually no objective ground-truth which emotion occurs at which time. The self-assessment of a person may vary due to many different factors, e.g. daily condition. Therefore, we used a setup where emotions were elicited under controlled conditions. For emotion induction we decided to use pictures from the International Affective Picture System (IAPS) [19]. The IAPS is a set of more than 1000 photographs with emotionally loaded content for the study of emotion and attention [20]. All pictures have been rated on the two emotional dimensions valence and arousal on a scale ranging from 1 (unpleasant / low arousal) to 9 (pleasant / high arousal). We selected 90 pictures from the three valence categories pleasant (i.e. high valence), neutral (i.e. medium valence),
793
and unpleasant (i.e. low valence)1 . Pleasant pictures contained for instance family pictures, adventure scenes, or erotic females, neutral pictures household objects or neutral faces, and unpleasant pictures scenes of physical threat or mutilation. Table II-B shows the mean values and standard deviation of the IAPS ratings for men for the selected pictures. Emotion Pleasant Neutral Unpleasant
Valence Mean (Standard Deviation) 7.34 (0.55) 5.00 (0.49) 2.28 (0.57)
Arousal Mean (Standard Deviation) 5.37 (1.18) 2.47 (0.45) 5.95 (0.67)
TABLE I C HARACTERISTICS OF IAPS PICTURES USED FOR EMOTION INDUCTION
C. Experimental Procedure All experiments took part in the afternoon in a seminar room at University of Karlsruhe (TH). Subjects were seated about 5 meters away from a wall to which the pictures were projected with a size of 176 x 132 cm.
Fig. 2.
Process of picture presentation
Before the experiment started, subjects were presented a small pilot set consisting of five pictures. This was done to help the subjects get familiar with the experimental procedure. In the main experiment, pictures from different emotion conditions were presented in a random order in two blocks, each containing 15 pictures for each condition. Subjects were asked not to blink or to move during the time a picture was shown on the screen to reduce artifacts. As shown in Figure 2, each presentation cycle started with a black fixation cross, which was shown for two seconds. After that, a picture was presented for 6 seconds. Next, a gray bar indicated the resting phase for 15 seconds. Subsequently, the next presentation cycle started. Each block took about 20 minutes. Between both presentation blocks there was an intermission of 5 minutes to allow the subject to move.
III. EXPERIMENTS AND RESULTS A. Preprocessing and Feature Extraction To solve the emotion recognition task, features had to be extracted from the raw signal. For this purpose we evaluated different features from the time and frequency domains for each picture, which is outlined in the following. Peak alpha frequency: According to the findings of Kostyunina and Kulikov peak alpha frequency - which is the frequency with the maximal amplitude in the alpha power spectrum (8 - 13 Hz) - can differ subject to the emotional state of a person [10]. Peak alpha frequency was computed separately for each electrode. Alpha power: Following Davidson [21] we computed alpha power values for each electrode and each sample. To obtain a better resolution we split the signal into lower (8 10 Hz) and upper (10 - 13 Hz) alpha frequency bands. Cross-correlation features: Similarly to the approach proposed in [22], we computed cross-correlation features for the signal within the alpha range (8 - 13 Hz). The crosscorrelation coefficient between potentials from electrode j and k for a frequency range F is given by P ∗ F Xj (fn )Xk (fn ) qP c(F ; jk) = qP 2 2 F |Xj (fn )| F |Xk (fn )| where Xj (fn ) is the Fourier transform of the EEG signal at the j th electrode site and the nth frequency bin. Statistical time domain properties: All the features explained above refer to the frequency domain of the signal. Therefore, we additionally used the statistical parameters suggested by [5] to combine the frequency based features with features from the time domain. The features are computed as follows: 1) the means of the raw signals
1 The following pictures were used for emotion induction: Pleasant: 5626, 4599, 1750, 5833, 5600, 1710, 5621, 2345, 1440, 8190, 4002, 8497, 1441, 2070, 4641, 8461, 8120, 2341, 2040, 1460, 8180, 8490, 4694, 2150, 1340, 1810, 2655, 4250, 2360, 4220; Neutral: 7041, 5530, 7031, 2190, 7175, 5720, 7050, 7150, 7060, 7020, 7006, 7040, 7036, 7234, 5731, 7900, 5520, 1450, 7010, 7000, 5500, 7035, 7080, 7705, 7233, 7950, 2393, 7004, 7110, 7090; Unpleasant: 9433, 3053, 9040, 1930, 9920, 9254, 9410, 3225, 3530, 3080, 3000, 3068, 9921, 2703, 9181, 3400, 3071, 9300, 3010, 3261, 3100, 3110, 3064, 7361, 9250, 9570, 3130, 3140, 2800, 3120.
794
µx =
N 1 X xn N n=1
2) the standard deviations of the raw signals !1/2 N 1 X 2 σx = (xn − µx ) N − 1 n=1 3) the means of the absolute values of the first differences of the raw signals δx =
N −1 1 X |xn+1 − xn | N − 1 n=1
4) the means of the absolute values of the first differences of the normalized signals δx δ˜x = σx 5) the means of the absolute values of the second differences of the raw signals γx =
N −2 1 X |xn+2 − xn | N − 2 n=1
6) the means of the absolute values of the second differences of the normalized signals γx γ˜x = σx xn represents the value of the nth sample of the raw signal with a total of N samples. The features for each electrode were concatenated after computation. After all features had been computed they were concatenated to form one large feature vector. Subsequently we normalized each feature by subtracting its mean and dividing it by the standard deviation over all samples. For a feature x the new value is computed by xnorm = i
xi − µx σx
where µx is the mean of this feature over all samples and σx its standard deviation. The normalized features were then used for training and classification.
IV. CONCLUSIONS AND FUTURE WORKS A. Conclusions The goal of this study was to investigate the feasibility of EEG data for building an emotion recognizer for humanoid robots. For this purpose a headband with four built-in electrodes at the forehead was developed, which is a comfortable and easy-to-attach device to record the data. We used a combination of different features from the time and frequency domains to build a recognizer that is able to distinguish between the three emotion categories pleasant, neutral, and unpleasant. Using an SVM for the recognition task we could achieve an average recognition rate of 47.11% over five subjects. The recognizer was trained separately for each subject as we assume that there are many differences in emotional experience among different persons. From the results obtained in this study we conclude that it is possible to recognize emotions from EEG signals using only data from the forehead. B. Future Work
B. Training and Classification We performed training and classification separately for each subject. As we had only a small number of samples available for each subject (30 samples for each emotion), we used 30-fold cross-validation. For classification a support vector machine (SVM) with an RBF-kernel was used. The penalty parameter C and the kernel parameter γ were optimized separately for each subject by using a simple gridsearch approach. Following the suggestions from [23] we varied the parameters as follows: −5 −3 • C =2 , 2 , ..., 215 −15 −13 • γ =2 , 2 , ..., 23 The results of the classification process are shown in Figure 3. Accuracy is obtained by dividing the number of samples that were classified correctly by the total number of samples. As Figure 3 shows, accuracy varies among the subjects, ranging from 38.83 to 55.56%. This can be explained by the fact that some people behave less or more emotionally than others. For that reason the intensity in which one of the presented pictures is perceived varies among different persons. We obtain an average recognition rate over all subjects of 47.11%.
Building a system that is able to recognize emotions from EEG signals raises a lot of challenging questions. Improving recognition rate is probably the most important issue in this context. One way to achieve this goal is to make the system more robust. For this purpose, artifacts have to be reduced. This can either be done by using electrodes and recording devices which are less prone to external electrical influences, or by implementing automatic methods for artifact removal. This is even more important as until now all the recordings have been done in a laboratory environment, which is not comparable to real-life conditions as we have them in human-robot interaction. Additionally, it is essential to further improve the results by evaluating different methods for preprocessing and classification. In our current study most of the subjects were bothered by the wires connecting the electrodes to the recording device. For daily use in communication between humans and robots it is therefore essential to enhance usability by developing a wireless recording system in order to minimize the disturbance for the user. Moreover, it is crucial to implement the algorithms to a system that is suitable for online recognition. Additional to the emotional states pleasant, neutral, and unpleasant which were subject of our study, it would also be of interest to investigate the suitability of categorical emotional states for emotion recognition in the field of humanoid robots, like joy, anger, or fear. Furthermore, the results of this study should be used to build a recognizer that is able to recognize not only emotions but also information about the current task demand of a person as presented in [3]. Finally, we intend to improve recognition results significantly in the future by extending the emotion recognizer to a multimodal scenario. V. ACKNOWLEDGEMENTS
Fig. 3.
Recognition rates for five subjects
This work has been supported by the Deutsche Forschungsgemeinschaft (DFG) within Collaborative Re-
795
search Center 588 ”Humanoid Robots - Learning and Cooperating Multimodal Robots”. R EFERENCES [1] B. Reeves and C. Nass, The Media Equation: How People Treat Computers, Televisions, and New Media as Real People and Places. Cambridge University Press, 1995. [2] M. Honal, “Determining user state and mental task demand from electroencephalographic data,” Master’s thesis, Universit¨at Karlsruhe (TH), Karlsruhe, Germany, 2005. [3] M. Honal and T. Schultz, “Determine task demand from brain activity,” in Biosignals 2008, 2008. [4] K. R. Scherer, Speech and Emotional States., j. darby ed., ser. Speech Evaluation in Psychiatry. New York: Grune & Stratton., 1981, pp. 189–220. [5] R. W. Picard, E. Vyzas, and J. Healey, “Toward machine emotional intelligence: Analysis of affective physiological state,” IEEE Transactions on Pattern Analysis and Machine Intelligence, vol. 23, pp. 1175 – 1191, Oct 2001. [6] K. H. Kim, S. W. Bang, and S. R. Kim, “Emotion recognition system using short-term monitoring of physiological signals,” Medical and Biological Engineering and Computing, vol. 42, pp. 419–427, 2004. [7] A. Haag, S. Goronzy, P. Schaich, and J. Williams, “Emotion recognition using bio-sensors: First steps towards an automatic system,” Lecture Notes in Computer Science, vol. 3068, pp. 33–48, 2004. [8] K. Takahashi, “Remarks on svm-based emotion recognition from multi-modal bio-potential signals,” Robot and Human Interactive Communication, 2004. ROMAN 2004. 13th IEEE International Workshop on Robot and Human Interactive Communication, pp. 95–100, 2004. [9] R. J. Davidson, P. Ekman, C. D. Sarona, J. A. Senulis, and W. V. Friesen, “Approach / withdrawal and cerebral asymmetry: Emotional expression and brain physiology,” Journal of Personality and Social Psychology, vol. 58, no. 2, pp. 330 – 341, Feb 1990. [10] M. Kostyunina and M. Kulikov, “Frequency characteristics of eeg spectra in the emotions,” Neuroscience and Behavioral Physiology, vol. 26, no. 4, pp. 340–343, July 1996.
[11] L. I. Aftanas, N. V. Reva, A. A. Varlamov, S. V. Pavlov, and V. P. Makhnev, “Analysis of evoked EEG synchronization and desynchronization in conditions of motional activation in humans: Temporal and topographic characteristics.” Neuroscience and behavioral physiology, vol. 34, no. 8, pp. 859–867, October 2004. [12] G. Chanel, J. Kronegg, D. Grandjean, and T. Pun, “Emotion assessment: Arousal evaluation using EEG’s and peripheral physiological signals,” in Proc. Int. Workshop Multimedia Content Representation, Classification and Security (MRCS), B. Gunsel, A. K. Jain, A. M. Tekalp, and B. Sankur, Eds., vol. 4105. Istanbul, Turkey: Lecture Notes in Computer Science, Springer, 2006, pp. 530–537. [13] H. H. Jasper, “The ten-twenty electrode system of the international federation in electroencephalography and clinical neurophysiology,” EEG Journal, vol. 10, pp. 371–375, 1958. TM [14] K. Becker, “Varioport ,” http://www.becker-meditec.de, 2003. [15] C. Mayer, UKA {EMG|EEG} Studio v2.0, 2005. [16] M. Wester, “Unspoken speech - speech recognition based on electroencephalography,” Master’s thesis, Universit¨at Karlsruhe (TH), Karlsruhe, Germany, 2006. [17] M. Wand and T. Schultz, “Towards speaker-adaptive speech recognition based on surface electromyography,” in Biosignals 2009, 2009. [18] C.-C. Chang and C.-J. Lin, LIBSVM: a Library for Support Vector Machines, 2008, last updated: May 13, 2008. [Online]. Available: http://www.csie.ntu.edu.tw/ cjlin/papers/libsvm.pdf [19] P. Lang, M. Bradley, and B. Cuthbert, “International affective picture system (iaps): Affective ratings of pictures and instruction manual,” University of Florida, Gainesville, FL, Tech. Rep. A-6, 2005. [20] M. Bradley and P. J. Lang, “The international affective picture system (iaps) in the study of emotion and attention,” in Handbook of Emotion Elicitation and Assessment, J. A. Coan and J. J. B. Allen, Eds. New York: Oxford University Press, 2007, ch. 2, pp. 29–46. [21] R. J. Davidson, “Anterior cerebral asymmetry and the nature of emotion,” Brain and Cognition, vol. 20, no. 1, pp. 125 – 151, Sep 1992. [22] T. Musha, Y. Terasaki, H. A. Haque, and G. A. Ivamitsky, “Feature extraction from EEGs associated with emotions,” Artificial Life and Robotics, vol. 1, no. 1, pp. 15–19, March 1997. [23] C. W. Hsu, C. C. Chang, and C. J. Lin, “A practical guide to support vector classification,” Department of Computer Science, Taipei, Tech. Rep., 2003, last updated: May 21, 2008.
796