Metabolism of MDA-468 Human Breast Cancer Cells* ... Cancer Center, Georgetown ...... Alley, M. C., Scudiero, D. A., Monks, A., Hursey, M. L., Czerwin-.
THE JOURNAL OF BIOLOC~CAL CHEMISTRY
Vol. 265, No. 23, Issue of August 15, pp. 13641-13649, 1990
Printed in U.S. A.
Toxicity and Effects of Epidermal Growth Factor on Glucose Metabolism of MDA-468 Human Breast Cancer Cells* (Received for publication, Ofer Kaplan*, Jerzy W. Jaroszewski#, Marc LippmanlI, and Jack S. Cohen* From the Medicine Branch, Division Maryland 20892 and the BLombardi
Patrick
J. Faustinof,
of Cancer Treatment, National Cancer Cancer Center, Georgetown University,
Epidermal growth factor (EGF) has an in vitro inhibitory effect on tumor cells which exhibit a high number of EGF receptors (EGFR). Studies were performed in order to delineate the effects of EGF on glucose metabolism of MDA-468 human breast cancer cells, which have a large number of EGFR. Glucose consumption and lactate production were found to be substantially increased in MDA-468 cells following EGF exposure, while no such effects were detected in MCF-7 breast cancer cells, which have a very low number of EGFR. When glucose levels in the growth medium were increased, the toxicity of EGF was diminished. The energetic status of MDA-468 cells perfused with growth medium containing EGF was monitored by 31P magnetic resonance spectroscopy, and no signs of compromised metabolic state or viability were noted for up to 36 h. The rate of glucose transport and phosphorylation was quantitated by 13C magnetic resonance spectroscopy, utilizing [6-‘3C]2-deoxyglucose, and a 97% increase was found in MDA-468 cells following EGF administration. The profound effects of EGF on glucose metabolism in cells with very high numbers of EGFR and the lack of toxicity in the perfused system may indicate that the growth-inhibitory effect is confined to the in vitro cultured cells.
Epidermal growth factor is a small polypeptide (53 amino acids), which was discovered in extracts of mouse submaxillary glands, inducing early eyelid opening in newborn mice by stimulating the proliferation of epidermal basal cells (1). EGF’ exerts its biological actions through binding to high affinity receptors (EGFR), which are 170-kDa transmembrane glycoproteins (2). The first molecular event to occur after EGF binding is the activation of tyrosine kinase, which phosphorylates various cellular components, including EGFR (2, 3). * The costs of publication of this article were defrayed in part by the payment of page charges. This article must therefore be hereby marked “aduertisement” in accordance with 18 U.S.C. Section 1734 solely to indicate this fact. $ Present address: Dept. of Pharmacology, Georgetown University Medical School, Washington D. C. 20007. J Supported by the Alfred Benzon Foundation, Copenhagen, Denmark. Permanent address: Dept. of Organic Chemistry, Royal Danish School of Pharmacology, Universitetsparken 2, DK-2100 Copenhagen, Denmark. ’ The abbreviations used are: EGF, epidermal growth factor; EGFR, epidermal growth factor receptors; MRS, magnetic resonance spectroscopy; 2-DG, 2-deoxyglucose; 2-DG-6-P, 2-deoxyglucose 6.phosphate; Hepes, 4-(2-hydroxyethyl).l-piperazineethanesulfonic acid; IMEM, improved minimal Eagle’s medium; FCS, fetal calf serum; ER, estrogen receptors; MTT, 3.(4,5-dimethylthiazol-2-yl)-2,5-diphenylt,etrazolium bromide.
Gerhard
Zugmaierll,
Institute, National Institutes Washington, D. C. 20007
December 19, 1989)
Bruce of Health,
W. EnnisP, Bethesda,
EGF modulates an array of physiological and biochemical activities such as an increase of intracellular Ca2+ concentration, stimulation of phospholipase C, stimulation of amino acids and glucose transport, as well as induction of DNA and protein synthesis (2, 4-6). EGF has a stimulatory effect on the proliferation of a wide variety of normal and malignant cells (7). However, the growth of some tumor cells was found to be inhibited by EGF (8, 9), and these cells exhibited very high numbers of EGFR. It was subsequently shown that a quantitative correlation exists between EGF receptor number and growth response to EGF; when an optimal EGFR number is exceeded, growth inhibition rather than stimulation occurs upon exposure to EGF (8, 10, 11). The biochemical processes of growth inhibition elicited by EGF are poorly understood. In this paper, studies of the effects of EGF on glucose metabolism of MDA-468 cells are presented. These are human breast cancer cells, which have a large number of EGFR and were also found to have an amplified and overexpressed EGFR gene (8, 10). MDA-468 cells are stimulated by low (picomolar) and inhibited by higher (nanomolar) EGF concentrations. This phenomenon can be demonstrated only in cells expressing an exceptionally high number of EGFR. The impetus to study the effects of EGF on glucose metabolism was derived from these events, since controlled consumption of glucose is essential for cell viability and growth, whereas overconsumption may lead to detrimental effects. The toxicity and the effects of EGF on glucose metabolism of MDA-468 cells were compared to its effects on MCF-7 breast cancer cells, which possess a very small number of EGF receptors (9, 12, 13). Inhibitory effects of EGF were also studied with the combination of 2-deoxyglucose (2-DG). 2-DG is a glucose analog that competitively inhibits cellular uptake of glucose, and, after entering the cell, it is phosphorylated but undergoes no further metabolism (14). The phosphorylated product, 2-DG-6-P, inhibits hexosephosphate isomerase and interferes with the utilization of glucose in the glycolytic pathway, leading to cell starvation (Xi), and it was investigated whether or not 2-DG increased EGF-inhibitory effects. The effects of EGF on glucose and energy metabolism of perfused MDA-468 cells were studied by ‘IP magnetic resonance spectroscopy (MRS). MRS is an excellent method of detecting and monitoring metabolic processes and changes in ATP levels in living systems (16-18) and enables monitoring of the phosphorylation of 2-DG. The transport and phosphorylation of 2-DG were simultaneously followed by lRC MRS, using 2-DG labeled with 13C in the 6-position (19). The advantage of this method is that both the 2-DG and 2-DG-6P signals are clearly resolved, and quantitative measurements can be performed.
13641
13642
EGF Effects on Breast Cancer Cells EXPERIMENTAL
PROCEDURES
Materials-For cell cultures, “improved” minimal Eagle’s medium (National Institutes of Health Media Center, “regular” IMEM contains 11 mM glucose) was used. Fetal calf serum (FCS) and trypsin were purchased from Gibco Laboratories. CR-EGF (receptor grade, from mouse submaxillary gland) was obtained from Collaborative Research Inc. 16-13C12-DG was nurchased from Cambridge Isotones Laboratories, Woburn, MA. Bi&rchoninic acid assay reagents for protein determination were obtained from Pierce Chemical Co. All other chemicals and glucose, lactate, and reagents were of highest available purity and were obtained from Sigma. Tumor Cells-MCF-7 (wild type) human breast cancer cells from the National Institutes of Health (20) were grown in IMEM supplemented with penicillin/streptomycin (100 units/ml, 10 mg/liter) and 10% FCS, under 5% CO* environment. MDA-MB-468 cells were also derived from human breast tumor (21), were obtained from the American Type Culture Collection, and were also grown in IMEM with 10% FCS. Cell Survival and Glucose Consumption Assays-The effects of EGF on MDA-468 and MCF-7 cells were studied by cell survival assays. 25 X lo4 cells were plated in 25cm* flasks in 10 ml of IMEM (11 mM glucose). Twenty-four h later, the medium was replaced with new growth medium with various concentrations of EGF. Cells were harvested after 5 days, and surviving cells were counted (Coulter Counter, Coulter Electronics, Hialeah, FL). For glucose consumption assays, the cells were similarly plated, and, when they reached 40 rt 5% confluency, the medium was changed to IMEM (11 mM glucose) with various EGF concentrations. After 2 days, samples of medium were taken for glucose measurements, and a cell count was performed. Twenty-four h later, medium samples were withdrawn again, and all cells were harvested and counted. This method was used because preliminary experiments showed that in the first few days after plating, cell numbers are too small to detect changes in glucose concentrations accurately. Each assay was done in triplicate. Growth inhibition studies of MDA-468 bv EGF. 2-DG. and the combined effects of these agents were also performed using the microculture 3(4,5-dimethylthiazol-2-yl)-2,5-diphenyltetrazoli~m bromide (MTT) assav (22). 1.5 x lo3 cells were utated in 96-well plates, and various concentration combinations of 2-DG and EGF were added. Growth inhibition was quantiiied 5 days later, following the reduction of the tetrazolium dye to a formazan by the surviving cells and measuring the absorbance at 570 nm using a V,., plate reader (Molecular Devices). Each of these assays was repeated twice. Preparations of Cells /or MRS-Cells were grown to 80-90% confluency, harvested with 0.5% trypsin, 0.2% EDTA, centrifuged at 4 “C at 730 x g for 10 min, and washed three times in the growth medium. Perfused cells were cast in agarose threads, as described previously (23). Cells were suspended in a low gelling temperature agarose (SeaPlaque, FMC BioProducts, Rockland, ME) by mixing approximately 1.0 ml of cell pellet (2 + 0.5 x 10’ cells) with 1.0 ml of 1.8% agarose in phosphate-buffered saline at 37 “C and extruding the mixture through 0.5-mm internal diameter tubing into a screw cap Wilmad lo-mm tube. The solid threads were concentrated without compression (no more than 2.0 ml of mixture were used) at the bottom of the tube by using an insert with inlet and outlet tubing. The inflow tube (also 0.5-mm internal diameter) was placed near the bottom of the tube, and the outflow was directed into openings in the insert. In the perfusion experiments, IMEM with physiological glucose concentration (4 mM) was used, it was buffered with 20 mM Hepes, and the pH was maintained at 7.5-7.6. A peristaltic pump (Pharmacia P-3, Pharmacia LKB Biotechnology Inc.) maintained a constant perfusion rate of 0.9 ml/min at 37 “C. This system of perfused cells was used in ‘iP MRS experiments to studv the effects of EGF, added to the perfusion solution, on the energy status of the cells, as well as in experiments designed in order to investigate glucose metabolism under physiological conditions. The diffusion of “C-methylated chicken egg albumin from agarose gel threads was investigated as follows. The threads were prepared in the usual way using 1.0 ml of agarose solution (1.8%) and 1 ml of 2% cold egg albumin containing 0.2 pCi of the labeled material. The threads were perfused under identical conditions as in the perfusion experiments with EGF, and the radioactivity of the effluent was monitored by liquid scintillation counting (Tri-Carb 2000CA, Packard). For i3C MRS studies, cell suspensions were used, as [6-13C]2-DG was very scarce and perfusion studies were therefore impractical. The
cells were harvested and washed as described above, and a 0.4-ml of cell pellet was transferred to a lo-mm MRS tube and diluted to 1.8 ml with IMEM (11 mM glucose, 10% FCS). D20 (0.1 ml) and 1.65 mg of [6-13C]2-DG in 0.1 ml of medium were added to make a final concentration of 5 mM [6-i3C]2-DG in 2.0 ml of cell suspension. Oxygen was continuously bubbled at the tube bottom in order to oxygenate the cells and to prevent settling. Because 2-DG uptake and phosphorylation is very rapid at 37 “C and the [6-13C]2-DG had to be added outside the magnet, before tuning and shimming, these experiments were conducted at 30 “C. Magnetic Resonance Spectroscopy and Data Analysis-“P and 13C MRS spectra were recorded on a Varian XL-400 at 162 and 100 MHz, respectively, and were analyzed on a Varian ADS 4000 data station. In 31P MRS studies, 3-s repetition time and 60 ’ flip angle were used and 200 transients were accumulated in each spectrum. For 31P spectra, both peak heights and peak integrals were measured, and for each signal an average ratio of the integrals to heights was calculated (average of 18 to 26 spectra for the various series of experiments). Peak heights were then multiplied by this ratio, and the normalized integral values thus obtained corresponded to the metabolite concentrations. This method was found to be more appropriate than simple integration because significant base line variations rendered integrals alone inaccurate, MRS data acquisition and processing were performed with identical parameters throughout all experiments, and measurements with external reference (methylphosphonic acid) showed that quantitative MRS data were thus reproducible. Since loss of cells during thread casting and insertion of the perfusion insert into the NMR tube may occur, a protein assay was used to standardize the actual amount of cells used in each experiment and to make quantitative comparisons feasible. i3C MRS spectra consisted of a series of 100 scans with a 2-s repetition time and 66 0 flip angle and proton decoupling. The use of ]6-13C]2-DG gave spectra with good resolution and signal to noise ratio; therefore datawere analyzed by peak integrals. Since the initial concentration of 16-13C12-DG that was added was 5 mM in all i3C MRS experiments, absohrte concentrations could be calculated. Protein assays were performed and MRS data were normalized for studvina the effects of EGF on the ohosohorvlation rates of 2-DG and comparing between MDA-468 and MCF-7-cells. All experiments were repeated three times, the data variations were up to lo%, and means and SD. are presented. Protein, Glucose, and Lactate Determinations-Protein content was measured after the cells were sonicated (Heat Systems, Ultrasonic, Inc.) on ice for 5 min, by the bicinchoninic acid assay, based on the reaction of protein with Cu*+, and spectrophotometric quantitation of protein at 562 nm. Glucose and lactate concentrations were determined in perchloric acid-treated samples, immediately following collection. Glucose concentrations were measured by the hexokinase enzymatic assay, utilizing the coupled enzyme reaction catalyzed by hexokinase and glucose-6-phosphate dehydrogenase, and measuring the product, NADH, at 340 nm. Lactate levels were determined utilizing the formation of NADH (and pyruvate) from lactate in the presence of hydrazine (to trap formed pyruvate) and excess of NAD. The reaction is catalyzed by lactate dehydrogenase, and the lactate concentrations were calculated from the-absorbance at 340 nm. Absorbance measurements were oerformed with Shimadzu UV-160 spectrophotometer (Shimadzu Co.). Statistical analyses were performed with the paired, double-tailed, Student’s t test (p < 0.05). RESULTS
Effects of EGF on Survival and Glucose Metabolism--The effects of EGF on the growth of cultured MDA-468 and MCF7 cells are shown in Fig. 1. In both cell lines, the same number of cells were plated under identical conditions, and the control MCF-7 cells showed a higher proliferation rate compared to that of the MDA-468 cells. A dose-dependent inhibition of MDA-468 by EGF was demonstrated, and the ICsO after 5 days was 50 rig/ml (8.2 x lo-’ M), while EGF had no effect on the growth of MCF-7 cells. When MDA-468 were incubated in medium with different glucose concentrations, the effects of EGF were modified, at any given concentration of EGF, growth inhibition was diminished as the glucose concentration increased (Fig. 2). Thus, high glucose provided a protective mechanism against EGF toxicity in MDA-468 cells.
EGF Effects on Breast Cancer Cells
6
I
q q
13643
MCF-7W-T MDA-466
1
2
0
EGF
FIG. 1. EGF
effects
20
10
on
the
Cont.
growth
60
30-
100
0
10
EGF
(nglml)
of
20
cultured
MDA-468
FIG. 2. EGF
effects on at different glucose
30 Cont.
the growth concentrations
40
SO
60
(rig/ml)
of MDA-468 in the
cells medium.
cul-
25 x lo4 cells were plated in 25-cm2 flasks, and EGF was added 24 h later. Direct counts of cells harvested with trypsin after 5 days are presented.
The cells were plated as described in Fig. 1, and direct counts were performed after 5 days. The results were standardized to 100% of the control cells.
The early effects of EGF on growth of MDA-468 cells were observed by MTT assays, and growth inhibition was followed for 3 days (see also the 31P MRS studies below). EGF, 100 rig/ml, inhibited cell growth to 71.6 f 6.9% of the controls as soon as 24 h after addition. On the 2nd and 3rd days, growth inhibition by 100 rig/ml EGF was 45.8 f 5.3%, and 32.9 + 4.5% of the controls, respectively. The effects of EGF on glucose consumption of cells, cultured in IMEM with 11 mM glucose, is demonstrated in Fig. 3 and Table I. It was calculated by the change in glucose concentrations over a period of 24 h, when the cells were SO90% confluent, and is expressed relative to the average number of cells during that period. This method enabled accurate measurements of differences in glucose levels, which had not been completely depleted. In the control studies, MCF-7 cells utilized 10% more glucose than MDA-468 cells @ > 0.05). However, there were marked differences in the utilization of glucose following EGF exposure; here also no effect was observed with MCF-7 cells, even at very high EGF concentrations (up to 100 rig/ml), but MDA-468 cells reacted by increasing their glucose consumption rates as EGF concentration increased. Thus, at the concentration of 50 rig/ml (I&,) EGF, MDA-468 utilized 78% more glucose than untreated cells (JJ = 0.01). It should be noted that in these experiments MDA468 cells were inhibited by EGF even in cultures where glucose was not completely depleted, and therefore the toxicity of EGF cannot be solely attributed to lack of glucose and cell starvation. To investigate this phenomenon in cultured MDA-468 cells, a “conditioned” medium assay was performed, i. e. cells were
plated in used media, with and without replenishment of glucose. Three sets of cells were grown in 150-cm* flasks in IMEM containing 25, 11, and 4 mM glucose (30 ml in each flask). When the cells reached confluency, the media were collected and filtered, and glucose and lactate concentrations were determined. New cells were then plated in 96-well plates in the used medium with and without EGF (50 rig/ml) and in used medium replenished with glucose to the initial concentrations, in the absence and presence of EGF. Cells plated in fresh media served as controls. Four days later, when the control cells reached 60 + 5% confluency, glucose levels were measured, and the survival was determined by a MTT assay. The results are shown in Table II. In all three sets of initial glucose levels, replenishment with glucose was followed by a marked elevation of survival compared to the cells grown in used media (p < 0.005 for the three sets). On the other hand, glucose could not restore the viability to that of cells grown in fresh medium (p < 0.01 in the three sets), demonstrating that its protective effect is only partial. Cells grown in used media of both 25 and 11 mM initial glucose concentrations sets had similar survival; however, there was a significant decrease in survival of cells grown in the used medium (0 glucose) of 4 mM initial glucose concentration @ < O.Ol), but upon replenishment to 4 mM glucose there was a lo-fold survival increase. This finding indicates that maintaining even low glucose levels has protective effects when other nutrients are used, and waste products are accumulating. EGF reduced cell survival both in used and replenished media @ < 0.05 in all cases, except in used media in 4 mM glucose).
and
MCF-7
cells.
tured
EGF Effects on Breast Cancer Cells Similarly to the results obtained in the glucose consumption experiment (Fig. 3 and Table I), the toxicity of EGF was apparent even without complete glucose depletion. However, toxicity of EGF added to used media was not negated by increasing glucose levels, in contrast to the results obtained
EGF
Cone
(nglnl)
FIG. 3. EGF effects on glucose consumption in MDA-468 and MCF-7 cells. Cells were plated at 11 mM IMEM, and EGF was added at the log phase. Glucose utilization was calculated from the decrease in glucose concentrations over a period of 24 h relative to the average number of cells in that period.
when cells were incubated in fresh medium (Fig. 2). Note that at each set of initial glucose concentrations, the final glucose concentration in the replenished cells was lower than in cells grown in fresh media. In all three sets, there were significant differences in the glucose level between cells grown in fresh, used, and replenished media (p < 0.01 in all cases). This indicates that in used media replenished with glucose, the cells have to consume more glucose than cells grown in fresh media, pointing to changes in the control of utilizing substrates. There were no significant differences in glucose concentrations in comparing cells grown with and without EGF, but since the number of cells in EGF media was much lower, the enhanced utilization of glucose induced by EGF is apparent. The lactate concentrations in the plating media (both used and replenished) was 10.9, 9.8, and 5.4 mM for 25, 11, and 4 mM initial glucose concentrations, respectively, and the pH was 7.32, 7.27, and 7.21, respectively. In all three sets of initial glucose concentrations there was the same pattern of effects following glucose replenishment and the addition of EGF, and the readings for the controls were identical for 11 and 4 mM glucose, with 9% increase in the controls of 25 mM glucose. It seems therefore that neither lactate accumulation nor pH changes were responsible for the survival differences. Effects of 2-DG-2-DG is a competitive inhibitor of glucose uptake and of the glycolytic pathway. We have investigated whether the use of 2-DG would increase EGF toxicity using the MTT assay (Table III). The photometric readings of the control cells were standardized to lOO%, and the results represent the fraction of living cells. It can be seen in Table III that the growth inhibition by EGF in the absence of 2DG, determined with MTT assays, was very similar to the results obtained from direct counting of surviving cells (Fig. 1). 2-DG without EGF had a dose-dependent inhibitory effect on MDA-468, and at low 2-DG concentrations the toxicity was reduced by increasing the glucose levels in the growth medium. However, at 5 mM 2-DG, the inhibition was similar at the three glucose concentrations (35.2-39.6% of controls). When EGF was added to the growth medium, enhanced inhibition was found, but the combined effects of the two agents were not synergistic, since the inhibitions were not greater than those expected for independent measurements.
TABLE I EGF effects on glucose concentration and glucose consumption in cultured MDA-468 and MCF-7 cells 25 x lo4 cells were plated in 25-cm2 flasks in 10 ml of IMEM (11 DIM glucose). Twenty-four h later, the medium was replaced with new medium containing EGF. After 2 days, initial glucose concentrations were determined, and cells were counted (in flasks plated only for this purpose). The final glucose concentrations were measured 24 h later, and the cells were counted. Presented are the averages of the two cell counts. Glucose consumption was calculated from the differences in its concentrations (in 10 ml), relative to the average number of cells. Each result is the mean of three measurements, with 4.6-11.5% S.D. range. Cell number Initial glucose Total glucose Relative glucose Final glucose EGF concentration concentration consumption (X 106) concentration consumption m&l rnM pmo1/24 h pmo1/24 h X 106cells w/ml MDA-468 cells 0 1.423 7.89 7.19 7.0 4.92 2 10 20 50
100 MCF-7 0
1.352 1.191 0.933 0.645
0.581
7.81 7.78 7.69 7.62 7.63
7.12 7.07 7.01 7.07 7.10
6.9 7.1 6.8 5.5 5.3
5.10 5.96 7.29 8.53 9.12
4.50 4.37 4.15 4.12 4.08 4.09
15.9 15.6 16.2 16.7 16.3 16.5
5.03 4.95 5.04 5.15 5.04 5.06
cells 3.164
6.09
2
3.154
10
3.217
20 50 100
3.242 3.238 3.261
5.93 5.77 5.79 5.71 5.74
EGF Effects on Breast Cancer Cells TABLE
13645
2DG-6-p
II
Effects of conditioned media and EGF on MDA-468 cells MDA-468 cells were plated in 150-cm* flasks in 30 ml of IMEM (10% FCS), in three sets of initial glucose concentrations: 25, 11, and 4 mM. At confluency, the media were collected and filtered, and glucose concentrations were determined. Cells were then plated in 96-well plates as follows: 1500 cells in 200 pi/well, in: (a) fresh medium containing the initial glucose concentrations, for control measurements, (5) used medium, (c) used medium containing EGF (50 ng/ ml), (d) used medium replenished with glucose to the initial corresponding concentration, (e) used medium, replenished with glucose, and containing EGF. Immediately thereafter, glucose levels on the plating media were measured. Four days later, samples were collected for final glucose concentrations, and MTT assays were performed. Results of glucose concentrations are means of three measurements, with 5.2-12.3% S.D. In MTT assays, the readings of the controls (of each initial glucose concentration set) were standardized to lOO%, and each results is the mean of 24 readings, with SD. range of 2.111.4%. Initial gIucose concentration
Plating
GlUCCXX
llb?diUtll
~~~o~
Fresh Used Used Replenished Replenished Fresh Used Used Replenished Replenished Fresh Used Used Replenished Reulenished
24.7 17.3 17.3 24.8 24.8 11.2 4.3 4.3 11.0 11.0 4.1
l7lM
EGF (50 rig/ml)
Final glucose concentration
Survival
mM
% control
21.6 12.2 12.5 19.3 19.7 8.9 1.1 1.0 7.4 7.6 2.6
100 21.9 7.5 67.9 14.9 100 21.7 5.1 71.3 12.7 100 6.1 3.5 65.6 13.9
mhf
25
11
4
+ + + + + +
0 0 3.9 3.9
0 0 1.2 1.1
TABLE III Combined effects of EGF and 2-DG on the survival of MDA-468 at different glucose concentrations of the growth medium 1.5 x lo3 cells were plated in 96-well plates, and 24 h later various concentration combinations of 2-DG and EGF were added. Growth inhibition was measured 5 days later by MTT assay, and control photometric readings were standardized to 100%. The means of 24 readings for each combination (duplicates of 12 readings in each assav). with 4.5-10.7% SD.. are nresented. ,
rl~
.
EGF Glucose m‘u
mM
4
0 0.2 1 5 0 0.2 1 5 0 0.2 1 5
11
25
@g/ml)
2-DG 0
1
10
50
100.0
66.1
57.6 50.2 36.5 100.0 79.9 54.3 35.2 100.0 95.2 79.3 39.6
54.9 49.8 32.2 82.3 76.5 49.6 33.9 100.0 90.8 73.7 38.9
57.4 52.2 47.1 25.9 70.9 53.5 46.8 26.4 78.1 62.8 66.6 35.3
49.3 41.2 39.3 23.3 55.7 44.2 37.3 22.2 67.8 46.8 38.9 27.4
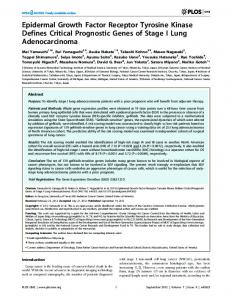
31PMRS Studies-Prior to studying the effects of EGF on MDA-468 cells cast in agarose threads, it was mandatory to establish that the polypeptide could penetrate the threads and reach the cells (24). Since it is difficult to measure diffusion of a protein into the threads, we performed the reverse experiment, i.e. elution of a protein from the threads, using Wlabeled egg albumin, since the rates of diffusion in both
4 d
I PME !
FIG. 4. 3’P MRS of perfused MDA-468 cells in agarose threads (line broadening = 20 Hz). Chemical shifts were determined relative to ,TATP = -18.7 ppm. For perfusion conditions and aquisition parameters, see “Experimental Procedures.” a and b, EGF perfusion experiment. a, control; b, 200 rig/ml EGF perfusion, after 36 h. c, perfusion with 2-DG and EGF. Prior to MRS experiments, the cells had been incubated for 24 h with 20 rig/ml EGF, the perfusion solution contained 20 rig/ml EGF, and this spectrum was recorded 30 min after adding 5 mM 2-DG. PME, phosphomonoester; DPDE, diphosphodiester.
directions should be the same. It was found that 95% of albumin was eluted from the threads within 2 h. Given the difference in the molecular weight between EGF (6,100) and albumin (45,000) and the length of the perfusion experiments with EGF (24-36 h, with first analysis after 3 h), it can be concluded that EGF experiences no hindrance for access to the cells. 31P spectra of perfused MDA-468 cells are shown in Fig. 4a.The phosphate metabolite signals are assigned according to previously reported data (25). It is noteworthy that neither phosphodiesters (glycerophosphocholine and glycerophosphoethanolamine) nor phosphocreatine was detected, in contrast to findings of MRS studies of most other human breast cancer cells (17, 26-29). MDA-468 cells were perfused with IMEM (11 mM glucose) containing EGF for periods of up to 36 h. Before adding EGF to the perfusion solution, the cells were perfused for 3 h to maintain steady state conditions.
EGF Effects on Breast Cancer Cells Two perfusion experiments were performed with each of the EGF concentrations (10, 20, 50, 100, and 200 rig/ml), and no significant spectral changes were found. In this system, dead cells result in signal reduction, but even at the very high concentration of 200 rig/ml (32.8 X lo-’ M) EGF did not induce decreased ATP levels or signal loss (Fig. 4b). Trypan blue exclusion dye examinations of the cells at the end of the perfusion experiments showed that 90 + 5% of them were viable. The perfusion system was also used for simultaneous MRS and glucose consumption and lactate production studies, thus correlating the energetic status with glucose metabolism under physiological conditions. Glucose utilization and lactate output were compared between MDA-468 and MCF-7 cells (Table IV), using a perfusion solution containing physiological glucose concentrations (4 mM). In control experiments, cells were perfused with growth medium without EGF, and glucose and lactate levels were measured in the effluent for 8 h. In EGF experiments, the cells were perfused for 3 h with medium without EGF, and samples were collected for glucose and lactate determinations, followed by the addition of EGF (50 rig/ml) to the perfusion solution. Samples were taken again after 3 h of EGF perfusion. Glucose (2.75 f 0.06 mM and 2.52 f 0.07 mM for MDA-468 and MCF-7 cells, respectively) and lactate (2.14 f 0.08 mM and 2.27 f 0.05 mM for MDA-468 and MCF-7 cells, respectively) concentrations were stable in the effluent of the control perfusions. Following EGF perfusion, there were no significant changes in glucose and lactate levels in MCF-7 cells (p = 0.44 and 0.21, respectively), but as expected, EGF induced remarkable alterations in glucose metabolism in perfused MDA-468, but no MRS spectral changes (see Fig. 4b). The utilization of glucose significantly exceeded that of MCF-7 cells (p = 0.001). Glucose consumption increased by lOO%, and EGF induced MDA-468 to extract 63% of the glucose content of the perfusion solution (glucose concentration decrease from 3.94 mM in the perfusion solution to 1.47 mM in the effluent). However, no deleterious effects were detected, probably due to the continuous supply of glucose and the removal of waste materials. It seems therefore that the inhibitory effects of EGF of tumor cells with high
EGF
effects
of glucose
TABLE IV and lactate concentrations 468 and MCF-7 cells
in perfused
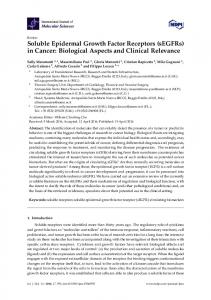
EGFR are an in vitro phenomenon, which is due to the profound effects of EGF on glucose metabolism of these cells and the lack of physiological conditions in traditional growth inhibition assays. The increase in glucose consumption that was induced by EGF in MDA-468 cells much exceeded the increase in lactate output. The ratio of the changes of lactate and glucose concentrations (between perfusion solution and effluent) was 1.71 (lactate/glucose) in the control measurements and following EGF perfusion it was 1.01. This increase may indicate an effect of EGF on the ratio of glycolysis to respiration or an increased use of the glucose carbon skeleton for protein and DNA synthesis. 3’P MRS Studies with 2-DG-The phosphorylation of 2DG and the subsequent changes in phosphate metabolites were also studied by 31P MRS. Perfusion with IMEM containing 5 mM 2-DG resulted in the appearance and gradual increase of the signal of its phosphorylated product, 2-DG-6P, in the phosphomonoester region (Fig. 4~). Concomitant with 2-DG-6-P accumulation, there was an initial decrease in inorganic phosphate (PJ, probably because it was used for phosphorylation. Later on, with continuous glycolysis inhibition and compromised metabolic status, the Pi peaks increased well above control levels. The other major change in 31P spectra was a gradual depletion of ATP, which was utilized in 2-DG phosphorylation and not replenished. These events were markedly modified by EGF. In Fig. 5, a comparison between the normalized concentrations of these metabolites in perfused MDA-468 cells, with and without EGF, is shown. In cells exposed to EGF, 2-DG-6-P accumulated faster and to a greater magnitude, and ATP depleted completely, while it only decreased at a lower rate to 40% of
“51 C 0 z k
1.0
z-DG-6.P Control PI Control ATP Control Z-GG-6-P EGF
--b --t
MDA-
2 x 10’ cells were cast in agarose threads and perfused with IMEM containing 4 mM glucose, at a constant rate of 0.9 ml/min, at 37 “C. Following 3 h of initial perfusion, three samples of each perfusion solution and effluent were collected at 30-min intervals, and thereafter EGF (50 rig/ml) was added to the perfusion solution. Three h later, effluent samples were similarly collected. The means and S.D. of three different experiments (total of nine measurements) are presented. Lactate levels in the perfusion solution were very low, in the measurement error range. The striking decrease in glucose concentration in the effluent of MDA-468 following the addition of EGF, concomitant with elevation of lactate concentration, demonstrates the enhanced utilization of glucose from the perfusion solution by these cells in the presence of EGF. In control experiments, glucose and lactate concentrations were stable in cell perfused for 8 h without EGF (see “Results”). MDA-468 Glucose
cells Lactate
MCF-7 Glucose
rnM Perfusion solution Effluent, control Effluent, with EGF
cells Lactate
mM
3.94 f 0.03
3.96 f 0.03
2.71 f 0.04
2.11 + 0.04
2.53 k 0.05
2.25 f 0.04
1.47 + 0.07
2.49 + 0.06
2.46 + 0.05
2.28 k 0.03
200 +
3
'Y
time
(min)
FIG. 5. ‘lP MRS of perfused MDA-468 cells; EGF effects on the changes in metabolites levels following 2-DG exposure. The effects of EGF were studied by incubating the cells with 20 ng/ ml EGF for 24 h prior to the MRS experiment, and the perfusion solution (IMEM, 11 mM glucose) contained 20 rig/ml EGF and 5 mM 2-DG. In the control experiments, only 2-DG was used. The metabolite levels are presented in relative concentrations by their normalized integral per mg of cellular protein. The time scale starts at the point at which 2-DG reached the cells. The open arrow indicates the replacement of the perfusion solution with IMEM without 2-DG in the control experiment; the dark arrow indicates that point in the EGF experiment.
EGF Effects on Breast Cancer Cells
13647
[6-‘3C]-Z-DG
0.08 -
+
0.06 -
DO-&P
EGF
(no
EGF)
0.04 0 EGF) EGF 0.02 -
0.00
FIG. 6. “C and
MRS phosphorylation
of a suspension of [6-“Cl2-DG
of MDA-468 cells; uptake in the presence of EGF.
MDA-468 cells were incubated with EGF (20 rig/ml) for 24 h and then were harvested and suspended in 2 ml of IMEM (11 mM glucose) supplemented with [6-i3C]2-DG (5 mM) in the NMR tube. MRS measurements were then immediately started, and the phosphorylation of [6-W]2-DG was detected. Continuous series of recorded spectra are presented (each spectrum was accumulated for 4.3 min), and the gradual increase in the [6-i3C]2-DG-6-P signal is demonstrated. For acquisition parameters, see “Experimental Procedures” (line broadening = 5 Hz). The signals are assigned as [6-i3C]2-DG and [6-‘C]2-6-P (both have 01- and p-anomers) relative to acetone which resonates at 30.2 ppm from tetramethylsilane.
2.DO-6-P
(no
EGF
EGF
0.M 200
3 00
time(min)
FIG. 7. ‘“C
MRS
of
the effects of [6-‘%]2-DG
of
EGF on the by MDA-468
uptake cells.
and
For experimental conditions and acquisition parameters, see “Experimental Procedures.” The time scale starts at the point of addition of [6‘“C]2-DG to the cell suspension. Concentrations were calculated by peak integrals, according to the initial [6-i3C]2-DG concentration (5 mM), and normalized to cellular protein for comparison with MCF-7 cells. The initial phosphorylation rates for three different experiments were calculated and are given in Table V. phosphorylation
rate
the effects of [6-%]2-DG
of EGF on the uptake by MCF-7 cells.
and
For experimental conditions and acquisition parameters, see “Experimental Procedures.” The time scale starts at the point of addition of [6-i3C] 2-DG to the cell suspension. Concentrations were calculated by peak integrals, according to the initial [6-i3C]2-DG concentration (5 mM), and normalized to cellular protein for comparison with MDA-468 cells. The initial phosphorylation rates for three different experiments were calculated and are given in Table V. phosphorylation
rate
TABLE V effects
on 2-DG
phosphorylation MCF-7
MDA-468 Control EGF (20 rig/ml) MCF-7 Control EGF (20 rig/ml)
0.02
100
0
time(min)
of
rates and in MDA-468
and
cells
nmol glucose/min
EGF)
(no EGF)
\G+
3
2-DG phosphorylation rates were determined by i3C MRS studies of intact metabolizing cells in suspensions. Means and S.D. of calculated initial rates from three different experiments for control and EGF-treated cells of both cell types are presented. 2-DG phosphorylation rate
0.08 +
200
100
FIG. 8. 13C MRS
EGF
0.10
+ 0
the initial level in the control cells. Upon reperfusion with IMEM without 2-DG, there was only a partial rejuvenation of ATP when EGF was used, and, in the control cells, ATP returned to baseline levels. The results of these experiments
X
mg protein
360.6 + 17.3 712.5 f 23.4 403.4 408.7
+ 19.6 + 21.2
are in accordance with the growth inhibition assays which were described above, showing that EGF enhanced 2-DG toxicity. i3C MRS Studies-Quantitative measurements of the rates of uptake and phosphorylation of 2-DG (and by analogy glucose) and EGF effects on these rates were performed by i3C MRS using [6-i3C]2-DG (Fig. 6). Prior to i3C MRS measurements, a baseline 31P spectrum was obtained. Since [6-i3C] 2-DG was very scarce, these experiments were conducted in cell suspensions for relatively short periods (up to 260 min). At the end of each experiment, trypan blue tests were done, and the viability of the cells was found to be 90-95%. For studying EGF effects, the cells were incubated for 24 h with 20 rig/ml EGF in IMEM (11 mM glucose, 10% FCS). In each experiment, cells from the same passage were used as controls. Each set of experiments was repeated three times, and the means and S.D. of the calculated rates are presented. The time courses of the depletion of 2-DG and the accumulation of 2-DG-6-P in MDA-468 and MCF-7 cells are shown in Figs. 7 and 8, respectively. Since the curves were not simple expo-
13648
EGF Effects on Breast Cancer Cells
nentials, the initial phosphorylation rates were calculated by the equation: initial rate = In 2 X IOO/Lh,where loo is the concentration at plateau, and tlh is the time to half this level. This method enabled determination of reaction rates in intact metabolizing cells. The results are shown in Table V and demonstrate again the differences in the effects of EGF on glucose metabolism between MDA-468 and MCF-7 cells. Incubation with EGF had no effect on phosphorylation rates in MCF-7 cells, while it accelerated it by 97% in MDA-468 cells (p = 0.0001). Similar to glucose utilization measurements described above, MCF-7 cells exhibited higher rates in the control experiments, but following exposure to EGF, 2-DG phosphorylation was 74% faster in the MDA-468 cells (p = 0.0001). DISCUSSION
Carcinogenesis results from two or more mutations that transform a normal cell into a cancer cell by converting protooncogenes into oncogenes (30). This transformation results in changes in growth characteristics of the cell from that of controlled growth to autocrine response to growth factors (31). Thus, the key role played by growth factors in carcinogenesis and tumorigenesis is being widely investigated. In the present studies, the intriguing observation that EGF, a known stimulator of cell growth at the usual low concentrations at which such factors operate, had caused cell death at higher concentrations, was explored. The phenomenon of stimulation/toxicity of EGF was related to a threshold model (8, 11). According to this model, the presence of receptors above a critical threshold number may be the cause of the marked EGF-induced growth inhibition. However, no mechanistic explanation was advanced to explain this behavior. Negative correlations have also been found between estrogen receptor (ER) levels and EGFR (9), and EGF was proposed to be the important regulatory agent rather than estrogen in estrogen receptor-negative tumors. Degani and co-workers (18) described estrogen receptor-positive breast cancer cells with increased glucose consumption and lactate production after estrogen treatment. The cells which were used, T47D, have a relatively low EGFR (9). Thus, one could assume that: 1) in EGFR-high, ER-low cells (with poor prognosis), EGF is the important growth-regulatory agent (as suggested above), as well as the important glucose metabolism regulator, and these two mechanisms may be interlinked; 2) in EGFR-low, ER-high cells (good prognosis), estrogen is the important regulatory agent. Quite independently of these findings, EGF is known to increase glucose transport (4-6). All these considerations led us to investigate the effects of EGF on the glucose metabolism of MDA-468 cells. Using MRS of perfused cells enabled continuous monitoring of both glucose utilization and energetic status, and the use of [6-‘C]2-DG provided the actual rate of its phosphorylation. We found substantial stimulation of glucose metabolism by EGF in these cells; its consumption was increased concomitantly with elevated lactate production. When the cells were grown in high glucose media, the inhibitory effect of EGF was diminished, thus, abundant glucose exhibited a protective effect from EGF. By comparison, EGF induced no changes in the glucose consumption of the low EGFR MCF-7 cells. In spite of all the above-mentioned results, the MDA-468 cells died after EGF exposure before glucose was completely depleted from the growth medium. Therefore, the EGF inhibitory effect cannot be solely attributed to the lack of glucose and starvation. This is supported by the findings that replen-
ishment of used media with glucose improve cell survival, but could not restore it to control survival. The striking differences in the response to EGF exposure between cells cultures and physiological perfusion experiments may indicate that in uiuo EGF has different effects than those observed in the in vitro studies. The stagnating conditions of growth studies in cultured cells, without continuous supply of nutrients and removal of waste materials, may be responsible for artifacts. Clinical observations that high EGFR tumors are correlated with high metastatic potential and poor prognosis (9, 32, 33) support this hypothesis. In these in vivo conditions, endogenous EGF apparently stimulates the cancer cells and the disease progresses, in contrast to its inhibitory effects in cultured cells. The perfusion studies also contributed to showing changes in the pathways of glucose utilization. When EGF was added to the perfusion medium and glucose supply was unhampered, the increase in glucose consumption was accompanied by a relatively smaller increase in lactate production (Table IV). This may mean that more energy was produced through the more efficient respiratory process or that EGF induced increased synthesis of proteins and DNA. 31P MRS showed no measurable changes in ATP levels concomitant with glucose metabolism alterations induced by EGF, implying that energy production and utilization were balanced. Similar regulation of cellular energetics was reported upon stimulation of glucose metabolism by estrogens in T47D cells (27). 2-DG was used in these studies both for evaluation of its toxicity, as well as a tool to detect and quantitate EGF effects on its phosphorylation. It is noteworthy that EGF (50 rig/ml) minimized the protective effects of high glucose levels on the toxicity of low concentrations of 2-DG (0.2 mM). The competitive inhibition between glucose and 2-DG leading to severe neurological toxicity due to hypoglycemia and the inability to obtain sufficient drug concentrations limit the clinical use of 2-DG (14, 34). Thus, in tumors characterized by increased glucose metabolism and low ER, such as MDA-468 cells, in which hormonal therapy is very ineffective, low dosages of 2DG potentiated with EGF may be of clinical relevance. These studies showed that EGF markedly enhanced glucose utilization in MDA-468 cells and that its inhibitory effect was confined to culture assays and was not found in perfused experiments. Taken together, these results may indicate that the in vitro toxicity of EGF is mediated through its effects on glucose metabolism. REFERENCES 1. Cohen, S. (1962) J. Biol. Chem. 237,1555-1562 2. Carpenter, G. (1987) Annu. Reu. Biochem. 56,881-914 3. Yarden, Y., and Ullirich, A. (1988) Annu. Rev. Biochem. 57,443478 4. Barnes, D., and Colowick, S. P. (1976) J. Cell. Physiol. 89, 633640 5. Boerner, P., Resnick, R. J., and Racker, E. (1985) Proc. Natl. Acad. Sci. U. S. A. 82, 1350-1353 6. Inman, W. H., and Colowick, S. P. 0. (1985) Proc. Natl. Acad. Sci. U. S. A. 82, 1346-1349 7. Carpenter, G., and Cohen, S. (1979) Annu. Reu. Biochem. 48, 193-216 8. Filmus, J., Pollak, M. N., Cailleau, R., and Buick, R. N. (1985) Biochem. Biophys. Res. Commun. 128,898-905 9. Davidson, N. E., Gelmann, E. P., Lippman, M. E., and Dickson, R. B. (1987) Mol. Endocrinol. 1, 216-223 10. Filmus, J., Trent, J. M., Pollak, M. N., and Buick, R. N. (1987) Mol. Cell. Biol. 7. 251-257 11. Kawamoto, T., Mendelsohn, J., Le, A., Sato, G. H., Lazar, C. S., and Gill, G. N. (1984) J. Biol. Chem. 259. 7761-7766 12. Vickers, PI J., Dickson; R. B., Shoemaker, R., and Cowan, K. H. (1988) Mol. Endocrinol. 2, 886-892 13. van der Burg, B., Rutteman, G. R., Blankenstein, M. A., de Laat,
EGF Effects on Breast Cancer Cells
14. 15. 16. 17. 18. 19. 20. 21. 22.
S. W., and van Zollen, E. J. J. (1988) J. Cell. Physiol. 134, 101-108 Demetrakopoulos, G. E., Linn, B., and Amos, H. (1982) Biochim. Biophys. Acta 6, 65-74 Horton, R. W., Meldrum, B. S., and Bachelard, H. S. (1973) J. Neurochem. 2 1,507-520 Cohen, J. S., Lyon, R. C., and Daly, P. F. (1989) Methods Enzymol. 177,435-452 Lyon, R. C., Cohen, J. S., Faustino, P. J., Megnin, F., and Myers, C. E. (1988) Cancer Res. 48,870-877 Neeman, M., and Degani, H. (1989) Cancer Res. 49, 589-594 Navon, G., Lyon, R. C., Kaplan, O., and Cohen, J. S. (1989) FEBS Lett. 247,, 86-90 Soule, H. D., Vasquez, J., Long, A., Albert, S., and Brennan, M. (1973) J. Natl. Cancer Inst. 51, 1403-1409 Cailleau, R., Olive, M., and Cruciger, Q. V. J. (1978) In Vitro 14, 911-915 Alley, M. C., Scudiero, D. A., Monks, A., Hursey, M. L., Czerwinski, M. J., Fine, D. L., Abbott, B. J., Mayo, J. G., Shoemaker, R. H., and Boyd, M. R. (1988) Cancer Res. 48,589-601
23. Foxall, D., Cohen, J. S., and Mitchell, J. B. (1984) J. Exp. Cell Res. 154, 521-529 24. Righetti, P. G. (1989) J. Biochem. BioDhvs. Methods 19. l-20 25. N&on, G., Ogawa, S., Shulman, R., and kamane, T. (1977) Proc. Natl. Acad. Sci. U. S. A. 74, 87-91 26. Evanochko, W. T., Ng, T. C., and Glickson, J. D. (1984) Magn. Reson. Med. 1, 508-534 27. Neeman, M., and Degani, H. (1989) Proc. Natl. Acad. Sci. U. S. A. 86, 5585-5589 28. Boddie, A. W., Frazer, J. W., Tomasovic, S. P., and Dennis, L. (1989) J. Surg. Res. 46, 90-97 29. Daly, P. F., and Cohen. J. S. (1989) Cancer Res. 49. 770-779 30. Weinberg, R. A. (1989) Cancer Res. 49,3713-3721 ’ 31. Reddv. E. P.. Skalka. A. M.. and Curran. T. (1988) The Oncogene Handbook,‘Elsevier Science Publishing Co., Inc:, New York 32. Sainsbury, J. R. C., Farndon, J. R., Sherbet, G. N., and Harris, A. L. (1985) Lancet 364-366 33. Neal, D. E., March, C., Bennet, M. K., Abel, P. D., Hall, R. R., Sainsbury, J. R. C., and Harris, A. L. (1985) Larzcet 366-368 I 34. Jain, V. K., Kalia, U. K., Sharma, R., Maharajan, V., and Menon, M. (1985) Znt. J. Radiat. Oncol. Biol. Phys. 11,943-950