Solid Earth, 7, 115–128, 2016 www.solid-earth.net/7/115/2016/ doi:10.5194/se-7-115-2016 © Author(s) 2016. CC Attribution 3.0 License.
Trail impact monitoring in Rocky Mountain National Park, USA J. Svajda1 , S. Korony1 , I. Brighton2 , S. Esser2 , and S. Ciapala3 1 Matej
Bel University, Banska Bystrica, Slovakia Mountain National Park, Estes Park, Colorado, USA 3 Academy of Physical Education, Krakow, Poland 2 Rocky
Correspondence to: J. Svajda (
[email protected]) Received: 23 October 2015 – Published in Solid Earth Discuss.: 6 November 2015 Revised: 11 January 2016 – Accepted: 13 January 2016 – Published: 26 January 2016
Abstract. This paper examines impacts of increased visitation leading to human trampling of vegetation and soil along several trails in Rocky Mountain National Park (RMNP) to understand how abiotic factors and level of use can influence trail conditions. RMNP is one of the most visited national parks in the USA, with 3.3 million visitors in 2012 across 1075 km2 and 571 km of hiking trails. 95 % of the park is designated wilderness, making the balance between preservation and visitor use challenging. This research involves the application of trail condition assessments to 56 km of trails to determine prevailing factors and what, if any, connection between them exist. The study looked at a variety of inventory and impact indicators and standards to determine their importance and to develop a baseline condition of trails. The data can be used for future comparison and evaluation of development trends. We found that trail widening (mean trail width 88.9 cm) and soil loss (cross-sectional area 172.7 cm2 ) are the most visible effects of trail degradation. Further statistical analyses of data identified the role and influence of various factors (e.g., use level and topography). Insights into the influence of these factors can lead to the selection of appropriate management measures to avoid or minimize negative consequences from increased visitation.
1
Introduction and problem overview
Recreational activities in protected areas have been increasing and have created the need to improve understanding of the impacts and management (Hammitt et al., 2015; Chrisfield et al., 2012; Monz et al., 2013). The trampling of vegetation and soil by hikers (Cole, 1989; Bright, 1986) is often a cause of land degradation in national parks. Recreational
trails are often a source of negative impacts on the persistence of threatened, endangered, rare and keystone species (Ballantyne and Pickering, 2015). Trampling, especially in tundra ecosystems, may lead to altered environmental conditions, including decreased infiltration capacity and nutrient cycles in soils, and more extreme temperatures at the soil surface (Chrisfield et al., 2012). To date, large amounts of research are focused on the impact of visitors on soil and vegetation including monitoring and modeling (Dixon et al., 2004; Farell and Marion, 2001; Monti and MacKintosh, 1979; Godefroid and Koedam, 2004; Özcan et al., 2013). A variety of efficient methods for evaluating trails and their resource conditions, especially in sensitive and vulnerable areas (alpine environment), have been developed and described in the literature (Jewell and Hammitt, 2000; Hawes et al., 2006; Ólafsdótirr and Runnström, 2013; Tomczyk and Ewertowski, 2011; Brevik and Fenton, 2012). A review by Marion and Leung (2001) concluded that the point sampling method provides accurate and precise measures of trail characteristics that are continuous or frequent (e.g., tread width). Ground-based surveys are fairly accurate (with GPS), use existing staff and resources and provide immediate results. However, there are also some limitations of point sampling techniques – e.g., time consumption (Hill and Pickering, 2009). Parks and protected areas are often set aside for conservation and recreational purposes, and have become some of the most sought-after vacation areas in the world, creating conflicts between conservation and recreation. In the US, National Park Service (NPS) units receive approximately 280 million visitors per year (IRMA, 2014). Couple this extensive visitation with the mission of the NPS, which is to protect and preserve both natural and cultural resources while
Published by Copernicus Publications on behalf of the European Geosciences Union.
116
J. Svajda et al.: Trail impact monitoring in Rocky Mountain National Park, USA
providing for the freest opportunities for public enjoyment and recreation, and conflict between conservation issues and visitor use occur. Striking a balance between these competing goals often forces land managers to make compromises between impacts from visitation and protection of resources. Parks apply a wide range of tools and techniques to manage impacts from visitor use. By providing a network of formal trails, protected areas can limit negative trampling impacts and prevent widespread degradation that would be caused by a less structured pattern of visitor activity and traffic (Marion et al., 2011). To balance resource protection and visitor experience, several frameworks have been developed to guide management decisions (Manning, 1999). These frameworks use numerical standards for biophysical or social condition indicators and set limits to define the critical threshold between an acceptable and unacceptable change in resources and social conditions (Kim and Shelby, 2006). Baseline data and future monitoring can also be used to compare past conditions with future conditions. If actual conditions are above quantitatively defined standards, managers can effectively deal with these factors to improve or stabilize the conditions. Such visitor impact monitoring programs can provide managers reliable information necessary to evaluate resource protection policies, trends, strategies and measures (Vistad, 2003). However, many authors have stated that the impacts of visitors on the ecological conditions of an area are influenced more by visitor behavior, park infrastructure and the resilience of soil and vegetation, and are less related to overall use levels (McCool and Lime, 2001). For example sustainable usage levels depend on a range of factors, including extent of trail hardening and frequency of trail maintenance (Washburn, 1982). To better understand use and associated resource impacts, a visitor and trail monitoring program needs a diverse set of indicators that evaluate changes over time (Leung and Marion, 2000). Most commonly used trail indicators include the number, length and density of visitor-created trails, along with tread. Soil loss, the most ecologically significant trail impact, is less common, though it can be efficiently determined by measuring maximum incision or cross-sectional area at points along the trail (Olive and Marion, 2009). Other problems include visitors participating in a variety of recreation activities (hiking, camping, horseback riding), each of which contributes a unique impact on natural resources (vegetation, soil, water, wildlife). Some authors have compared and assessed the impacts of different recreation activities (hiking, mountain biking, horse riding) on vegetation and soils (e.g., Pickering et al., 2010; Wilson and Seney, 1994). There is limited research on the ecological impacts of tourism and recreation in some parts of the world (Barros et al., 2015; Zdruli, 2014; Ibáñez et al., 2015). Existing studies document a range of impacts on vegetation, birds and mammals, including changes in plant species richness, composition and vegetation cover and the tolerance of wildlife to visitor use. Comparable studies, especially in high alpine enSolid Earth, 7, 115–128, 2016
vironments, are needed to predict the effects of topographic and climatic extremes (Nepal, 2003). Conducting formal trail surveys provides information for a number of important management questions and decisions, though it is commonly overlooked due to funding constraints. Information about trail conditions can be used to inform the public about trail status, justify staffing and financing, evaluate the acceptability of existing resource conditions, understand relationships between trail impacts and the controlling mechanism, identify and select appropriate management actions and determine the effectiveness of implemented actions. This paper presents research and assessment of impacts on the trail network of the Rocky Mountain National Park (RMNP) study area to understand how abiotic factors such as grade, elevation, surface type and trail slope alignment can influence trail conditions. We also want to understand how visitation type (e.g., people vs. horses) and level of use can impact trails. Finally, our last goal is to determine which factors are prevailing and what connection between factors exist. This would help managers reduce the effects of visitor use on natural resources of the park.
2
Study area
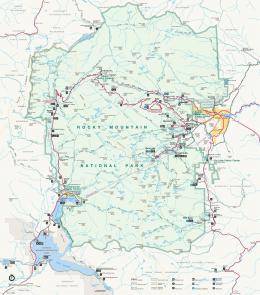
Rocky Mountain National Park (RMNP) is located in northern Colorado (USA), comprises an area of 1075 km2 and provides access to wild places for visitors to recreate and experience solitude and outstanding beauty (Fig. 1). The elevation range within the park spans from 2316 to 4346 m, which creates a highly complex and steep topographic gradient, allowing for diverse vegetation communities. The underlying geology of this mountain is also highly complex, though it is primarily granitic. Severe climatic conditions and thin soils have created a fragile environment at higher elevations throughout the park (alpine tundra encompasses onethird of the park area) that is neither resistant nor resilient to human use (RMNP, 2013). The historical annual temperature average (1900–2002) is 1.5 ◦ C, and the annual average precipitation for the same period is 400 mm yr−1 . Over the past several decades temperatures have been increasing +0.8 ◦ century−1 (Gonzalez, 2012) and precipitation patterns have been highly variable, with increased drought years followed by extreme rain events and record snowpacks, causing varying degrees of freeze/thaw actions and greater spring runoff events. Yearly visitation over the past decade has hovered around 3 million visitors a year, with the total number of recreation visitors in 2012 being 3.3 million. The busiest tourist season is the summer months (June–August), but in recent years, the heaviest visitation days have occurred during the weekends of late summer and early fall due to the elk rut and foliage change. Overnight as well as day use has steadily increased over the past several decades, resulting in more impacts from visitation (RMNP, 2001). www.solid-earth.net/7/115/2016/
J. Svajda et al.: Trail impact monitoring in Rocky Mountain National Park, USA
117
game trails used by Native Americans, then explorers and herders and was finally adopted by the National Park Service. A lot of the trails were built or improved by the Civilian Conservation Corps (CCC) during the 1930s. These trails span the entire elevation gradient, running across valley bottoms and ridgetops. RMNP is divided into ten planning units based on similar physiographic features and visitor use patterns (RMNP, 2000). Evaluated trails are situated in several planning units (Fig. 1; Front Range, Longs Peak, Wild Basin, Roaring River, Trail Ridge). Each planning unit is specified with trail project priorities (safety of visitors, mitigation of resource damage) and cost estimates. Since 2008 there have been new Federal Trail Data Standards, which include four fundamental concepts that are cornerstones of effective trail planning and management (trail type, trail class, managed use, designed use). Although not entirely new, these interagency concepts provide an integrated means to consistently record and communicate the intended design and management guidelines for trail design, construction, maintenance and use.
3
Figure 1. Study area showing all eight evaluated trails – abbreviations of the names of trails: Saddle (SDLL), Ute West (UTEW), Mount Ida (IDAM), Ute East (UTEE), Flattop Mountain (FLTM), Old Fire (OFIR), Boulder Field (BLDF) and Thunder Lake (THLA).
Monitoring visitor use focused on vegetation and soil impacts is important in alpine areas, climbing areas and riparian areas where the information can help with determining thresholds of degradation (NPS, 2010). The loss of soil and vegetation from high use and unacceptable behavior of visitors are a principal concern. Besides educating visitors about principles (e.g., staying on the trail) and monitoring visitor use numbers, the results of this research can help inform park managers. Early studies focused on the impact of visitors on natural ecosystems in RMNP (e.g., Willard and Marr, 1963) and stated the need to develop a system of evaluating day use destination sites, document trends in day use, develop guidelines, install flip signs, voluntary permits or a self-registration system and set concrete use limits (e.g., for parking). Later works are devoted especially to the monitoring of trail impacts (Summer, 1986; Benninger-Truax et al., 1992; KellerLynn, 2006; Pettebone et al., 2009). Approximately 571 km of hiking trails provides visitors with recreation opportunities throughout the park (RMNP, 2013; Fig. 1). Some of the current trail system evolved from www.solid-earth.net/7/115/2016/
Methods and analysis
During August 2013, we applied impact assessment procedures to eight formal and informal trails (56 km) within RMNP. They represent a subset of the entire trail system and were selected because they provide a unique look at the variation of impacts along an elevation gradient and visitor use gradient, while representing the greatest possible spatial extent of RMNP. Some of the trails (or sections of trails) are used not only by hikers but also by other user groups such as equestrians (about 80 % of the total trails maintained in the park are open to commercial and private stock use). Four trails were evaluated on the north side of the park: Saddle trail (SDDL), Ute trail West (UTEW), Ute trail East (UTEE) and Mount Ida trail (IDAM), three on the south side of the park: Flattop Mountain trail (FLTM), Boulder Field trail (BLDF) and Thunder Lake trail (THLA). Also one short section of an informal trail, Old Fire trail (OFIR), was measured with detailed sampling (30.5 m interval) – see Table 1a, b and Fig. 2. 3.1
Trail sampling
Trail sampling for each of the eight trails involved taking replicable measurements at a number of determined locations in order to calculate overall estimations of trail conditions. We used point sampling methods to generate accurate and precise data on trails’ conditions (Marion et al., 2011). This was used to develop useful and appropriate baseline data to monitor selected environmental indicators and standards of quality. A 152 m point sampling interval, determined using GPS (Garmin GPSmap 60 CSx) and a measuring wheel (Rolatape RSL 204-5), was selected and employed based on Solid Earth, 7, 115–128, 2016
118
J. Svajda et al.: Trail impact monitoring in Rocky Mountain National Park, USA
Table 1. (a) Inventory and (b) impact indicators summarized by trails. Use levels: L refers to low, M refers to medium, H refers to high; use types: F refers to foot, A refers to all hikers and horse riders. (a) Inventory indicators Trail section
Ute trail West Boulder Field trail Flattop Mountain trail Mount Ida trail Saddle trail Thunder Lake trail Ute trail East
Length
Sample count
Elevation (m a.s.l.)
Trail grade (%)
Landform grade (%)
Slope alignment angle (◦ )
km
N
Mean
Mean
6.55 8.90 5.78 8.13 11.84 7.63 6.60
43 57 36 46 76 50 53
3477 3458 3417 3657 3220 3171 3218
8 9 13 13 12 13 12
23 19 20 27 20 25 21
67 53 56 63 53 54 50
3374 177
11 9
22 12
56 20
2932
12
22
55
Trail system mean Standard deviation
7.92 2.03
Old Fire trail
1.42
48
Mean
Use levels
Use types
Mean M H H L–M L–M L–M L
F A A F A A F
H
F
Slope ratio
Rugosity (cm)
Mean
Mean
0.42 0.53 0.64 0.57 0.65 0.80 0.56
2.74 3.05 2.97 2.90 2.36 2.39 3.00
0.60 0.86
2.77 0
0.53
2.16
(b) Impact indicators Trail section
Trail width (cm)
Width difference (cm)
CSA (cm2 )
Maximum incision (cm)
Mean
Mean
Mean
Mean
100.58 115.32 115.37 56.26 90.91 82.50 71.50
54.86 23.88 23.93 10.54 15.11 11.18 25.78
452 671 606 297 387 342 394
7.19 8.64 8.41 6.78 6.27 6.17 7.32
Trail system mean Standard deviation
90.35 20.47
23.61 14.04
450 129
7.25 0.89
Old Fire trail
76.15
30.43
290
5.54
Ute trail West Boulder Field Flattop Mountain trail Mount Ida trail Saddle trail Thunder Lake trail Ute trail East
the findings, efficiency and feasibility of replication and was thought to best represent the length of each trail. This interval provided the appropriate number of sample points, allowing statistical analysis and the ability to characterize trail conditions. 3.2
Trail condition indicators
At each sample point, a single transect was established perpendicular to the trail tread, with endpoints defined by the most visually obvious outer boundary of trampling-related disturbance. These boundaries are defined by pronounced changes in ground vegetation height (trampled vs. untrampled), cover, composition or when vegetation cover is reduced or absent and by disturbance to organic litter or lichen (intact vs. pulverized). We adopted criteria described by Monz (2000) and Lance et al. (1989) for measurement consideration and definition of the trail tread boundaries of the trail as receiving the majority (>95 %) of traffic (Marion et Solid Earth, 7, 115–128, 2016
al., 2011). To assess trail width, the distance between these disturbance-associated boundaries was measured with a tape rule (Stanley Lever Lock 25◦ ). The difference between intended vs. actual trail widths was assessed as trail width difference according to trail data standards. Additionally the grade of the trail and the dominant fall line (landform grade) was recorded at each transect location. Trail slope alignment angle (TSA) was assessed at each sample point as the difference in compass bearing between the prevailing landform slope orientation (i.e., aspect) and the trail’s alignment at the sample point. For example, the TSA of a contour-aligned trail would equal 90◦ , while a true fall-line trail (aligned congruent to the landform slope) would have a TSA of 0◦ . Trail grade, trail slope and alignment angle were measured using a clinometer and compass (Suunto Tandem). The quotient of trail grade and landform grade was calculated as a slope ratio (IMBA, 2004). To assess tread surface composition we used the following categories: bare soil, vegetation, organic litter, roots, rock and gravel, wood and www.solid-earth.net/7/115/2016/
J. Svajda et al.: Trail impact monitoring in Rocky Mountain National Park, USA
119
ion, 2009). To establish a cross section, temporary stakes were placed at positions that enabled a cord measure to be stretched along what was believed to represent the original land surface for fall-line trails or the post-construction tread surface for constructed side-hill trails. Vertical measurements from the cord measure to the trail substrate surface were taken at a fixed interval of 12 cm for all trails. This measure included soil loss from water or wind erosion, soil compaction of the trail substrates and soil displacement from traffic. CSA was calculated for each sample point using spreadsheet formulas in Microsoft Excel, where V is the vertical distance measurements and L is the interval on the horizontal taut line (Cole, 1983). Trail condition measures were calculated for each trail and for all trails combined, including area of disturbance, CSA and mean trail width and depth. CSA =
Figure 2. (a) Use of natural materials to limit the trail can prevent it from widening and formation of secondary trails – BLDF. (b) Change of tread substrate characteristics is connected also with elevation – in the forest zone, exposed tree roots are more commonly found – FLTM. (c) The highest sections of IDAM are barely recognizable due to very small visitation. (d) OFIR is an example of a social trail with high traffic; some sections were maintained in the past. (e) One of the typical examples of how orientation and slope of trail have impacted on the width of the trail – SDDL. (f) THLA is used by hikers and stock as well – one of the effects is expansion of the width and depth of the trail with the consequent loss of soil. (g) UTEE – a problem with erosion is notable, particularly in the section down from Timberline Pass. (h) Secondary treads are more common in areas with lower grades – UTEW.
man-made materials. For each category, the percent of trail width was recorded to the nearest 10 %. An occurrence of additional secondary trails that paralleled the survey trail at each sample point was marked as well as previous remarkable side-hill construction work at each sample point. To determine whether there was soil loss (cm2 ) at a sample point, we employed a fixed interval method crosssectional area (CSA) analysis, adopted from Cole (1983) and described as the variable CSA method (Olive and Marwww.solid-earth.net/7/115/2016/
(V1 + 2V2 + . . . + 2Vn + Vn+1 ) 2×L
The ruggedness or roughness of the trail surface was calculated for each sample point from measurements taken to compute CSA estimates as the standard deviation of the vertical measurement at each transect. To ensure repeatability of this work, digital photographs were taken with a camera (Panasonic DMC-SZ1, 16.1 megapixel resolution) along with recording GPS coordinates at each transect for all future resampling events which occur along the same transects. Photographs were also utilized to create two additional attributes for each trail transect – trail substrate class and trail borders. Based on field observation by trail maintenance staff, use levels (high > 100 users a day; medium 50– 100 users a day; low < 50 users a day) and type of use (hiking only/hiking + stock use) were assigned to each trail segment. Elevation of each sample point was recorded and three main categories according vegetation cover created: above 3505 m a.s.l. alpine tundra, 3505–2896 m a.s.l. spruce/fir and below 2896 m a.s.l. lodgepole pine (RMNP, 2001). 3.3
Data analysis
Spatial data were transferred from GPS to EasyGPS and maps were created in ArcGIS Desktop and ArcMap 10.2 applications. Statistical data were transferred to Microsoft Excel and to statistical system SPSS 19 for further analysis. Originally, all suitable statistical procedures (ANOVA, nonparametric ANOVA Kruskal–Wallis test, two-sample Mann– Whitney test, correlations (both classic Pearson and robust Spearman) and linear regression analyses) were performed to investigate relationships between dependent and independent variables. Nonparametric tests were used because the data do not meet normality assumptions. Analysis focused primarily on understanding the dependent variables of interest: trail width and CSA soil loss. Linear regression modeling as dependence of soil loss variables to grade variables was done, but the results were unsatisfactory (e.g., regression coefficient of determination below 10 %). That is why we Solid Earth, 7, 115–128, 2016
120
J. Svajda et al.: Trail impact monitoring in Rocky Mountain National Park, USA
Table 2. Number and percent of sample points by inventory indicator category. Grade
Number of sample points
Percentage
46 78 83 67 38 31 18
12.74 21.61 22.99 18.56 10.53 8.59 4.99
Totals 361 Mean = 11.4 %; median = 9 %; range = 0–100 %
100
0–2 % 2–6 % 6–10 % 10–15 % 15–20 % 20–30 % 30–100 %
Slope alignment
Number of sample points
Percentage
0–22◦ 22–45◦ 45–68◦ 68–90◦
23 92 118 128
6.37 25.48 32.69 35.46
Totals Mean = 55.9◦ ; median = 60◦ ; range = 0–90◦
361
100
Number of sample points
Percentage
22 209 130
6.09 57.89 36.01
Elevation 2743–2896 m a.s.l. (lodgepole pine) 2896–3505 m a.s.l. (spruce/fir) 3505–3962 m a.s.l. (alpine tundra)
Totals 361 100 Mean = 3356.7 m a.s.l.; median = 3385.4 m a.s.l.; range = 2743–3962 m a.s.l.
also tested robust nonparametric data mining decision trees implemented in SPSS to gain multivariate models of tread widths vs. all relevant indicators. In SPSS there are three types of decision trees: CHAID, CRT and QUEST. For our purpose, CRT (classification and regression tree) appeared to be the most suitable. From all used potential indicators of tread width, five indicators are used in CRT: use level, name of trail, trail substrate – vegetation, elevation and maximum incision. 4
Results
Table 3. Number and percent of sample points by impact indicator category. Indicator
Sample points
Percentage
75 128 108 39 11
20.78 35.46 29.92 10.80 3.05
Trail width (cm) 0–61 61–91 91–122 122–152 > 152
Mean = 89.9; median = 88.9; range = 0–193 Trail width difference (cm) −76 to −15 −15 to +15 15–76 76–152
15 143 190 13
4.16 39.61 52.63 3.60
Mean = 22.6; median = 20.3; range = −45 to +147 Maximum incision (cm) 0 0–1.3 1.3–2.5 2.5–7.6 7.6–12.7
3 1 16 209 107
0.83 0.28 4.43 57.89 29.64
3 291 61 6
0.83 80.61 16.90 1.66
Mean = 7.1; median = 6.3; range = 0–19 CSA soil loss (cm2 ) 0 0–645 645–1290 > 1290
Mean = 444.5; median = 387; range = 0–1509.6 Mean trail depth (cm) 0 0.0–1.3 1.3–2.5 2.5–7.6 7.6–12.7 > 12.7
3 7 76 251 23 1
0.83 1.94 21.05 69.53 6.37 0.28
Mean = 4.1; median = 3.8; range = 0–12.9
4.1
Trail condition indicators
We assessed 361 sample points along a total length of 55.43 km for seven trails within RMNP. One short informal trail (1.42 km, 48 points) was surveyed, though we excluded this trail from the overall statistical analyses since sampling methods differed slightly. Approximately 13 % of the trails are located on flat terrain (0–2 % grade), 24 % of the trail system has grades exceeding 15 % and only 5 % of the trails have grades exceeding 30 %. The mean grade of trails is 11.4 %. It should be noted that many of the excessively steep alignments have constructed rock steps or ascend exposed rock faces, which are not susceptible to soil loss. Regarding the trail’s slope alignment angle, only 6 % of trails are aligned within 22◦ of the landform Solid Earth, 7, 115–128, 2016
aspect or fall line. The mean elevation of the evaluated points is 3356.7 m a.s.l. (Table 2). The trail width maximum is 193 cm, with a mean of 89.9 cm. Fewer than 14 % of the trails exceed 120 cm in width. The mean trail width difference was 56.9 cm, indicating that trails are generally wider than intended by trail data standards. Incision ranged from 0 to 19.1 cm, with a mean of 7.1 cm. Cross-sectional area soil loss measurements (CSA) ranged from 0 to 1510 cm2 , with a mean of 444.5 cm2 . A more representative measure of trail incision is provided by calculating the mean trail depth from the vertical measures www.solid-earth.net/7/115/2016/
J. Svajda et al.: Trail impact monitoring in Rocky Mountain National Park, USA
121
Table 4. Summary statistics of tread width (TW), tread width difference (DIF), maximum incision (MIC) and soil loss (CSA) by use level, side-hill trails and use type. SD refers to standard deviation. Use level
Low
Figure 3. Mean trail substrate cover as a proportion of transect (tread) width. Middle
recorded to compute CSA. This measure ranged from 0 to 12.9 cm, with a mean of 4.1 cm (Table 3). Finally, assessments of the tread substrate as a proportion of transect width are used to characterize the typical trail system substrates described in Fig. 3. 4.2
High
Trail conditions by classic analyses
Results for different use level (low–medium–high) are highly significant for medians of trail width (63.5 vs. 96.5 vs. 114.3 cm), maximum incision (5.7 vs. 6.3 vs. 7.6 cm) and soil loss (251.6 vs. 393.5 vs. 574.2 cm2 ); Kruskal–Wallis test, p