INFECTION AND IMMUNITY, Dec. 2004, p. 7247–7256 0019-9567/04/$08.00⫹0 DOI: 10.1128/IAI.72.12.7247–7256.2004 Copyright © 2004, American Society for Microbiology. All Rights Reserved.
Vol. 72, No. 12
Transcriptional Profiling of Lipopolysaccharide-Induced Acute Lung Injury Samithamby Jeyaseelan,1,2* Hong Wei Chu,1,2 Scott K. Young,1 and G. Scott Worthen1,2 Division of Respiratory Infections, Department of Medicine, National Jewish Medical and Research Center,1 and Division of Pulmonary Sciences and Critical Care Medicine, University of Colorado School of Medicine,2 Denver, Colorado Received 14 July 2004/Returned for modification 13 August 2004/Accepted 23 August 2004
Mortality associated with acute lung injury (ALI) induced by lipopolysaccharide (LPS) remains high in humans, warranting improved treatment and prevention strategies. ALI is characterized by the expression of proinflammatory mediators and extensive neutrophil influx into the lung, followed by severe lung damage. Understanding the pathogenesis of LPS-induced ALI is a prerequisite for designing better therapeutic strategies. In the present study, we used microarrays to gain a global view of the transcriptional responses of the lung to LPS in a mouse model of ALI that mimics ALI in humans. A total of 71 inflammation-associated genes were up-regulated in LPS-treated lungs, including a chemokine, LPS-induced CXC chemokine (LIX), whose role in the induction of ALI is unknown. Most of the inflammatory genes peaked at 2 h post-LPS treatment. Real-time reverse transcription-PCR confirmed the LPS-induced up-regulation of selected genes identified by microarray analysis, including LIX. The up-regulation of LIX, tumor necrosis factor alpha, and macrophage inflammatory protein 2 was confirmed at the protein level by enzyme-linked immunosorbent assays. To determine the role of LIX in the induction of ALI, we used both exogenous LIX and a LIX blocking antibody. Exogenous LIX alone elicited a neutrophil influx in the lungs, and the anti-LIX antibody attenuated the LPS-induced neutrophil accumulation in the lungs. Taken together, the results of our study demonstrate for the first time the temporal expression of inflammatory genes during LPS-induced ALI and suggest that early therapeutic intervention is crucial to attenuate lung damage. Moreover, we identified a role for LIX in the induction of ALI, and therefore LIX may serve as a novel therapeutic target for the minimization of ALI. the full spectrum of inflammatory mediators that are expressed during the course of ALI remains unknown. Secondly, the temporal pattern of individual mediators alone or in combination is largely unknown. A better understanding of the pathogenesis of ALI may result from understanding the temporal expression levels of inflammatory genes that contribute to ALI. In this context, several previous studies have shown that a rodent model reproduces several features of ALI in humans (12, 21), including neutrophil influx and severe lung damage. With the advent of oligonucleotide microarray technology, it is now possible to analyze global gene expression patterns in the lungs, which may provide novel insights into the pathogenesis of ALI at the molecular level. In the past, oligonucleotide microarrays have been used extensively to study human neutrophils that are important for the induction of ALI in humans after stimulation with Escherichia coli LPS (23, 36). Furthermore, a recent study compared global gene expression patterns in mouse lungs with ALI for wild-type C57BL/6 and inducible nitric oxide synthase (NOS2) gene-disrupted mice at a single time point (24 h) after LPS exposure (25). However, no previous studies have compared global differences in gene expression in the lungs after LPS stimulation in a temporal manner. Therefore, the goal of the present study was to use oligonucleotide microarrays to explore the alterations in the transcriptional program of the lung in a mouse model of ALI induced by E. coli LPS. The present study provides important information relating to the changes in inflammatory gene expression in mouse lungs in a temporal manner upon aerosolization with LPS from 1 to 24 h, which could serve as a basis for future investigations on the role(s) of various gene products in the
Acute lung injury (ALI) or its severe form, adult acute respiratory distress syndrome (ARDS), is an important cause of mortality in the human population (4). ALI is characterized by an extensive neutrophil influx into the lung, the expression of proinflammatory mediators, and damage of the lung epithelium and endothelium (15, 31, 38). Despite significant advances made in the past few decades, the mortality associated with ALI remains unchanged (35). Therefore, improved treatment and prevention strategies are warranted to minimize the mortality associated with this disease. The onset of ALI is often an early symptom of multiple organ failure associated with sepsis, which is associated with elevated blood levels of endotoxin or lipopolysaccharide (LPS) derived from gram-negative bacteria. LPS has therefore been considered the principal component in the induction of ALI (5). Recognition of LPS by a host receptor(s) is the first step in a multistep sequence leading to the activation of a plethora of signal transduction cascades in a variety of lung cells. The downstream effectors of these pathways then result in the production of a variety of inflammatory mediators, including proinflammatory cytokines and chemokines, adhesion molecules, reactive oxygen species, and nitric oxide, by various cell types in the lungs (7, 22, 27). Despite considerable progress in elucidating these mediators, their role in the development of ALI is not well understood for several reasons. First, it is likely that * Corresponding author. Mailing address: Department of Medicine, National Jewish Medical and Research Center, 1400 Jackson St., Neustadt D-403, Denver, CO 80206. Phone: (303) 398-1640. Fax: (303) 270-2319. E-mail:
[email protected]. 7247
7248
JEYASEELAN ET AL.
pathogenesis of this important respiratory disease which is associated with severe lung inflammation. MATERIALS AND METHODS Animals. Female C57BL/6 mice (8 to 10 weeks old) were purchased from Harlan Sprague-Dawley (Indianapolis, Ind.). Toll-like receptor 4 (TLR4) mutant mice (TLR4mt; C3H/HeJ) were purchased from Jackson Laboratory (Bar Harbor, Maine); this mutation results in resistance to the pathophysiological effects of LPS (26). Wild-type C3H/HeN mice (TLR4wt; Harlan Sprague-Dawley) were used as controls for TLR4mt mice. All animal experiments were conducted in accordance with National Jewish Medical and Research Center Review Boardapproved protocols. All animals were maintained under specific-pathogen-free conditions. Reagents. E. coli LPS (O111:B4), hexadecyl trimethylammonium bromide (HTAB), KH2PO4, K2HPO4, O-dianisidine, sterile distilled water, phosphoric acid, and Tween 20 were purchased from Sigma Chemical Co. (St. Louis, Mo.). Phosphate-buffered saline (PBS) was purchased from Mediatech Inc. (Herndon, Va.), and complete protease inhibitor tablets were purchased from Roche Biochemicals (Indianapolis, Ind.). The chemokine LIX, an anti-mouse LIX antibody (MAB433) and its isotype control antibody (MAB0061), capture antibodies, biotinylated blocking antibodies, and cytokine standards were purchased from R&D Systems (Minneapolis, Minn.). Twenty-gauge shielded intravenous catheters were obtained from Beckton Dickinson (Sandy, Utah), and heparin was purchased from Abott Labs (North Chicago, Ill.). TaqMan fluorogenic probes and PCR kits were purchased from PE Applied Biosystems (Foster City, Calif.), and TMB substrate-H2O2 were obtained from Kirkegaard & Perry Laboratories (Gaithersburg, Md.). Isotonic (0.9%) saline was purchased from Baxter Corp. (Deerfield, Ill.). All experiments were performed with LPS-free glass- and plasticware. Exogenous LIX administration. The LPS-induced CXC chemokine (LIX) (3 g dissolved in 60 l of PBS), antibody-treated LIX (3 g of LIX was incubated with 30 g of an anti-LIX or isotype-matched control antibody on ice for 1 h; the final volume was 60 l), or 60 l of PBS (as a control) was administrated intratracheally to mice, and bronchoalveolar lavage fluid (BALF) and lungs were collected at 2, 8, and 24 h posttreatment. These mice were not exposed to LPS. This concentration of LIX was used because LPS induces approximately 3 g of LIX in the lungs in response to 300 g of LPS/ml for 20 min in a mouse model of LPS-induced ALI (S. Jeyaseelan and G. S. Worthen, unpublished data) Model of LPS-mediated ALI. The model of LPS instillation into the lung was previously described in detail (24). Briefly, mice were exposed to 300 g of LPS (from strain O111:B4)/ml in 0.9% saline or to 0.9% saline alone as a control by aerosolization for 20 min. One, 2, 4, 8, 12, and 24 h after LPS treatment, mice were sacrificed for BALF and lung collection. In another set of experiments, mice were pretreated with either an anti-LIX antibody or its isotype-matched control antibody (rat immunoglobulin G2B) 2 h prior to LPS exposure. The mice were anesthetized with Avertin (333 mg/kg of body weight), and 30 g of antibody (dissolved in 60 l of PBS) or 60 l of PBS (as a control) was administered intratracheally into the lungs. We used a concentration of 30 g/mouse based on the maximal inhibition of LPS-induced LIX activity in vivo (Jeyaseelan and Worthen, unpublished data). Antibody-treated mice were then exposed to 300 g of LPS/ml for 20 min and were sacrificed at 8 or 24 h post-LPS treatment for the collection of BALF and lungs. BALF collection. BALF was collected as previously described (24). Briefly, BALF was collected by cannulating the trachea with a 20-gauge shielded intravenous catheter, instilling 0.8 ml of sterile PBS containing 0.2 U of heparin and complete protease inhibitor (one tablet per milliliter) four times, and collecting the fluid by gentle aspiration. A total of 3.0 ml of BALF was centrifuged for 5 min at 400 ⫻ g in a Southern Cytospin centrifuge (Shandon Inc., Pittsburgh, Pa.) onto Superfrost/plus microscopic slides (Fisher Scientific Inc., Pittsburgh, Pa.), and BALF cells were stained by the Diff-quick method (Fisher Scientific Inc.). The resulting fluid was passed through a 0.45-m-pore-size filter and used immediately or stored at ⫺70°C for measurements of LIX, tumor necrosis factor alpha (TNF-␣), and macrophage inflammatory protein 2 (MIP-2) by enzyme-linked immunosorbent assays (ELISAs). Lung tissue harvesting for cytokine measurement. Mice were humanely sacrificed, and their lungs were excised. The whole lungs were snap frozen and homogenized, and the resulting homogenates were incubated on ice for 30 min and then centrifuged at 300 ⫻ g for 20 min. The supernatants were harvested, passed through a 0.45-m-pore-size filter, and used immediately or stored at ⫺70°C for measurements of LIX, TNF-␣, and MIP-2 by ELISAs. Lung MPO assay. A myeloperoxidase (MPO) assay, an index of neutrophil sequestration in the lungs, was performed as described previously (1). After
INFECT. IMMUN. BALF collection, isolated whole lungs were weighed and frozen at ⫺70°C, and 50 mg of tissue was homogenized in 1 ml of HTAB buffer (5 g of HTAB in 1 liter of MPO buffer; MPO buffer contains 6.8 g of KH2PO4 and 8.7 g of K2HPO4 in 1 liter of water) for 30 s and then vortexed for 15 s. Thereafter, 1 ml of homogenate was transferred into a microcentrifuge tube and centrifuged at 20,000 ⫻ g for 4 min. Seven microliters of supernatant was transferred into a flat-bottomed 96-well plate, and 200 l of O-dianisidine hydrochloride solution (16.7 mg of O-dianisidine in 100 ml of a solution containing 90 ml of water and 10 ml of MPO buffer) was added immediately prior to reading the optical density at 450 nm and again 60 s later. The MPO activity was calculated by using the following formula: units of MPO activity in each well ⫽ (the change in absorbance [between 0 and 60 s]/time [min]) ⫻ 1.13 ⫻ 10⫺2. To convert the units of MPO activity into milligrams of tissue, we divided the units of MPO per well by the amount (milligrams) of tissue added to each well (for example, if the tissue/ buffer ratio was 50 mg/ml, then there would be 1 mg of tissue in each well). Histopathology and tissue staining. Mouse lungs were perfused and fixed with Streck tissue fixative overnight at room temperature (Streck Laboratories). The lungs were embedded in paraffin, and sections (5 m thick) were stained with hematoxylin and eosin. Total RNA isolation and quality check. Fresh lungs were harvested at designated time points, and total RNAs were isolated by the use of Trizol reagent (Invitrogen Inc., Carlsbad, Calif.) and then stored at ⫺70°C until use. An additional RNA purification step was conducted with an RNeasy kit (Qiagen, Valencia, Calif.), and a DNase I treatment was performed according to the manufacturer’s recommendations (Ambion Co., Austin, Tex.) to eliminate contaminating DNAs for target preparation and real-time PCR. All RNA samples with a ratio of A260 to A280 between 1.8 and 2.1 were used for experiments. The quality of the RNA was also checked by running 300 ng of each sample on a Lab-On-A-Chip (Caliper Technologies Corp., Mountain View, Calif.) which was evaluated on a bioanalyzer (Agilent Technologies, Palo Alto, Calif.), and only nondegraded RNA samples were used for microarray and reverse transcriptionPCR (RT-PCR) experiments. cRNA (target) preparation and GeneChip processing. A mouse Moe430 microarray set that represents approximately 23,000 mouse genes and expressed sequence tag clusters was used to determine the changes in mRNA expression in response to E. coli LPS. Briefly, 5 g of the total RNA was used as a starting material for each reaction. Single-stranded and then double-stranded cDNAs were synthesized from the poly(A⫹) mRNA present in the purified total RNA by use of a SuperScript double-stranded cDNA synthesis kit (Invitrogen Corp.) and poly(T) nucleotide primers that contained a sequence recognized by T7 RNA polymerase. The resulting double-stranded cDNAs were used as templates to generate biotinylated cRNAs by in vitro transcription reactions with a Bio-Array High-Yield RNA transcript labeling kit (Enzo Diagnostics Inc., Farmingdale, N.Y.). Twenty micrograms of each resulting biotinylated cRNA was fragmented into strands of 35 to 200 bases in length according to the manufacturer’s protocol (Affymetrix GeneChip expression analysis technical manual). Subsequently, 10 g of this fragmented cRNA (target) was hybridized at 45°C with rotation for 16 h (Affymetrix GeneChip Hybridization Oven 320) to probe sets present on a Moe430A array. The GeneChip arrays were washed and then stained with streptavidin-phycoerythrin on an Affymetrix GeneChip Fluidics 450 station, followed by scanning on a GeneArray scanner (Hewlett-Packard, Palo Alto, Calif.). We employed several parameters to ensure the quality of our targets (cRNAs). (i) Ratios of 3⬘ to 5⬘ sequences of glyceraldehyde-3-phosphate dehydrogenase (GAPDH) and -actin of ⱖ2 were used, as suggested by Affymetrix. Briefly, the GeneChip system (Affymetrix) utilizes polyadenylation-complementary oligonucleotides as primers for the labeling of cRNAs. The polyadenylation is usually located downstream of the 3⬘ end of transcripts. When an RNA is somehow degenerated, the 5⬘ moiety of a transcript is not well labeled. In contrast, its 3⬘ moiety may be relatively well labeled even though the RNA is degenerate. Thus, the 3⬘/5⬘ ratio of housekeeping genes may represent the RNA quality. (ii) The efficiency of cRNA preparation was examined by calculating the A260/A280 ratio by use of a spectrophotometer, and only cRNAs with a ratio between 1.9 and 2.1 were used. (iii) We also used an Agilent bioanalyzer to determine the purity of cRNAs before and after fragmentation, and only nondegraded samples were used. cRNAs that fulfilled all of the above criteria were used for fragmentation, followed by hybridization. In addition, we always included known concentrations of biotinylated cRNAs of four spiked noneukaryotic (prokaryotic) genes, bioB, bioC, bioD, and cre, to determine the hybridization efficiency, as suggested by Affymetrix (GeneChip expression analysis technical manual). In addition, we only studied cRNA samples showing ⱖ65% hybridization with genes on the chip, with this percentage serving as an additional hybridization control parameter. Subsequently, as a global normalization strategy before we performed the microarray analysis, we normalized all of the arrays to 100, as suggested by Af-
VOL. 72, 2004
MICROARRAY ANALYSIS OF LPS-INDUCED GENES IN LUNGS
7249
TABLE 1. Significant inflammatory genes that were up-regulated by LPS in the lungs from 1 to 24 h (grouped based on function) Gene accession no.
Fold change compared to controla Gene product 1h
2h
4h
8h
12 h
24 h
NC 24.1 NC 2.0 6.0 4.3 6.2 4.9 11.9 NC NC 75.0 NC NC 98.0 412.9 NC NC 164.8 NC 18
NC 33.1 NC 2.5 15.0 10.4 34.6 3.8 44.5 2.0 2.8 143.0 NC 2.0 187.3 181.1 11.8 10.8 88.3 4.8 53.3
2.6 88.7 2.4 NC 13.0 7.1 23.3 5.2 12.7 NC 5.5 217.7 3.0 3.8 50.1 42.6 9.9 6.4 48.2 7.1 48.3
3.1 10.2 27.7 NC 26.7 3.0 9.1 5.0 12.3 NC 8.9 72.3 2.7 7.5 13.9 15.7 7.9 7.6 27.7 8.2 11.9
3.2 5.2 8.0 2.3 10.7 2.1 8.2 8.6 10.2 3.2 8.5 47.0 2.1 6.9 11.3 4.1 4.7 2.5 10.2 7.6 2.6
4.1 2.9 3.2 2.4 3.9 2.0 3.6 3.0 2.2 2.2 2.5 16.0 NC 3.3 4.6 3.2 3.3 NC 5.9 2.6 2.0
Interferon regulatory factor 1 (Irf1) Interferon regulatory factor 7 (Irf7) Interleukin-1 receptor antagonist (IL-1ra) Suppressor of cytokine signaling 3 (Socs3)b Suppressor of cytokine signaling 4 (Socs4)
3.1 NC 2.3 NC NC
3.6 NC 2.8 5.6 NC
2.2 NC 4.7 3.5 2.0
NC 2.1 7.2 2.9 2.1
NC 2.6 4.0 3.9 NC
NC 3.7 2.0 NC NC
Other inflammationassociated genes M75721 M26296 NM_010380 L38281 M31419 BC040425 U43084 L38698 U70429 M12279 M34163 NM_009841 U18424 U56819 U84409 AF539797 M27008 M27009 M27129 M87861 AJ300198 AK052527 BC055459 U73004 M13521 M11130 X03479 AF378130 AY179346 L24118 AK088297 AF061505
Alpha-1 protease inhibitor 1 (alpha-1 PI-1) H-2 class II histocompatibility antigen (H2-Ea) Histocompatibility 2, D region locus 1 (H2-D1) Immune-responsive gene 1 (Irg1)b Interferon-activatable protein 204 (Ifi204) Interferon-activatable protein 205 (Ifi205) Interferon-induced protein with tetratricopeptide repeats 1 (Ifit1) Alpha/beta interferon (IFN-␣/) Interleukin-4-induced gene 1 (Il4i1) Interferon-induced Mx protein (Mx1) Lymphocyte IgE receptor (CD23) Macrophage plasma membrane glycoprotein CD14b Macrophage scavenger receptor with collagenous structure (Marco) Monocyte chemoattractant protein 1 receptor (Mcp-1R) Myeloid differentiation factor 88 (MyD88) NADPH oxidase organizer 1 (Noxo1) Orosomucoid 1 (Orm1) Orosomucoid 1 (Orm2) Phagocytic glycoprotein I (CD44) P-selectin (Selp) Putative seven-transmembrane-spanning receptor (Puma-g) Regulator of G-protein signaling 6 (Rgs6) Regulator of G-protein signaling 16 (Rgs16) Secretory leukocyte protease inhibitor (Slpi) Serum amyloid 1 (Saa1) Serum amyloid 2 (Saa2) Serum amyloid 3 (Saa3) TIR domain-containing adaptor protein (Tirap) Toll-like receptor 2 (Tlr2) Tumor necrosis factor alpha-induced protein 2 (Tnfaip2) Tumor necrosis factor alpha-induced protein 3 (Tnfaip3) Tumor necrosis factor alpha-induced protein 17 (Tnfrsf17)
90.8 14.1 6.6 4.6 NC NC NC 9.2 2.5 NC NC NC NC NC NC NC NC NC NC NC 2.0 11.3 42.7 NC 5.5 NC 4.9 3.7 2.01 7.1 14.0 3.9
7.0 NC NC 120.5 15.4 3.0 2.1 3.2 6.3 NC 4.7 8.2 2.8 2.3 2.0 19.7 2.1 NC 3.0 6.1 6.2 2.6 32.0 2.4 94.2 3.8 94.0 4.2 3.6 10.3 3.2 3.6
24.4 8.4 24.9 195.5 13.1 3.0 3.0 2.2 5.7 2.9 14.3 7.3 4.2 3.2 2.0 31.9 7.8 3.3 4.7 4.5 7.8 10.3 36.8 2.5 234.5 5.6 92.3 3.7 2.7 4.5 4.2 3.0
2.4 5.5 4.03 122.8 12.5 2.3 2.9 8.9 2.8 2.7 6.7 4.3 6.8 3.8 NC 31.7 14.6 5.9 2.5 3.1 7.0 18.1 7.7 3.5 310.3 7.3 128.0 4.2 2.7 2.0 2.3 6.3
22.0 13.3 7.3 62.1 12.9 3.2 2.7 2.3 NC 3.3 4.5 2.0 6.1 3.1 NC 29.1 11.5 8.1 2.0 NC 4.3 11.0 8.8 3.4 472.0 5.3 126.2 3.7 2.3 NC 2.2 6.3
20.4 10.2 3.2 19.2 14.8 NC 3.0 3.2 NC 3.3 NC NC 4.2 2.6 NC 9.4 5.3 4.1 NC NC 4.7 5.3 NC 2.8 167.0 2.1 100.0 3.6 NC NC NC 5.1
Transcriptional regulation U34245 BC037446 AF030896 AF155373
Fos-related antigen 1 (Fra1) Inhibitor of kappa B kinase epsilon (Ibke) Nuclear factor IB epsilon (Nfbie) Nuclear factor kappa B subunit p100 (Nfb2)
3.9 NC 2.1 2.0
NC 4.5 2.9 3.9
NC NC 2.1 2.5
3.2 NC 2.1 NC
NC NC NC NC
Cytokine or chemokine AF044196 U27267 U92565 K00083 M33266 X01450 M15131 M25892 J03783 M86671 AF052505 M73061 M35590 U49513 X53798 AF099052 NM.011333 L04694 J04596 AJ242587 Y00467
B lymphocyte chemoattractant (Blc) CXC chemokine LIX (LIX)b Fractalkine (Cx3cl1) Gamma interferon (IFN-␥) Interferon-inducible protein 10 (IP-10)b Interleukin-1␣ (IL-1␣) Interleukin-1 (IL-1) Interleukin-4 (IL-4) Interleukin-6 (IL-6)b Interleukin-12 (IL-12) Macrophage-derived chemokine (MDC) Macrophage inflammatory protein 1␣ (Mip-1␣) Macrophage inflammatory protein 1 (Mip-1) Macrophage inflammatory protein 1␥ (Mip-1␥) Macrophage inflammatory protein 2 (Mip-2)b Macrophage inflammatory protein 3␣ (Mip-3␣)b Monocyte chemoattractant protein-1 (Mcp-1) Monocyte chemoattractant protein-3 (Mcp-3) Keratinocyte cell-derived chemokine (KC)b Thymus and activation-regulated chemokine (Tarc) Tumor necrosis factor-alpha (TNF-␣)b
Cytokine suppression or regulation M21065 U73037 M57525 U88328 AF121907
2.65 2.0 4.0 4.4
Continued on following page
7250
JEYASEELAN ET AL.
INFECT. IMMUN. TABLE 1—Continued
Gene accession no.
U36277 J03236 L32955 U06924 X78197 AF017021 U19118 M83380 AF077742
Fold change compared to controla Gene product
Nuclear factor I-kappa B alpha chain (Nfbia) Oncogene JunB (JunB) Protein tyrosine kinase Jak3 (Jak3) Signal transducer and activator of transcription 1 (Stat 1) Transcription factor AP-2 beta (Ap-2) Transcription factor B-ATF (Batf) Transcription factor LRG-21 (Lrg-21) Transcription factor RelB (Relb) Transcription factor TFEC (Tcfec)
1h
2h
4h
8h
12 h
24 h
3.4 2.8 NC NC NC NC 8.6 3.0 NC
3.2 5.8 2.1 NC 2.1 4.2 3.8 7.6 2.9
4.3 3.1 2.4 2.2 2.3 2.8 NC 6.3 2.2
2.0 NC 2.0 2.0 3.1 NC NC 3.0 2.0
2.0 NC NC 2.4 9.6 NC NC 2.0 NC
NC NC NC 2.4 2.2 2.1 NC NC 3.0
a Data are presented as average fold increases compared to levels in control lungs (n ⫽ 3 mice for each time point). NC, no change; i.e., the LPS-induced average increase was less than twofold compared to saline-treated (control) lungs. b Expression was validated by a Taqman-based real-time RT-PCR as indicated in Table 3.
fymetrix, by using the following formula: average intensity ⫻ scaling factor ⫽ target intensity. Housekeeping genes, including GADPH, -actin, transferrin receptor, and pyruvate carboxylase, were included in the microarray as internal controls, and their values were comparable in LPS- and saline-treated arrays (data not shown). Microarray data analysis. Primary data from the microarray experiments were analyzed by the use of algorithms within GeneSpring software (version 6.0; Silicon Genetics, Redwood City, Calif.) as described previously (14). Briefly, each chip for mice that were treated with LPS at a particular time point was compared with its saline-treated replicates. Each chip was first normalized to the 50th percentile by the use of GeneSpring software. Thereafter, the normalized data were sorted for robust changes, both increases and decreases, by use of the following criteria: (i) selection of probes that were present in two of three arrays; (ii) elimination of all probe sets with ratios or fold changes of ⬍2.0 (for increases) in LPS arrays since previous studies with various mouse organs demonstrated that this is a stringent cutoff value for organ-specific gene expression (2, 6); and (iii) selection of all probe sets with P values of ⬍0.05 (for increases in LPS arrays by Student’s t test). The ratio estimates the magnitude and direction (increase) of change of a transcript compared with its counterpart in a salinetreated array by comparing each probe set on the experimental array to the corresponding probe pair on the saline-treated (control) array. Genes showing a fold change of ⱖ2 were filtered and are listed in Table 1. At least six animals were used for each time point (three LPS-treated mice and three controls). Using the above criteria, we identified a total of 71 inflammation-associated genes. To give further power to the microarray data obtained by using GeneSpring, we processed the normalized microarray data through a statistical program, significance analysis of microarrays (SAM; Stanford University, Stanford, Calif. [www -stat.stanford.edu/⬃tibs/SAM/]), as described previously (37), which determines the strength of the relationship between gene expression and treatment conditions (e.g., LPS treatment versus saline treatment). We chose a ⌬ value of 0.8, which generated a false discovery rate of 1%, and found that the 71 inflammation-associated genes were true positive results. To further validate the microarray data obtained by using GeneSpring, we also used microarray suite software (MAS 6.0; Affymetrix) (14), which uses a different algorithm from that used by Genespring or SAM, to confirm whether the up-regulated 71 genes had P values of ⬍0.05. This software uses raw microarray data for one-to-one comparisons (one array to another) by the one-step Tukey’s biweight method after abolishing
the differences between perfectly matched and mismatched intensities by using Wilcoxon’s signed rank test. We confirmed the 71 genes between LPS- and saline-treated arrays on a one-to-one basis (one LPS-treated array versus one saline-treated array) at each time point and found that all 71 genes in each comparison at all time points had P values of ⬍0.005. Real-time RT-PCR analysis. We used total RNAs from the same microarray experiment and from additional animals that were subjected to LPS aerosolization. The differential expression of 12 selected genes on the microarrays was further validated by real-time RT-PCR as described previously (39). The primers and probe sequences are listed in Table 2. A total of 10 animals were included at the 4-h time point (5 LPS-treated and 5 saline-treated mice) for real-time RT-PCRs since most of the chosen genes were significantly up-regulated at this time point. The RT reaction was performed by using 1 g of total RNA and random hexamers in a 50-l reaction as suggested by the manufacturer (PE Applied Biosystems, Foster City, Calif.). Taqman PCRs were performed on an ABI Prism 7700 sequence detection system (PE Applied Biosystems). The 50-l PCRs contained 30 ng of cDNA, a 100 nM fluorogenic probe, a 50 nM concentration of each primer (IDT Technologies, Coralville, Iowa), and other components from a TaqMan PCR kit. The initial denaturing time was 10 min at 95°C, followed by 40 PCR cycles consisting of 95°C for 15 s, 60°C for 1 min, and 72°C for 10 s. A melting curve was run after the PCR cycles, followed by a cooling step. The specificities of the PCRs for both specific genes and GAPDH were verified by the absence of a signal in reactions without template and reactions without the addition of RNA isolated from the lungs (RT-negative reactions). The mRNA expression of all samples was normalized to that of GAPDH, a housekeeping gene from the same sample. Each experiment included a negative control in which the template was not included in the RT reaction and a cDNA was not included in the PCR. The cycle threshold (CT) value indicates the number of PCR cycles that are necessary for the detection of a fluorescence signal exceeding a fixed threshold. The fold change (FC) was calculated by using the following formulas as described previously (9): ⌬CT ⫽ CT (GAPDH) ⫺ CT (target gene) and FC ⫽ 2共⌬CT2⫺⌬CT1兲, in which ⌬CT1 represents the mean for LPS-treated lungs and ⌬CT2 represents the mean for saline-treated lungs. The product sizes with the primers used were ⬍100 bp. ELISAs. The method used to measure proteins in BALF and the lungs was described previously (24). The minimum detection limit was 2 pg of cytokine/ml (24). We used proteins from murine lungs (1:50 dilution) and BALF that were
TABLE 2. Taqman RT-PCR primer and probe sequences Gene
Forward primer sequence
Reverse primer sequence
TaqMan probe sequence
GAPDH LIX IP-10 IL-6 MIP-2 MIP-3␣ KC TNF-␣ SOCS3 IRG1 CD14
AGGTTGTCTCCTGCGACTTCA GCCGCAGCTCAGCTGAA TCAAGCCATGGTCCTGAGACAA TCAATTCCAGAAACCGCTATGA CACTCTCAGGGCGGTCAAA CCTTGCTTTGGCATGGGTACT TGTCAGTGCCTGCAGACCAT CCCAA GC CCACATCT AAAGGGTGTGTGAAGGGTTTTTAT CACAGAGAGCTTTGCTGGTATGA GGGCGAGAGAGGACTGATCTC
CCAGGAAATGAGCTTGACAAAGTT CCTCCAAATTAGCGATCAATTTG CGCACCTCCACATAGCTTACAG CACCAGCATCAGTCCCAAGA CAGGTCAGTTAGCCTTGCCTTT GCAACAGTCGTAGTTGCTTGCT GTGGCTATGACTTCGGTTTGG CGTCGCGGATCATGCTTT GCCACCACTCCTCACCTAGGT TGCTCCTCCGAATGATACCAT CGCAGCGCTAAAACTTGGA
AGCAACTCCCACTCTTCCACCTTC TGCGTTGTGTTTGCTTAACCGTAACTCCAA CATCCCAGCCACTTGAGCGAGGAC TCTGCAAGAGACTTCCATCCAGTTGCC CCCTGGTTCAGAAAATCATCCAAAAGA TGGCTCACCTCTGCAGCCAGGC CATCCAGAGCTTGAAGGTGTTGCCCTC AGAAAAGACACCATGAGCACA TGGCCAAAGAAATAACCACTCCCACTGC TCACGGCTTGAAAGTGAACCACCTGA CCCTCTGTCCCCTCAAGTTCCCGA
VOL. 72, 2004
MICROARRAY ANALYSIS OF LPS-INDUCED GENES IN LUNGS
7251
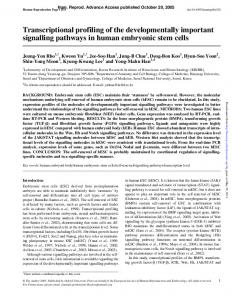
FIG. 1. Hematoxylin and eosin staining of lung tissues at 2 h (A), 8 h (B), and 24 h (C) after aerosolization with LPS or at 24 h (D) after aerosolization with 0.9% saline. Note that infiltration of neutrophils into the air spaces and interstitial edema were evident in LPS-treated lungs in a temporal manner. The arrow indicates infiltrating inflammatory cells. Cytospin preparations of BALF cells stained with Diff-Quick at 2 h (E), 8 h (F), and 24 h (G) after aerosolization with LPS or at 24 h (H) after aerosolization with 0.9% saline are also shown. Photomicrographs are representative of five independent experiments; the brightness, contrast, and magnification of the pictures are similar. Five mice were used for each group. Original magnification, ⫻400. The graphs show the quantitation of total WBC (I) and neutrophil (J) counts in BALF. Five mice were tested for each group, and significance was calculated by a one-way analysis of variance (ANOVA). Values that were significantly different between the LPS- and saline-treated groups (P ⬍ 0.05) are indicated by asterisks.
obtained from animals that were subjected to LPS aerosolization or from controls. Briefly, capture antibodies against TNF-␣, MIP-2, and LIX were diluted to a concentration of 4 g/ml in binding solution (0.9% saline supplemented with 0.1 M Na2HPO4 and 0.1 M NaH2PO4) and added to the wells of a high-bindingaffinity enzyme immunoassay plate (Corning, Inc., Corning, N.Y.). After 12 h of incubation at 4°C, excess capture antibodies were removed by washing twice with wash buffer (PBS plus 0.05% Tween 20), and 0.1 ml of a standard (1,000 pg/ml) or sample was added to each well. After 2 h of incubation at room temperature, the plates were washed five times with wash buffer, and 100 l of a biotinylated detection antibody (50 ng/ml) in blocking buffer was added. The plates were then incubated for 2 h at room temperature and washed five times. Thereafter, 100 l of avidin-conjugated horseradish peroxidase in blocking buffer (according to the manufacturer’s protocol; R&D Systems) was added, and the plates were incubated for 2 h at room temperature. Next, the plates were washed five times, and 100 l of TMB substrate-H2O2 was dispensed into each well. After color development, the reaction was stopped by adding 100 l of 1 M phosphoric acid, and the optical densities of the wells at 450 nm were read by use of a Quant plate reader (Bio-Tek Instruments, Winooski, Vt.). For mouse lungs, TNF-␣, MIP-2, and LIX concentrations were normalized to the total protein concentrations in the samples, as measured by the Bradford assay (Bio-Rad, Hercules, Calif.). Data are expressed in picograms per milligram of total protein for lung tissue and in picograms per milliliter for BALF.
RESULTS ALI induced by aerosolization of LPS. Aerosolization of C57BL/6 mice with 300 g of LPS/ml for 20 min induced acute lung injury characterized by the infiltration of neutrophils and monocytes, edema, and parenchymal hemorrhage, as evidenced by cell counts and histopathology, in a time-dependent fashion (Fig. 1A to C). In a similar manner, severe neutrophil infiltration was also observed in lungs by examinations of BALF during the course of LPS treatment, with maximal infiltration occurring at 8 h (Fig. 1E to G, I, and J). However, these pathological features were absent from lungs from control mice that were aerosolized with isotonic (0.9%) saline (Fig. 1D and H). Furthermore, LPS did not induce a neutrophil influx in TLR4 mutant (C3He/J) mice, even at a dose of 15 mg/ml for 20 min at 24 h post-LPS treatment, indicating that the effects were indeed contributed by LPS (S. Jeyaseelan, H. W. Chu, S. K. Young, M. W. Freeman, and G. S. Worthen,
7252
JEYASEELAN ET AL.
INFECT. IMMUN.
TABLE 3. Validation by Taqman RT-PCR of selected genes that were up-regulated in the lungs by LPS according to microarraysa Fold increase Gene product
Taqman PCR
Microarray
LPS-induced CXC chemokine (LIX) Interferon-inducible protein 10 (IP-10) Interleukin-6 (IL-6) Macrophage inflammatory protein 2 (MIP-2) Macrophage inflammatory protein 3␣ (MIP-3␣) Keratinocyte cell-derived chemokine (KC) Tumor necrosis factor alpha (TNF-␣) Suppressor of cytokine signaling 3 (SOCS3) Immunoresponsive gene 1 (IRG1) Macrophage plasma membrane glycoprotein CD14
103.30 10.41 9.45 93.05 36.50 46.21 40.50 3.78 157.60 8.06
88.70 12.90 12.70 79.14 42.60 48.15 48.25 3.50 195.50 7.32
a
Genes confirmed by real-time RT-PCR are indicated in Table 1.
submitted for publication). We selectively used 2-, 8-, and 24-h time points in our study since these time points provided clear differences in the histopathological appearances of lungs and in differential cell counts in BALF after LPS exposure. These characteristic findings led us to examine the genes promoting these features in the mouse lung. We therefore utilized microarray technology to determine the global gene expression patterns induced by LPS in mouse lungs from 1 to 24 h. LPS-induced gene expression in lungs. A total of six pairwise comparisons were performed between LPS- and salinetreated mouse lungs (1, 2, 4, 8, 12, and 24 h). A total of 71 inflammation-associated genes were up-regulated between 2and 472-fold by LPS at various time points (Table 1). We selected only up-regulated genes since their gene products may serve as therapeutic targets to minimize the lung damage associated with ALI. However, the genes that were down-regulated by LPS in the lungs were changed less than fourfold and mostly represented genes associated with cellular metabolism (data not shown). The differentially expressed inflammationassociated transcripts were categorized into the following groups (Table 1): (i) cytokine and/or chemokine genes, (ii) genes encode cytokine and/or chemokine regulation, (iii) other inflammatory response-associated genes, and (iv) genes encode transcription factors (Table 1). Validation of LPS up-regulated genes by real-time RT-PCR and ELISA. The expression of selected genes that were identified as being differentially expressed by microarray analysis was validated by real-time RT-PCRs. We selected genes encoding the following proteins for validation: keratinocyte-derived chemokine (KC), MIP-2, MIP-3␣, interleukin-6 (IL-6), TNF-␣, immunoresponsive gene 1 (IRG1), interferon-induced protein 10 (IP-10), suppressor of cytokine signaling 3 (SOCS3), macrophage plasma membrane glycoprotein (CD14), and the LIX chemokine. These genes were chosen because they (i) encode critical mediators of lung inflammation (3), (ii) have distinct patterns of expression at various time points (Table 1), and (iii) are from different functional categories (Table 1). We selected the 4-h time point for RT-PCR experiments since most of the critical genes associated with ALI were significantly up-regulated at this time point. Our results showed that a strong positive correlation exists (r2 ⫽ 0.972) between microarray data and real-time PCR results in terms of the magnitude and direction of gene expression patterns (Table 3 and Fig. 2).
We also validated the expression of LIX, TNF-␣, and MIP-2 by performing ELISAs. We selected the LIX, TNF-␣, and MIP-2 proteins because (i) they are transcriptionally regulated (29), (ii) the TNF-␣ and MIP-2 proteins play an important role in the induction of lung injury by LPS (12, 18, 30), (iii) TNF-␣ and MIP-2 regulate the neutrophil influx during ALI (24), and (iv) LIX alone has been shown to be chemotactic to neutrophils in vitro (40) and to play a direct role in neutrophil accumulation in the myocardium during ischemia-perfusion injury (8). In BALF, TNF-␣ and MIP-2 were up-regulated by LPS at 2 and 8 h, while LIX was up-regulated at 2, 8, and 24 h (Fig. 3A, B, and C). In lung homogenates, TNF-␣ and MIP-2 were significantly up-regulated by LPS at 2 and 8 h, whereas LIX was up-regulated only at 2 h (Fig. 3D, E, and F). Role of LIX in induction of ALI. Our microarray and protein expression analyses revealed that LIX was up-regulated in LPS-treated lungs in a temporal manner. The role of LIX in the induction of ALI has not been determined in previous studies. We determined its role in the induction of ALI by using exogenous LIX alone (without LPS treatment) and a LIX blocking antibody prior to LPS treatment. Exogenous LIX alone, but not neutralized LIX, induced neutrophil accumulation in lungs at 8 and 24 h post-LIX treatment, as evidenced by total white blood cell (WBC) and neutrophil counts in BALF and MPO activities in lungs (Fig. 4). Furthermore, the neutralization of LIX by a LIX blocking antibody at a concentration of 30 g per mouse, but not by an isotype-matched control antibody, markedly attenuated LPS-induced neutrophil influx in the lungs at 8 and 24 h (Fig. 5). These observations suggest that LIX plays a direct role in neutrophil influx in the lungs. DISCUSSION Understanding the pathogenesis of ALI is an important step toward designing early therapeutic interventions to minimize the mortality associated with lung damage. Identifying genes that are associated with the development of ALI may permit the design of treatment and prevention strategies to improve
FIG. 2. Validation of LPS-induced up-regulation of selected genes in lungs by real-time quantitative RT-PCR. The LPS-induced changes were calculated against saline controls as described in Materials and Methods. There was a strong correlation between the microarray analysis and real-time RT-PCR data.
VOL. 72, 2004
MICROARRAY ANALYSIS OF LPS-INDUCED GENES IN LUNGS
7253
FIG. 3. Confirmation of LPS-induced up-regulation of LIX, TNF-␣, and MIP-2 proteins by ELISAs. LPS- or 0.9% saline-treated BALF (A to C) and lung tissue homogenates (D to F) were used to measure the levels of LIX, TNF-␣, and MIP-2 by ELISAs. Data are expressed in picograms per milliliter for BALF and in picograms per milligram of total protein for lung tissue. Groups of five mice each were used. A one-way ANOVA was used to determine the significance between the LPS- and saline-treated groups. Values that were significantly different between the LPS- and saline-treated groups (P ⬍ 0.05) are indicated by asterisks.
survival. The present study highlights the ability of microarray technology to define the expression of inflammatory genes in ALI in a temporal manner from 1 to 24 h by using LPS in a mouse model. Our results showed that 71 inflammation-associated genes were consistently up-regulated by LPS in a reproducible manner (Table 1). The expression of KC, MIP-2, TNF-␣, IL-6, MIP-3␣, IP-10, SOCS3, IRG1, CD14, and LIX was validated at the molecular level by real-time RT-PCRs. In addition, the expression of transcriptionally regulated genes, including LIX, TNF-␣, and MIP-2, obtained by microarray analysis was confirmed at the protein level by ELISAs. Furthermore, we have identified a role for a CXC chemokine, LIX, in the induction of ALI in a mouse model, and therefore LIX may serve as a novel therapeutic target to minimize the lung damage associated with ALI. To our knowledge, this is the first reported large-scale study to examine in a temporal manner the inflammation-associated genes in the lungs that are important for the murine model of ALI. Although LPS-induced lung inflammation is self-limiting in rodent models, this model mimics several key features of acute
lung injury in humans (12, 21). Total WBC and neutrophil counts, the histopathology of lung tissues, and the histology of BALF cytospin preparations confirmed previous observations with this model of ALI (21, 24), in which LPS instillation into mice results in the influx of neutrophils and monocytes and severe inflammation in the lungs in a time-dependent manner (Fig. 1). In addition, we found that this model is reproducible and therefore permits analyses of global gene expression by use of a limited number of microarrays. The up-regulation of some of the lung inflammatory genes identified in the present study was documented in a previous study of transcriptional profiling by Okamoto et al. (25). For example, IL-1, MIP-1␣, MIP-1, MIP-1␥, MIP-2, MCP-1, MCP-3, KC, TNF-␣, IL-1ra, CD14, orosomucoid 1, and serum amyloid 3 were previously demonstrated in mouse lungs at 24 h post-LPS treatment. However, we identified more inflammation-associated genes in mouse lungs since most of the genes peaked at 2 h and were minimally up-regulated or declined to basal levels at 24 h. The up-regulation of genes in response to LPS may reflect the recruitment of cells into the lungs as well
7254
JEYASEELAN ET AL.
INFECT. IMMUN.
FIG. 4. Exogenous LIX induces neutrophil influx in lungs. Three micrograms of exogenous LIX, antibody-treated LIX (with anti-LIX antibody or an isotype-matched control), or PBS was administrated intratracheally to mice, and BALF and lungs were collected at 2, 8, and 24 h posttreatment. Total WBC (A) and neutrophil (B) counts in BALF and MPO activities in the lungs (C) were determined as described in Materials and Methods. A one-way ANOVA was used to determine the significance between the LIX- and saline-treated groups (n ⫽ 8 animals/group). Values that were significantly different between LIX- and saline-treated mice (P ⬍ 0.05) are indicated by asterisks.
as an increase in transcription mechanisms of various cell types in the lungs. A central event in the inflammatory response in the lungs in response to LPS is neutrophil accumulation (10). Therefore, the cellular origin of the inflammatory genes in the lungs was of great interest. Our group (23) identified the up-regulation of IL-1, MIP-1␣, MIP-1, MCP-1, IL-8 (the mouse homologue is KC), IL-1ra, interferon-induced Mx 1 protein, phagocytic glycoprotein 1, and nuclear factor kappa B subunit p100 in human neutrophils in response to LPS at 4 h. Tsukahara et al. (36) identified the up-regulation of IL-1, Gro2 (the mouse homolog is MIP-2), and the oncogene JunB in human neutrophils in response to LPS. Since our results also demonstrated that these genes or homologs were up-regulated in mouse lungs in response to LPS, it is possible that these genes at least partly originated from lung neutrophils. TLRs recognize microbes and/or their products (15). The binding of E. coli LPS to CD14 and subsequently to TLR4 is the first and crucial step for initiating signaling, which accounts for its multiple biological effects, including the expression of cytokines and chemokines in the lungs (17, 19). Although TLR4 was below the cutoff values for up-regulated genes by LPS in our studies (1.6-fold; data not shown), we have shown that CD14 was up-regulated in LPS-treated lungs in a temporal manner between 2 and 12 h post-LPS treatment (Table 1), demonstrating an amplification step in LPS signaling. Okamoto et al. (25) also noted an up-regulation of CD14 in the lungs in response to LPS at 24 h, which was the only time point they studied. TLR4 signaling involves two major adapter proteins, MyD88 (20) and Tirap (16, 41). It has been shown that most cytokines and chemokines are induced via the MyD88 adapter protein upon LPS binding to TLR4 (20). Our observations showed that LPS in the lungs up-regulates the expression of both of these adapters, indicating an amplification step in the LPS-induced signaling cascade in the lungs. It is important that, unlike Tirap, MyD88 was only up-regulated twofold. Furthermore, MyD88-
independent signaling has been documented for the induction of interferon-dependent genes, including interferon-inducible protein 10 (IP-10) (17). Our data indicate that IP-10 is upregulated by LPS, showing for the first time that E. coli LPS induces both MyD88-dependent and -independent signaling cascades in mouse lungs after LPS inhalation. Numerous naturally occurring competitive cytokine and/or chemokine antagonists were up-regulated in a temporal manner in the lungs, along with cytokines and chemokines, by LPS (Table 1). Our findings showed that suppressors of cytokine signaling (SOCS3 and -4) are upregulated by LPS in the lungs in a temporal fashion. In this regard, earlier studies have shown that SOCS are implicated in the negative-feedback regulation of several signaling cascades, particularly the JAK/ STAT cascade, leading to the expression of various cytokines, including interferons (13). It is important that our data show for the first time that STAT 1 is up-regulated by LPS, suggesting a role for STAT 1 in the expression of SOCS in the lungs. Furthermore, our findings demonstrated for the first time that IRF1 and -7 are up-regulated by LPS in murine lungs. In this context, studies have shown that interferon regulatory factors (IRFs) regulate the expression of interferons via an NF-Bdependent mechanism induced by LPS in various cells (11). These observations bring up the notion that SOCS3 might be used to minimize the lung damage associated with LPS-induced ALI. LIX, or CXC chemokine ligand 5 (CXCL5), was identified as a glucocorticoid-attenuated response gene (32). Subsequent studies have shown that LIX mRNA is expressed in various tissues, including the lungs (29). LIX is the sole mouse homologue of two human chemokines, epithelial cell-derived neutrophil-activating peptide 78 and granulocyte chemotactic protein 2 (28, 33, 34). LIX has been shown to be chemotactic to neutrophils in vitro (40) and contributes to neutrophil accumulation in the myocardium in a rat model of ischemia-reperfusion injury (8). With the present study, we have begun to demonstrate the expression of LIX in response to LPS at the
VOL. 72, 2004
MICROARRAY ANALYSIS OF LPS-INDUCED GENES IN LUNGS
7255
FIG. 5. Neutralization of LIX attenuates neutrophil recruitment in lungs during LPS-induced ALI. Thirty micrograms of anti-LIX antibody, an isotype-matched control antibody, or PBS was administrated intratracheally to mice 2 h prior to LPS treatment. BALF and lungs were collected at 2, 8, and 24 h post-LPS treatment, and total WBC (A and D) and neutrophil (B and E) counts in BALF and MPO activities in lungs (C and F) were determined as described in Materials and Methods. A one-way ANOVA was used to determine the significance between the LPS- and saline-treated groups (n ⫽ 8 mice/group). Values that were significantly different between anti-LIX antibody-treated mice and isotype-matched control antibody-treated mice (P ⬍ 0.05) are indicated by asterisks.
protein level and to characterize its role in the induction of ALI. Our data show for the first time that LIX can be induced in the lungs by E. coli LPS at the protein level. In addition, the induction of LIX in lung cells in response to LPS provides a mechanism by which neutrophils can be recruited efficiently to inflamed lungs. In this context, it has been shown that neutrophil recruitment to the lungs is crucial for the induction of lung damage (3). Therefore, LIX is a potential therapeutic target aimed at minimizing neutrophil-mediated inflammatory diseases, including ALI, for which LPS has been implicated as the etiologic agent. In conclusion, we took advantage of microarray technology to demonstrate the up-regulation of inflammation-associated genes in a mouse model of ALI induced by LPS. The model mimics human ALI, and these findings will allow investigations of the inflammatory gene products identified by microarray analysis in a temporal manner that can modulate ALI. This large-scale differential gene expression study has identified several interplaying factors that modulate ALI at the molecular level. Furthermore, our microarray analysis has revealed a role for LIX in the induction of ALI.
ACKNOWLEDGMENTS This study was supported by a grant from the National Institutes of Health (P50HL067671-03). We thank Kenneth Malcolm and Travis Walker for helpful discussions and critical readings of the manuscript. REFERENCES 1. Andonegui, G., S. M. Goyert, and P. Kubes. 2002. Lipopolysaccharide-induced leukocyte-endothelial cell interactions: a role for CD14 versus toll-like receptor 4 within microvessels. J. Immunol. 169:2111–2119. 2. Arai, M., O. Yokosuka, T. Chiba, F. Imazeki, M. Kato, J. Hashida, Y. Ueda, S. Sugano, K. Hashimoto, H. Saisho, M. Takiguchi, and N. Seki. 2003. Gene expression profiling reveals the mechanism and pathophysiology of mouse liver regeneration. J. Biol. Chem. 278:29813–29818. 3. Bernard, G. R., A. Artigas, K. L. Brigham, J. Carlet, K. Falke, L. Hudson, M. Lamy, J. R. Legall, A. Morris, and R. Spragg. 1994. The American-European Consensus Conference on ARDS: definitions, mechanisms, relevant outcomes, and clinical trial coordination. Am. J. Respir. Crit. Care Med. 149: 818–824. 4. Bhatia, M., and S. Moochhala. 2004. Role of inflammatory mediators in the pathophysiology of acute respiratory distress syndrome. J. Pathol. 202:145– 156. 5. Brigham, K. L., and B. Meyrick. 1986. Endotoxin and lung injury. Am. Rev. Respir. Dis. 133:913–927. 6. Bystrom, J., T. A. Wynn, J. B. Domachowske, and H. F. Rosenberg. 2004. Gene microarray analysis reveals interleukin-5-dependent transcriptional targets in mouse bone marrow. Blood 103:868–877.
7256
JEYASEELAN ET AL.
7. Chabot, F., J. A. Mitchell, J. M. Gutteridge, and T. W. Evans. 1998. Reactive oxygen species in acute lung injury. Eur. Respir. J. 11:745–757. 8. Chandrasekar, B., J. B. Smith, and G. L. Freeman. 2001. Ischemia-reperfusion of rat myocardium activates nuclear factor-B and induces neutrophil infiltration via lipopolysaccharide-induced CXC chemokine. Circulation 103: 2296–2302. 9. Chen, Z., R. Lund, T. Aittokallio, M. Kosonen, O. Nevalainen, and R. Lahesmaa. 2003. Identification of novel IL-4/Stat6-regulated genes in T lymphocytes. J. Immunol. 171:3627–3635. 10. Chignard, M., and V. Balloy. 2000. Neutrophil recruitment and increased permeability during acute lung injury induced by lipopolysaccharide. Am. J. Physiol. Lung Cell. Mol. Physiol. 279:L1083–L1090. 11. Fitzgerald, K. A., D. C. Rowe, B. J. Barnes, D. R. Caffrey, A. Visintin, E. Latz, B. Monks, P. M. Pitha, and D. T. Golenbock. 2003. LPS-TLR4 signaling to IRF-3/7 and NF-kappaB involves the toll adapters TRAM and TRIF. J. Exp. Med. 198:1043–1055. 12. Frevert, C. W., S. Huang, H. Danaee, J. D. Paulauskis, and L. Kobzik. 1995. Functional characterization of the rat chemokine KC and its importance in neutrophil recruitment in a rat model of pulmonary inflammation. J. Immunol. 154:335–344. 13. Fujimoto, M., and T. Naka. 2003. Regulation of cytokine signaling by SOCS family molecules. Trends Immunol. 24:659–666. 14. Galindo, C. L., J. Sha, D. A. Ribardo, A. A. Fadl, L. Pillai, and A. K. Chopra. 2003. Identification of Aeromonas hydrophila cytotoxic enterotoxin-induced genes in macrophages using microarrays. J. Biol. Chem. 278:40198–40212. 15. Goodman, R. B., R. M. Strieter, D. P. Martin, K. P. Steinberg, J. A. Milberg, R. J. Maunder, S. L. Kunkel, A. Walz, L. D. Hudson, and T. R. Martin. 1996. Inflammatory cytokines in patients with persistence of the acute respiratory distress syndrome. Am. J. Respir. Crit. Care Med. 154:602–611. 16. Horng, T., G. M. Barton, R. A. Flavell, and R. Medzhitov. 2002. The adaptor molecule TIRAP provides signalling specificity for Toll-like receptors. Nature 420:329–333. 17. Hoshino, K., O. Takeuchi, T. Kawai, H. Sanjo, T. Ogawa, Y. Takeda, K. Takeda, and S. Akira. 1999. Cutting edge: Toll-like receptor 4 (TLR4)deficient mice are hyporesponsive to lipopolysaccharide: evidence for TLR4 as the Lps gene product. J. Immunol. 162:3749–3752. 18. Huang, S., J. D. Paulauskis, J. J. Godleski, and L. Kobzik. 1992. Expression of macrophage inflammatory protein-2 and KC mRNA in pulmonary inflammation. Am. J. Pathol. 141:981–988. 19. Ingalls, R. R., H. Heine, E. Lien, A. Yoshimura, and D. Golenbock. 1993. Lipopolysaccharide recognition, CD14, and lipopolysaccharide receptors. Infect. Dis. Clin. N. Am. 13:341–353. 20. Kawai, T., O. Adachi, T. Ogawa, K. Takeda, and S. Akira. 1999. Unresponsiveness of MyD88-deficient mice to endotoxin. Immunity 11:115–122. 21. Kitamura, Y., S. Hashimoto, N. Mizuta, A. Kobayashi, K. Kooguchi, I. Fujiwara, and H. Nakajima. 2001. Fas/FasL-dependent apoptosis of alveolar cells after lipopolysaccharide-induced lung injury in mice. Am. J. Respir. Crit. Care Med. 163:762–769. 22. Kubo, K., T. Amari, T. Kaneki, M. Hanaoka, T. Hayano, T. Miyahara, S. Koyama, T. Koizumi., K. Fujimoto, and T. A. Kobayashi. 1999. A 21-aminosteroid, U-74006F, attenuates endotoxin-induced lung injury in awake sheep. Respirology 4:167–172. 23. Malcolm, K. C., P. G. Arndt, E. J. Manos, D. A. Jones, and G. S. Worthen. 2003. Microarray analysis of lipopolysaccharide-treated human neutrophils. Am. J. Physiol. Lung Cell. Mol. Physiol. 284:L663–L670. 24. Nick, J. A., S. K. Young, P. G. Arndt, J. G. Lieber, B. T. Suratt, K. R. Poch, N. J. Avdi, K. C. Malcolm, C. Taube, P. M. Henson, and G. S. Worthen. 2002. Selective suppression of neutrophil accumulation in ongoing pulmonary inflammation by systemic inhibition of p38 mitogen-activated protein kinase. J. Immunol. 169:5260–5269.
Editor: J. T. Barbieri
INFECT. IMMUN. 25. Okamoto, T., K. Gohil, E. I. Finkelstein, P. Bove, T. Akaike, and A. Van Der Vliet. 2004. Multiple contributing roles for NOS2 in LPS-induced acute airway inflammation in mice. Am. J. Physiol. Lung Cell. Mol. Physiol. 286: L198–L209. 26. Poltorak, A., X. He, I. Smirnova, M. Y. Liu, C. Van Huffel, X. Du, D. Birdwell, E. Alejos, M. Silva, C. Galanos, M. Freudenberg, P. Ricciardi-Castagnoli, B. Layton, and B. Beutler. 1998. Defective LPS signaling in C3H/HeJ and C57BL/10ScCr mice: mutations in Tlr4 gene. Science 282:2085–2088. 27. Rabinovici, R., P. J. Bugelski, K. Esser, L. M. Hillegass, J. Vernick, and G. Feuerstein. 1993. ARDS-like lung injury produced by endotoxin in plateletactivating factor-primed rats. J. Appl. Physiol. 74:1791–1802. 28. Rovai, L. E., H. R. Herschman, and J. B. Smith. 1997. Cloning and characterization of the human granulocyte chemotactic protein-2 gene. J. Immunol. 158:5257–5266. 29. Rovai, L. E., H. R. Herschman, and J. B. Smith. 1998. The murine neutrophil-chemoattractant chemokines LIX, KC, and MIP-2 have distinct induction kinetics, tissue distributions, and tissue-specific sensitivities to glucocorticoid regulation in endotoxemia. J. Leukoc. Biol. 64:494–502. 30. Schmal, H., T. P. Shanley, M. L. Jones, H. P. Friedl, and P. A. Ward. 1996. Role for macrophage inflammatory protein-2 in lipopolysaccharide-induced lung injury in rats. J. Immunol. 156:1963–1972. 31. Sibille, Y., and H. Y. Reynolds. 1990. Macrophages and polymorphonuclear neutrophils in lung defense and injury. Am. Rev. Respir. Dis. 141:471–501. 32. Smith, J. B., and H. R. Herschman. 1995. Glucocorticoid-attenuated response genes encode intercellular mediators, including a new C-X-C chemokine J. Biol. Chem. 270:16756–16765. 33. Smith, J. B., L. E. Rovai, and H. R. Herschman. 1997. Sequence similarities of a subgroup of CXC chemokines related to murine LIX: implications for the interpretation of evolutionary relationships among chemokines J. Leukoc. Biol. 62:598–603. 34. Smith, J. B., D. J. Wadleigh, Y. R. Xia, R. A. Mar, H. R. Herschman, and A. J. Lusis. 2002. Cloning and genomic localization of the murine LPSinduced CXC chemokine (LIX) gene, Scyb5. Immunogenetics 54:599–603. 35. Strieter, R. M., and S. L. Kunkel. 1994. Acute lung injury: the role of cytokines in the elicitation of neutrophils. J. Investig. Med. 42:640–651. 36. Tsukahara, Y., Z. Lian, X. Zhang, C. Whitney, Y. Kluger, D. Tuck, S. Yamaga, Y. Nakayama, M. Weissman, and P. E. Neuberger. 2003. Gene expression in human neutrophils during activation and priming by bacterial lipopolysaccharide. J. Cell. Biochem. 89:848–861. 37. Tusher, V. G., R. Tibshirani, and G. Chu. 2001. Significance analysis of microarrays applied to the ionizing radiation response. Proc. Natl. Acad. Sci. USA 98:5116–5121. 38. Weiland, J. E., W. B. Davis, J. F. Holter, J. R. Mohammed, P. M. Dorinsky, and J. E. Gadek. 1986. Lung neutrophils in the adult respiratory distress syndrome: clinical and pathophysiologic significance. Am. Rev. Respir. Dis. 133:218–225. 39. Wenzel, S. E., J. B. Trudeau, S. Barnes, X. Zhou, M. Cundall, J. Y. Westcott, K. McCord, and H. W. Chu. 2002. TGF-beta and IL-13 synergistically increase eotaxin-1 production in human airway fibroblasts. J. Immunol. 169: 4613–4619. 40. Wuyts, A., A. Haelens, P. Proost, J. P. Lenaerts, R. Conings, G. Opdenakker, and J. Van Damme. 1996. Identification of mouse granulocyte chemotactic protein-2 from fibroblasts and epithelial cells. Functional comparison with natural KC and macrophage inflammatory protein-2. J. Immunol. 157:1736– 1743. 41. Yamamoto, M., S. Sato, H. Hemmi, H. Sanjo, S. Uematsu, T. Kaisho, K. Hoshino, O. Takeuchi, M. Kobayashi, T. Fujita, K. Takeda, and S. Akira. 2002. Essential role for TIRAP in activation of the signaling cascade shared by TLR2 and TLR4. Nature 420:324–329.