785
The Journal of Experimental Biology 204, 785–795 (2001) Printed in Great Britain © The Company of Biologists Limited 2001 JEB3142
DETECTION OF Cl− FLUX IN THE APICAL MICROENVIRONMENT OF CULTURED FOETAL DISTAL LUNG EPITHELIAL CELLS S. C. LAND* AND A. COLLETT Centre for Research into Human Development, Tayside Institute of Child Health, Ninewells Hospital and Medical School, Dundee DD1 9SY, Scotland, UK *e-mail:
[email protected]
Accepted 30 November 2000; published on WWW 1 February 2001
Summary A self-referencing Cl−-selective microelectrode (Cl− SrE) was developed and used to detect changes in the direction and magnitude of the Cl− flux (JCl) from the apical region of cultured foetal distal lung epithelial cells (FDLEs) as a function of external Cl− concentration ([Cl−]e) and in response to pharmacological challenges. The technique, which is similar to that developed for other ion-selective microelectrodes, centres on the oscillation of a Cl−-selective microelectrode between known points, micrometres apart, orthogonal to the plasma membrane. Application of the Fick principle to the differential voltage obtained per excursion amplitude (the referenced signal) yields the Cl− flux (pmol cm−2 s−1). A Cl− effusion gradient was used to confirm that empirical measurements of JCl using the Cl− SrE were statistically similar to predicted flux values calculated from the fall in [Cl−] with distance from the tip of the effusion source. Apical JCl was then measured as a function of [Cl−]e from polarised FDLE cultures grown on permeable supports. At [Cl−]e100 mmol l−1. At [Cl−]e>100 mmol l−1, isoproterenol (basolaterally applied, 10 µmol l−1) activated a Cl− influx of 561 pmol cm−2 s−1, whereas UTP (apically applied, 100 µmol l−1) stimulated a Cl− efflux of 300 pmol cm−2 s−1. In all cases, 50–70 % of JCl was abolished by Cl− channel blockade using 10 µmol l−1 diphenylamine-2-carboxylic acid (DPC) or 5-nitro-2-(3-phenylpropylamino)benzoic acid (NPPB). We conclude that the Cl− SrE resolves a Cl− gradient in the microenvironment of the apical region of lung epithelia that varies in both direction and magnitude as a function of external [Cl−]e and in response to Cl− channel blockade and to β2 adrenoreceptor and P2Y receptor agonists. Key words: self-referencing electrode, fluid transport, lung, cystic fibrosis, β2 adrenoreceptor, P2Y receptor, Cl− flux.
Introduction Fluid transport in lung epithelia is governed by the regulated flux of Na+ and Cl−, which generate the osmotic force for fluid transfer from one side of the epithelial barrier to the other. Whereas Na+/K+-ATPase activity provides the electrogenic energy that drives this process, the transmembrane distribution of Na+ and Cl− is determined by ligand-regulated ion channels and exchangers which, if defective, result in diseases associated with dysfunctional fluid transport. The ionic composition of the external medium (i.e. the airway surface liquid, ASL) within the respiratory tree is, therefore, a major determinant of the physiological performance of the lung in health and disease (Boucher, 1999). As defective Cl− transport is causative in the pathophysiology of cystic fibrosis, considerable effort has gone into determining the physiological range of Cl− concentration ([Cl−]) in ASL (Baconnais et al., 1999; Boucher, 1994; Hull et al., 1998; Knowles et al., 1997; Matsui et al., 1998). Gross measurements of ASL, however, reveal little information
regarding the actual [Cl−] within the microenvironment of epithelial cells since this presumably varies as a function of diffusion distance from fluid-secreting glands or, indeed, pathways of Cl− entry and exit via tight junctions and channels within the apical membrane itself. With uncertainty as to the precise level of physiological [Cl−] within the macro- and micro-environments of the membrane, the assessment of processes governing Cl− transport and their pharmacological manipulation requires an understanding of the local Cl− flux over a broad range of external Cl− concentrations ([Cl−]e). Techniques used to characterise the primary signalling pathways that regulate Cl− entry and exit from lung epithelial cells generally involve either indirect detection of anion transport as a component of total ion transport (e.g. the measurement of short-circuit current) or gross direct measurement by isotope tracer techniques. Although these approaches are powerful, they lack temporal and spatial signal resolution and, consequently, convey little information about
786
S. C. LAND AND A. COLLETT
the transport of a given ion as a function of its concentration in the microenvironment of the plasma membrane. The self-referencing electrode (SrE) technique overcomes these limitations by using a single ion-selective microelectrode (tip diameter approximately 3–5 µm), continuously oscillated orthogonal to the plasma membrane, to record a differential voltage that changes in proportion to the transport of the selected ion species. Application of the Fick principle to the differential voltage obtained (∆µV) per amplitude (µm) of electrode excursion yields a measure of flux (pmol cm−2 s−1). Signal referencing in this manner provides an additional operational advantage by effectively filtering out inherent noise, drift or interference. Since the original voltage ‘vibrating’ probe was developed by Jaffe and Nuccitelli (Jaffe and Nuccitelli, 1974), the SrE principle has been adapted for use with both cationic-selective microelectrodes (Ca2+, H+, K+) (Kuhtreiber and Jaffe, 1990; Smith et al., 1994; Breton et al., 1996; Land et al., 1997; Shirihai et al., 1998; Smith and Trimarchi, 2000) and polarographic (O2) microelectrodes (Land et al., 1999; Trimarchi et al., 2000) on samples ranging in magnitude from single isolated cells to tissues. Here, we report the development of a Cl−-selective selfreferencing (SrE) microelectrode suited for the real-time, highresolution, non-invasive detection of Cl− flux direction and magnitude over broad ranges of external [Cl−]. As little is known about the role of surface liquid composition in the regulation of fluid transport in the distal lung, we used polarised monolayers of foetal distal lung epithelial cells (FDLEs) to test the capacity of the Cl− SrE to detect Cl− transport in response to basolateral (β2 adrenoreceptor) or apical (purinoreceptor) agonists that evoke changes in the direction and magnitude of Cl− transport. Our results demonstrate the presence of a Cl− gradient within the microenvironment of the apical membrane that is intimately linked to the physiology of fluid transport in the distal lung. Materials and methods Isolation and culture of foetal distal lung epithelial cells All procedures requiring the use of rats were pre-approved by the Committee for Animal Care and Experimentation at the host institution for these experiments [Marine Biological Laboratory (MBL), Woods Hole, MA 02543, USA]. Timemated pregnant female Sprague Dawley rats were purchased from Charles River (MA, USA) and housed in the animal care facility at the MBL. At day 20 of gestation (term is 22 days), the animals were killed by cervical dislocation, and the foetuses were removed by caesarean section and immediately decapitated. Foetal mass (minus lung tissue) was 2.12±0.13 g (mean ± S.E.M., N=12 litters), which matches the range expected for rat foetuses at 19 days post-conception out of a 22-day gestation period (Schellhase et al., 1989). The foetal lungs were removed, dissected free of major airways and extraneous tissues, finely minced, and then washed free of erythrocytes by rinsing several times in ice-cold sterile Ca2+- and Mg2+-free Hanks balanced salt solution (HBSS).
The cleaned lung tissue was resuspended in HBSS containing 0.02 % (w:v) trypsin and 0.012 % (w:v) DNAase I at a volume of 1 ml per foetus and incubated with agitation at 37 °C for 20 min. At the end of this period, the solution was centrifuged at 100 g for 2 min to remove undispersed tissue from cells, and the supernatant was transferred into a fresh sterile tube. An equal volume of Dulbecco’s modified Eagle’s medium (DMEM) with 10 % foetal calf serum (FCS) was added to the supernatant to neutralise proteolytic activity. To maximise yield, the digestion protocol was repeated on the remaining tissue fragments. After filtering the supernatant through a 120 µm sterile nylon mesh, the filtrate was centrifuged at 420 g for 5 min. The cell pellet was resuspended in 20 ml of DMEM containing 10 % (v:v) FCS, and the cells were placed into a T150 culture flask at 37 °C to enable fibroblasts and nonepithelial cells to adhere to the culture flask for 1 h (repeated once). At the end of this period, unattached cells were centrifuged at 130 g for 3 min, and the pettet was resuspended in 20 ml of DMEM (without FCS) before repeating the centrifugation. Cells were washed four times, after which the supernatant was discarded. At the end of the fourth wash, the cells were counted and seeded onto 1 cm diameter Transwell clear (Corning Costar Alewife, MA, USA) permeable supports (0.4 µm pore size) at a density of 1.5×10⁶ cells per membrane. Adherent cells were washed with 20 ml DMEM 24 h later and placed into 2 ml of serum-free PC-1 medium (Biowhittaker). We have found that cells plated this way typically possess transepithelial resistances (Rt) greater than 300 Ω cm2 and a transepithelial potential difference of 4.3±0.2 mV (mean ± S.E.M., N=110; S. M. Wilson, personal communication). Cl− self-referencing electrodes Patch-style microelectrodes with a tip diameter of 3 µm were constructed from borosilicate glass as described previously (Smith et al., 1994). The electrodes were back-filled with 100 mmol l−1 NaCl, 10 mmol l−1 Tris/H2SO4 (pH 7.4) and then front-filled with a 300 µm column length of 5,10,15,20tetraphenyl-21H,23H-porphin manganese(III)chloride [Mn(III)TPPCl−; Cl− ionophore I-Cocktail A (Fluka)] (Kondo et al., 1989). The electrode was connected to a motioncontrolled head stage via a Ag/AgCl wire, and the circuit was completed by placing a salt bridge (3 mol l−1 sodium acetate in agar connected to a Ag/AgCl wire) submerged in the medium at the edge of the dish. The entire assembly was mounted on the stage of a Zeiss inverted microscope housed in a Faraday cage. Details of motion control, signal detection and amplification devices have been reported previously (Kuhtreiber and Jaffe, 1990; Smith et al., 1994; Land et al., 1999) and are products of the BioCurrents Research Center (Marine Biological Laboratory, Woods Hole, MA 02543, USA: www.mbl.edu/BioCurrents). Electrode movements about the cell were monitored throughout each experiment with the aid of a video monitor. Nernstian calibration of the electrode was conducted by recording the millivolt signal difference in 0.1, 1, 10 and 100 mmol l−1 solutions of NaCl buffered with 10 mmol l−1
Transepithelial Cl− flux Tris/H2SO4 to pH 7.4. Electrode calibration was typically linear over this range, yielding a slope of −60.4 mV per decade [Cl−] (r2=0.98). Electrode resistance was determined by Ohm’s law by passing a 5 mV pulse over the sensor column in the tip of the microelectrode and measuring the resulting current. This method was appropriate for the measurement of resistance because we found no change in resistance values, column length or integrity of the sensor material with repeated pulsing over several minutes. Electrode drift was monitored over the course of each experiment by following the change in the direct current signal per hour. Experimental design Experiments were divided into three parts. Part A: characterisation of Cl− SrE performance The characteristics with which the electrode measures Cl− flux were determined by creating a steady-state Cl− diffusion gradient from an artificial point source. Briefly, a micropipette with a tip diameter of 3 µm was filled with a solution of 0.5 % agar containing 100 mmol l−1 NaCl. The bulk solution around the tip of the pipette consisted of 100 mmol l−1 Na+ as the prevalent cation in 0.1 mol l−1 sodium-phosphate-buffered saline (five volumes of Na2HPO4 to one volume of NaH2PO4, pH 7.4). In this way, interference from osmotic and bulk liquid flow around the tip of the point source was minimised and a steady-state Cl− gradient was established after approximately 1 h. To determine the characteristics of Cl− flux detection, Cl−-selective electrodes were progressively moved outwards within the gradient to known positions orthogonal to the tip of the point source. At each position, a direct voltage signal was obtained with the electrode motionless, followed by measurement of a differential voltage with the electrode oscillating over 8 µm. Signals obtained at points throughout the Cl− gradient in both motionless and oscillating formats were compared by conversion to Cl− concentration difference (µmol cm−3) in the same manner as described previously for Ca2+ selfreferencing microelectrodes (Kuhtreiber and Jaffe, 1990) using the relationship derived in the legend to Fig. 1. Signal filtering and data collection rate are described below.
∆C = 2.3(∆V/[i]e)/S ,
787 (1)
where ∆V is the signal difference (mV) measured over the amplitude of electrode oscillation, [i]e is the background concentration of Cl− (=[Cl−]e) in the medium (µmol cm−3), which was continuously measured as a direct current signal throughout each experiment and S is the Nernstian calibration slope of the electrode. Multiplication by 2.3 converts the Nernstian calibration from base 10 to natural logarithms (as derived by Kuhtreiber and Jaffe, 1990). These values were then converted to a directional measurement of flux by substitution into the Fick equation: JCl = D(∆C/∆r) ,
(2)
where JCl is the flux of Cl− (mol cm−2 s−1), D is the aqueous diffusion coefficient for Cl− at 25 °C (5.8×10⁻⁶ cm−2 s−1) and ∆r is the amplitude of electrode oscillation (cm). Note that the error arising from electrode drift, which is associated with the continuous measurement of [i]e, was negligible over our experimental period (Table 1). Part C: pharmacological manipulation of the Cl− flux signal Experiments were conducted over a range of Cl− concentrations by washing filters free from PC-1 medium and replacing it with 0.1 mol l−1 sodium-phosphate-buffered saline (5 volumes of Na2HPO4 to 1 volume of NaH2PO4.H2O, pH 7.4) containing (in mmol l−1): 40 NaCl, 5 KH2PO4, 0.8 MgSO4, 0.5 CaCl2 and 5 Na+-glucose. The osmolality of this solution (308 mosmol kg−1) was close to that of PC-1 medium (297 mosmol kg−1). The concentration of Cl− was set at the desired level by varying the concentration of NaCl in solution and compensating for osmotic imbalance with sodium mannitol, leaving HPO42− as the dominant anion. The times of addition and concentration of blockers, agonists and antagonists are as described in the figure legends. Data handling and statistical analyses Data were collected using Ionview software (BioCurrents Research Center, Marine Biological Laboratory, Woods Hole, Table 1. Electrode performance and calibration Parameter
Part B: detection of Cl− flux from rat FDLEs in monolayer culture The outlines of individual cells comprising the epithelial monolayer were clearly visible through the base of the Transwell clear permeable support (see Fig. 2A); hence, by using the electrode motion control, it was possible to position the tip of the electrode within 1 µm of the apical membrane of any given cell. Once the point of closest approach had been established, the electrode was oscillated at a frequency of 0.3 Hz over an amplitude (r) of 10 or 20 µm in the vertical (z) plane. Cl−-specific signal differences (∆µV) obtained over the amplitude of the electrode excursion were corrected for background Cl− concentration and converted to a Cl− concentration differential (∆C, µmol cm−3) using the equation:
Drift (mV h−1) Bulk medium At cell
0.09±1.8 (40) 0.22±1.3 (40)
Resistance (GΩ)
16.5±0.7 (6)
Nernstian calibration* 0 mmol l−1 NaHCO3 5 mmol l−1 NaHCO3 50 mmol l−1 NaHCO3
x=−60.4log[Cl−]–48.6 (r2=0.98) (40) x=−60.5log[Cl−]–41.2 (r2=0.98) (40) x=−32.5log[Cl−]–18.8 (r2=0.88) (5)
*Nernstian calibration performed in 0.1, 1, 10, 100 mmol l−1 NaCl, 10 mmol l−1 Tris/H2SO4, pH 7.4. Values are mean ± S.E.M. with the number of repetitions shown in parentheses. x, signal difference (mV); [Cl−] is in mol l−1.
S. C. LAND AND A. COLLETT
Results and discussion Electrode properties The performance characteristics of Mn(III)TPP-tipped microelectrodes are given in Table 1 and are broadly similar to those reported previously (Kondo et al., 1989). Note that the resistance value obtained falls within the range for other ionophore-tipped microelectrodes (5×10¹⁰ to 3×10¹¹ Ω; Smith et al., 1994). Nernstian calibration yielded a slope of −60.4 mV per 10-fold change in Cl− concentration, which was used to calculate [Cl−]e and subsequent values of JCl over the time course of each experiment. For this to be justified, it was important to establish that drift was a negligible component of the overall signal. The average rate of drift in the nonreferenced voltage output during cellular measurements was 0.22 mV h−1 (Table 1) amounting to 0.3 % of the millivolt difference obtained per decade change in Cl− concentration. As no single electrode was used for more than 3 h, we consider drift to be a negligible component of [i]e. The selectivity of the electrode sensor material for Cl− over HCO3− represents a second possible area for signal bias. Mn(III)TPP possesses a Nicolsky–Eisenmann selectivity coefficient (logKpotCl,HCO´) of −1.62 (Kondo et al., 1989), indicating a selectivity for Cl− that is 43 times greater than for HCO3−. Approximations of HCO3− flux calculated from lung and renal epithelial preparations suggest that upper limits will reside between 0.17 and 0.36 nmol cm−2 s−1 (Illek et al., 1997; Muller-Berger et al., 1999; Tsuruoka and Schwartz, 1999). If we take into account the 43-fold difference in selectivity, the latter would account for 2.1–3.7 % of the spontaneous Cl− flux signals we observed
Electrode output (mV)
0
0.005
120
0.01
0.02
0.03
A
110 100 90
Oscillation off
0 -1500 -3000 -4500 0
Oscillation on (∆r=8 µm) 10
20 30 Time (min)
40
17
B
0
0
-17
-0.005 -0.01 -0.015
-34 Predicted Measured
-68
-0.02 -0.025 0
-51
JCl (pmol cm-2 s-1)
Chemicals Chloride ionophore I-cocktail A was purchased from Fluka (Buchs, Switzerland), ultrapure uridine and adenosine 5′triphosphates were from Pharmacia (Little Chalfont, Bucks, UK), 5-nitro-2-(3-phenylpropylamino)benzoic acid (NPPB) and diphenylamine-2-carboxylic acid (DPC) were from ICN (Basingstoke, Hants, UK). All other chemicals were purchased from Sigma (St Louis, MO, USA, and Poole, Dorset, UK). Culture media consisted of PC-1 (Biowhittaker, Bakersville, MD, USA), and DMEM and HBSS were purchased from LifeSciences (Rockville, MD, USA).
Distance from artificial point source, r (cm)
Differential signal over 8 µm translation, ∆µV (µV)
MA, USA) as described previously (Kuhtreiber and Jaffe, 1990; Smith et al., 1994; Land et al., 1999). Briefly, signals were collected at a rate of 1000 data points per second from an electrode translated in a square wave at a rate of 0.3 Hz. The signal at each extreme of the translation was separated into 10 bins each averaged from 166 data points. The first three data bins obtained at either extreme were discarded to eliminate movement artefacts, with the remaining data bins being used to obtain the differential signal. Significant differences between groups were assessed by one-way analysis of variance (ANOVA) followed by Dunnett’s test, with confidence limits set at 95 %. The value of N is the number of cell preparations from each pregnant female rat used in each experiment.
∆[Cl−]/∆r (mmol l-1 cm-1)
788
-85 0.01 0.015 0.005 0.02 0.025 Distance from artificial point source, r (cm)
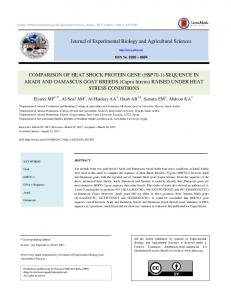
Fig. 1. Comparison of measured and predicted signal differences in an artificially constructed Cl− gradient radiating from an artificial source with a tip diameter of 3 µm containing 100 mmol l−1 NaCl in a bathing medium of 100 mmol l−1 Na2HPO4:NaH2PO4 (5:1) at 25 °C. (A) Representative experiment showing the change in electrode output with distance from the tip of the point source (upper graph) and the corresponding differential signal (∆µV) obtained over an oscillation of 8 µm (lower graph). (B) Signal difference (expressed as concentration difference divided by the amplitude of oscillation) calculated from the relationship derived by Kuhtreiber and Jaffe (1990), ∆V=S[(−K∆r)/([i]er2+Kr)]/2.3, where ∆V is the voltage difference (mV), S is the Nernstian calibration slope of the Cl− electrode, K is a constant derived from the least-squares regression of the change in signal with distance through the artificial gradient (µmol cm−2), ∆r is the amplitude of electrode oscillation (cm), r is the distance from the point source (cm) and [i]e is the background concentration of Cl− (µmol cm−3). There was no statistical difference between the regression slopes of the two lines, as determined by least-squares analysis. The measured data points (open circles) represent the means ± S.E.M. (bars fall within symbols) of 25 data points collected at each position. JCl, Cl− flux.
at [Cl−]e values above 100 mmol l−1 and is, therefore, considered negligible. A third possible area affecting detection sensitivity concerns the response time of the electrode. The 10–90 % response times
Transepithelial Cl− flux reported previously (Kondo et al., 1989) for Mn(III)TPP microelectrodes with a tip diameter of 1 µm range between 11 and 41 s depending on the amplification equipment used. No detail is provided as to how stepwise changes in [Cl−] concentration were achieved in solution to achieve an 80 % change in the maximal signal. In our experiments, we found it was not possible to create stepwise changes in [Cl−] in solution without introducing errors resulting from excessive flow or from mechanical or thermal disturbances. Introducing the electrode from the air into a solution containing 10 mmol l−1 NaCl (buffered with 10 mmol l−1 Tris/H2SO4, pH 7.5) produced a 0–90 % response time of 10.4 s, which incorporates the same errors. We believe, therefore, that the response time of the sensor material is not reliably reported but is significantly less than 10 s for a microelectrode with a tip diameter of 3–5 µm. Confirmation that our operating criteria (i.e. rate and amplitude of electrode oscillation, rate of data collection and processing) were sufficient for quantifiable detection of Cl− flux was obtained using an artificial Cl− effusion gradient as described in the next section. Cl− flux measurement from an artificial source To determine the efficiency with which Cl−-selective microelectrodes detect Cl− flux when operated in a selfreferencing format, we constructed an artificial Cl− diffusion gradient that could be used to determine both the efficiency and detection sensitivity of the technique. Fig. 1A (upper graph) demonstrates the change in signal intensity measured with a stationary Cl−-selective microelectrode when it is moved to positions outwards from a 100 mmol l−1 NaCl point source. The slope of change in Cl− concentration with distance r (cm) from the orifice of the artificial point source, given by y=Klogex−a, was used to determine the predicted signal differential between any two points within the gradient (where K is the slope and a is the intercept). By returning the electrode to each position throughout the artificial Cl− gradient and oscillating it at 0.3 Hz over 8 µm (Fig. 1A, lower graph), the empirically determined signal differential (i.e. the referenced signal) could then be compared with that predicted from the slope obtained from the static measurements. As referencing the voltages obtained from either extreme of the oscillation effectively filters interference resulting from noise and electrode drift, a signal differential should theoretically be detectable within a shallow gradient even when static electrode measurements over the same distance do not register a significant change. This was broadly the case with our experiments, as both panels of Fig. 1A demonstrate: a substantial signal differential was measured at points in the gradient that yielded little detectable change in the static voltage measurements. Fig. 1B demonstrates a close (no statistical difference; F1,6, P