Hindawi Publishing Corporation Mathematical Problems in Engineering Volume 2016, Article ID 8063962, 9 pages http://dx.doi.org/10.1155/2016/8063962
Research Article Transfer Learning for Collaborative Filtering Using a Psychometrics Model Haijun Zhang,1 Bo Zhang,2 Zhoujun Li,1 Guicheng Shen,2 and Liping Tian2 1
State Key Laboratory of Software Development Environment, Beihang University, Beijing 100191, China School of Information, Beijing Wuzi University, Beijing 101149, China
2
Correspondence should be addressed to Haijun Zhang; hjz
[email protected] Received 29 November 2015; Revised 9 March 2016; Accepted 20 March 2016 Academic Editor: Matteo Gaeta Copyright © 2016 Haijun Zhang et al. This is an open access article distributed under the Creative Commons Attribution License, which permits unrestricted use, distribution, and reproduction in any medium, provided the original work is properly cited. In a real e-commerce website, usually only a small number of users will give ratings to the items they purchased, and this can lead to the very sparse user-item rating data. The data sparsity issue will greatly limit the recommendation performance of most recommendation algorithms. However, a user may register accounts in many e-commerce websites. If such users’ historical purchasing data on these websites can be integrated, the recommendation performance could be improved. But it is difficult to align the users and items between these websites, and thus how to effectively borrow the users’ rating data of one website (source domain) to help improve the recommendation performance of another website (target domain) is very challenging. To this end, this paper extended the traditional one-dimensional psychometrics model to multidimension. The extended model can effectively capture users’ multiple interests. Based on this multidimensional psychometrics model, we further propose a novel transfer learning algorithm. It can effectively transfer users’ rating preferences from the source domain to the target domain. Experimental results show that the proposed method can significantly improve the recommendation performance.
1. Introduction A recommendation system aims to find the favorite items (goods) for users. Over the past decade, many recommendation algorithms have been proposed, among which collaborative filtering (CF) has attracted much more attention because of its high recommendation accuracy and wide applicability. These CF algorithms can be grouped into two categories: memory-based CF and model-based CF [1, 2]. Memorybased CF mainly includes user-based CF and item-based CF. User-based CF supposes that the test user will like the items that his or her similar users like, and the estimated rating of the test user for the test item is adjusted by the ratings of his or her similar users. Item-based CF deems that the test user will like the other items similar to the items that he or she previously liked, and the estimated rating of the test user for the test item is calculated by the items this user previously rated. Therefore, the key step in memory-based CF is to calculate the similarity of users or items. Usually, the similarity is calculated directly from the user-item rating
matrix. In this matrix, each row denotes a feature vector of a user, while each column denotes a feature vector of an item. The similarity between two vectors depends on the elements at which both vectors have a rating. But usually, only a few users evaluated a few items on websites; thus, the user-item rating matrix is very sparse, and the number of commonly rated elements of the two vectors is very small. This results in an unreliable computed similarity and hence a low recommendation accuracy. Furthermore, with the growth of users and items, the complexity of similarity computation increases in a nonlinear fashion, which restricts its scalability. To solve these problems, a variety of machine learning and data mining models have been proposed, which have led to the development of model-based CF algorithms. The basic idea of model-based CF algorithms is to reduce the dimension of a rating matrix that will combat the scalability and data sparsity problems. Model-based CF mainly contains clustering methods [3, 4], regression methods [5], graph modelbased methods, matrix factorization methods, and neural
2
Mathematical Problems in Engineering
network methods. Graph model-based methods include Bayesian network [6, 7], PLSA (Probabilistic Latent Semantic Analysis) [8, 9], and LDA (Latent Dirichlet Allocation) [10]. Representative Matrix factorization methods include SVD (Singular Value Decomposition) [11–15], PCA (Principal Component Analysis) [16], and NMF (Nonnegative Matrix Factorization) [17, 18]. Neural network methods include RBM (Restrained Boltzmann Machine) [19]. Generally, modelbased CF has better performance than memory-based CF; however, the recommendation produced by memory-based CF has better interpretability and makes convincing users easier. However, these methods only utilize the rating data coming from a single website and ignore exploiting the ratings from other websites. In order to exploit big data gathered from different websites to cope with data sparsity problems, recently, the transfer learning methods [22–29] were proposed. They utilize the data from the source domain to improve the prediction accuracy of the target domain. However, transfer learning can potentially hinder performance if there is a significant difference between the source domain and the target domain [30]. For successful knowledge transfer, there are two critical problems that must be resolved. First, the two domains share the same feature space (in recommendation system, it means that the two domains have aligned users or items); however, their distributions are significantly different. Second, the two domains do not share the same feature space (in recommendation system, it means that the two domains have no aligned users or items). To solve the first problem, some methods [24–26, 31] were proposed to supervise the knowledge transfer. The second problem is very difficult, because a common latent space is needed in which the two domains are similar, and the common factors learned from the source domain can be used to constrain the algorithm to achieve better performance in the target domain. A representative method to solve this tough problem is CBT (CodeBook Transfer), proposed in [23]. The algorithm CBT exploits nonnegative matrix trifactorization to transfer information from the source domain to the target domain, which can be expressed by min
𝑈𝑠 ≥0,𝐵𝑠 ≥0,𝑉𝑠 ≥0
s.t.
2 𝑅𝑠 − 𝑈𝑠 𝐵𝑠 𝑉𝑠 𝑇 𝐹 𝑈𝑠 𝑇 𝑈𝑠 = 𝐼,
(1)
𝑉𝑠 𝑇 𝑉𝑠 = 𝐼 min
𝑈𝑡 ≥0,𝐵𝑡 ≥0,𝑉𝑡 ≥0
s.t.
2 𝑅𝑡 − 𝑈𝑡 𝐵𝑡 𝑉𝑡 𝑇 + 𝜆𝐵𝑠 − 𝐵𝑡 𝐹 2 𝐹 𝑈𝑡 𝑇 𝑈𝑡 = 𝐼,
(1), and 𝐵𝑠 is then fixed to learn the factor matrices of the target domain by (2). This method expects to find a common latent space (here, it is represented by the middle matrix) in which the information obtained from the source domain data (i.e., matrix 𝐵𝑠 ) can be used to improve the algorithm’s performance in the target domain. However, there are several implementation methods of nonnegative matrix trifactorization. Some constraints are usually needed in these methods to guarantee that the columns of the left matrix and right matrix are orthogonal [17, 24, 25, 32]. Note that too strict or too loose constraints would damage the performance of the nonnegative matrix trifactorization based transfer learning method. Compared with our previous work [33], the differences between them and the new contributions of this paper are as follows. (1) In our previous work, a multidimensional psychometrics-based collaborative filtering algorithm was proposed, which is presented in Section 2.1. (2) In this paper, we extend the algorithm and propose a novel transfer learning algorithm in Section 2.2. This new proposed method can effectively transfer knowledge from source domain to target domain even when the two domains have no aligned users or items. In Section 3.2, MovieLens dataset and BookCrossing dataset are used to evaluate the two algorithms to validate the effectiveness of knowledge transfer. Comprehensive experiments are conducted in Section 3.3, and the results show that our novel transfer learning algorithm outperforms representative state-of-the-art algorithms including nonnegative matrix trifactorization based transfer learning method [23].
2. Materials and Methods In this section, a multidimensional psychometrics model is proposed. Compared with one-dimensional psychometrics model, it can model user’s multilatent interests. Furthermore, a novel transfer learning method based on this multidimensional psychometrics model is proposed, which can mine rating preferences parameters and transfer them from source domain to target domain to improve the recommendation accuracy further. 2.1. Collaborative Filtering Using a Multidimensional Psychometrics Model. Hu et al. [20, 21] first introduced the psychometrics model into CF and used the software Winsteps [34] to estimate the parameters in the model. It can be expressed as log
(2)
𝑉𝑡 𝑇 𝑉𝑡 = 𝐼, where 𝑅𝑠 denotes the rating matrix in the source domain, 𝑅𝑡 denotes the rating matrix in the target domain, and 𝜆 > 0 is a tradeoff parameter to balance the target and source domain data. 𝑈𝑠 , 𝐵𝑠 , and 𝑉𝑠 are nonnegative matrices. 𝐵𝑠 matrix is learned from the source domain according to
𝑃𝑢𝑖𝑘 = 𝐵𝑢 − 𝐷𝑖 − 𝐹𝑘 𝑃𝑢𝑖(𝑘−1) 𝐹1 = 0,
𝑘 = 2, 3, . . . , 𝐾,
(3) (4)
where 𝐵𝑢 and 𝐷𝑖 are scalar quantities, which denote the interest of user 𝑢 and the drawback of item 𝑖. Higher 𝐵𝑢 means that user 𝑢 has a great interest in the items, and he or she will assign a higher score to the items. Smaller 𝐷𝑖 indicates that item 𝑖 is of good quality and will receive higher scores from users. The parameter 𝑃𝑢𝑖𝑘 denotes the probability of user 𝑢 assigning score 𝑘 to item 𝑖, and 𝐹𝑘 is the ordered threshold,
Mathematical Problems in Engineering
3
which denotes the difficulty for users to give score 𝑘 relative to giving score 𝑘 − 1 for an item. Each item has 𝐾-level scores, that is, 1, 2, . . . , 𝐾, and parameters 𝐵𝑢 , 𝐷𝑖 , and 𝐹2 ∼ 𝐹𝐾 need to be estimated. In (3), 𝐵𝑢 and 𝐷𝑖 are scalar quantities and denote the user’s interest and the item’s quality, respectively. The model expressed by (3) assumes that user’s interest and item’s quality are one-dimensional. However, it is more feasible to represent the user’s interest and the item’s quality with vectors because users usually have varied interests and gain satisfaction from item in a number of different aspects [33]. For example, a user can have an interest in science fiction films with a value of 2, an interest in action movies with a value of 8, an interest in romantic films with a value of 1, an interest in movie scenes with a value of 3, and an interest in actors with a value of 5. For a film that is 30% science fiction and 20% action, the scene quality could earn a value of 2 while the actors’ performance earns a value of 3. A user’s rating for a movie is determined from a comprehensive assessment of the satisfaction that the movie brings to him or her in the various dimensions. Based on this idea, the psychometrics model is extended to multidimension, which is expressed as log
𝑃𝑢𝑖𝑘𝑙 = 𝐵𝑢𝑙 − 𝐷𝑖𝑙 − 𝐹𝑘 𝑃𝑢𝑖(𝑘−1)𝑙 𝑘 = 2, 3, . . . , 𝐾; 𝑙 = 1, 2, . . . , 𝐿,
(5)
𝐹1 = 0, where 𝑃𝑢𝑖𝑘𝑙 is the probability of user 𝑢 assigning rating score 𝑘 to item 𝑖 in dimension 𝑙 and 𝐵𝑢𝑙 is the interest value of user 𝑢 in dimension 𝑙. 𝐵𝑢 = (𝐵𝑢1 , 𝐵𝑢2 , . . . , 𝐵𝑢𝐿 )𝑇 denotes the interest vector of user 𝑢. A high value of 𝐵𝑢𝑙 indicates that user 𝑢 has a strong interest in dimension 𝑙, which implies that if a film can satisfy a user’s interest in this area, then he or she will assign a high latent rating value to this film in this dimension. 𝐷𝑖𝑙 is the quality value of item 𝑖 in dimension 𝑙; therefore, 𝐷𝑖 = (𝐷𝑖1 , 𝐷𝑖2 , . . . , 𝐷𝑖𝐿 )𝑇 can denote the quality vector of item 𝑖. Higher 𝐷𝑖𝑙 indicates that item 𝑖 has less content related to dimension 𝑙 and is less probable of earning a high rating in dimension 𝑙, and 𝐹𝑘 is the ordered threshold that measures the difficulty for all users to assign 𝑘 points relative to assigning 𝑘 − 1 points to an item. Each item has a K-level rating. From the MovieLens (http://www.grouplens.org/) dataset, 𝐾 is set to 5. 𝐿 is the number of dimensions, which denotes the number of latent interests or demands each user has, and it is a metaparameter, which should be set in advance. If 𝐿 is set to 1, this model will degenerate into the model represented by (3). Parameters 𝐵𝑢𝑙 , 𝐷𝑖𝑙 , and 𝐹𝑘 should be estimated using the training set. To simplify, the notation 𝜓𝑘 is introduced, and (6)–(8) can be deduced from (5). Hence, 𝑘
𝜓𝑘 = − ∑𝐹𝑗 ,
(6)
𝜓1 = 0,
(7)
𝑗=1
𝑃𝑢𝑖𝑘𝑙 =
𝑒𝜓𝑘 +(𝑘−1)(𝐵𝑢𝑙 −𝐷𝑖𝑙 ) 𝜓𝑗 +(𝑗−1)(𝐵𝑢𝑙 −𝐷𝑖𝑙 ) ∑𝐾 𝑗=1 𝑒
𝑘 = 1, 2, . . . , 𝐾; 𝑙 = 1, 2, . . . , 𝐿.
Equation (8) shows that the rating of user 𝑢 for item 𝑖 in dimension 𝑙 is of a multinomial distribution with 𝐾 categories determined by 𝐵𝑢𝑙 , 𝐷𝑖𝑙 , and 𝜓𝑘 . After 𝑃𝑢𝑖𝑘𝑙 (𝑘 = 1, 2, . . . , 𝐾) is obtained, there are two methods to estimate the latent rating of user 𝑢 for item 𝑖 in dimension 𝑙 (denoted by ̂𝑟𝑢𝑖𝑙 ), and they are as follows: (1) The rating score corresponding to the biggest probability: ̂𝑟𝑢𝑖𝑙 = arg max 𝑃𝑢𝑖𝑘𝑙 .
(9)
𝑘
(2) The expectation given by 𝐾
̂𝑟𝑢𝑖𝑙 = ∑ 𝑘 ⋅ 𝑃𝑢𝑖𝑘𝑙 .
(10)
𝑘=1
In this paper, for simplicity, the second method is used to estimate the latent rating of user 𝑢 for item 𝑖 in dimension 𝑙 because the function of ̂𝑟𝑢𝑖𝑙 described by (10) is continuous while the function of (9) is not continuous. After ̂𝑟𝑢𝑖𝑙 (𝑙 = 1, 2, . . . , 𝐿) is obtained, there are three methods to estimate the rating value of user 𝑢 for item 𝑖, and they are formulated by (11)–(13). In this paper, for simplicity, (13) is used to estimate the rating value of user 𝑢 for item 𝑖. The three methods are as follows: (1) The maximum value of ̂𝑟𝑢𝑖𝑙 (𝑙 = 1, 2, . . . , 𝐿) as follows: ̂𝑟𝑢𝑖 = max ̂𝑟𝑢𝑖𝑙 .
(11)
𝑙
(2) The minimum value of ̂𝑟𝑢𝑖𝑙 (𝑙 = 1, 2, . . . , 𝐿) as follows: ̂𝑟𝑢𝑖 = min ̂𝑟𝑢𝑖𝑙 .
(12)
𝑙
(3) The weighted summation of ̂𝑟𝑢𝑖𝑙 (𝑙 = 1, 2, . . . , 𝐿) as follows: ̂𝑟𝑢𝑖 =
∑𝐿𝑙=1 𝑤𝑢𝑙 ⋅ ̂𝑟𝑢𝑖𝑙 ∑𝐿𝑙=1 𝑤𝑢𝑙
,
(13)
where 𝑤𝑢𝑙 ≥ 0 and denotes the weight of user 𝑢 in dimension 𝑙. It also represents the importance of the 𝑙th interest or demand for user 𝑢; therefore, the weight vector of user 𝑢 can be determined by 𝑤𝑢 = {𝑤𝑢1 , 𝑤𝑢2 , . . . , 𝑤𝑢𝐿 }𝑇 , and it will be estimated using the training set. In order to learn the parameters, the loss function is designed as 𝑓 = ∑ (𝑟𝑢𝑖 − ̂𝑟𝑢𝑖 )
2
(𝑢,𝑖)∈Tr
(14) (8)
2
2
2
2
+ 𝜆 (∑𝑤𝑢𝑙 + ∑𝐵𝑢𝑙 + ∑𝐷𝑖𝑙 + ∑𝜓𝑗 ) , 𝑢,𝑙
𝑢,𝑙
𝑖,𝑙
𝑗
4
Mathematical Problems in Engineering
where Tr denotes the training set. The first term on the right-hand side of the equation is the sum of the square errors, and the other four terms are the regularization terms that are applied to the parameters to avoid overfitting. The regularization constant 𝜆 is a parameter that requires tuning. It is easy to find that the partial derivative of the loss function is an elementary function; therefore, the partial derivative of the loss function is continuous, and the loss function is differentiable. Thus, the stochastic gradient descent method [14] can be used to learn the parameters. Convergence of the stochastic gradient descent method has been empirically verified in many previous works [14, 15, 35], given the appropriate learning ratio parameters. Each rating 𝑟𝑢𝑖 in the training set Tr is used to update the parameters according to (17)–(20). Parameter 𝜓1 should not be updated and is fixed as 0 according to (7). Learning ratio parameters 𝛾1 , 𝛾2 , and 𝛾3 are parameters that should be tuned. For easy representation, notations 𝑒𝑢𝑖 and 𝜓𝑗𝑢𝑖𝑙 are introduced by (15) and (16). Hence, we have the following: 𝑒𝑢𝑖 = 𝑟𝑢𝑖 − ̂𝑟𝑢𝑖 ,
(15)
𝜓𝑗𝑢𝑖𝑙 = 𝑒𝜓𝑗 +(𝑗−1)(𝐵𝑢𝑙 −𝐷𝑖𝑙 )
for 𝑗 = 1, 2, . . . , 𝐾; 𝑙 = 1, 2, . . . , 𝐿,
(16)
̂𝑟𝑢𝑖𝑙 ∑𝐿𝑙=1 𝑤𝑢𝑙 − ∑𝐿𝑙=1 (𝑤𝑢𝑙̂𝑟𝑢𝑖𝑙 ) 2
(∑𝐿𝑙=1 𝑤𝑢𝑙 )
𝐵𝑢𝑙 ← 𝐵𝑢𝑙 + 𝛾2 (
⋅
(𝑘 −
𝑒𝑢𝑖 𝑤𝑢𝑙 𝐿 ∑𝑙=1 𝑤𝑢𝑙
1) 𝜓𝑘𝑢𝑖𝑙 (∑𝐾 𝑚=1
(17)
𝑃𝑢𝑖𝑘 =
𝜓𝑚𝑢𝑖𝑙 ) − 𝜓𝑘𝑢𝑖𝑙 (∑𝐾 𝑚=1 2 𝐾 (∑𝑚=1 𝜓𝑚𝑢𝑖𝑙 )
(𝑚 − 1) 𝜓𝑚𝑢𝑖𝑙 )
) (18)
∑𝐿𝑙=1 𝑤𝑢𝑙
𝑤𝑢𝑙 ( ∑ 𝑘 𝑘=1
𝐾
𝐾
(1 − 𝑘) 𝜓𝑘𝑢𝑖𝑙 (∑𝑚=1 𝜓𝑚𝑢𝑖𝑙 ) − 𝜓𝑘𝑢𝑖𝑙 (∑𝑚=1 (1 − 𝑚) 𝜓𝑚𝑢𝑖𝑙 ) (∑𝐾 𝑚=1 𝜓𝑚𝑢𝑖𝑙 )
2
) (19)
− 𝜆𝐷𝑖𝑙 ) ,
⋅
𝑒𝑢𝑖 ∑𝐿𝑙=1 𝑤𝑢𝑙
𝐿
(∑𝑤𝑢𝑙 𝑙=1
𝐾 𝑗𝜓𝑗𝑢𝑖𝑙 (∑𝐾 𝑚=1 𝜓𝑚𝑢𝑖𝑙 ) − (∑𝑚=1 𝑚𝜓𝑚𝑢𝑖𝑙 ) 𝜓𝑗𝑢𝑖𝑙
(∑𝐾 𝑚=1
2
𝜓𝑚𝑢𝑖𝑙 )
,
(22)
(23)
𝑃𝑘 ∝ 𝑟𝑢𝑖 = 𝑘 ∝ ∑∑𝑦𝑢𝑖 𝑃𝑢𝑖𝑘 , 𝑢
𝐾
𝑒𝑢𝑖
∑𝐿𝑙=1 𝑤𝑢𝑙
𝜕𝑃𝑢𝑖𝑘 > 0, 𝜕 (𝜓𝑘 )
𝑘=1
𝜕𝑃𝑘 > 0. 𝜕 (𝜓𝑘 )
𝐷𝑖𝑙 ← 𝐷𝑖𝑙 + 𝛾2 (
𝜓𝑗 ← 𝜓𝑗 + 𝛾3 (
∑𝐿𝑙=1 𝑤𝑢𝑙 𝑃𝑢𝑖𝑘𝑙
𝐾
(∑𝑘
) − 𝜆𝜓𝑗 )
for 𝑗 = 2, . . . , 𝐾.
(20)
(21)
> 0,
) − 𝜆𝑤𝑢𝑙 )) ,
− 𝜆𝐵𝑢𝑙 ) ,
⋅
2.2. Transfer Learning Based on Multidimensional Psychometrics Model. In this section, we will represent the notion that, in the multidimensional psychometrics model, the rating preferences parameters of all the datasets are similar, and these parameters may be the common knowledge that could be shared from source domain to target domain. Based on this idea, a novel transfer learning method is proposed. Equations (21)–(25) can be derived from (8), (10), and (13), where 𝜓𝑘 is defined by (6) and (7), and the notation “≅” means that the two sides of the equation have the same sign. 𝑃𝑢𝑖𝑘 denotes the probability for user 𝑢 to give score 𝑘 to item 𝑖, and 𝑃𝑘 denotes the probability of getting score 𝑘 for an item. The notation “∝” means that the two sides of the equation have the same increase or decrease trend, and the notation |𝑟𝑢𝑖 = 𝑘| denotes the number of ratings 𝑘 in the training set. If the entry (𝑢, 𝑖) is observed in the training set, 𝑦𝑢𝑖 = 1, or not, 𝑦𝑢𝑖 = 0, 𝐾 𝜕𝑃𝑢𝑖𝑘𝑙 ≅ ( ∑ 𝑒𝜓𝑗 +(𝑗−1)(𝐵𝑢𝑙 −𝐷𝑖𝑙 ) ) − 𝑒𝜓𝑘 +(𝑘−1)(𝐵𝑢𝑙 −𝐷𝑖𝑙 ) 𝜕 (𝜓𝑘 ) 𝑗=1
𝑤𝑢𝑙 ← max (0, 𝑤𝑢𝑙
+ 𝛾1 (𝑒𝑢𝑖 (
The pseudo codes of the collaborative filtering using multidimensional psychometrics model (CFMPM) are shown in Algorithm 1. After the parameters have been estimated by the algorithm, the ratings in the test set can be predicted by (13).
𝑖
(24) (25)
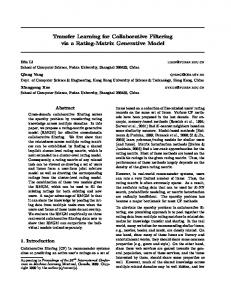
From (25), we can see that the sign of the partial derivative of 𝑃𝑘 with respect to 𝜓𝑘 is constant and positive, which means that when 𝜓𝑘 increases, users have a higher probability (i.e., 𝑃𝑘 ) of assigning score 𝑘 to item 𝑖 and vice versa. It also means that a higher value of 𝑃𝑘 will result in a higher value of 𝜓𝑘 , and a lower value of 𝑃𝑘 will result in a lower value of 𝜓𝑘 . In reality, users rarely assign a bad evaluation. Users usually give a score of 4 or 5 (in a 1–5-scaled rating system) to an item because if a user does not like the item, the user will not buy it at all. The proportion of each rating score in three different datasets is shown in Figure 1, which shows that the rating score distributions in the three datasets are similar. It means that the users in the different domains have similar rating preferences; that is, the threshold 𝜓𝑘 is usually similar in different domains. Based on this idea, if we learn parameter 𝜓𝑘 from the source domain and transfer it to the target domain, the prediction accuracy in the target domain will possibly be improved. Because of the similarity of parameter
Mathematical Problems in Engineering
5
Input: Training set Tr Output: 𝐵𝑢 , 𝐷𝑖 , 𝑤𝑢 , and 𝜓𝑘 (𝑘 = 2, 3, . . . , 𝐾) (1) Initialize parameters 𝐵𝑢 , 𝐷𝑖 , 𝑤𝑢 , 𝜓𝑘 , 𝛾1 , 𝛾2 , 𝛾3 , and 𝜆. (2) For each iteration (3) Randomly permutate the data in Tr. (4) For each 𝑟𝑢𝑖 in Tr (5) Compute 𝑒𝑢𝑖 by (15); (6) Compute 𝜓𝑗𝑢𝑖𝑙 (𝑗 = 1, 2, . . . , 𝐾; 𝑙 = 1, 2, . . . , 𝐿) by (16); (7) Update the parameters according to (17)–(20). (8) End for (9) Decrease 𝛾1 , 𝛾2 , 𝛾3 ; they are multiplied by 0.9. (10) End for Algorithm 1: Collaborative filtering using multidimensional psychometrics model (CFMPM).
0.45
based transfer learning method CBT, which is reported in [23].
0.40 0.35 Proportion
0.30 0.25 0.20 0.15 0.10 0.05 0.00
1
2
MovieLens BookCrossing
3
4
5
EachMovie
Figure 1: The proportion of each rating score on the three datasets (e.g., about 5 percent of all the ratings in MovieLens and EachMovie are 1).
𝜓𝑘 across different domains, the parameter 𝜓𝑘 learned from the source domain contains the information about the target domain. Meanwhile, transferring 𝜓𝑘 into the target domain will increase the model’s generalization capability according to Occam’s Razor, as it reduces the number of parameters to be learned. Therefore, a new transfer learning method is designed as shown in Algorithm 2, which is called TLMPM (transfer learning based on multidimensional psychometrics model).
3. Results Two experiments are designed to evaluate the performance of the algorithm TLMPM. The first one is to estimate the sensitivity of parameter 𝜓𝑘 and to compare algorithms TLMPM and CFMPM with the collaborative filtering algorithms proposed in [20, 21], which are based on onedimensional psychometrics. The other experiment is used to compare TLMPM with other representative state-of-theart algorithms including nonnegative matrix trifactorization
3.1. Datasets and Evaluation Metrics. We use the following datasets in our empirical tests. EachMovie (http://www.cs.cmu.edu/∼lebanon/IR-lab.htm) (source domain) is a movie rating dataset that contains 2.8 million ratings (scales 0–5) rated by 72,916 users for 1,628 movies. Because user’s implicit feedback is denoted by score 0 in the EachMovie dataset and this implicit feedback has many noises, we removed the score 0. Similar to Li et al. [23], we extract a submatrix to simulate the source domain by selecting 500 users and 500 movies with the most ratings (rating ratio 54.67%). MovieLens (http://www.grouplens.org/) (target domain) is a movie rating dataset that contains 100,000 rating scores (1–5 scales) rated by 943 users for 1682 items, where each user has more than 20 ratings. BookCrossing (http://www.informatik.uni-freiburg.de/∼ cziegler/BX/) (target domain) contains 77,805 users, 433,671 ratings (scales 1–10), and approximately 185,973 books. We normalize the rating scales from 1 to 5. We use Mean Absolute Error (MAE) as the evaluation metric. It is used to average the absolute deviation between the predicted values and the true values: MAE =
∑(𝑢,𝑖)∈Te 𝑟𝑢𝑖 − ̂𝑟𝑢𝑖 , |Te|
(26)
where |Te| is the number of tested ratings in test set Te. The lower the MAE is, the better the performance is. 3.2. Performance Comparison between Psychometrics-Based CF Algorithms. In this section, we will evaluate the proposed algorithms using the MovieLens dataset and the BookCrossing dataset. Here, we named the one-dimensional psychometrics model-based algorithms proposed in [20, 21] CFOPM 1 and CFOPM 2, respectively. To estimate the necessity of the parameter 𝜓𝑘 in our algorithm CFMPM, a method called CFMPM L is designed which differs from CFMPM only in that its parameter 𝜓𝑘 is set to 0, and it will always remain unchanged. Fivefold cross-validation
6
Mathematical Problems in Engineering
Input: The data of the source domain denoted by Trsrc and the training data set of the target domain denoted by Trtgt . Output: Parameters 𝐵𝑢 , 𝐷𝑖 , 𝑤𝑢 , and 𝜓𝑘 (𝑘 = 2, 3, . . . , 𝐾) of the target domain. (1) Learn the parameters of the source domain by algorithm CFMPM using Trsrc , and get parameters 𝜓𝑘 (𝑘 = 2, 3, . . . , 𝐾) of the source domain. (2) Set parameters 𝜓𝑘 (𝑘 = 2, 3, . . . , 𝐾) of the target domain equal to the parameters 𝜓𝑘 (𝑘 = 2, 3, . . . , 𝐾) of the source domain, respectively. (3) Initialize parameters 𝐵𝑢 , 𝐷𝑖 , 𝑤𝑢 , 𝛾1 , 𝛾2 and 𝜆 of the target domain. (4) For each iteration (5) Randomly permutate the data in Trtgt . (6) For each 𝑟𝑢𝑖 in Trtgt . (7) Compute 𝑒𝑢𝑖 by (15); (8) Compute 𝜓𝑗𝑢𝑖𝑙 (𝑗 = 1, 2, . . . , 𝐾; 𝑙 = 1, 2, . . . , 𝐿) by (16); (9) Update the parameters according to (17)–(19). (10) End for (11) Decrease 𝛾1 , 𝛾2 ; they are multiplied by 0.9. (12) End for Algorithm 2: Transfer learning based on multidimensional psychometrics model (TLMPM). Table 1: Comparison on MAE with the algorithms reported in [20, 21].
MovieLens BookCrossing
TLMPM 0.7215 0.6112
CFMPM L 0.7329 0.6384
was performed for each dataset, and, for every test set, the algorithms were run independently 5 times, and the average MAE over 25 times is reported. In this experiment, the parameters in TLMPM, CFMPM L, and CFMPM are set as follows: the initial values of 𝐵𝑢𝑙 and 𝐷𝑖𝑙 are sampled from the uniform distribution on [0, 0.5]; the initial value of 𝑤𝑢𝑙 is set to 1; and the initial value of 𝜓𝑘 (𝑘 = 1, 2, . . . , 𝐾) is set to 0; the values in {0.001, 0.01, 0.1} are used to tune the parameter 𝜆; and the values in {0.01, 0.02, 0.05, 0.1, 0.2, 0.5} are used to tune the parameters 𝛾1 , 𝛾2 , and 𝛾3 ; the values in {5, 10, 15, 20, 25} are used to tune L, the dimension of latent interests. To evaluate algorithm TLMPM, firstly, algorithm CFMPM is used to learn parameters 𝜓𝑘 (𝑘 = 2, 3, . . . , 𝐾) from EachMovie dataset as described in the previous section, and then the learned parameters 𝜓𝑘 (𝑘 = 2, 3, . . . , 𝐾) are copied to the target domain and held constant to learn the other parameters. The results are shown in Table 1. In Table 1, the results of CFOPM 1 and CFOPM 2 for the MovieLens dataset are extracted directly from Hu’s papers [20, 21]. The MAE values for these two algorithms on BookCrossing dataset are our experimental results, and our experimental settings are according to the papers of Hu et al. [20, 21]. From Table 1, it is shown that, of the two datasets, algorithm CFMPM outperforms CFOPM 1. Although the MAE of CFMPM is not significantly lower than that of CFOPM 2 on MovieLens, CFMPM has a significantly lower MAE than CFOPM 2 has on BookCrossing dataset. The time complexity of CFMPM is 𝑂(𝑇𝑁𝐿2 𝐾2 ), while the time complexity of CFOPM 2 is 𝑂(𝑈2 𝑉). Here, T is the iterate times, N is the number of ratings in training set, 𝐿 is the dimensionality of user’s interest, 𝐾 is the rating levels, 𝑈 is the number of users, and 𝑉 is the number of items. In our experiments, 𝐿 is smaller
CFMPM 0.7249 0.6147
CFOPM 1 0.80 0.6556
CFOPM 2 0.7250 0.6871
than 25 and 𝑇 is smaller than 30. Therefore, on the MovieLens dataset, the time complexity of CFMPM is 𝑂(4.69𝐸 + 10) and it is 𝑂(1.5𝐸 + 09) for CFOPM 2. On the BookCrossing dataset, the time complexities for CFMPM and CFOPM 2 are 𝑂(2.03𝐸 + 11) and 𝑂(1.13𝐸 + 15), respectively. Thus, if the rating matrix is extremely sparse, for example, BookCrossing, CFMPM will have a lower computational time than CFOPM 2. This means that extending the psychometrics model from one dimension to multidimension is effective. Meanwhile, algorithm CFMPM outperforms CFMPM L, which verifies that parameters 𝜓𝑘 (𝑘 = 1, . . . , 5) are essential in this model, although the number of these parameters is only 5. Furthermore, the algorithm TLMPM outperforms CFMPM, which means that the transfer is positive even though only four parameters (i.e., 𝜓2 , 𝜓3 , 𝜓4 , and 𝜓5 ) were transferred from the source domain to the target domain. 3.3. Performance Comparison between TLMPM and Other State-of-the-Art Algorithms. The compared algorithms are Codebook Transfer (CBT) [23] and the other baseline algorithms used in [23], which are Scalable Cluster-Based Smoothing (CBS) [36] and user-based CF based on Pearson correlation coefficients (PCC) similarity [37]. Algorithm CBT [23] is a representative transfer learning method based on nonnegative matrix trifactorization. Except for TLMPM and CBT, the other algorithms only use the data in the target domain to predict the ratings in the test set. To consistently compare algorithm TLMPM with the other algorithms described above, as in [23], we also extract a subset of the MovieLens dataset, which contains 1000 items and 500 users, where each user has more than 40 ratings (rating ratio 10.35%). For each run of algorithm TLMPM, the
Mathematical Problems in Engineering
7
0.93
0.93
0.88
0.88
0.83 0.83
0.78 0.73
0.78 Given5 TLMPM CBT
Given10
Given15
CBS PCC
0.73
Figure 2: MAE on the dataset ML 100. 0.93
Given10
TLMPM CBT
CBS PCC
Given15
Figure 4: MAE on the dataset ML 300. 0.75
0.88
0.83
0.70
0.78
0.65
0.73
Given5
Given5
Given10
TLMPM CBT
CBS PCC
Given15
Figure 3: MAE on the dataset ML 200.
training set and the test set are generated as follows. First, 500 users were randomly sorted. Second, the first 100, 200, or 300 users were selected as training sets and denoted as ML 100, ML 200, and ML 300, respectively, and the test set contains the last 200 users. Additionally, in order to evaluate the performance of the algorithm at different data sparsity levels, as [23] did, the available ratings of each test user are also split into an observed set and a held-out set. The observed ratings are used to predict the held-out ratings. We randomly selected 5, 10, and 15 items rated by each test user to constitute the observed set, and they are named Given5, Given10, and Given15, respectively, while the other items rated by the test user constitute the held-out set. The BookCrossing dataset is also preprocessed using the same method described above and then produces three training datasets denoted by BX 100, BX 200, and BX 300, respectively. In this experiment, the parameters in algorithm TLMPM are initialized in the same way as described in the previous section. The comparison results are shown in Figures 2–7, and the reported results of algorithm TLMPM are the average MAE over 10 independent run times. From Figures 2–7, we can see that the algorithm TLMPM almost outperforms all the other algorithms at each sparsity level on all datasets, which verifies that transferring rating
0.60
0.55
Given5
Given10
TLMPM CBT
CBS PCC
Given15
Figure 5: MAE on the dataset BX 100.
preferences from the source domain to the target domain is effective.
4. Discussion This paper extended the psychometric model from one dimension to multidimension to model user’s multi-interests and then proposed algorithm CFMPM, which outperforms the algorithm based on the one-dimensional psychometric model. After that, a novel transfer learning algorithm based on CFMPM was developed. In this transfer algorithm, the psychometric model is used to learn user’s rating preferences from the source domain and then transfer them to the target domain. This transfer algorithm does not require two domains having overlapped users or items. Experimental results show that it is a positive transfer and that it outperforms other representative state-of-the-art algorithms such as CBT, the transfer algorithm based on nonnegative matrix trifactorization. But, in a 5-scaled rating system, the number of transferred parameters is only 4, which limits the algorithm’s effectiveness. In future work, we intend to
8
Mathematical Problems in Engineering 0.75
References
0.70 0.65 0.60 0.55
Given5
Given10
TLMPM CBT
CBS PCC
Given15
Figure 6: MAE on the dataset BX 200.
0.75
0.70
0.65
0.60
0.55
Given5
Given10
TLMPM CBT
CBS PCC
Given15
Figure 7: MAE on the dataset BX 300.
study how to break this limitation and how to speed up the algorithm.
Competing Interests The authors declare that there are no competing interests regarding the publication of this paper.
Acknowledgments The authors appreciate Yan Chen, Senzhang Wang, Yang Yang, and Xiaoming Zhang for their constructive suggestions for polishing this paper. This work is supported by the National Natural Science Foundation of China (nos. 61370126, 71540028, and 61571052), the Fund of Beijing Social Science (no. 14JGC103), the Statistics Research Project of National Bureau (no. 2013LY055), the Fund of Beijing Key Laboratory (no. BZ0211), and the High-Level Research Projects’ Cultivation Fund of Beijing Wuzi University (no. GJB20141002).
[1] G. Adomavicius and A. Tuzhilin, “Toward the next generation of recommender systems: a survey of the state-of-the-art and possible extensions,” IEEE Transactions on Knowledge and Data Engineering, vol. 17, no. 6, pp. 734–749, 2005. [2] J. B. Schafer, D. Frankowski, J. Herlocker, and S. Sen, “Collaborative filtering recommender systems,” in The Adaptive Web, P. Brusilovsky, A. Kobsa, and W. Nejdl, Eds., vol. 4321 of Lecture Notes in Computer Science, pp. 291–324, Springer, Berlin, Germany, 2007. [3] M. O’Connor and J. Herlocker, “Clustering items for collaborative filtering,” in Proceedings of the ACM SIGIR Workshop on Recommender Systems (SIGIR ’99), Berkeley, Calif, USA, August 1999. [4] B. M. Sarwar, G. Karypis, J. Konstan, and J. Riedl, “Recommender systems for large-scale e-commerce: scalable neighborhood formation using clustering,” in Proceedings of the 5th International Conference on Computer and Information Technology (ICCIT ’02), 2002. [5] S. Vucetic and Z. Obradovic, “Collaborative filtering using a regression-based approach,” Knowledge and Information Systems, vol. 7, no. 1, pp. 1–22, 2005. [6] X. Su and T. M. Khoshgoftaar, “Collaborative filtering for multiclass data using belief nets algorithms,” in Proceedings of the 18th IEEE International Conference on Tools with Artificial Intelligence (ICTAI ’06), pp. 497–504, IEEE, Arlington, Va, USA, October 2006. [7] K. Miyahara and M. J. Pazzani, “Collaborative filtering with the simple Bayesian classifier,” in PRICAI 2000 Topics in Artificial Intelligence: 6th Pacific Rim International Conference on Artificial Intelligence Melbourne, Australia, August 28–September 1, 2000 Proceedings, vol. 1886 of Lecture Notes in Computer Science, pp. 679–689, Springer, Berlin, Germany, 2000. [8] T. Hofmann, “Latent semantic models for collaborative filtering,” ACM Transactions on Information Systems, vol. 22, no. 1, pp. 89–115, 2004. [9] T. Hofmann and J. Puzicha, “Latent class models for collaborative filtering,” in Proceedings of the International Joint Conference on Artificial Intelligence, vol. 16, pp. 688–693, 1999. [10] D. M. Blei, A. Y. Ng, and M. I. Jordan, “Latent dirichlet allocation,” Journal of Machine Learning Research, vol. 3, no. 4-5, pp. 993–1022, 2003. [11] B. Sarwar, G. Karypis, J. Konstan, and J. Riedl, “Application of dimensionality reduction in recommender system—a case study,” in Proceedings of the ACM KDD Workshop on Web Mining for e-Commerce-Challenges and Opportunities, Boston, Mass, USA, August 2000. [12] B. Sarwar, G. Karypis, J. Konstan, and J. Riedl, “Incremental singular value decomposition algorithms for highly scalable recommender systems,” in Proceedings of the 5th International Conference on Computer and Information Science, 2002. [13] S. Funk, “Netflix update: try this at home,” Tech. Rep., 2006, http://www.sifter.org/∼simon/journal/20061211.html. [14] Y. Koren, “Factorization meets the neighborhood: a multifaceted collaborative filtering model,” in Proceedings of the 14th ACM SIGKDD International Conference on Knowledge Discovery and Data Mining, pp. 426–434, Las Vegas, Nev, USA, August 2008. [15] Y. Koren, R. Bell, and C. Volinsky, “Matrix factorization techniques for recommender systems,” Computer, vol. 42, no. 8, pp. 30–37, 2009.
Mathematical Problems in Engineering [16] K. Goldberg, T. Roeder, D. Gupta, and C. Perkins, “Eigentaste: a constant time collaborative filtering algorithm,” Information Retrieval, vol. 4, no. 2, pp. 133–151, 2001. [17] G. Chen, F. Wang, and C. Zhang, “Collaborative filtering using orthogonal nonnegative matrix tri-factorization,” Information Processing & Management, vol. 45, no. 3, pp. 368–379, 2009. [18] T. C. Zhou, H. Ma, I. King et al., “Tagrec: leveraging tagging wisdom for recommendation,” in Proceedings of the International Conference on Computational Science and Engineering (CSE ’09), vol. 4, pp. 194–199, Vancouver, Canada, August 2009. [19] R. Salakhutdinov, A. Mnih, and G. Hinton, “Restricted Boltzmann machines for collaborative filtering,” in Proceedings of the 24th International Conference on Machine Learning (ICML ’07), pp. 791–798, Corvallis, Ore, USA, June 2007. [20] B. Hu, Z. Li, and J. Wang, “User’s latent interest-based collaborative filtering,” in Proceedings of 32nd European Conference on Information Retrieval: 32nd European Conference on IR Research, ECIR 2010, Milton Keynes, UK, March 28–31, 2010.Proceedings, vol. 5993 of Lecture Notes in Computer Science, pp. 619– 622, Springer, Berlin, Germany, 2010. [21] B. Hu, Z. Li, W. Chao, X. Hu, and J. Wang, “User preference representation based on psychometric models,” in Proceedings of the 22nd Australia Database Conference (ADC ’11), pp. 59–66, Perth, Australia, 2011. [22] S. J. Pan and Q. Yang, “A survey on transfer learning,” IEEE Transactions on Knowledge and Data Engineering, vol. 22, no. 10, pp. 1345–1359, 2010. [23] B. Li, Q. Yang, and X. Xue, “Can movies and books collaborate? Cross-domain collaborative filtering for sparsity reduction,” in Proceedings of the 21st International Joint Conference on Artifical Intelligence, pp. 2052–2057, Pasadena, Calif, USA, July 2009. [24] W. Pan, E. W. Xiang, N. N. Liu, and Q. Yang, “Transfer learning in collaborative filtering for sparsity reduction,” in Proceedings of the 24th AAAI Conference on Artificial Intelligence, 2010. [25] W. Pan, N. N. Liu, E. W. Xiang, and Q. Yang, “Transfer learning to predict missing ratings via heterogeneous user feedbacks,” in Proceedings of the 22nd International Joint Conference on Artificial Intelligence, pp. 2318–2323, Barcelona, Spain, July 2011. [26] W. Pan, E. W. Xiang, and Q. Yang, “Transfer learning in collaborative filtering with uncertain ratings,” in Proceedings of the 26th AAAI Conference on Artificial Intelligence, pp. 662–668, Toronto, Canada, July 2012. [27] L. Shao, F. Zhu, and X. Li, “Transfer learning for visual categorization: a survey,” IEEE Transactions on Neural Networks and Learning Systems, vol. 26, no. 5, pp. 1019–1034, 2015. [28] Z. Deng, K.-S. Choi, Y. Jiang, and S. Wang, “Generalized hidden-mapping ridge regression, knowledge-leveraged inductive transfer learning for neural networks, fuzzy systems and kernel methods,” IEEE Transactions on Cybernetics, vol. 44, no. 12, pp. 2585–2599, 2014. [29] J. Lu, V. Behbood, P. Hao, H. Zuo, S. Xue, and G. Zhang, “Transfer learning using computational intelligence: a survey,” Knowledge-Based Systems, vol. 80, pp. 14–23, 2015. [30] M. T. Rosenstein, Z. Marx, L. P. Kaelbling, and T. G. Dietterich, “To transfer or not to transfer,” in Proceedings of the Workshop on Inductive Transfer: 10 Years Later (NIPS ’05), vol. 2, p. 7, December 2005. [31] X. Shi, W. Fan, and J. Ren, “Actively transfer domain knowledge,” in Machine Learning and Knowledge Discovery in Databases, pp. 342–357, Springer, Berlin, Germany, 2008.
9 [32] C. Ding, T. Li, W. Peng et al., “Orthogonal nonnegative matrix t-factorizations for clustering,” in Proceedings of the 12th ACM SIGKDD International Conference on Knowledge Discovery and Data Mining, pp. 126–135, ACM, Philadelphia, Pa, USA, August 2006. [33] H. Zhang, X. Zhang, Z. Li, and C. Liu, “Collaborative filtering using multidimensional psychometrics model,” in Web-Age Information Management, J. Wang, H. Xiong, Y. Ishikawa, J. Xu, and J. Zhou, Eds., vol. 7923 of Lecture Notes in Computer Science, pp. 691–697, 2013. [34] J. M. Linacre, WINSTEPS: Rasch Measurement Computer Program, Winsteps, Chicago, Ill, USA, 2007. [35] Y. Koren, “Collaborative filtering with temporal dynamics,” Communications of the ACM, vol. 53, no. 4, pp. 89–97, 2010. [36] G.-R. Xue, C. Lin, Q. Yang et al., “Scalable collaborative filtering using cluster-based smoothing,” in Proceedings of the 28th Annual International ACM SIGIR Conference on Research and Development in Information Retrieval (SIGIR ’05), pp. 114–121, Salvador, Brazil, August 2005. [37] X. Su and T. M. Khoshgoftaar, “A survey of collaborative filtering techniques,” Advances in Artificial Intelligence, vol. 2009, Article ID 421425, 19 pages, 2009.
Advances in
Operations Research Hindawi Publishing Corporation http://www.hindawi.com
Volume 2014
Advances in
Decision Sciences Hindawi Publishing Corporation http://www.hindawi.com
Volume 2014
Journal of
Applied Mathematics
Algebra
Hindawi Publishing Corporation http://www.hindawi.com
Hindawi Publishing Corporation http://www.hindawi.com
Volume 2014
Journal of
Probability and Statistics Volume 2014
The Scientific World Journal Hindawi Publishing Corporation http://www.hindawi.com
Hindawi Publishing Corporation http://www.hindawi.com
Volume 2014
International Journal of
Differential Equations Hindawi Publishing Corporation http://www.hindawi.com
Volume 2014
Volume 2014
Submit your manuscripts at http://www.hindawi.com International Journal of
Advances in
Combinatorics Hindawi Publishing Corporation http://www.hindawi.com
Mathematical Physics Hindawi Publishing Corporation http://www.hindawi.com
Volume 2014
Journal of
Complex Analysis Hindawi Publishing Corporation http://www.hindawi.com
Volume 2014
International Journal of Mathematics and Mathematical Sciences
Mathematical Problems in Engineering
Journal of
Mathematics Hindawi Publishing Corporation http://www.hindawi.com
Volume 2014
Hindawi Publishing Corporation http://www.hindawi.com
Volume 2014
Volume 2014
Hindawi Publishing Corporation http://www.hindawi.com
Volume 2014
Discrete Mathematics
Journal of
Volume 2014
Hindawi Publishing Corporation http://www.hindawi.com
Discrete Dynamics in Nature and Society
Journal of
Function Spaces Hindawi Publishing Corporation http://www.hindawi.com
Abstract and Applied Analysis
Volume 2014
Hindawi Publishing Corporation http://www.hindawi.com
Volume 2014
Hindawi Publishing Corporation http://www.hindawi.com
Volume 2014
International Journal of
Journal of
Stochastic Analysis
Optimization
Hindawi Publishing Corporation http://www.hindawi.com
Hindawi Publishing Corporation http://www.hindawi.com
Volume 2014
Volume 2014