J Neurophysiol 109: 1117–1125, 2013. First published November 28, 2012; doi:10.1152/jn.00478.2012.
Transient spatiotopic integration across saccadic eye movements mediates visual stability Guido M. Cicchini,1* Paola Binda,2,3* David C. Burr,4,5 and M. Concetta Morrone2,6 1 Institute of Neuroscience, National Research Council (CNR), Pisa, Italy; 2Department of Translational Research on New Technologies in Medicine and Surgery, University of Pisa, Pisa, Italy; 3Department of Psychology, University of Washington, Seattle, Washington; 4Department of Neuroscience, University of Florence, Florence, Italy; 5 Department of Psychology, University of Western Australia, Crawley, Perth, Australia; and 6Scientific Institute Stella Maris (IRCSS), Pisa, Italy
Submitted 7 June 2012; accepted in final form 25 November 2012
Cicchini GM, Binda P, Burr DC, Morrone MC. Transient spatiotopic integration across saccadic eye movements mediates visual stability. J Neurophysiol 109: 1117–1125, 2013. First published November 28, 2012; doi:10.1152/jn.00478.2012.—Eye movements pose major problems to the visual system, because each new saccade changes the mapping of external objects on the retina. It is known that stimuli briefly presented around the time of saccades are systematically mislocalized, whereas continuously visible objects are perceived as spatially stable even when they undergo large transsaccadic displacements. In this study we investigated the relationship between these two phenomena and measured how human subjects perceive the position of pairs of bars briefly displayed around the time of large horizontal saccades. We show that they interact strongly, with the perisaccadic bar being drawn toward the other, dramatically altering the pattern of perisaccadic mislocalization. The interaction field extends over a wide range (200 ms and 20°) and is oriented along the retinotopic trajectory of the saccade-induced motion, suggesting a mechanism that integrates pre- and postsaccadic stimuli at different retinal locations but similar external positions. We show how transient changes in spatial integration mechanisms, which are consistent with the present psychophysical results and with the properties of “remapping cells” reported in the literature, can create transient craniotopy by merging the distinct retinal images of the pre- and postsaccadic fixations to signal a single stable object. saccades; visual stability; localization; spatial perception ONE OF THE MAJOR PROBLEMS for vision researchers is to understand the mechanisms that allow the perception of a continuous and stable panorama of the world, in the face of continuous movements of the eyes, head, and body, particularly fast, ballistic saccadic eye movements. There are strong hints from both animal electrophysiology and human psychophysics that active mechanisms are at work during saccades to maintain stable visual representations despite the displacement of the retinal image. Perhaps the most tantalizing phenomenon is a remapping of visual receptive fields that precedes each saccade, as observed in several visual areas of the nonhuman primate (Duhamel et al. 1992; Wurtz 2008), with functional magnetic resonance imaging (fMRI) and psychophysical evidence of similar mechanisms in the human brain (Cavanagh et al. 2010; Medendorp et al. 2003;
* G. M. Cicchini and P. Binda contributed equally to this work. Address for reprint requests and other correspondence: M. C. Morrone, Dept. of Translational Research on New Technologies in Medicine and Surgery, Univ. of Pisa and Institute of Neuroscience CNR Pisa, via Moruzzi 1, 56124 Pisa, Italy (e-mail:
[email protected]). www.jn.org
Melcher 2007; Merriam et al. 2003, 2007). A proportion of neurons in all these areas have receptive fields that transiently change position before each saccade, shifting in the direction of the eye movement. This phenomenon is likely related to stability, but it is less clear exactly how (Cavanagh et al. 2010; Melcher and Colby 2008; Wurtz 2008). Burr and Morrone (2010, 2011) recently suggested that although the receptive field shift does not in itself solve stability, it may set the stage for a period of transient craniotopicity, when the receptive field relaxes from the “remapped location” back to its “classical” position. Surprisingly, little work has studied this aspect of the phenomenon. Psychophysical studies show that stimuli flashed just before saccadic onset are not perceived veridically (Honda 1989; Matin and Pearce 1965; Schlag and Schlag-Rey 1995) but displaced toward the saccadic target, consistent with a compression of space (Bischof and Kramer 1968; Kaiser and Lappe 2004; Morrone et al. 1997; Ross et al. 1997). There are also errors in temporal localization, leading to delays and compression (Binda et al. 2009; Morrone et al. 2005). Whereas briefly presented stimuli are mislocalized, large displacements of steadily visible objects go unnoticed if they occur during the eye movement (Bridgeman et al. 1975), provided that there is temporal continuity between the pre- and postsaccadic visual stimulation (Deubel et al. 1998). This phenomenon, known as saccadic suppression of image displacement, inspired the “reference object theory,” which states that the immediate postsaccadic vision serves as a stable anchor for the presaccadic view, mediating visual stability (Deubel et al. 1996; Irwin et al. 1994). Although the effects of saccades on the perception of briefly flashed stimuli are large and robust and have been studied for decades, it is still unclear how exactly they relate to visual stability and to the neural phenomenon of receptive-field remapping. In this study we measure the perceptual localization of pairs of briefly flashed visual stimuli and find a strong interaction between stimuli presented in the proximity of the saccade onset, over a wide range of positions and timings. We draw a parallel between the observed spatiotemporal field of interaction and the spatiotemporal properties of receptive fields at the time of saccades. We argue that both become transiently slanted in space-time along the retinal motion trajectory during saccades, and this property can support transient transsaccadic integration in craniotopic coordinates, hence mediating perceptual stability across eye movements.
0022-3077/13 Copyright © 2013 the American Physiological Society
1117
1118
TRANSIENT SPATIOTOPIC INTEGRATION
Table 1. Parameters of the visual stimuli and number of tested subjects Experiment
Probe Position, °
Reference Position, °
Vertical Offset, °
Orientation, H/V
SOA, ms
No. of Subjects
1 2 3 4 5 6/7
⫺1 ⫺6, 4, 14, 19 ⫺1 ⫺1 ⫺12:10 ⫺1
0 Probe⫹1 0 0 0 ⫺20:20
0 0 0 0, 2, 4, 6, 8, 12 0 0
V V H or V V V V
⫹80 ⫹80 ⫹80 ⫹80 ⫹80 ⫺200:140
6 3 4 4 4 5
H, horizontal; V, vertical; SOA, stimulus offset asynchrony. MATERIALS AND METHODS
Subjects Eight subjects (6 women) participated in the experiments after giving informed consent. Subjects GMC, PB, and MCM are authors; subjects BP, KR, MP, SG, and GA were naive of the goals of the study. Each observer participated in one or more parts of the experiment (for each experiment, the number of subjects is given in Table 1). All had normal or corrected-to-normal vision. Experimental procedures were approved by the local ethics committees and are in line with the Declaration of Helsinki. Apparatus The experiments were performed in a dimly illuminated quiet room. Subjects sat before a monitor screen (60° ⫻ 45°) at a distance of 30 cm. Head position was stabilized by a chin rest with eye level aligned to screen center. Stimuli were generated by a dedicated stimulus generator (VSG2/5 framestore; Cambridge Research Systems) and presented on a CRT color monitor (Barco Calibrator) at a resolution of 896 ⫻ 547 pixels and refresh rate of 140 Hz. Visual stimuli were presented against a gray background (Commission International de l’Eclairage coordinates: x ⫽ 0.32, y ⫽0.32; luminance: 30 cd/m2). Eye Movements Eye movements were recorded by an infrared limbus eye tracker (HVS SP150), with sensor mounted below the left eye on transparent wraparound plastic goggles, through which subjects viewed the display binocularly. The VSG framestore sampled eye position at 1,000 Hz and stored the trace in digital form. In offline analysis, saccadic onset was determined by an automated fitting procedure and checked by eye. The experimenter also checked the quality of saccades and, when necessary, discarded the trial (⬍7% of trials for a corrective saccade or for unsteady fixation). For fitting details and other procedures see Binda et al. (2009). Stimuli, Task, and Procedure At the beginning of each trial, subjects fixated a 0.5° black dot presented 10° left of screen center (screen coordinates: ⫺10°, 0°, with 0° indicating the screen center and negative values implying leftward or downward displacements). The fixation dot remained visible for about 1,000 ms, and it was then replaced by the saccadic target, an identical black dot presented 10° right of center (see Fig. 1A). Subjects saccaded to it as soon as they could. Around the time of the saccade, a black “probe bar” (width: 0.2°, height: 6°; luminance: 0.05 cd/m2) and a white “reference bar” (width: 0.2°, height: 6°; luminance: 80 cd/m2) were presented for one monitor frame (7 ms). At the end of the trial, a mouse pointer (a 0.5° black dot) appeared at a random position. Subjects adjusted the pointer to match the location of the black probe bar (left-click to record the estimate) and then readjusted it to match the location of the white reference bar (left-click to record). A
right-click indicated that the subject could not report the location of the corresponding bar, and the trial was eliminated. This happened very rarely (with an average frequency of 0.2% for presaccadic probes, 6% for probe or reference presented during the saccade). Stimuli were of high contrast and contained high spatial frequencies to minimize saccadic suppression (Burr et al. 1994; Volkmann 1986). In the basic stimulus configuration, the probe and the reference bar, both vertically oriented, were presented at horizontal positions ⫺1° and 0°, respectively, vertically aligned 6° below screen center. The probe bar was presented perisaccadically, either alone or followed by the reference bar with a stimulus onset asynchrony (SOA) of ⫹80 ms (positive value means that the reference bar was presented after the probe). In a series of six experiments, we varied horizontal position of the probe and/or reference, orientation, vertical offset, or SOA. Table 1 gives the stimulus configuration used for each experiment. Data Analysis Trials were ranked according to the time of the probe presentation relative to the onset of the saccade. The time of the reference bar presentation is given by summing the time of probe presentation with the SOA between the bars. Trials were grouped in contiguous time bins (minimum 15 trials per bin, with the constraint that bins could not be smaller than 10 ms), and the median of the reported spatial position of the probe and the reference were computed for each bin. Data were also analyzed by pooling trials across all tested subjects, after ensuring that all contributed a similar number of observations. The median was preferred over the mean because it is less sensitive to outliers (see Fig. 2 for further justification). Analyses were performed using custom software developed in Matlab 7.4 (MathWorks, Natick, MA). Standard errors were computed by bootstrap with 1,000 repetitions (Efron and Tibshirani 1993). RESULTS
Subjects made 20° rightward saccades while a bar (a thin vertical black line, 6° below screen center) flashed briefly on the screen, either alone or preceded or followed by another similar bar of opposite contrast polarity (Fig. 1, A and B). The two stimuli are interchangeable, but for clarity of presentation we refer to the black bar as “probe” and the white as “reference,” given that the black bar was usually presented perisaccadically and therefore more susceptible to mislocalization. Subjects reported the perceived location of both bars by positioning the mouse cursor. Perisaccadic Mislocalization: Effect of a Postsaccadic Reference Bar Experiment 1: effect of a postsaccadic reference on a perisaccadic probe. Figure 1 illustrates our basic finding for an exemplar subject (C and D) and for data pooled across six subjects (E and F). In this experiment, the perisaccadic probe
J Neurophysiol • doi:10.1152/jn.00478.2012 • www.jn.org
TRANSIENT SPATIOTOPIC INTEGRATION
1119
bution peaks near 0°, indicating that the perisaccadic probe is strongly attracted toward the postsaccadic reference. Statistical analysis confirmed these conclusions, showing that the perceived position of a perisaccadic probe depended significantly on the presence of a reference at 0° (Mann-Whitney-Wilcoxon test comparing the distributions of perceived position with and without the reference: for all subjects, P ⬍ 0.002). Experiment 2: interaction as a function of spatial position. We extended these observations by testing different positions of the probe-reference pair. The probe was presented at four horizontal screen positions (arrows in Fig. 3), and the reference was presented 1° to the right of the probe. In all cases, the probe was attracted toward the reference bar and therefore localized quasi-veridically (given the proximity of the reference) over a range of eccentricities. This is evident both for the exemplar subject (Fig. 3, left) and the average of three subjects (Fig. 3, right).
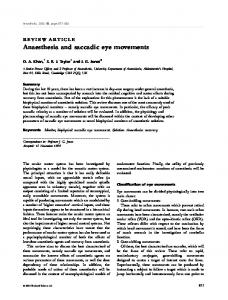
Fig. 1. A: stimulus display, with the fixation point (FP), saccade target (ST), and 2 flashed bars: reference (Ref) and probe. B: time course of presentations. C–F: perisaccadic mislocalization for a probe bar at position ⫺1°, either flashed alone (no Ref; C and E) or followed [stimulus onset asynchrony (SOA): 80 ms] by another briefly flashed bar at position 0° (D and F). The dash-dot horizontal lines show the location of the reference stimulus. The dashed horizontal line marks the location of the saccade target. The arrow indicates the screen position of the probe. Line-connected symbols plot the median reported probe position (median of data in subject GMC in C and D and pooled across 6 subjects in E and F; error bars represent SE computed by bootstrap and are often smaller than symbol size) against the delay of probe presentation from saccade onset (negative delays for presaccadic probes); and small gray symbols show single-trial data (total number of trials: 590 in E and F, distributed approximately equally across subjects).
was presented at position ⫺1°, either alone or followed 80 ms later by the reference bar at position 0°. Figure 1, C and E, shows the perceived probe position as a function of presentation time when no reference bar was presented; around saccade onset, the probe is clearly mislocalized and seen near the saccadic target (⫹10°). Figure 1, D and F, shows the perceived position of the same probe when it was followed by the reference bar. The probe is attracted toward the reference bar, rather than toward the saccade target. Because reference and probe are presented at nearby screen positions (⫺1° and 0°), the result is near-veridical localization of the probe across the perisaccadic interval. Figure 2 shows the distributions of perceived position for the probe presented alone (gray) and followed 80 ms later by the reference (black) for trials where the probe was presented between ⫺20 and 0 ms relative to saccade onset. With no reference, the distributions peak at the position of the saccade target: the well-known perisaccadic mislocalization phenomenon. However, when a reference is presented at 0°, the distri-
Probe-Reference Interaction: Orientation and Vertical Separation Experiment 3: variable probe-reference orientation. Having established that the localization of a perisaccadically flashed probe bar can be influenced by a flashed reference bar, we explored the limits of this interaction. We first varied the orientation of the reference and the probe bars, so the reference was either parallel or orthogonal to the vertical (Fig. 4A) or horizontal probe (Fig. 4B). The probe bar was presented at position ⫺1° and the reference bar at 0° (screen center), with 80-ms SOA. Data presented in Fig. 4, top, are from one subject, and data in Fig. 4, bottom, are pooled across the four tested subjects. When the reference was oriented orthogonally to the probe bar, there was little or no interaction: the localization of the perisaccadic probe was biased toward the saccade target, as if the reference bar had not been displayed. However, when the two bars were parallel, the interaction was strong, and the probe was localized near the reference throughout the entire perisaccadic interval. The results for vertical (Fig. 4A) and horizontal stimuli (Fig. 4B) are similar, indicating that the key variable is the relative orientation of probe and reference, not their absolute orientation. However, the effect is reduced for the horizontal probe-reference pair compared with the vertical stimuli, consistent with previous reports showing that stimuli elongated along the direction of the saccade do not exert a strong attraction (Deubel et al. 2002). Experiment 4: variable vertical offset. We next tested the effect of spatial proximity between reference and probe, manipulating their relative vertical position (orthogonal to the saccade). Their horizontal position was fixed (⫺1° and 0° for probe and reference, respectively); the reference bar could be displaced vertically, above the probe bar. Figure 5A shows mislocalization time courses for a probe that abuts the reference (0° vertical offset between probe and reference), leading to strong interaction (black curve). However, a vertical offset between the two stimuli strongly reduced the attraction between the reference and probe bars (gray curve). Figure 5B shows results for four vertical separations, plotting median perceived probe location for perisaccadic probes (presented ⫺20 to 0 ms before saccade onset) as a function of the vertical offset between probe and reference. No probe-reference interactions occurred when the vertical offset
J Neurophysiol • doi:10.1152/jn.00478.2012 • www.jn.org
1120
TRANSIENT SPATIOTOPIC INTEGRATION
Fig. 2. Individual subject results from experiment 1. Histograms indicate perceived position for a probe presented ⫺20 to 0 ms at position ⫺1°, either alone (gray) or followed after 80 ms by another bar presented at 0° (black). Black and gray open and filled triangles indicate mean and median perceived positions, respectively. Bar at bottom right represents a distance of 2.5° corresponding to the threshold used to define the “interaction index” reported for each subject (GMC, MCM, KR, BP, PB, and MP).
exceeded 8° (2° gap between bars), resulting in a mislocalization of the probe toward the saccade target, as it would be with no reference. Smaller offsets up to 6° (abutting bars) resulted in near-veridical probe localizations. Spatial Extent of Probe-Reference Interaction Experiment 5: variable horizontal offset. The results of experiment 4 show that a relatively small gap along the vertical direction (orthogonal to the saccade) eliminates the interaction between probe and reference. Experiment 5 tested the effect of probe-reference separation along the horizontal dimension (parallel to the saccade). The perceived position of perisaccadic probes (⫺20 to 0 ms) presented at positions ranging from ⫺12° to 10° was measured in 4 subjects with and without a reference bar at position 0°, presented with 80-ms SOA. Figure 6 shows the results for probes presented alone (open squares) or followed by the reference (filled circles), with the perceived probe position plotted against its actual screen location. Veridical probe localization would result in data points distributed along the bisection of the axis. With no reference, probes in a large range of positions (⫺5 to 10°) are localized near the saccade target. With the reference, probes in the range ⫺12 to ⫹2° are
Fig. 3. Perceived position as a function of presentation time for probes presented at variable screen locations (marked by the color-coded arrows), followed 80 ms later by an abutting reference (color-matched dashed lines). Left, data for an example subject; right, data pooled across the 3 tested subjects (total number of trials: 670). Filled symbols show the median perceived position in each temporal bin, small open symbols report data from individual trials.
localized near the reference bar instead. Two features of these results are noteworthy. First, probe and reference can interact and be perceived at similar positions even if presented as much as 12° apart. Second, the area of interaction is clearly asymmetric relative to the position of the reference: probes presented within a broad range of positions left of the reference are attracted by it, but the tolerance range is much smaller for probes presented to the right.
Fig. 4. Perceived position of a probe presented at position ⫺1°, followed by a reference presented 80 ms later at a similar screen position (0°). The reference was parallel or orthogonal to the probe (red and green curves, respectively), and the probe could be vertical (A) or horizontal (B; see insets); for comparison, data for a probe presented alone are also reported (open squares). The horizontal lines report the positions of the probe (dotted line), the reference (dash-dot line), and the saccade target (dashed line). Top row, data from 1 subject; bottom row, data pooled across the 4 tested subjects (total number of trials: 1,020).
J Neurophysiol • doi:10.1152/jn.00478.2012 • www.jn.org
TRANSIENT SPATIOTOPIC INTEGRATION
Fig. 5. Perceived position of a probe at position ⫺1°, followed with a 80-ms SOA by a reference at similar horizontal position (0°) but displaced vertically by a variable amount. A: time courses of perceived probe position (medians in time bins of variable width) for a stimulus followed by a reference bar with 0 or 12° vertical offset relative to the probe. B: median perceived probe position in the perisaccadic bin (probes presented between ⫺20 and 0 ms, indicated by the shaded area in A) and plotted as a function of the vertical offset between the probe and the reference. The vertical dotted line marks the 6° offset; for larger offsets, a vertical gap separates the 2 bars. In all panels, the horizontal lines report the positions of the probe (dotted line), the reference (dash-dot line), and the saccade target (dashed line). Top row, data from 1 subject; bottom row, data pooled across the 4 tested subjects (total number of trials: 1,400).
Experiment 6: variable reference position. To characterize further the area of probe-reference interaction, we measured the perceived location of a probe at position ⫺1°, presented alone or with a reference at variable positions. This strategy was designed to characterize the range of probe-reference interaction across space and time. Figure 7A shows probe localization as a function of time of presentation for three positions of reference bars presented 80 ms after the probe. In the critical interval ⫺20 to 0 ms from saccade onset, the perceived probe localization clearly depended on the position of the reference bar: the probe was similarly attracted toward a reference at 0° (close to the physical position of the probe), at 5° (to the left of saccadic target), or at 15° (to the right of saccadic target).
Fig. 6. Perceived position of a probe presented between ⫺20 and 0 ms at various positions, either alone (gray) or followed with an 80-ms SOA by a reference at 0° (black). Symbols report median perceived positions for each probe position; error bars are SE calculated by bootstrap. Veridical probe localization would result in symbols distributed along the equality line. The horizontal lines report the positions of the reference (dash-dot line) and the saccade target (dashed line). Left, data from 1 subject; right, data pooled across the 4 tested subjects (total number of trials: 1,000).
1121
Fig. 7. Perceived position of a probe presented at position ⫺1° accompanied by references presented 80 ms before or after at various spatial positions. A: perceived probe position as a function of time for probes presented alone (open squares) or followed by a reference at 3 sample positions (color coded, reference position is marked by the horizontal dash-dot lines). B: trials for probe presentations between ⫺20 and 0 ms. Perceived position is plotted as a function of the position of the reference, which preceded or followed the probe presentation by 80 ms (different colors). Perisaccadic probe apparent position in the absence of any reference stimulus is also reported (open squares). In both A and B, the black horizontal lines report the positions of the probe (dotted line) and the saccade target (dashed line). Left, data from 1 subject; right, data pooled across the 3 tested subjects (total number of trials: 2,500).
Figure 7B reports the median perceived position of probes presented ⫺20 to 0 ms before the saccade as a function of horizontal position of the reference bars. The blue curves refer to the usual condition where the reference follows the probe by 80 ms, and the purple curves to a condition where the reference preceded the probe by 80 ms. If the probe were localized independently of the reference, all points should lie on a flat line around saccade target position (10°, open squares). This occurred for reference presented left of ⫺5° or right of ⫹15°. However, for reference positions between ⫺5° and ⫹15°, the probe was perceived near the reference, on the equality line. This range is clearly asymmetric relative to probe position, heavily biased in the direction of the saccade. Consistent with the data of Fig. 6, the interaction is stronger for reference presented on the right of the perisaccadic probe. Note that for all trials the reference was always localized veridically, as expected for stimuli presented 60 –100 ms away from saccadic onset. The results are similar when the reference bar preceded or followed the probe (blue and purple symbols in Fig. 7B), despite the large differences in the retinal positions of the stimuli. When the reference is presented 80 ms after the probe (after completion of the eye movement), the retinal image is displaced by 20°. Nevertheless, the interaction area remains similar. This implies that the interaction between probe and reference bars is limited by their relative distance on the
J Neurophysiol • doi:10.1152/jn.00478.2012 • www.jn.org
1122
TRANSIENT SPATIOTOPIC INTEGRATION
Spatiotemporal Interaction Field
Fig. 8. Perceived position of a perisaccadic probe presented at position ⫺1° and of the reference presented at 0°; the probe was always presented between ⫺20 and 0 ms. Results are plotted as a function of the time of presentation of the reference stimulus. The black horizontal lines report the positions of: the probe (dotted line), the reference (dash-dot line), and the saccade target (dashed line). Top, data from 1 subject; bottom, data pooled across the 4 tested subjects (total number of trials: 860).
screen, not on the retina. Note that all observations concern stimuli presented to the stationary retinas (with the probe presented between 20 and 0 ms before the saccade onset, and the reference presented before the probe or after the completion of the saccade). Temporal Extent of Probe-Reference Interaction Experiment 7: variable probe-reference interval. Experiment 7 investigated the temporal extent of the probe-reference interaction by varying the temporal separation between the stimuli. The probe and reference were presented at positions ⫺1° and 0°, respectively. Only trials where the probe was presented between ⫺20 and 0 ms before saccade onset were included. The temporal axis is also a close approximation of the separation between probe and reference, given the close proximity of the probe presentation to saccadic onset. Figure 8 plots the perceived positions of both the probe (filled circles) and the reference (open circles) as a function of time of the reference from the saccade onset. For references presented long before or after the saccade (more than 100 ms), corresponding to large probe-reference separations, there is no interaction, the probe is seen near saccadic target (as it is when presented alone), and the reference is seen at its veridical position. When the reference is close to the saccade onset, the two bars are both mislocalized and seen at similar positions. Between these extremes, there is a range of about ⫾50 ms when the reference is localized veridically and the probe is seen close to the reference, hence close to its physical location. The overall pattern of perceived probe location has a peculiar saddle shape, because the probe and the reference are drawn toward saccadic target when presented within 50 ms of saccade onset.
In our final set of analyses, we examined jointly the spatiotemporal limits of the probe-reference interaction by pooling data from all subjects. In all cases, the probe was presented at ⫺1° and between ⫺20 and 0 ms from saccade onset. To quantify the effect, we defined a “probe-reference interaction index”: the probability that probe and reference were colocalized within a preset threshold distance. Considering that the standard deviation of the perceived probe distribution was about 2.5° (see Fig. 2), we set the threshold distance to 2.5° (we also verified that the choice of threshold was not crucial for the results). Figure 2 reports its value for each subject under the conditions of experiment 1 (probe at ⫺1°, reference at 0°, 80 ms after probe); across subjects, the average interaction index was 0.77 ⫾ 0.09. We computed the interaction index for all conditions and subjects, color-coded in Fig. 9 with red shades indicating ⬎0.5 probability that the two stimuli were perceived at a distance less than the 2.5° threshold. In all cases, values are plotted as a function of the horizontal position and time of the reference, with the probe fixed at ⫺1° in screen space (white open square). The map was constructed by binning trials into 20ms ⫻ 5° bins and interpolating linearly the missing data points (open circles showing the tested spatiotemporal combinations; data were pooled across subjects, and the size of the circle is proportional to trial number). Spatial locations are expressed in either screen coordinates (Fig. 9A) or retinotopic coordinates (Fig. 9B). In screen coordinates (Fig. 9A), the plot shows maximal interaction over a spatial region about as large as saccadic amplitude. The spatial extension is asymmetric with respect to probe position, far greater in the direction of the saccade. In time, the region extends over more than 100 ms before and after the saccadic onset. Figure 9B plots the same data after transforming positions in retinal coordinates. Whereas in screen coordinates the field elongation is parallel to the time
Fig. 9. Spatiotemporal map of interactions between a perisaccadic probe presented between ⫺20 and 0 ms at screen position ⫺1° (white open square, P) and a reference (variable position and time). The abscissa shows the time of the reference bar (as in Fig. 8), and the ordinate shows the horizontal position of the reference bar, in both screen coordinates (A) and retinal coordinates (B). The gray and black lines show the position of the fovea and the saccade target, respectively. Small circles mark the spatiotemporal coordinates of the reference that were tested; the diameter of the circle is proportional to the number of trials collected per each reference spatiotemporal location (total number of trials: 2,900, collected from 5 subjects). The interaction indexes at these coordinates were interpolated and smoothed to generate the map.
J Neurophysiol • doi:10.1152/jn.00478.2012 • www.jn.org
TRANSIENT SPATIOTOPIC INTEGRATION
axis, in retinal space the orientation in space-time is parallel to the trajectory of the saccade. DISCUSSION
This study shows that the normal pattern of mislocalization of stimuli briefly flashed near the onset of saccades (Kaiser and Lappe 2004; Morrone et al. 1997; Ross et al. 1997) is dramatically altered when the perisaccadic stimulus is preceded or followed by a similar flashed bar. Within a very broad acceptance range, spanning some 20° of horizontal space and about 200 ms of time, the two stimuli are seen together in the same position, with the perisaccadic bar displaced toward the reference, rather than toward the saccadic target. However, not all stimuli interact: bars of distinctly different orientation, or displaced orthogonally to saccade direction, have little or no effect on the probe. That the interaction between transsaccadic images occurs only for similarly shaped stimuli implies the action of mechanisms that merge images that are perceptually congruent. This is consistent with recent work of C. Colby and J. Subramanian (personal communication) showing that visual cells that transiently remap their receptive field location at the time of saccades preserve their shape selectivity. That bars of different polarity can interact with each other is interesting and possibly relates to the combination of basic features. Few previous studies have investigated perisaccadic localization with sequences of stimuli. Our results are consistent with reports of reduced localization errors when a perisaccadic flash was preceded by a similarly shaped stimulus at a similar position, either flashed (Park et al. 2003; Zhang et al. 2008) or prolonged and flickering (Sogo and Osaka 2001; Watanabe et al. 2005), and of the relative independence between distinct stimuli, such as different shapes (Brenner et al. 2005) presented for different exposure times (Hamker et al. 2008) or displaced orthogonally to the saccade (Morrone et al. 1997; Sogo and Osaka 2002). Researchers going back to Helmholtz (1866) and Sherrington (1918) have assumed that extraretinal eye-position signals (either efferent or afferent) compensate for the image displacement that saccades cause (Sperry 1950; von Holst and Mittelstaedt 1950). However, several authors (e.g., Bridgeman et al. 1975; Deubel et al. 1996; Irwin et al. 1994) have pointed out that “cancellation” theories cannot explain the subjective impression of stability across saccades, since any small mismatch between the extraretinal signal and the actual eye movement would result in an apparent displacement of visual images. The interaction field of Fig. 9 calculated from our results suggests that both retinal and extraretinal factors combine to mediate visual stability. When plotted in retinotopic coordinates (Fig. 9B), the field is oriented in space-time in the direction of the saccade-induced retinal displacement, suggesting the action of extraretinal signals. However, the interaction field is broad as well as slanted, implying a wide tolerance for spatial mismatch of pre- and postsaccadic images. The slant sets the “roadmap” to search for pre- and postsaccadic matches, but this is only a loose constraint: visual mechanisms must also come into play to ensure a smooth fusion of plausible targets. What may be the physiological substrate behind the interaction field of Fig. 9? We believe that this interaction field
1123
represents the action of “remapping” cells reported in lateral intraparietal area (LIP) and elsewhere (Duhamel et al. 1992; Wurtz 2008). Before each saccade, the receptive fields of these cells shift in the direction of the saccade, so they respond to stimuli in the spatial location that will make up their receptive field in the new fixation (often called the “future receptive field”). At some time after the saccade is completed, the receptive field reverts to its previous retinal location. Although it has never been directly measured, we have argued that this second shift is crucial, creating transient craniotopy (Burr and Morrone 2011), and the transient craniotopy, created as the cell returns to its resting state, can be described as a spatiotemporal receptive field, oriented in space-time. The form of this theoretic receptive field is very similar to our measured interaction field (Fig. 9B). Although the mechanism we envisage is consistent with the action of remapping cells, it is important to understand that it is not the initial “predictive remapping” that achieves the stability: this merely sets the stage for the receptive field to return to its rest position, and it is the return that achieves stability. The initial shift can be considered a “virtual saccade,” before the actual eye movement, at a time when the regular retinotopic cells, which always coexist with predictive remapping cells (Duhamel et al. 1992; Nakamura and Colby 2002), still respond to a spatially stable visual region. The strategy is to anticipate the problem by shifting the receptive field of detectors in the direction of the saccade, thereby arming the receptive field to return to its resting position, as if loading a spring. The return in position that accompanies the eye movement causes the receptive field to become oriented in spacetime, parallel to the spurious retinal motion induced by the saccade, and therefore effectively annulling it. The field of Fig. 9 is a measure of the attraction power of the perisaccadic probe toward the reference. Perceiving two distinct stimuli as separate entities is a classic way to infer the resolution of the neural receptive field, commonly used in touch and in vision. Although we have no means of distinguishing whether the interaction field of Fig. 9 reflects the action of single neurons with receptive fields of that form, or a more complex multistage process, it is instructive to consider what would be the consequences of neurons with these types of receptive fields. We therefore hypothesize that perisaccadically the neuronal population mediating spatial localization assumes transiently a spatiotemporal form of receptive field described by the interaction field of Fig. 9. We illustrate the problem first in terms of population responses and later in terms of system analysis. A stimulus straddling the saccade (continuous trace in Fig. 10, A–C) will excite populations of neurons with receptive fields like those of Fig. 9 centered at all positions, at saccadic onset. The response of these neurons as a function of position of their receptive fields is illustrated in Fig. 10D. In this case the maximum response is given by the neuron whose receptive field is located in the position depicted in Fig. 10A: importantly, there is only one maximum for the entire population. In a winner-take-all model, the population response signals the presence of one single target. However, the response of a pool of detectors with small and spatiotemporally separable receptive fields (like Fig. 10B) generates two maxima, at the pre- and postsaccadic retinotopic stimulus positions (Fig. 10, B and E), incorrectly signaling two stimuli at distinct locations. Broadening these receptive fields will eventually result in a single
J Neurophysiol • doi:10.1152/jn.00478.2012 • www.jn.org
1124
TRANSIENT SPATIOTOPIC INTEGRATION
Fig. 10. Response of a population of visual detectors with receptive field slanted in space-time (A) and with classic receptive fields of 2 sizes (B and C) to a steady visual stimulus illustrated by the thick black lines in A–C. The response profiles in D–F were calculated from the integral of the product of the stimulus with the receptive field at various spatial positions. Note that only for the slanted receptive field population was there a single peak in the response, signaling a single object. RF, receptive field; au, arbitrary units.
maximum, but with unacceptably large spatial variance, much larger than that of Fig. 10D. These arguments can be expressed mathematically considering a time-varying nonlinear system that evolves from space-time separable kernels long before the saccade to become a kernel oriented along the saccadic trajectory at saccadic onset. The system can be approximated to a linear system at saccadic onset by using a linear kernel of the shape given by Fig. 10A. Only at that time, the response of the system can be derived by convolving the kernel with the stimulus along space. Figure 10, D–F, shows the output of the spatial convolution for the three different kernels at time zero. Although the experiments of this study were conducted with briefly flashed bars (rare in nature), our simple simulation illustrates how our conclusions could generalize to the more ecological problem of stable space perception for continuously visible stimuli. The experimentally deduced interaction field provides a mechanism for transient craniotopicity across saccades, without requiring an exact match between the shape of the filter and the trajectory of saccade-induced retinal displacement. Although our model is presented here in a qualitative manner, it is amenable to a more quantitative implementation, currently under development (Cicchini and Morrone 2012). The concept of transiently oriented space-time receptive fields, which implement a combination of extraretinal signals and visual tolerance for displacements, may provide a unifying framework for diverse phenomena that accompany saccades. Many documented perceptual phenomena are consistent with this mechanism. For example, the broad extension of the
interaction field is consistent with the large spatial and temporal uncertainty of perisaccadic perception (Binda et al. 2007, 2009; Maij et al. 2009) associated with a compression of stimuli toward the saccade target (Kaiser and Lappe 2004; Morrone et al. 1997; Ross et al. 1997). In the absence of plausible post- or presaccadic reference stimuli, the saccadic target itself may serve as an “attractor,” determining the perceived position of perisaccadic probes. Much of our data support this idea: when both probe and references are shown in the perisaccadic intervals, they are both mislocalized toward the saccadic target (e.g., Fig. 8). This suggests that the saccade target and the pre- or postsaccadic reference stimulus were both potential attractors. The constant presence of a saccade target in our experiments may have interfered with the probereference interaction, leading to an underestimate of the strength of the attraction of the reference. Within this framework, one would also predict that the absence of any pre- and postsaccadic spatial references should affect the pattern of perisaccadic mislocalization, as observed for memory-guided saccades (Lappe et al. 2000). Finally, an expansion of integration times, as implied by the broad temporal extension of the spatiotemporal interaction fields, is consistent both with a compression of perceived duration (Morrone et al. 2005) and with the perceptual delays observed for perisaccadic visual stimuli (Binda et al. 2009). The phenomenon of “saccadic suppression of image displacement” (the failure to notice displacements during a saccade: Bridgeman et al. 1975; Deubel et al. 1996) is also broadly consistent with our results and model. The broadness of the perisaccadic receptive field allows for increased spatial tolerance, so relatively large displacements go unnoticed, integrated within the receptive field. It is also consistent with reduced suppression of displacement with postsaccadic blanking (Deubel et al. 1996), causing a delayed postsaccadic stimulation, which will fall outside the temporal limits of the interaction field. On the basis of the suppression-of-displacement data, Deubel (1998) advanced the “reference object theory of visual stability,” which argues that the first object acquired after the saccade serves as an anchor point for the localization of the visual scene (Deubel et al. 2010) so that stability does not need to rely on precise eye-position information (Deubel 2004; Deubel et al. 2002). This idea is broadly consistent with our own conclusions. However, there are some differences that merit highlighting. First, our data show that reference stimuli presented either before or after the saccade affect equally the mislocalization of a perisaccadic probe, inconsistent with the dominant role attributed to postsaccadic information in the reference object theory (Koch and Deubel 2007). Our results show that the interaction of transient perisaccadic stimuli is limited by their proximity in external space (rather than by their retinal proximity), implying the action of an extraretinal signal, not central to the reference object theory. Nevertheless, the two concepts share much in common. To conclude, our results suggest a link between three wellestablished phenomena accompanying saccades: perisaccadic mislocalization of flashed stimuli, transsaccadic perceptual stability, and the neurophysiological phenomenon of remapping receptive fields. We find that the perceived position of perisaccadic flashes is strongly affected by the location of other flashed stimuli across a region slanted in retinotopic space-
J Neurophysiol • doi:10.1152/jn.00478.2012 • www.jn.org
TRANSIENT SPATIOTOPIC INTEGRATION
time. We show that visual detectors with receptive fields defined by this window of spatial interaction can implement a transiently craniotopic visual mechanism. We discuss how the spatiotemporal profile of these receptive fields fits well with the known properties of remapping visual cells, helping to interpret the functional role of this phenomenon in relation to perisaccadic and transsaccadic visual perception. GRANTS This research was supported by the European Union “Space, Time and Number in the Brain” Program FP7-ERC, Marie Curie International Outgoing Fellowship “Attention Warps Early Sensory Maps,” and the Italian Ministry of University and Research. DISCLOSURES No conflicts of interest, financial or otherwise, are declared by the authors. AUTHOR CONTRIBUTIONS G.M.C., P.B., D.C.B., and M.C.M. conception and design of research; G.M.C. and P.B. performed experiments; G.M.C. analyzed data; G.M.C., P.B., D.C.B., and M.C.M. interpreted results of experiments; G.M.C., P.B., D.C.B., and M.C.M. prepared figures; G.M.C., P.B., D.C.B., and M.C.M. drafted manuscript; G.M.C., P.B., D.C.B., and M.C.M. edited and revised manuscript; G.M.C., P.B., D.C.B., and M.C.M. approved final version of manuscript. REFERENCES Binda P, Bruno A, Burr DC, Morrone MC. Fusion of visual and auditory stimuli during saccades: a Bayesian explanation for perisaccadic distortions. J Neurosci 27: 8525– 8532, 2007. Binda P, Cicchini GM, Burr DC, Morrone MC. Spatiotemporal distortions of visual perception at the time of saccades. J Neurosci 29: 13147–13157, 2009. ¨ berlegungen zur RichtungswahBischof N, Kramer E. Untersuchungen und U rnehmung bei wilkuerlichen sakkadischen Augenbewegungen. Psychol Forsch 185–218, 1968. Brenner E, Meijer WJ, Cornelissen FW. Judging relative positions across saccades. Vision Res 45: 1587–1602, 2005. Bridgeman B, Hendry D, Stark L. Failure to detect displacement of visual world during saccadic eye movements. Vision Res 719 –722, 1975. Burr DC, Morrone MC. Spatiotopic coding and remapping in humans. Philos Trans R Soc Lond B Biol Sci 366: 504 –515, 2011. Burr DC, Morrone MC. Vision: keeping the world still when the eyes move. Curr Biol 20: R442– 444, 2010. Burr DC, Morrone MC, Ross J. Selective suppression of the magnocellular visual pathway during saccadic eye movements. Nature 371: 511–513, 1994. Cavanagh P, Hunt AR, Afraz A, Rolfs M. Visual stability based on remapping of attention pointers. Trends Cogn Sci 14: 147–153, 2010. Cicchini G, Morrone M. Perisaccadic broadening of receptive fields predicts compression of space and time. In: 35th European Conference in Visual Perception. Alghero, Italy: Perception, 2012. Deubel H. Localization of targets across saccades: role of landmark objects. Vis Cogn 11: 173–202, 2004. Deubel H, Bridgeman B, Schneider WX. Immediate post-saccadic information mediates space constancy. Vision Res 38: 3147–3159, 1998. Deubel H, Koch C, Bridgeman B. Landmarks facilitate visual space constancy across saccades and during fixation. Vision Res 50: 249 –259, 2010. Deubel H, Schneider WX, Bridgeman B. Postsaccadic target blanking prevents saccadic suppression of image displacement. Vision Res 36: 985– 996, 1996. Deubel H, Schneider WX, Bridgeman B. Transsaccadic memory of position and form. Prog Brain Res 140: 165–180, 2002.
1125
Duhamel JR, Colby CL, Goldberg ME. The updating of the representation of visual space in parietal cortex by intended eye movements. Science 255: 90 –92, 1992. Efron B, Tibshirani R. An introduction to bootstrap. New York: Chapman and Hall, 1993. Hamker FH, Zirnsak M, Lappe M. About the influence of post-saccadic mechanisms for visual stability on peri-saccadic compression of object location. J Vis 8: 1 1–13, 2008. Helmholtz Hv. Handbuch der Physiologischen Optik. Leipzig, Germany: Voss, 1866. Honda H. Perceptual localization of visual stimuli flashed during saccades. Percept Psychophys 45: 162–174, 1989. Irwin DE, Mcconkie GW, Carlsonradvansky LA, Currie C. A localist evaluation solution for visual-stability across saccades. Behav Brain Sci 17: 265–266, 1994. Kaiser M, Lappe M. Perisaccadic mislocalization orthogonal to saccade direction. Neuron 41: 293–300, 2004. Koch C, Deubel H. How postsaccadic visual structure affects the detection of intrasaccadic target displacements. In: Eye Movements: A Window on Mind and Brain,edited by Van Gompel RP, Fischer MF, Murray WS, and Hill RL. Oxford: Elsevier, 2007, p. 193–212. Lappe M, Awater H, Krekelberg B. Postsaccadic visual references generate presaccadic compression of space. Nature 403: 892– 895, 2000. Maij F, Brenner E, Smeets JB. Temporal information can influence spatial localization. J Neurophysiol 102: 490 – 495, 2009. Matin L, Pearce DG. Visual perception of direction for stimuli flashed during voluntary saccadic eye movements. Science 148: 1485–1488, 1965. Medendorp WP, Goltz HC, Vilis T, Crawford JD. Gaze-centered updating of visual space in human parietal cortex. J Neurosci 23: 6209 – 6214, 2003. Melcher D. Predictive remapping of visual features precedes saccadic eye movements. Nat Neurosci 10: 903–907, 2007. Melcher D, Colby CL. Trans-saccadic perception. Trends Cogn Sci 12: 466 – 473, 2008. Merriam EP, Genovese CR, Colby CL. Remapping in human visual cortex. J Neurophysiol 97: 1738 –1755, 2007. Merriam EP, Genovese CR, Colby CL. Spatial updating in human parietal cortex. Neuron 39: 361–373, 2003. Morrone MC, Ross J, Burr D. Saccadic eye movements cause compression of time as well as space. Nat Neurosci 8: 950 –954, 2005. Morrone MC, Ross J, Burr DC. Apparent position of visual targets during real and simulated saccadic eye movements. J Neurosci 17: 7941–7953, 1997. Nakamura K, Colby CL. Updating of the visual representation in monkey striate and extrastriate cortex during saccades. Proc Natl Acad Sci USA 99: 4026 – 4031, 2002. Park J, Schlag-Rey M, Schlag J. Spatial localization precedes temporal determination in visual perception. Vision Res 43: 1667–1674, 2003. Ross J, Morrone MC, Burr DC. Compression of visual space before saccades. Nature 386: 598 – 601, 1997. Schlag J, Schlag-Rey M. Illusory localization of stimuli flashed in the dark before saccades. Vision Res 35: 2347–2357, 1995. Sherrington CS. Observations of the sensual role of the proprioceptive nerve supply of the extrinsic eye muscles. Brain 332–343, 1918. Sogo H, Osaka N. Effects of inter-stimulus interval on perceived locations of successively flashed perisaccadic stimuli. Vision Res 42: 899 –908, 2002. Sogo H, Osaka N. Perception of relation of stimuli locations successively flashed before saccade. Vision Res 41: 935–942, 2001. Sperry RW. Neural basis of the spontaneous optokinetic response produced by visual inversion. J Comp Physiol Psychol 482– 489, 1950. Volkmann FC. Human visual suppression. Vision Res 26: 1401–1416, 1986. von Holst E, Mittelstaedt H. Das Reafferenzprinzip (Wechselwirkung zwischen Zentralnervensystem und Peripherie). Naturwissenschaften 37: 464 – 476, 1950. Watanabe J, Noritake A, Maeda T, Tachi S, Nishida S. Perisaccadic perception of continuous flickers. Vision Res 45: 413– 430, 2005. Wurtz RH. Neuronal mechanisms of visual stability. Vision Res 48: 2070 – 2089, 2008. Zhang ZL, Cantor CR, Schor CM. Effects of luminance and saccadic suppression on perisaccadic spatial distortions. J Vis 8: 22 21–18, 2008.
J Neurophysiol • doi:10.1152/jn.00478.2012 • www.jn.org